Attached files
| file | filename |
|---|---|
| EX-99.2 - EX-99.2 - STONE ENERGY CORP | d243431dex992.htm |
| 8-K - 8-K - STONE ENERGY CORP | d243431d8k.htm |
| Exhibit 99.1
|
PRELIMINARY DRAFT SUBJECT TO REVISION
SUBJECT TO FRE408 AND CONFIDENTIALITY AGREEMENT
8 A U G U S T 2 0 1 6
D I S C U S S I O N M A T E R I A L S
Project Edison
1
|
|
PRELIMINARY DRAFT SUBJECT TO REVISION
SUBJECT TO FRE408 AND CONFIDENTIALITY AGREEMENT
C O N F I D E N T I A L P R O J E C T E D I S O N
Disclaimer
None of Stone Energy Corporation (“Stone” or the “Company”), Lazard and Alvarez & Marsal Holdings, LLC (“A&M”), and each of their subsidiaries, affiliates, officers, directors, shareholders, employees, consultants, advisors, agents and representatives of the foregoing (collectively, “Representatives”), make any representation or warranty, express or implied at law or in equity, in connection with any of the information made available either herein or subsequent to this document, including, but not limited to, the past, present, or future value of the anticipated cash flows, income, costs, expenses, liabilities and profits, if any, of the Company. Accordingly, any person, company or interested party will rely solely upon its own independent examination and assessment of the information in making any decision in connection with a proposed restructuring of the Company’s balance sheet (a “Transaction”) and in no event shall any recipient party make any claim against Stone, Lazard, A&M or any of their respective Representatives in respect of, or based upon, the information contained either herein or subsequent to this document.
None of Stone, Lazard or A&M, nor any of their respective Representatives, shall have any liability to any recipient party or its respective Representatives as a result of receiving and/or evaluating any information concerning the Transaction (including, but not limited to, this presentation (“Presentation”)). Information in this Presentation is dependent upon assumptions with respect to commodity prices, production, development capital, exploration capital, operating expenses, availability and cost of adequate capital and performance as set forth in this Presentation.
The information herein has been prepared by Lazard based upon information supplied by Stone Energy Corporation (“Stone” or the “Company”) or publicly available information, and portions of the information herein may be based upon certain statements, estimates and forecasts provided by the Company with respect to the anticipated future performance of the Company. Lazard has relied upon the accuracy and completeness of the foregoing information, and has not assumed any responsibility for any independent verification of such information or any independent valuation or appraisal of any of the assets or liabilities of the Company, or any other entity, or concerning solvency or fair value of the Company or any other entity. With respect to financial forecasts, Lazard has assumed that they have been reasonably prepared in good faith on bases reflecting the best currently available estimates and judgments of management of the Company as to the future financial performance of the Company. Lazard assumes no responsibility for and expresses no view as to such forecasts or the assumptions on which they are based. The information set forth herein is based upon economic, monetary, market and other conditions as in effect on, and the information made available to Lazard as of, the date hereof, unless indicated otherwise. These materials and the information contained herein are confidential and may not be disclosed publicly or made available to third parties without the prior written consent of Lazard and the Company; provided, however, that you may disclose to any and all persons the U.S. federal income tax treatment and tax structure of the transaction described herein and the portions of these materials that relate to such tax treatment or structure.
Certain statements in this Presentation are forward-looking and are based upon the Company’s current belief as to the outcome and timing of future events. All statements, other than statements of historical facts, that address activities that Stone plans, expects, believes, projects, estimates or anticipates will, should or may occur in the future, including anticipated cash flows, income, costs, liabilities, profits, future production of oil and gas, future capital expenditures and drilling of wells and future financial or operating results are forward-looking statements. All forward-looking numbers are approximate. Important factors that could cause actual results to differ materially from those in the forward-looking statements herein include the timing and extent of changes in commodity prices for oil and gas, operating risks, liquidity risks (including risks related to our bank credit facility, our outstanding notes and the restructuring thereof and our ability to continue as a going concern), any potential Chapter 11 bankruptcy proceeding, political and regulatory developments and legislation, including developments and legislation relating to our operations in the Gulf of Mexico and Appalachia, and other risk factors and known trends and uncertainties as described in Stone’s Annual Report on Form 10-K for the year ended December 31, 2015 (“2015 Form 10-K”) and Stone’s Quarterly Reports on Form 10-Q for the three months ended March 31, 2016 and June 30, 2016, and Stone’s Current Reports on Form 8-K, each as filed with the Securities and Exchange Commission (the “SEC”). Should one or more of these risks or uncertainties occur, or should underlying assumptions prove incorrect, Stone’s actual results and plans could differ materially from those expressed in the forward-looking statements. Estimates for Stone’s future production volumes and reserves are based on assumptions of capital expenditure levels and the assumption that market demand and prices for oil and gas will continue at levels that allow for economic production of these products. The production, transportation and marketing of oil and gas are subject to disruption due to transportation and processing availability, mechanical failure, human error, hurricanes and numerous other factors. Stone’s estimates are based on certain other assumptions, such as well performance, which may vary significantly from those assumed. The recipient hereby acknowledges that none of Stone, Lazard, A&M or any of their Representatives has an obligation to update any such projections or forecasts.
2
|
|
PRELIMINARY DRAFT SUBJECT TO REVISION
SUBJECT TO FRE408 AND CONFIDENTIALITY AGREEMENT
P R O J E C T E D I S O N
Recapitalization Proposal – Summary of Key Terms
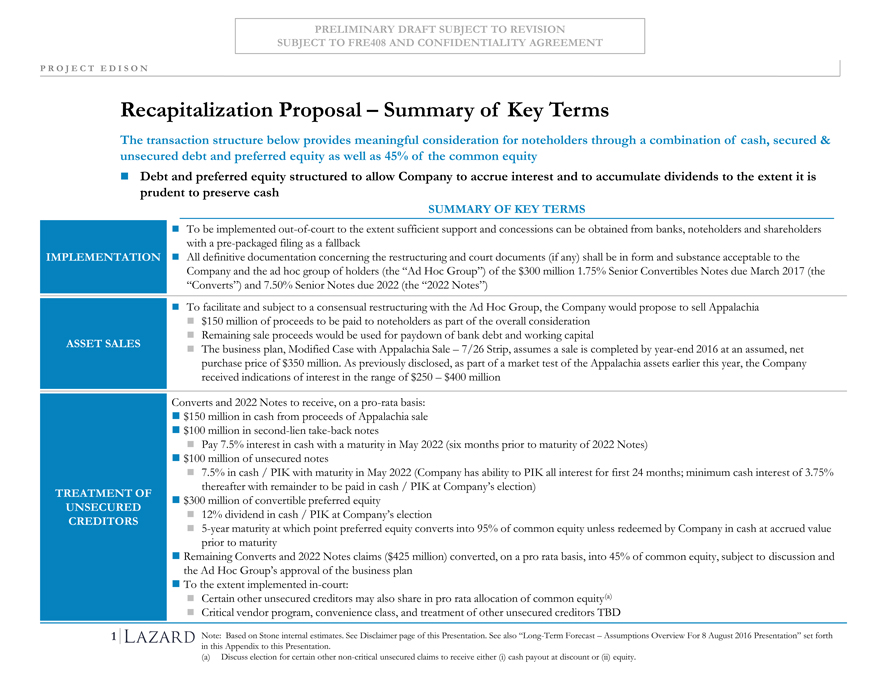
The transaction structure below provides meaningful consideration for noteholders through a combination of cash, secured & unsecured debt and preferred equity as well as 45% of the common equity Debt and preferred equity structured to allow Company to accrue interest and to accumulate dividends to the extent it is prudent to preserve cash
IMPLEMENTATION
ASSET SALES
TREATMENT OF UNSECURED
CREDITORS
SUMMARY OF KEY TERMS
To be implemented out-of-court to the extent sufficient support and concessions can be obtained from banks, noteholders and shareholders with a pre-packaged filing as a fallback All definitive documentation concerning the restructuring and court documents (if any) shall be in form and substance acceptable to the Company and the ad hoc group of holders (the “Ad Hoc Group”) of the $300 million 1.75% Senior Convertibles Notes due March 2017 (the “Converts”) and 7.50% Senior Notes due 2022 (the “2022 Notes”)
To facilitate and subject to a consensual restructuring with the Ad Hoc Group, the Company would propose to sell Appalachia $150 million of proceeds to be paid to noteholders as part of the overall consideration Remaining sale proceeds would be used for paydown of bank debt and working capital
The business plan, Modified Case with Appalachia Sale – 7/26 Strip, assumes a sale is completed by year-end 2016 at an assumed, net purchase price of $350 million. As previously disclosed, as part of a market test of the Appalachia assets earlier this year, the Company received indications of interest in the range of $250 – $400 million
Converts and 2022 Notes to receive, on a pro-rata basis: $150 million in cash from proceeds of Appalachia sale $100 million in second-lien take-back notes
Pay 7.5% interest in cash with a maturity in May 2022 (six months prior to maturity of 2022 Notes) $100 million of unsecured notes
7.5% in cash / PIK with maturity in May 2022 (Company has ability to PIK all interest for first 24 months; minimum cash interest of 3.75% thereafter with remainder to be paid in cash / PIK at Company’s election) $300 million of convertible preferred equity
12% dividend in cash / PIK at Company’s election
5-year maturity at which point preferred equity converts into 95% of common equity unless redeemed by Company in cash at accrued value prior to maturity Remaining Converts and 2022 Notes claims ($425 million) converted, on a pro rata basis, into 45% of common equity, subject to discussion and the Ad Hoc Group’s approval of the business plan
To the extent implemented in-court:
Certain other unsecured creditors may also share in pro rata allocation of common equity(a) Critical vendor program, convenience class, and treatment of other unsecured creditors TBD
Note: Based on Stone internal estimates. See Disclaimer page of this Presentation. See also “Long-Term Forecast – Assumptions Overview For 8 August 2016 Presentation” set forth in this Appendix to this Presentation.
(a) Discuss election for certain other non-critical unsecured claims to receive either (i) cash payout at discount or (ii) equity.
3
|
|
PRELIMINARY DRAFT SUBJECT TO REVISION
SUBJECT TO FRE408 AND CONFIDENTIALITY AGREEMENT
P R O J E C T E D I S O N
Recapitalization Proposal – Summary of Key Terms (cont’d)
SUMMARY OF KEY TERMS
TREATMENT OF REVOLVING
LENDERS
TREATMENT OF EXISTING SHAREHOLDERS
OTHER
SUMMARY OF KEY TERMS
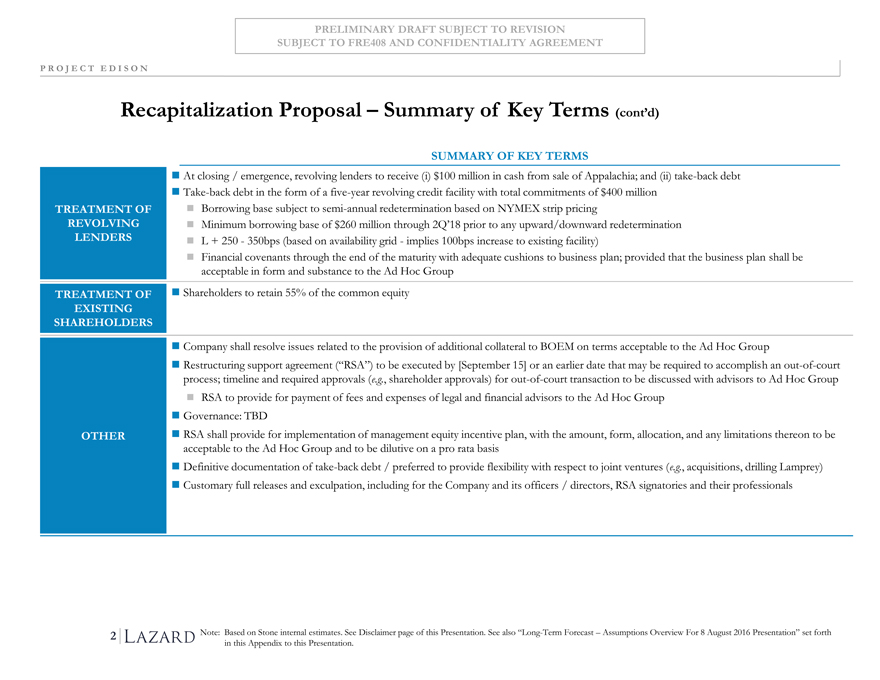
At closing / emergence, revolving lenders to receive (i) $100 million in cash from sale of Appalachia; and (ii) take-back debt Take-back debt in the form of a five-year revolving credit facility with total commitments of $400 million Borrowing base subject to semi-annual redetermination based on NYMEX strip pricing
Minimum borrowing base of $260 million through 2Q’18 prior to any upward/downward redetermination
L + 250—350bps (based on availability grid—implies 100bps increase to existing facility)
Financial covenants through the end of the maturity with adequate cushions to business plan; provided that the business plan shall be acceptable in form and substance to the Ad Hoc Group Shareholders to retain 55% of the common equity Company shall resolve issues related to the provision of additional collateral to BOEM on terms acceptable to the Ad Hoc Group
Restructuring support agreement (“RSA”) to be executed by [September 15] or an earlier date that may be required to accomplish an out-of-court process; timeline and required approvals (e.g., shareholder approvals) for out-of-court transaction to be discussed with advisors to Ad Hoc Group RSA to provide for payment of fees and expenses of legal and financial advisors to the Ad Hoc Group Governance: TBD
RSA shall provide for implementation of management equity incentive plan, with the amount, form, allocation, and any limitations thereon to be acceptable to the Ad Hoc Group and to be dilutive on a pro rata basis Definitive documentation of take-back debt / preferred to provide flexibility with respect to joint ventures (e.g., acquisitions, drilling Lamprey) Customary full releases and exculpation, including for the Company and its officers / directors, RSA signatories and their professionals
Note: Based on Stone internal estimates. See Disclaimer page of this Presentation. See also “Long-Term Forecast – Assumptions Overview For 8 August 2016 Presentation” set forth in this Appendix to this Presentation.
4
|
|
PRELIMINARY DRAFT SUBJECT TO REVISION
SUBJECT TO FRE408 AND CONFIDENTIALITY AGREEMENT
P R O J E C T E D I S O N
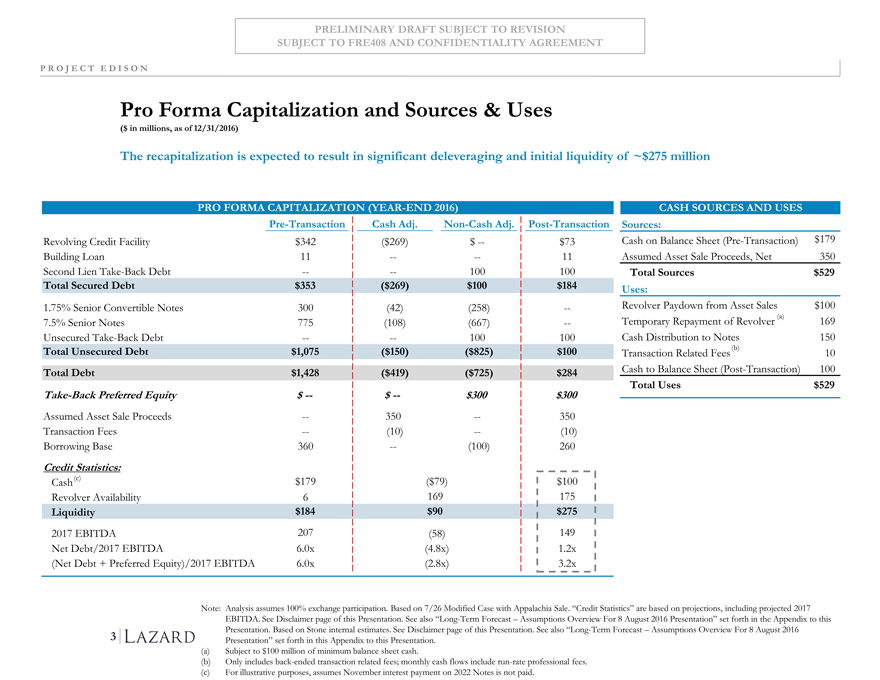
Pro Forma Capitalization and Sources & Uses
($ in millions, as of 12/31/2016)
The recapitalization is expected to result in significant deleveraging and initial liquidity of ~$275 million
PRO FORMA CAPITALIZATION (YEAR-END 2016)
Pre-TransactionCash Adj.Non-Cash Adj.Post-Transaction
Revolving Credit Facility$342 ($269)$ —$73
Building Loan11 ——11
Second Lien Take-Back Debt— —100100
Total Secured Debt$353 ($269)$100$184
1.75% Senior Convertible Notes300 (42)(258)—
7.5% Senior Notes775 (108)(667)—
Unsecured Take-Back Debt— —100100
Total Unsecured Debt$1,075 ($150)($825)$100
Total Debt$1,428 ($419)($725)$284
Take-Back Preferred Equity$ — $ —$300$300
Assumed Asset Sale Proceeds— 350—350
Transaction Fees— (10)—(10)
Borrowing Base360 —(100)260
Credit Statistics:
Cash (c)$179 ($79)$100
Revolver Availability6 169175
Liquidity$184 $90$275
2017 EBITDA207 (58)149
Net Debt/2017 EBITDA6.0x (4.8x)1.2x
(Net Debt + Preferred Equity)/2017 EBITDA6.0x (2.8x)3.2x
CASH SOURCES AND USES
Sources:
Cash on Balance Sheet (Pre-Transaction)$179
Assumed Asset Sale Proceeds, Net 350
Total Sources$529
Uses:
Revolver Paydown from Asset Sales$100
Temporary Repayment of Revolver (a) 169
Cash Distribution to Notes 150
Transaction Related Fees (b) 10
Cash to Balance Sheet (Post-Transaction) 100
Total Uses$529
Note: Analysis assumes 100% exchange participation. Based on 7/26 Modified Case with Appalachia Sale. “Credit Statistics” are based on projections, including projected 2017 EBITDA. See Disclaimer page of this Presentation. See also “Long-Term Forecast – Assumptions Overview For 8 August 2016 Presentation” set forth in the Appendix to this Presentation. Based on Stone internal estimates. See Disclaimer page of this Presentation. See also “Long-Term Forecast – Assumptions Overview For 8 August 2016 Presentation” set forth in this Appendix to this Presentation.
(a) Subject to $100 million of minimum balance sheet cash.
(b) Only includes back-ended transaction related fees; monthly cash flows include run-rate professional fees. (c) For illustrative purposes, assumes November interest payment on 2022 Notes is not paid.
5
|
|
PRELIMINARY DRAFT SUBJECT TO REVISION
SUBJECT TO FRE408 AND CONFIDENTIALITY AGREEMENT
P R O J E C T E D I S O N
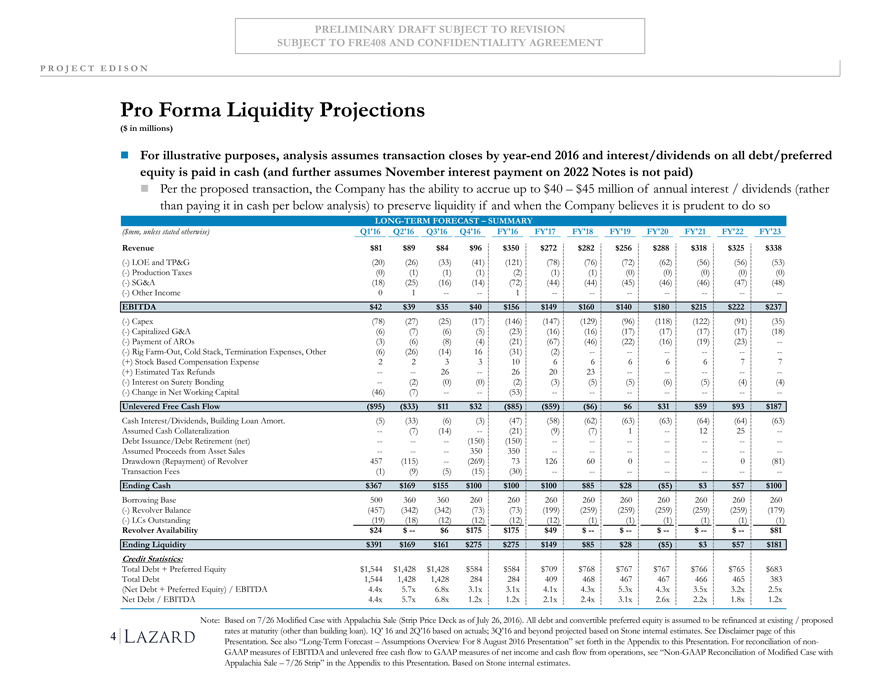
Pro Forma Liquidity Projections
($ in millions)
For illustrative purposes, analysis assumes transaction closes by year-end 2016 and interest/dividends on all debt/preferred equity is paid in cash (and further assumes November interest payment on 2022 Notes is not paid)
Per the proposed transaction, the Company has the ability to accrue up to $40 – $45 million of annual interest / dividends (rather than paying it in cash per below analysis) to preserve liquidity if and when the Company believes it is prudent to do so
LONG-TERM FORECAST – SUMMARY
($mm, unless stated otherwise) Q1’16 Q2’16Q3’16Q4’16FY’16FY’17FY’18FY’19FY’20FY’21FY’22FY’23
Revenue $81 $89$84$96$350$272$282$256$288$318$325$338
(-) LOE and TP&G (20) (26)(33)(41)(121)(78)(76)(72)(62)(56)(56)(53)
(-) Production Taxes (0) (1)(1)(1)(2)(1)(1)(0)(0)(0)(0)(0)
(-) SG&A (18) (25)(16)(14)(72)(44)(44)(45)(46)(46)(47)(48)
(-) Other Income 0 1——1———————
EBITDA $42 $39$35$40$156$149$160$140$180$215$222$237
(-) Capex (78) (27)(25)(17)(146)(147)(129)(96)(118)(122)(91)(35)
(-) Capitalized G&A (6) (7)(6)(5)(23)(16)(16)(17)(17)(17)(17)(18)
(-) Payment of AROs (3) (6)(8)(4)(21)(67)(46)(22)(16)(19)(23)—
(-) Rig Farm-Out, Cold Stack, Termination Expenses, Other (6) (26)(14)16(31)(2)——————
(+) Stock Based Compensation Expense 2 233106666677
(+) Estimated Tax Refunds — —26—262023—————
(-) Interest on Surety Bonding — (2)(0)(0)(2)(3)(5)(5)(6)(5)(4)(4)
(-) Change in Net Working Capital (46) (7)——(53)———————
Unlevered Free Cash Flow ($95) ($33)$11$32($85)($59)($6)$6$31$59$93$187
Cash Interest/Dividends, Building Loan Amort. (5) (33)(6)(3)(47)(58)(62)(63)(63)(64)(64)(63)
Assumed Cash Collateralization — (7)(14)—(21)(9)(7)1—1225—
Debt Issuance/Debt Retirement (net) — ——(150)(150)———————
Assumed Proceeds from Asset Sales — ——350350———————
Drawdown (Repayment) of Revolver 457 (115)—(269)73126600——0(81)
Transaction Fees (1) (9)(5)(15)(30)———————
Ending Cash $367 $169$155$100$100$100$85$28($5)$3$57$100
Borrowing Base 500 360360260260260260260260260260260
(-) Revolver Balance (457) (342)(342)(73)(73)(199)(259)(259)(259)(259)(259)(179)
(-) LCs Outstanding (19) (18)(12)(12)(12)(12)(1)(1)(1)(1)(1)(1)
Revolver Availability $24 $ —$6$175$175$49$ —$ —$ —$ —$ —$81
Ending Liquidity $391 $169$161$275$275$149$85$28($5)$3$57$181
Credit Statistics:
Total Debt + Preferred Equity $1,544 $1,428$1,428$584$584$709$768$767$767$766$765$683
Total Debt 1,544 1,4281,428284284409468467467466465383
(Net Debt + Preferred Equity) / EBITDA 4.4x 5.7x6.8x3.1x3.1x4.1x4.3x5.3x4.3x3.5x3.2x2.5x
Net Debt / EBITDA 4.4x 5.7x6.8x1.2x1.2x2.1x2.4x3.1x2.6x2.2x1.8x1.2x
Note: Based on 7/26 Modified Case with Appalachia Sale (Strip Price Deck as of July 26, 2016). All debt and convertible preferred equity is assumed to be refinanced at existing / proposed
rates at maturity (other than building loan). 1Q’ 16 and 2Q’16 based on actuals; 3Q’16 and beyond projected based on Stone internal estimates. See Disclaimer page of this
Presentation. See also “Long-Term Forecast – Assumptions Overview For 8 August 2016 Presentation” set forth in the Appendix to this Presentation. For reconciliation of non-
GAAP measures of EBITDA and unlevered free cash flow to GAAP measures of net income and cash flow from operations, see “Non-GAAP Reconciliation of Modified Case with
Appalachia Sale – 7/26 Strip” in the Appendix to this Presentation. Based on Stone internal estimates.
6
|
|
PRELIMINARY DRAFT SUBJECT TO REVISION
SUBJECT TO FRE408 AND CONFIDENTIALITY AGREEMENT
P R O J E C T E D I S O N
Appendix
7
|
|
PRELIMINARY DRAFT SUBJECT TO REVISION
SUBJECT TO FRE408 AND CONFIDENTIALITY AGREEMENT
P R O J E C T E D I S O N A P P E N D I X
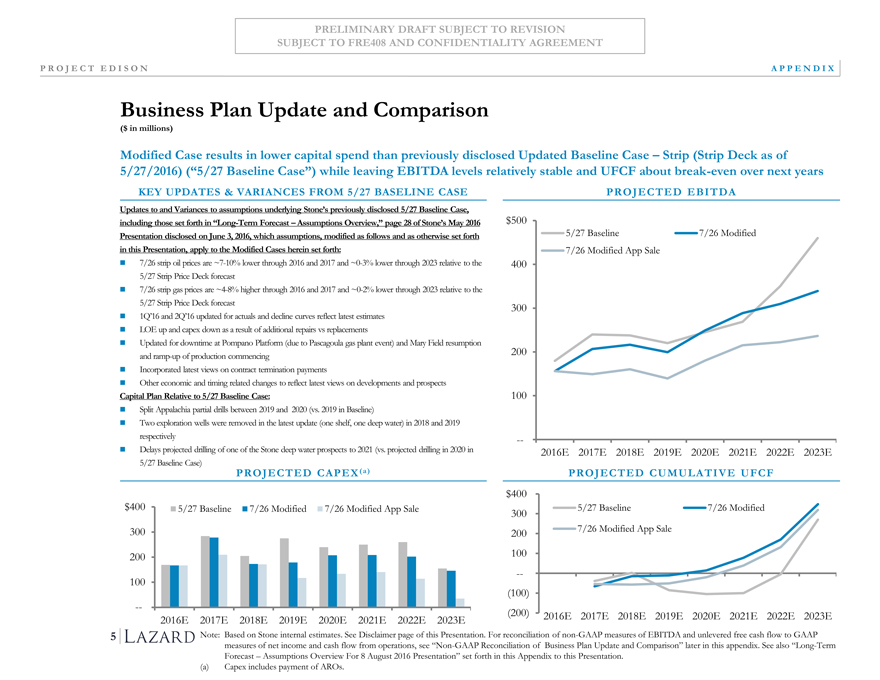
Business Plan Update and Comparison
($ in millions)
Modified Case results in lower capital spend than previously disclosed Updated Baseline Case – Strip (Strip Deck as of
5/27/2016) (“5/27 Baseline Case”) while leaving EBITDA levels relatively stable and UFCF about break-even over next years
KEY UPDATES & VARIANCES FROM 5/27 BASELINE CASE
Updates to and Variances to assumptions underlying Stone’s previously disclosed 5/27 Baseline Case,
including those set forth in “Long-Term Forecast – Assumptions Overview,” page 28 of Stone’s May 2016$
Presentation disclosed on June 3, 2016, which assumptions, modified as follows and as otherwise set forth
in this Presentation, apply to the Modified Cases herein set forth:
7/26 strip oil prices are ~7-10% lower through 2016 and 2017 and ~0-3% lower through 2023 relative to the
5/27 Strip Price Deck forecast
7/26 strip gas prices are ~4-8% higher through 2016 and 2017 and ~0-2% lower through 2023 relative to the
5/27 Strip Price Deck forecast
1Q’16 and 2Q’16 updated for actuals and decline curves reflect latest estimates
LOE up and capex down as a result of additional repairs vs replacements
Updated for downtime at Pompano Platform (due to Pascagoula gas plant event) and Mary Field resumption
and ramp-up of production commencing
Incorporated latest views on contract termination payments
Other economic and timing related changes to reflect latest views on developments and prospects
Capital Plan Relative to 5/27 Baseline Case:
Split Appalachia partial drills between 2019 and 2020 (vs. 2019 in Baseline)
Two exploration wells were removed in the latest update (one shelf, one deep water) in 2018 and 2019
respectively
Delays projected drilling of one of the Stone deep water prospects to 2021 (vs. projected drilling in 2020 in
5/27 Baseline Case)
PROJECTEDEBITDA
$500
5/27 Baseline7/26 Modified
7/26 Modified App Sale
400
300
200
100
—
2016E 2017E 2018E 2019E2020E 2021E2022E2023E
5/27 Baseline Case)
PROJECTED CAPEX ( a)
$400 5/27 Baseline 7/26 Modified
7/26 Modified App Sale
300
200
100
—
2016E 2017E 2018E 2019E 2020E 2021E 2022E 2023E
PROJECTEDCUMULATI VE UFCF
$400
3005/27 Baseline 7/26 Modified
2007/26 Modified App Sale
100
—
(100)
(200)2016E 2017E 2018E 2019E 2020E 2021E 2022E2023E
Note: Based on Stone internal estimates. See Disclaimer page of this Presentation. For reconciliation of non-GAAP measures of EBITDA and unlevered free cash flow to GAAP measures of net income and cash flow from operations, see “Non-GAAP Reconciliation of Business Plan Update and Comparison” later in this appendix. See also “Long-Term Forecast – Assumptions Overview For 8 August 2016 Presentation” set forth in this Appendix to this Presentation.
(a) Capex includes payment of AROs.
8
|
|
PRELIMINARY DRAFT SUBJECT TO REVISION
SUBJECT TO FRE408 AND CONFIDENTIALITY AGREEMENT
P R O J E C T E D I S O N A P P E N D I X
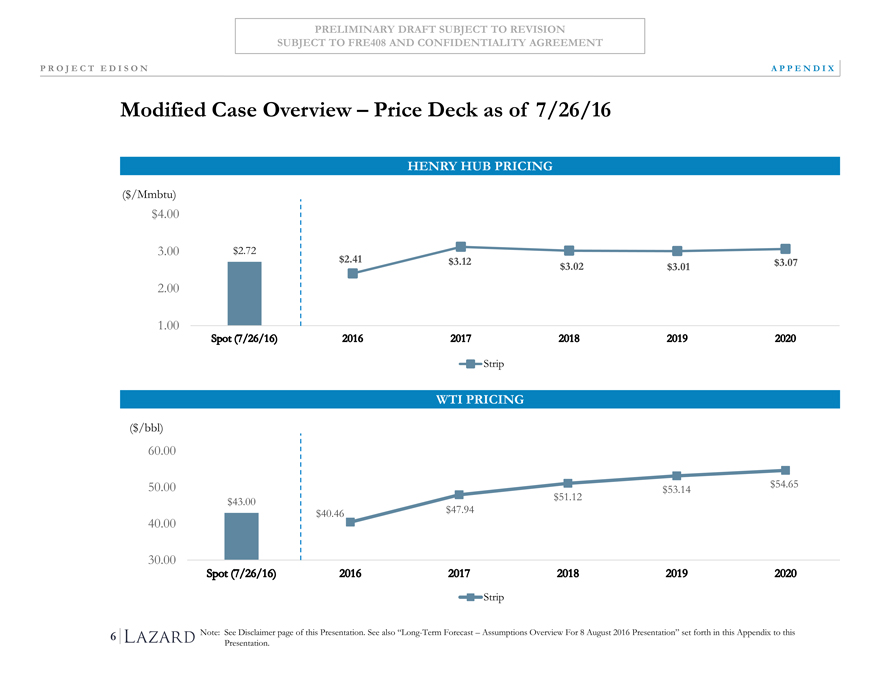
Modified Case Overview –Price Deck as of7/26/16
HENRY HUB PRICING
($/Mmbtu)
$4.00
3.00 $2.72
$2.41$3.12$3.02$3.01$3.07
2.00
1.00
Strip
WTI PRICING
($/bbl)
60.00
50.00 $53.14$54.65
$43.00 $51.12
$40.46$47.94
40.00
30.00
Strip
Note: See Disclaimer page of this Presentation. See also “Long-Term Forecast – Assumptions Overview For 8 August 2016 Presentation” set forth in this Appendix to this
Presentation.
9
|
|
PRELIMINARY DRAFT SUBJECT TO REVISION
SUBJECT TO FRE408 AND CONFIDENTIALITY AGREEMENT
P R O J E C T E D I S O N A P P E N D I X
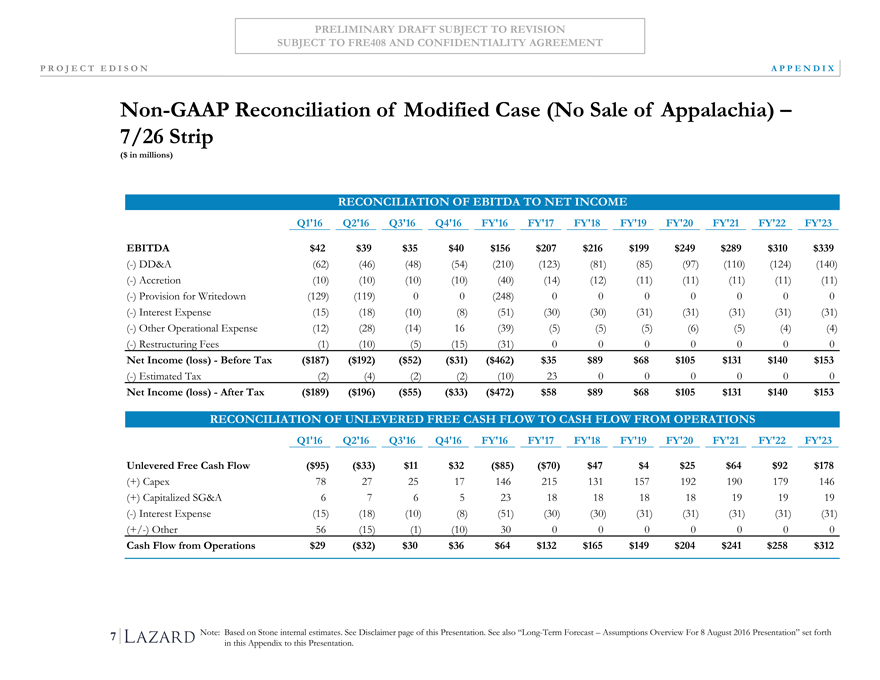
Non-GAAP Reconciliation of Modified Case (No Sale of Appalachia) – 7/26 Strip
($ in millions)
RECONCILIATION OF EBITDA TO NET INCOME
Q1’16 Q2’16Q3’16Q4’16FY’16FY’17FY’18FY’19FY’20FY’21FY’22FY’23
EBITDA $42 $39$35$40$156$207$216$199$249$289$310$339
(-) DD&A (62) (46)(48)(54)(210)(123)(81)(85)(97)(110)(124)(140)
(-) Accretion (10) (10)(10)(10)(40)(14)(12)(11)(11)(11)(11)(11)
(-) Provision for Writedown (129) (119)00(248)0000000
(-) Interest Expense (15) (18)(10)(8)(51)(30)(30)(31)(31)(31)(31)(31)
(-) Other Operational Expense (12) (28)(14)16(39)(5)(5)(5)(6)(5)(4)(4)
(-) Restructuring Fees (1) (10)(5)(15)(31)0000000
Net Income (loss)—Before Tax ($187) ($192)($52)($31)($462)$35$89$68$105$131$140$153
(-) Estimated Tax (2) (4)(2)(2)(10)23000000
Net Income (loss)—After Tax ($189) ($196)($55)($33)($472)$58$89$68$105$131$140$153
RECONCILIATION OF UNLEVERED FREE CASH FLOW TO CASH FLOW FROM OPERATIONS
Q1’16 Q2’16Q3’16Q4’16FY’16FY’17FY’18FY’19FY’20FY’21FY’22FY’23
Unlevered Free Cash Flow ($95) ($33)$11$32($85)($70)$47$4$25$64$92$178
(+) Capex 78 272517146215131157192190179146
(+) Capitalized SG&A 6 7652318181818191919
(-) Interest Expense (15) (18)(10)(8)(51)(30)(30)(31)(31)(31)(31)(31)
(+/-) Other 56 (15)(1)(10)300000000
Cash Flow from Operations $29 ($32)$30$36$64$132$165$149$204$241$258$312
Note: Based on Stone internal estimates. See Disclaimer page of this Presentation. See also “Long-Term Forecast – Assumptions Overview For 8 August 2016 Presentation” set forth in this Appendix to this Presentation.
10
|
|
PRELIMINARY DRAFT SUBJECT TO REVISION
SUBJECT TO FRE408 AND CONFIDENTIALITY AGREEMENT
P R O J E C T E D I S O N A P P E N D I X
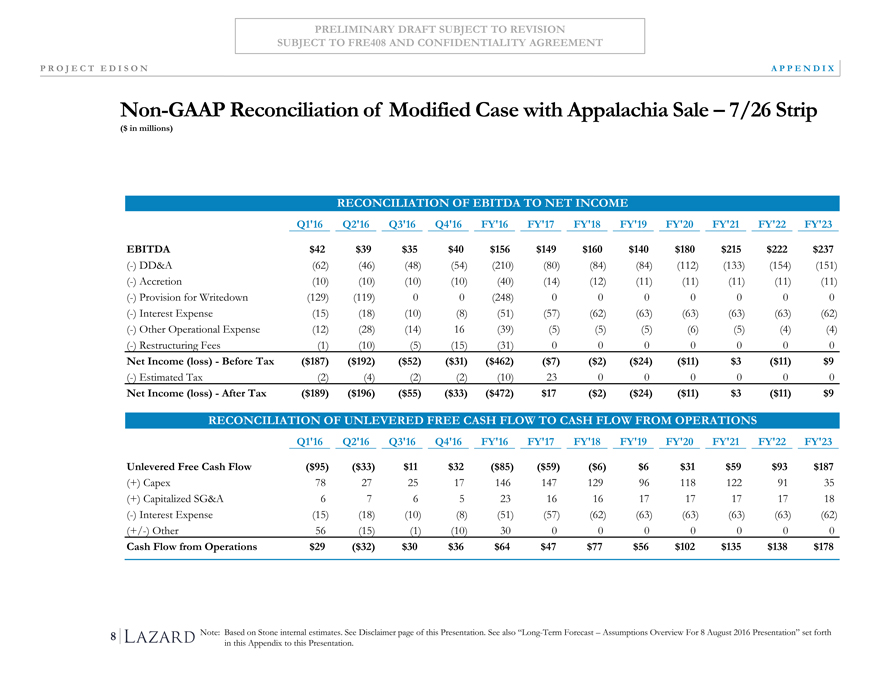
Non-GAAP Reconciliation of Modified Case with Appalachia Sale – 7/26 Strip
($ in millions)
RECONCILIATION OF EBITDA TO NET INCOME
Q1’16 Q2’16Q3’16Q4’16FY’16FY’17FY’18FY’19FY’20FY’21FY’22FY’23
EBITDA $42 $39$35$40$156$149$160$140$180$215$222$237
(-) DD&A (62) (46)(48)(54)(210)(80)(84)(84)(112)(133)(154)(151)
(-) Accretion (10) (10)(10)(10)(40)(14)(12)(11)(11)(11)(11)(11)
(-) Provision for Writedown (129) (119)00(248)0000000
(-) Interest Expense (15) (18)(10)(8)(51)(57)(62)(63)(63)(63)(63)(62)
(-) Other Operational Expense (12) (28)(14)16(39)(5)(5)(5)(6)(5)(4)(4)
(-) Restructuring Fees (1) (10)(5)(15)(31)0000000
Net Income (loss)—Before Tax ($187) ($192)($52)($31)($462)($7)($2)($24)($11)$3($11)$9
(-) Estimated Tax (2) (4)(2)(2)(10)23000000
Net Income (loss)—After Tax ($189) ($196)($55)($33)($472)$17($2)($24)($11)$3($11)$9
RECONCILIATION OF UNLEVERED FREE CASH FLOW TO CASH FLOW FROM OPERATIONS
Q1’16 Q2’16Q3’16Q4’16FY’16FY’17FY’18FY’19FY’20FY’21FY’22FY’23
Unlevered Free Cash Flow ($95) ($33)$11$32($85)($59)($6)$6$31$59$93$187
(+) Capex 78 272517146147129961181229135
(+) Capitalized SG&A 6 7652316161717171718
(-) Interest Expense (15) (18)(10)(8)(51)(57)(62)(63)(63)(63)(63)(62)
(+/-) Other 56 (15)(1)(10)300000000
Cash Flow from Operations $29 ($32)$30$36$64$47$77$56$102$135$138$178
Note: Based on Stone internal estimates. See Disclaimer page of this Presentation. See also “Long-Term Forecast – Assumptions Overview For 8 August 2016 Presentation” set forth in this Appendix to this Presentation.
11
|
|
PRELIMINARY DRAFT SUBJECT TO REVISION
SUBJECT TO FRE408 AND CONFIDENTIALITY AGREEMENT
P R O J E C T E D I S O N A P P E N D I X
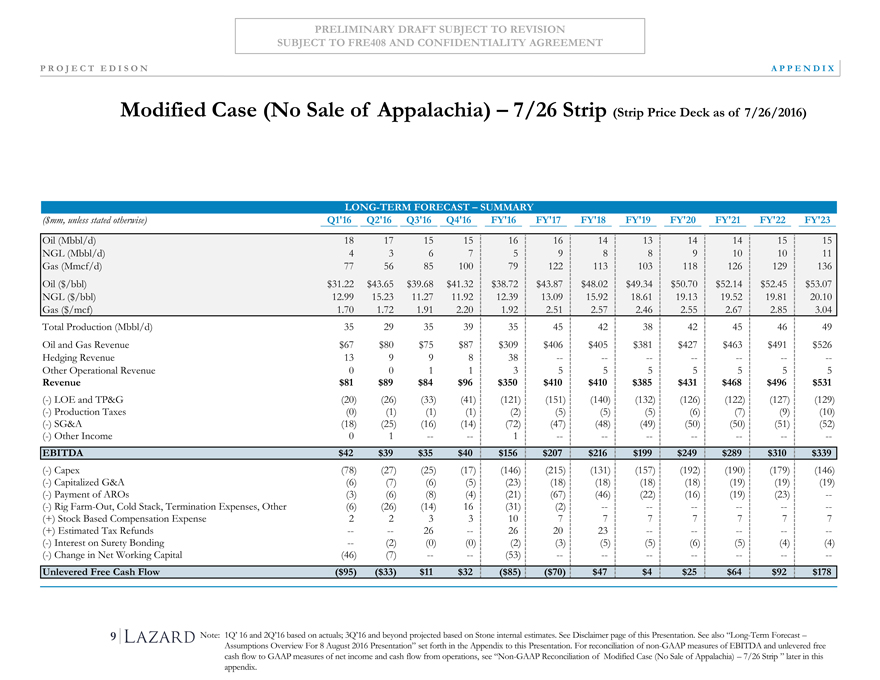
Modified Case (No Sale of Appalachia) – 7/26 Strip (Strip Price Deck as of 7/26/2016)
LONG-TERM FORECAST – SUMMARY
($mm, unless stated otherwise) Q1’16Q2’16Q3’16Q4’16FY’16FY’17FY’18FY’19FY’20FY’21FY’22FY’23
Oil (Mbbl/d) 181715151616141314141515
NGL (Mbbl/d) 436759889101011
Gas (Mmcf/d) 77568510079122113103118126129136
Oil ($/bbl) $31.22$43.65$39.68$41.32$38.72$43.87$48.02$49.34$50.70$52.14$52.45$53.07
NGL ($/bbl) 12.9915.2311.2711.9212.3913.0915.9218.6119.1319.5219.8120.10
Gas ($/mcf) 1.701.721.912.201.922.512.572.462.552.672.853.04
Total Production (Mbbl/d) 352935393545423842454649
Oil and Gas Revenue $67$80$75$87$309$406$405$381$427$463$491$526
Hedging Revenue 1399838———————
Other Operational Revenue 001135555555
Revenue $81$89$84$96$350$410$410$385$431$468$496$531
(-) LOE and TP&G (20)(26)(33)(41)(121)(151)(140)(132)(126)(122)(127)(129)
(-) Production Taxes (0)(1)(1)(1)(2)(5)(5)(5)(6)(7)(9)(10)
(-) SG&A (18)(25)(16)(14)(72)(47)(48)(49)(50)(50)(51)(52)
(-) Other Income 01——1———————
EBITDA $42$39$35$40$156$207$216$199$249$289$310$339
(-) Capex (78)(27)(25)(17)(146)(215)(131)(157)(192)(190)(179)(146)
(-) Capitalized G&A (6)(7)(6)(5)(23)(18)(18)(18)(18)(19)(19)(19)
(-) Payment of AROs (3)(6)(8)(4)(21)(67)(46)(22)(16)(19)(23)—
(-) Rig Farm-Out, Cold Stack, Termination Expenses, Other (6) (26)(14)16(31)(2)——————
(+) Stock Based Compensation Expense 2233107777777
(+) Estimated Tax Refunds ——26—262023—————
(-) Interest on Surety Bonding —(2)(0)(0)(2)(3)(5)(5)(6)(5)(4)(4)
(-) Change in Net Working Capital (46)(7)——(53)———————
Unlevered Free Cash Flow ($95)($33)$11$32($85)($70)$47$4$25$64$92$178
Note: 1Q’ 16 and 2Q’16 based on actuals; 3Q’16 and beyond projected based on Stone internal estimates. See Disclaimer page of this Presentation. See also “Long-Term Forecast –
Assumptions Overview For 8 August 2016 Presentation” set forth in the Appendix to this Presentation. For reconciliation of non-GAAP measures of EBITDA and unlevered free
cash flow to GAAP measures of net income and cash flow from operations, see “Non-GAAP Reconciliation of Modified Case (No Sale of Appalachia) – 7/26 Strip ” later in this
appendix.
12
|
|
PRELIMINARY DRAFT SUBJECT TO REVISION
SUBJECT TO FRE408 AND CONFIDENTIALITY AGREEMENT
P R O J E C T E D I S O N A P P E N D I X
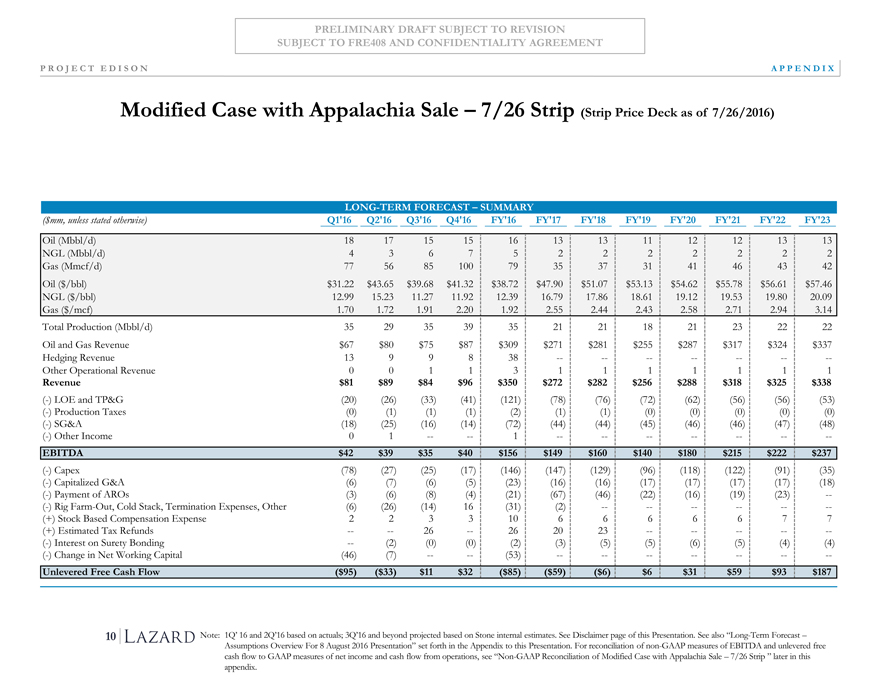
Modified Case with Appalachia Sale – 7/26 Strip (Strip Price Deck as of 7/26/2016)
LONG-TERM FORECAST – SUMMARY
($mm, unless stated otherwise) Q1’16 Q2’16Q3’16Q4’16FY’16FY’17FY’18FY’19FY’20FY’21FY’22FY’23
Oil (Mbbl/d) 18 1715151613131112121313
NGL (Mbbl/d) 4 36752222222
Gas (Mmcf/d) 77 56851007935373141464342
Oil ($/bbl) $31.22 $43.65$39.68$41.32$38.72$47.90$51.07$53.13$54.62$55.78$56.61$57.46
NGL ($/bbl) 12.99 15.2311.2711.9212.3916.7917.8618.6119.1219.5319.8020.09
Gas ($/mcf) 1.70 1.721.912.201.922.552.442.432.582.712.943.14
Total Production (Mbbl/d) 35 2935393521211821232222
Oil and Gas Revenue $67 $80$75$87$309$271$281$255$287$317$324$337
Hedging Revenue 13 99838———————
Other Operational Revenue 0 01131111111
Revenue $81 $89$84$96$350$272$282$256$288$318$325$338
(-) LOE and TP&G (20) (26)(33)(41)(121)(78)(76)(72)(62)(56)(56)(53)
(-) Production Taxes (0) (1)(1)(1)(2)(1)(1)(0)(0)(0)(0)(0)
(-) SG&A (18) (25)(16)(14)(72)(44)(44)(45)(46)(46)(47)(48)
(-) Other Income 0 1——1———————
EBITDA $42 $39$35$40$156$149$160$140$180$215$222$237
(-) Capex (78) (27)(25)(17)(146)(147)(129)(96)(118)(122)(91)(35)
(-) Capitalized G&A (6) (7)(6)(5)(23)(16)(16)(17)(17)(17)(17)(18)
(-) Payment of AROs (3) (6)(8)(4)(21)(67)(46)(22)(16)(19)(23)—
(-) Rig Farm-Out, Cold Stack, Termination Expenses, Other (6) (26)(14)16(31)(2)——————
(+) Stock Based Compensation Expense 2 233106666677
(+) Estimated Tax Refunds — —26—262023—————
(-) Interest on Surety Bonding — (2)(0)(0)(2)(3)(5)(5)(6)(5)(4)(4)
(-) Change in Net Working Capital (46) (7)——(53)———————
Unlevered Free Cash Flow ($95) ($33)$11$32($85)($59)($6)$6$31$59$93$187
Note: 1Q’ 16 and 2Q’16 based on actuals; 3Q’16 and beyond projected based on Stone internal estimates. See Disclaimer page of this Presentation. See also “Long-Term Forecast –
Assumptions Overview For 8 August 2016 Presentation” set forth in the Appendix to this Presentation. For reconciliation of non-GAAP measures of EBITDA and unlevered free
cash flow to GAAP measures of net income and cash flow from operations, see “Non-GAAP Reconciliation of Modified Case with Appalachia Sale – 7/26 Strip ” later in this
appendix.
13
|
|
PRELIMINARY DRAFT SUBJECT TO REVISION
SUBJECT TO FRE408 AND CONFIDENTIALITY AGREEMENT
P R O J E C T E D I S O N A P P E N D I X
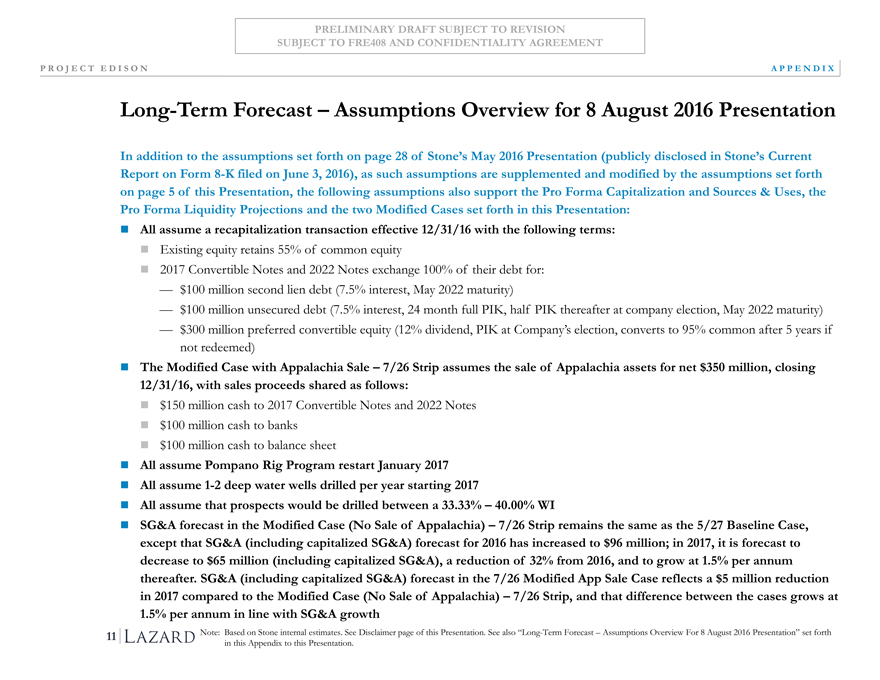
Long-Term Forecast – Assumptions Overview for 8 August 2016 Presentation
In addition to the assumptions set forth on page 28 of Stone’s May 2016 Presentation (publicly disclosed in Stone’s Current
Report on Form 8-K filed on June 3, 2016), as such assumptions are supplemented and modified by the assumptions set forth on page 5 of this Presentation, the following assumptions also support the Pro Forma Capitalization and Sources & Uses, the Pro Forma Liquidity Projections and the two Modified Cases set forth in this Presentation:
All assume a recapitalization transaction effective 12/31/16 with the following terms:
Existing equity retains 55% of common equity
2017 Convertible Notes and 2022 Notes exchange 100% of their debt for: 3/4 $100 million second lien debt (7.5% interest, May 2022 maturity)
3/4 $100 million unsecured debt (7.5% interest, 24 month full PIK, half PIK thereafter at company election, May 2022 maturity) 3/4 $300 million preferred convertible equity (12% dividend, PIK at Company’s election, converts to 95% common after 5 years if not redeemed)
The Modified Case with Appalachia Sale – 7/26 Strip assumes the sale of Appalachia assets for net $350 million, closing 12/31/16, with sales proceeds shared as follows:
$150 million cash to 2017 Convertible Notes and 2022 Notes $100 million cash to banks $100 million cash to balance sheet
All assume Pompano Rig Program restart January 2017 All assume 1-2 deep water wells drilled per year starting 2017
All assume that prospects would be drilled between a 33.33% – 40.00% WI
SG&A forecast in the Modified Case (No Sale of Appalachia) – 7/26 Strip remains the same as the 5/27 Baseline Case, except that SG&A (including capitalized SG&A) forecast for 2016 has increased to $96 million; in 2017, it is forecast to decrease to $65 million (including capitalized SG&A), a reduction of 32% from 2016, and to grow at 1.5% per annum thereafter. SG&A (including capitalized SG&A) forecast in the 7/26 Modified App Sale Case reflects a $5 million reduction in 2017 compared to the Modified Case (No Sale of Appalachia) – 7/26 Strip, and that difference between the cases grows at 1.5% per annum in line with SG&A growth
Note: Based on Stone internal estimates. See Disclaimer page of this Presentation. See also “Long-Term Forecast – Assumptions Overview For 8 August 2016 Presentation” set forth in this Appendix to this Presentation.
14

