Attached files
| file | filename |
|---|---|
| EX-99.1 - EX-99.1 - Multi Packaging Solutions International Ltd | mpsx-20160822ex991722f3a.htm |
| 8-K - 8-K - Multi Packaging Solutions International Ltd | mpsx-20160822x8k.htm |

|
|
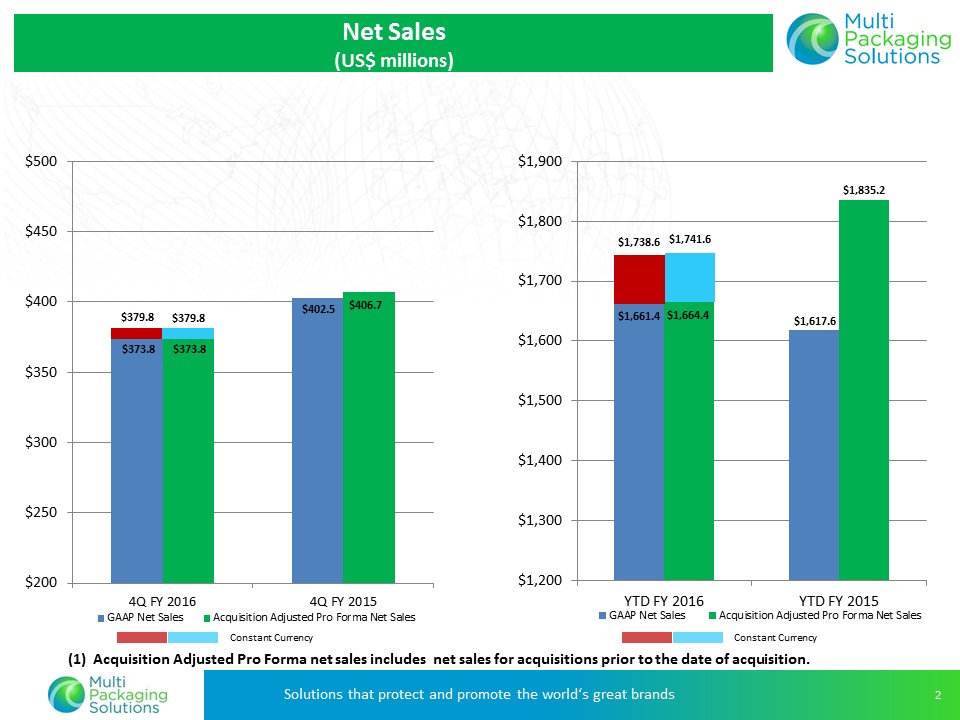
$379.8 (1) Acquisition Adjusted Pro Forma net sales includes net sales for acquisitions prior to the date of acquisition. $379.8 $1,738.6 $1,741.6 Constant Currency Net Sales (US$ millions) Constant Currency $1,661.4 $1,617.6 $1,664.4 $1,835.2 $1,200 $1,300 $1,400 $1,500 $1,600 $1,700 $1,800 $1,900 YTD FY 2016 YTD FY 2015 GAAP Net Sales Acquisition Adjusted Pro Forma Net Sales $373.8 $402.5 $373.8 $406.7 $200 $250 $300 $350 $400 $450 $500 4Q FY 2016 4Q FY 2015 GAAP Net Sales Acquisition Adjusted Pro Forma Net Sales |
|
|
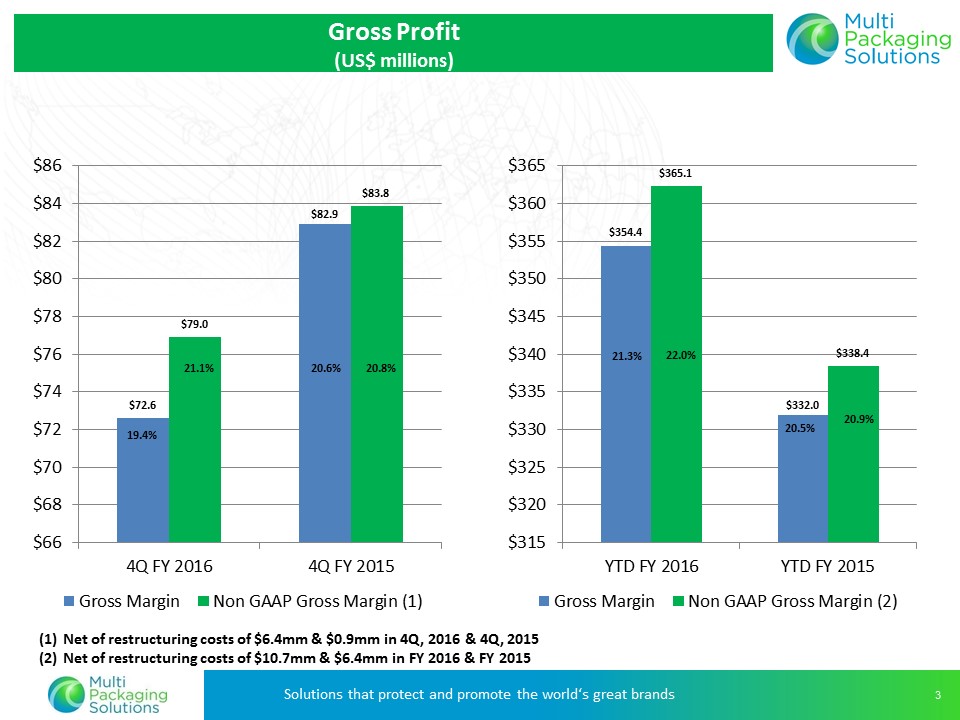
Net of restructuring costs of $6.4mm & $0.9mm in 4Q, 2016 & 4Q, 2015 Net of restructuring costs of $10.7mm & $6.4mm in FY 2016 & FY 2015 20.6% 19.4% 20.8% 21.1% 21.3% 20.5% 22.0% 20.9% Gross Profit (US$ millions) $72.6 $82.9 $ 79.0 $83.8 $66 $68 $70 $72 $74 $76 $78 $80 $82 $84 $86 4Q FY 2016 4Q FY 2015 Gross Margin Non GAAP Gross Margin (1) $354.4 $332.0 $ 365.1 $338.4 $315 $320 $325 $330 $335 $340 $345 $350 $355 $360 $365 YTD FY 2016 YTD FY 2015 Gross Margin Non GAAP Gross Margin (2) |
|
|
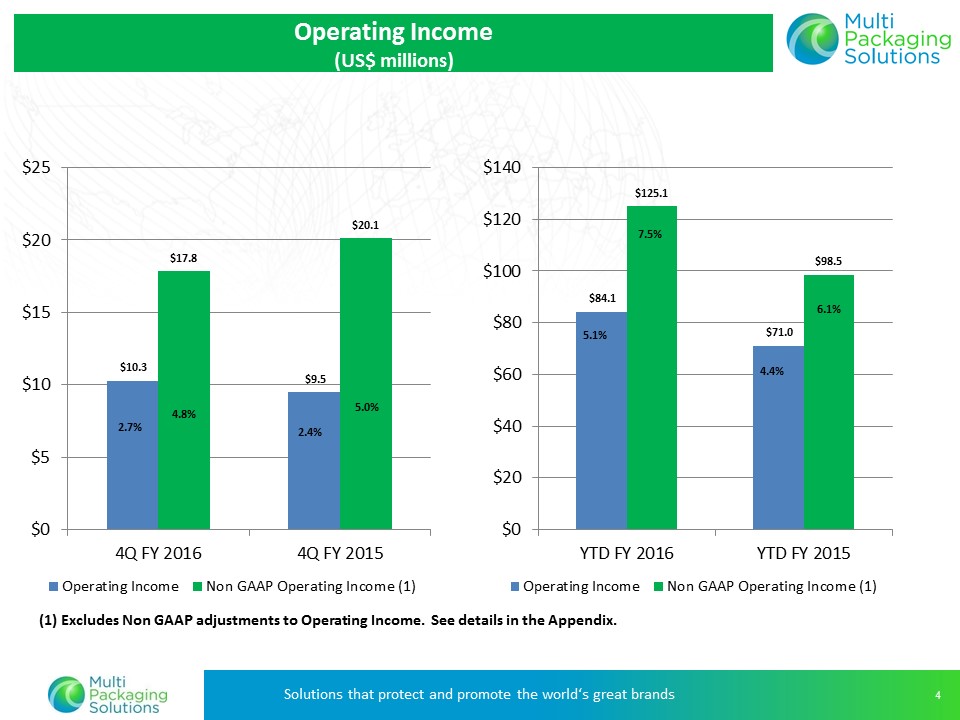
(1) Excludes Non GAAP adjustments to Operating Income. See details in the Appendix. 2.7% 4.8% 2.4% 5.0% 5.1% 7.5% 6.1% 4.4% Operating Income (US$ millions) $10.3 $9.5 $17.8 $20.1 $0 $5 $10 $15 $20 $25 4Q FY 2016 4Q FY 2015 Operating Income Non GAAP Operating Income (1) $84.1 $71.0 $125.1 $98.5 $0 $20 $40 $60 $80 $100 $120 $140 YTD FY 2016 YTD FY 2015 Operating Income Non GAAP Operating Income (1) |
|
|
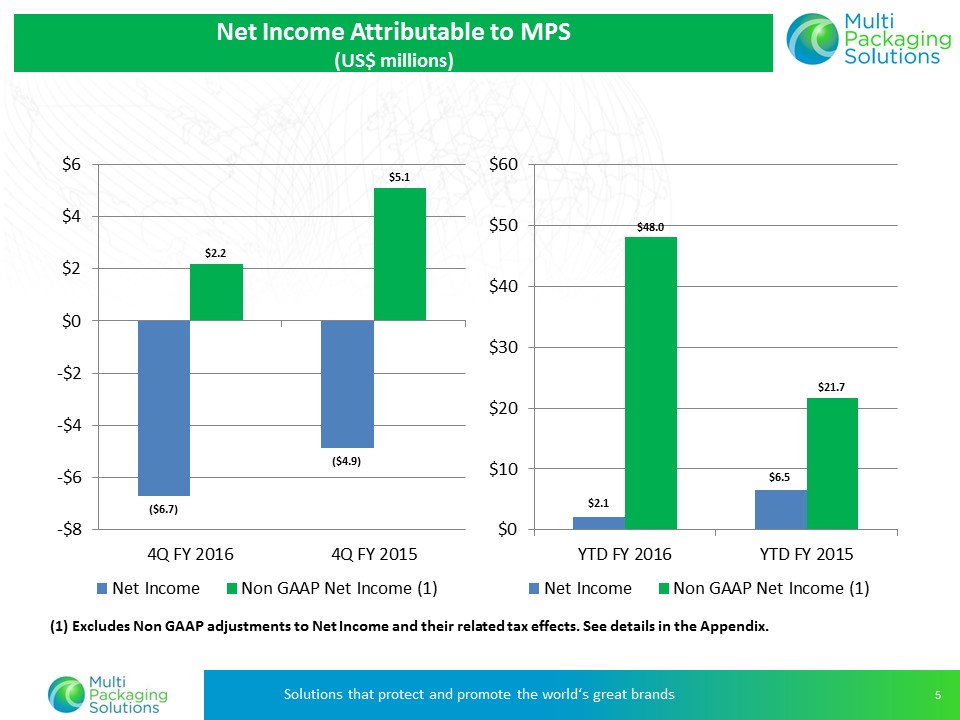
(1) Excludes Non GAAP adjustments to Net Income and their related tax effects. See details in the Appendix. Net Income Attributable to MPS (US$ millions) ($6.7) ($4.9) $2.2 $5.1 -$8 -$6 -$4 -$2 $0 $2 $4 $6 4Q FY 2016 4Q FY 2015 Net Income Non GAAP Net Income (1) $2.1 $6.5 $48.0 $21.7 $0 $10 $20 $30 $40 $50 $60 YTD FY 2016 YTD FY 2015 Net Income Non GAAP Net Income (1) |
|
|
(1) Excludes Non GAAP adjustments to Net Income and their related tax effects. See details in the Appendix. Diluted Net Income Attributable to MPS ($0.09) ($0.08) $0.03 $0.08 -$0.10 -$0.08 -$0.06 -$0.04 -$0.02 $0.00 $0.02 $0.04 $0.06 $0.08 $0.10 4Q FY 2016 4Q FY 2015 EPS Non GAAP EPS (1) $0.03 $0.10 $0.66 $0.35 $0.00 $0.10 $0.20 $0.30 $0.40 $0.50 $0.60 $0.70 YTD FY 2016 YTD FY 2015 EPS Non GAAP EPS (1) |
|
|
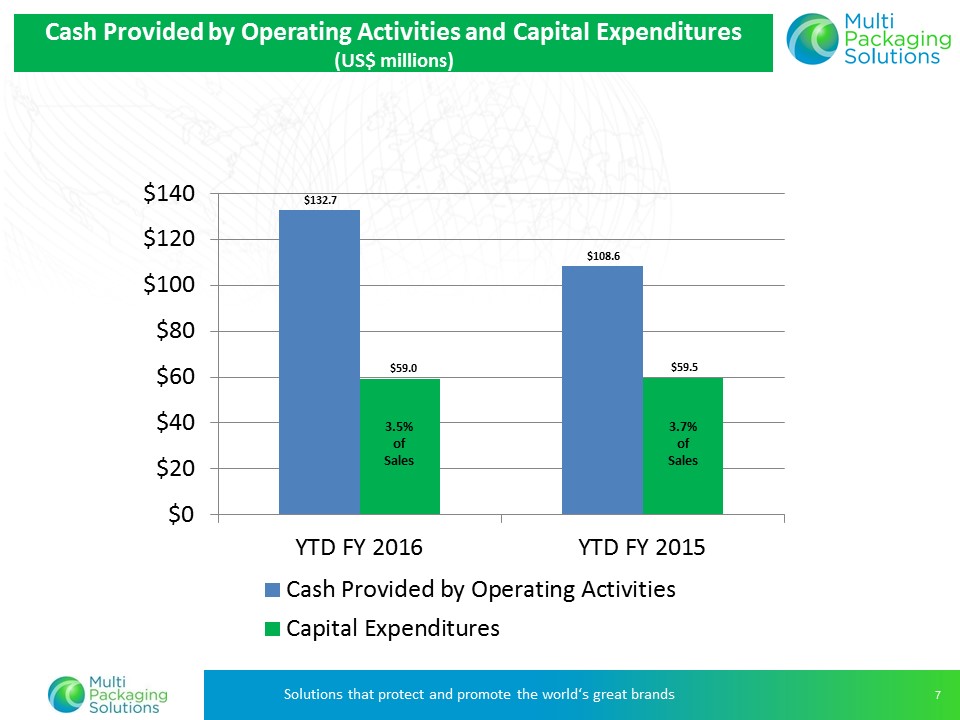
3.5% of Sales 3.7% of Sales Cash Provided by Operating Activities and Capital Expenditures (US$ millions) $132.7 $108.6 $59.0 $59.5 $0 $20 $40 $60 $80 $100 $120 $140 YTD FY 2016 YTD FY 2015 Cash Provided by Operating Activities Capital Expenditures |
|
|
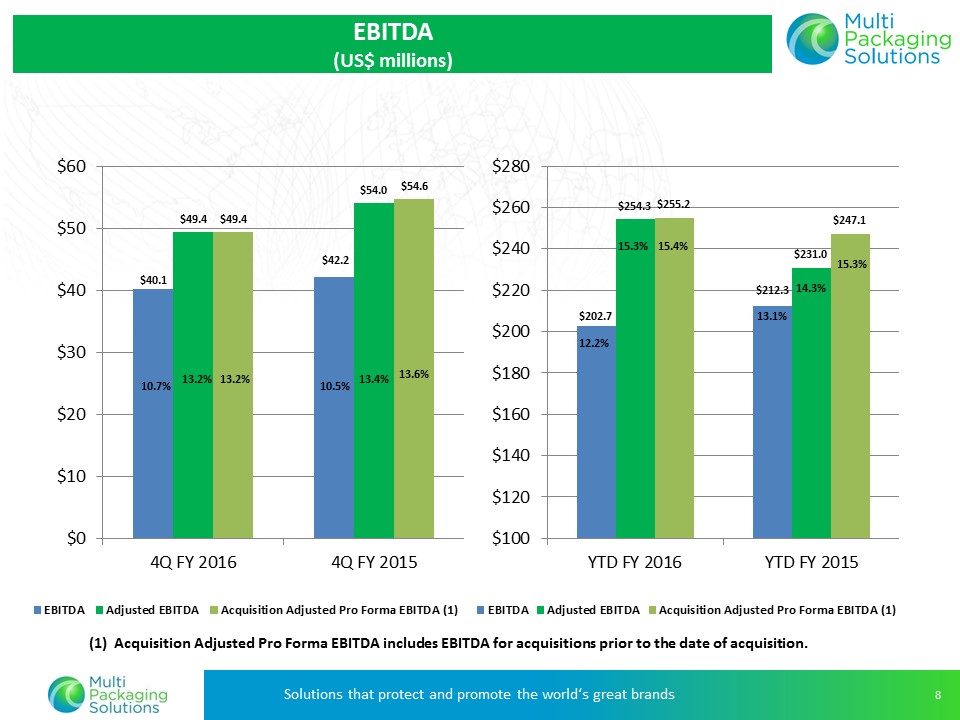
10.5% 13.4% (1) Acquisition Adjusted Pro Forma EBITDA includes EBITDA for acquisitions prior to the date of acquisition. 10.7% 13.2% 13.6% 13.2% 14.3% 13.1% 15.3% 15.3% 12.2% 15.4% EBITDA (US$ millions) $40.1 $42.2 $49.4 $54.0 $49.4 $54.6 $0 $10 $20 $30 $40 $50 $60 4Q FY 2016 4Q FY 2015 EBITDA Adjusted EBITDA Acquisition Adjusted Pro Forma EBITDA (1) $202.7 $212.3 $254.3 $231.0 $255.2 $247.1 $100 $120 $140 $160 $180 $200 $220 $240 $260 $280 YTD FY 2016 YTD FY 2015 EBITDA Adjusted EBITDA Acquisition Adjusted Pro Forma EBITDA (1) |
|
|
Solutions that Protect and Promote the World’s Great Brands 4Q 2016 Earnings Webcast Appendix Depreciation and Amortization Non GAAP Adjusted EBITDA to Net Income Reconciliation Non GAAP Adjusted Income Reconciliation Non GAAP Pro Forma Sales Reconciliation Debt Summary Net Sales by Geography and End Market Free Cash Flow Reconciliation |

|
|
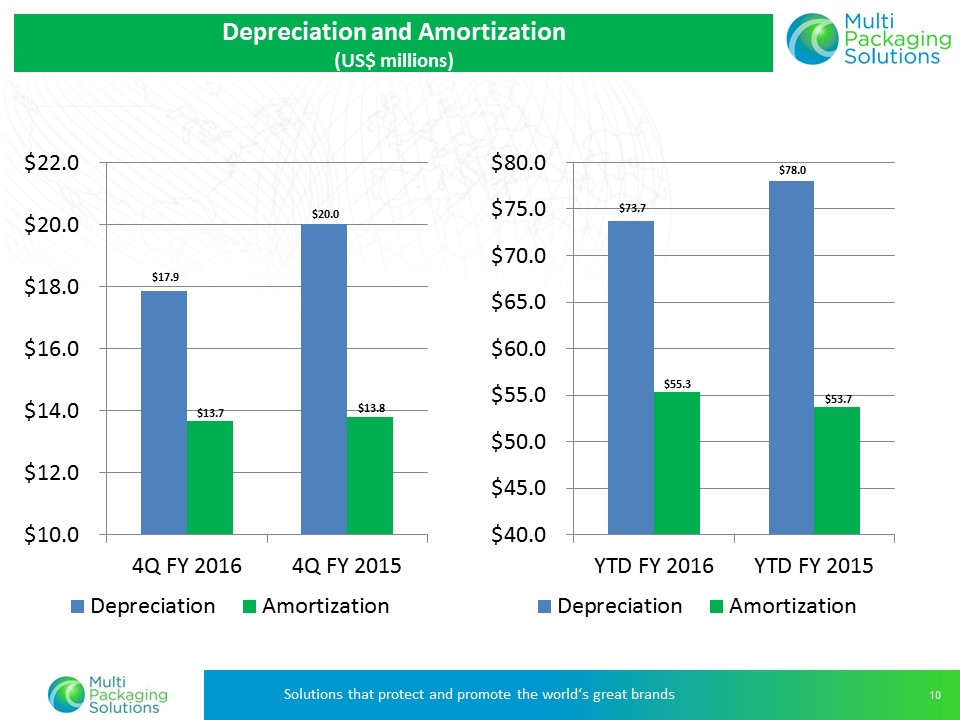
Depreciation and Amortization (US$ millions) $17.9 $20.0 $13.7 $13.8 $10.0 $12.0 $14.0 $16.0 $18.0 $20.0 $22.0 4Q FY 2016 4Q FY 2015 Depreciation Amortization $73.7 $78.0 $55.3 $53.7 $40.0 $45.0 $50.0 $55.0 $60.0 $65.0 $70.0 $75.0 $80.0 YTD FY 2016 YTD FY 2015 Depreciation Amortization |
|
|
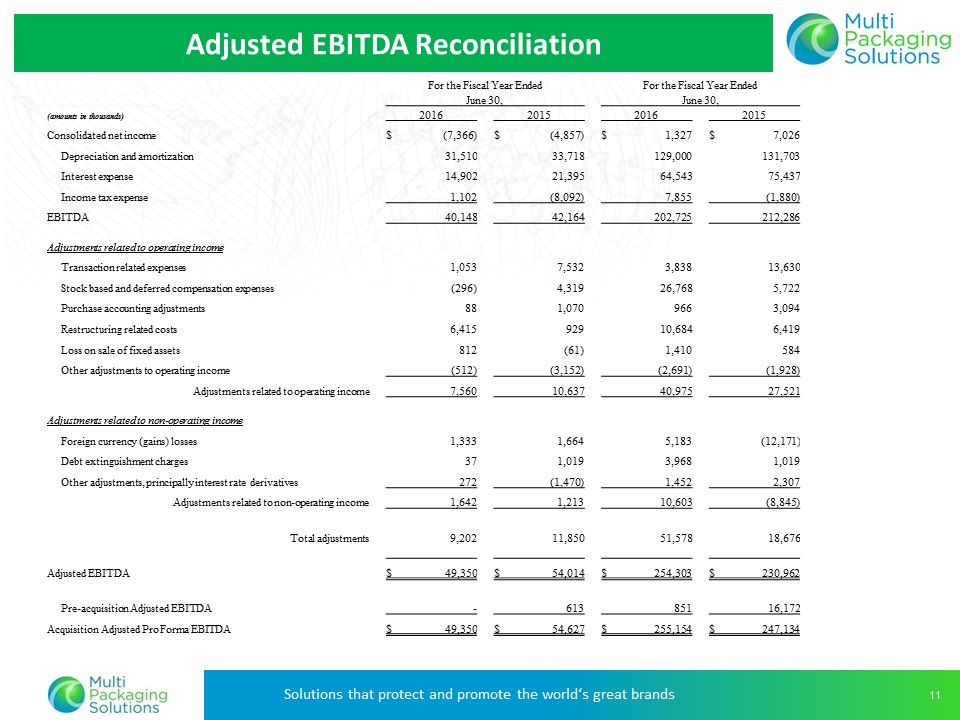
Adjusted EBITDA Reconciliation For the Fiscal Year Ended For the Fiscal Year Ended June 30, June 30, (amounts in thousands) 2016 2015 2016 2015 Consolidated net income $ (7,366) $ (4,857) $ 1,327 $ 7,026 Depreciation and amortization 31,510 33,718 129,000 131,703 Interest expense 14,902 21,395 64,543 75,437 Income tax expense 1,102 (8,092) 7,855 (1,880) EBITDA 40,148 42,164 202,725 212,286 Adjustments related to operating income Transaction related expenses 1,053 7,532 3,838 13,630 Stock based and deferred compensation expenses (296) 4,319 26,768 5,722 Purchase accounting adjustments 88 1,070 966 3,094 Restructuring related costs 6,415 929 10,684 6,419 Loss on sale of fixed assets 812 (61) 1,410 584 Other adjustments to operating income (512) (3,152) (2,691) (1,928) Adjustments related to operating income 7,560 10,637 40,975 27,521 Adjustments related to non-operating income Foreign currency (gains) losses 1,333 1,664 5,183 (12,171) Debt extinguishment charges 37 1,019 3,968 1,019 Other adjustments, principally interest rate derivatives 272 (1,470) 1,452 2,307 Adjustments related to non-operating income 1,642 1,213 10,603 (8,845) Total adjustments 9,202 11,850 51,578 18,676 Adjusted EBITDA $ 49,350 $ 54,014 $ 254,303 $ 230,962 Pre-acquisition Adjusted EBITDA - 613 851 16,172 Acquisition Adjusted Pro Forma EBITDA $ 49,350 $ 54,627 $ 255,154 $ 247,134 |
|
|
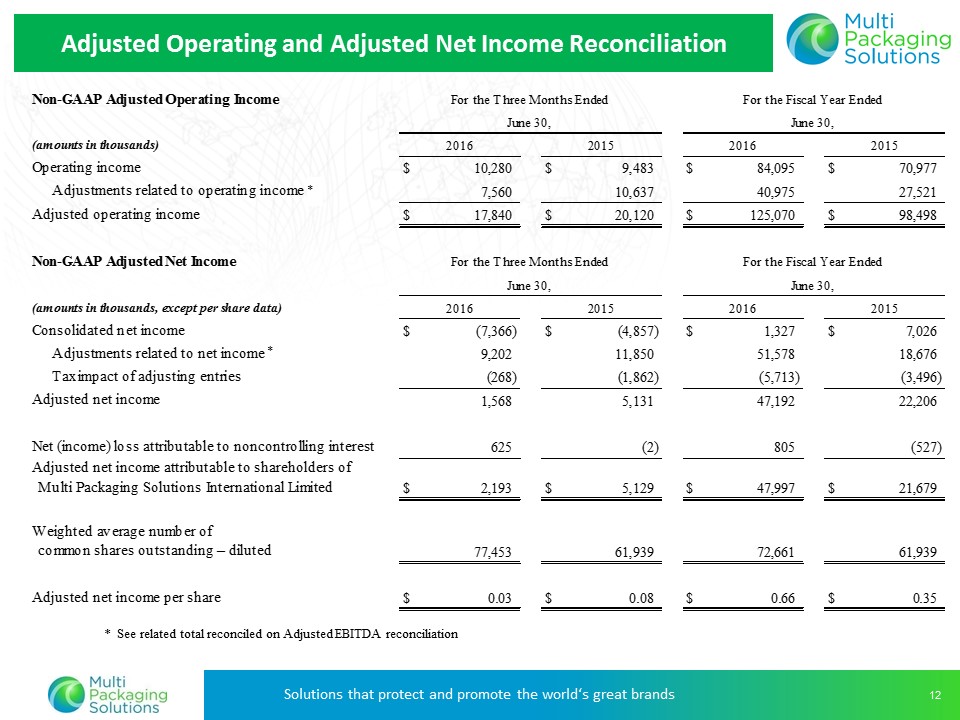
* See related total reconciled on Adjusted EBITDA reconciliation * * Adjusted Operating and Adjusted Net Income Reconciliation |
|
|
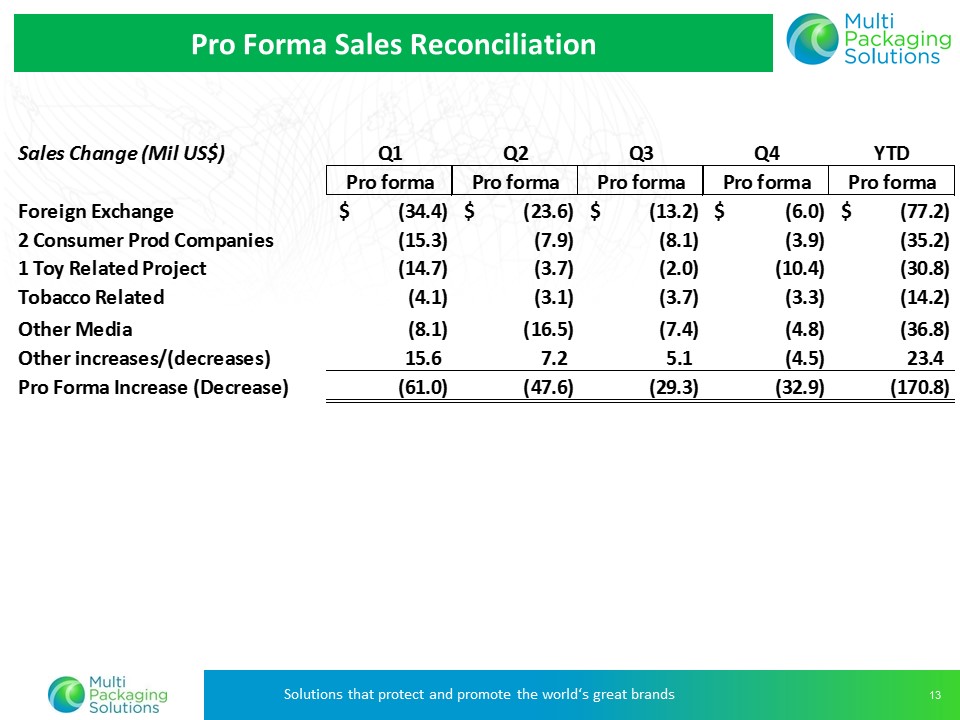
Pro Forma Sales Reconciliation Sales Change (Mil US$) Q1 Q2 Q3 Q4 YTD Pro forma Pro forma Pro forma Pro forma Pro forma Foreign Exchange (34.4) $ (23.6) $ (13.2) $ (6.0) $ (77.2) $ 2 Consumer Prod Companies (15.3) (7.9) (8.1) (3.9) (35.2) 1 Toy Related Project (14.7) (3.7) (2.0) (10.4) (30.8) Tobacco Related (4.1) (3.1) (3.7) (3.3) (14.2) Other Media (8.1) (16.5) (7.4) (4.8) (36.8) Other increases/(decreases) 15.6 7.2 5.1 (4.5) 23.4 Pro Forma Increase (Decrease) (61.0) (47.6) (29.3) (32.9) (170.8) |
|
|
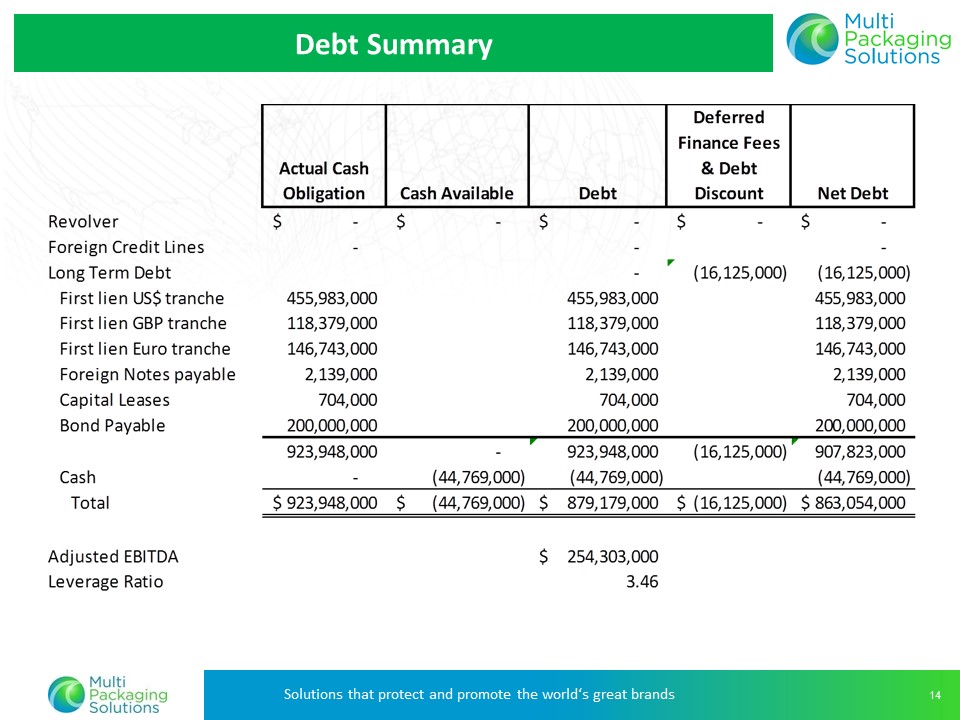
Debt Summary |
|
|
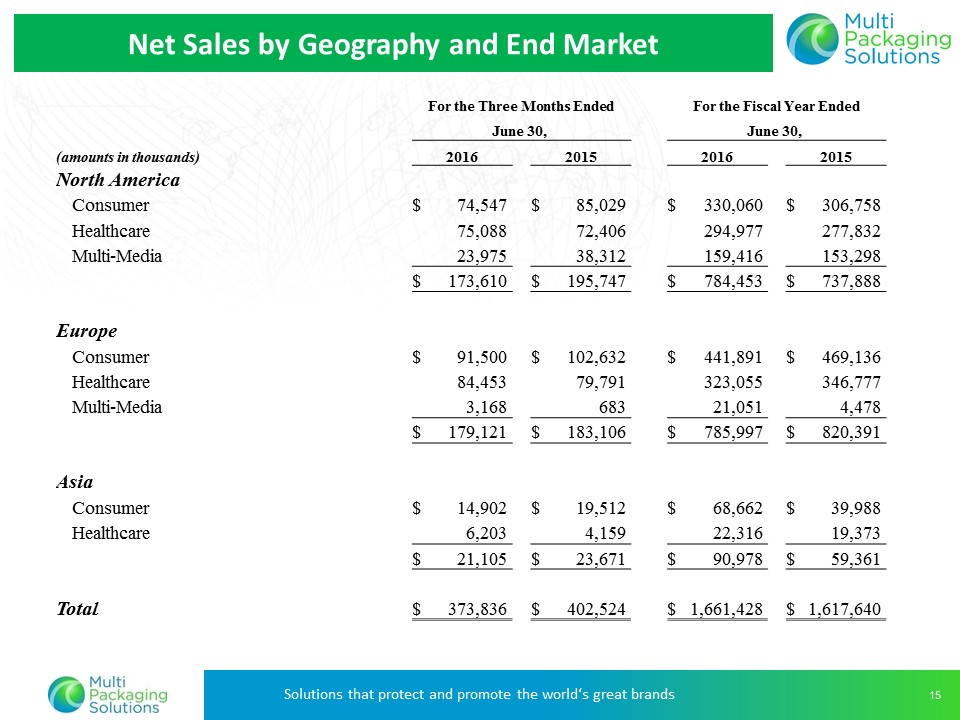
Net Sales by Geography and End Market For the Three Months Ended For the Fiscal Year Ended June 30, June 30, (amounts in thousands) 2016 2015 2016 2015 North America Consumer $ 74,547 $ 85,029 $ 330,060 $ 306,758 Healthcare 75,088 72,406 294,977 277,832 Multi-Media 23,975 38,312 159,416 153,298 $ 173,610 $ 195,747 $ 784,453 $ 737,888 Europe Consumer $ 91,500 $ 102,632 $ 441,891 $ 469,136 Healthcare 84,453 79,791 323,055 346,777 Multi-Media 3,168 683 21,051 4,478 $ 179,121 $ 183,106 $ 785,997 $ 820,391 Asia Consumer $ 14,902 $ 19,512 $ 68,662 $ 39,988 Healthcare 6,203 4,159 22,316 19,373 $ 21,105 $ 23,671 $ 90,978 $ 59,361 Total $ 373,836 $ 402,524 $ 1,661,428 $ 1,617,640 |
|
|
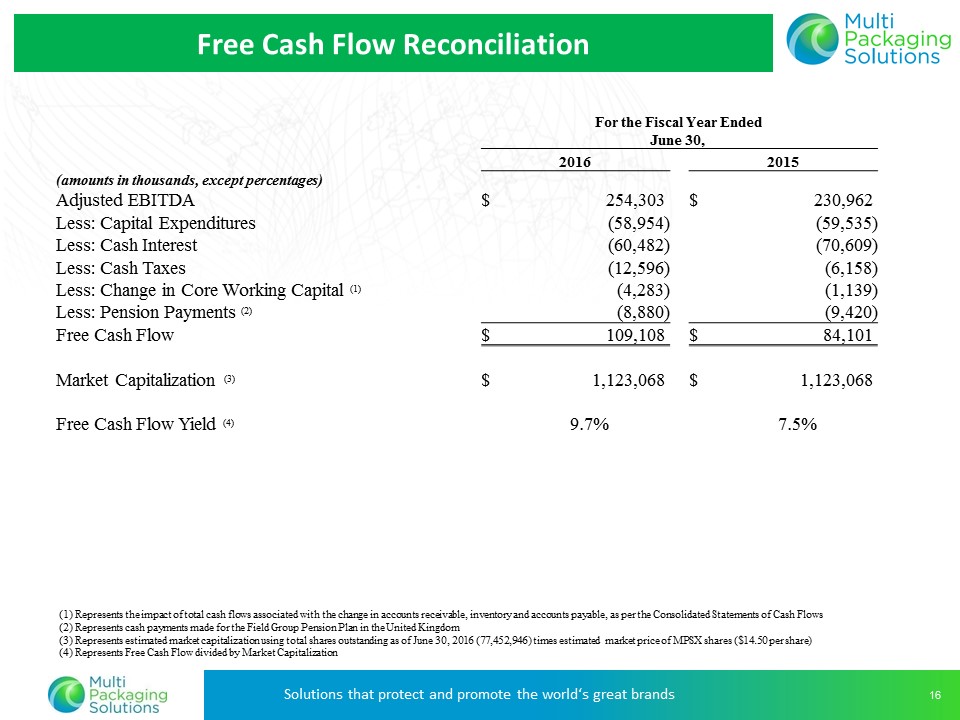
Free Cash Flow Reconciliation For the Fiscal Year Ended June 30, 2016 2015 (amounts in thousands, except percentages) Adjusted EBITDA $ 254,303 $ 230,962 Less: Capital Expenditures (58,954) (59,535) Less: Cash Interest (60,482) (70,609) Less: Cash Taxes (12,596) (6,158) Less: Change in Core Working Capital (1) (4,283) (1,139) Less: Pension Payments (2) (8,880) (9,420) Free Cash Flow $ 109,108 $ 84,101 Market Capitalization (3) $ 1,123,068 $ 1,123,068 Free Cash Flow Yield (4) 9.7% 7.5% (1) Represents the impact of total cash flows associated with the change in accounts receivable, inventory and accounts payable, as per the Consolidated Statements of Cash Flows (2) Represents cash payments made for the Field Group Pension Plan in the United Kingdom (3) Represents estimated market capitalization using total shares outstanding as of June 30, 2016 (77,452,946) times estimated market price of MPSX shares ($14.50 per share) (4) Represents Free Cash Flow divided by Market Capitalization |
|
|
Solutions that Protect and Promote the World’s Great Brands 4Q 2016 Earnings Webcast Thank you for your interest in Multi Packaging Solutions |