Attached files
| file | filename |
|---|---|
| 8-K - 8-K - AgroFresh Solutions, Inc. | a081116form8-kjefferies.htm |

AgroFresh Solutions, Inc.
Jefferies Industrials Conference
August 11, 2016

2
In addition to historical information, this presentation contain “forward-looking statements” within the meaning of the “safe harbor” provisions of the United States
Private Securities Litigation Reform Act of 1995. All statements, other than statements of historical facts, included in this presentation that address activities, events or
developments that the Company expects or anticipates will or may occur in the future are forward-looking statements and are identified with, but not limited to, words
such as “anticipate”, “believe”, “expect”, “estimate”, “plan”, “outlook”, and “project” and other similar expressions (or the negative versions of such words or
expressions). Forward-looking statements include, without limitation, information concerning the Company’s possible or assumed future results of operations,
including all statements regarding financial guidance, anticipated future growth, business strategies, competitive position, industry environment, potential growth
opportunities and the effects of regulation. These statements are based on management’s current expectations and beliefs, as well as a number of assumptions
concerning future events. Such forward-looking statements are subject to known and unknown risks, uncertainties, assumptions and other important factors, many of
which are outside the Company’s management’s control that could cause actual results to differ materially from the results discussed in the forward-looking
statements. These risks include, without limitation, the risk of increased competition and the ability of the business to grow and manage growth profitably; costs
related to the Company’s transaction with The Dow Chemical Company (“Dow”) consummated on July 31, 2015 (the “Business Combination”) and/or related to
operating AgroFresh as a stand-alone public company; changes in applicable laws or regulations, and the possibility that the Company may be adversely affected by
other economic, business, and/or competitive factors. Some of these risks and uncertainties are identified and discussed in the Company’s filings with the SEC,
including the Annual Report on Form 10-K filed on March 11, 2016, available at the SEC’s website at www.sec.gov.
As a result of the Business Combination, the Company was identified as the acquirer for accounting purposes, and the AgroFresh Business, which is the business
conducted prior to the closing of the Business Combination by Dow through a combination of wholly-owned subsidiaries and operations of Dow, including through
AgroFresh Inc. in the United States, is the acquiree and accounting Predecessor. The Company’s financial statement presentation reflects the AgroFresh Business as
the “Predecessor” for periods through July 31, 2015 (the “Closing Date”). On the Closing Date, the Company, which was formerly named Boulevard Acquisition Corp.,
was re-named AgroFresh Solutions, Inc. and is the “Successor” for periods after the Closing Date, which includes consolidation of the AgroFresh Business
subsequent to the Closing Date. The acquisition was accounted for as a business combination using the acquisition method of accounting, and the Successor
financial statements reflect a new basis of accounting that is based on the fair value of net assets acquired. As a result of the application of the acquisition method of
accounting as of the effective time of the Business Combination, the financial statements for the Predecessor period and for the Successor period are presented on
different bases. The historical financial information of Boulevard Acquisition Corp. prior to the Business Combination has not been reflected in the Predecessor period
financial statements as those amounts are not considered to be material.
This presentation contains certain financial measures, in particular Adjusted EBITDA, which are not presented in accordance with GAAP. These non-GAAP financial
measures are being presented because the Company believes these non-GAAP financial measures provide meaningful supplemental information that is used by the
Company’s management to evaluate the Company’s performance. Management believes that these measures enhance a reader’s understanding of the financial
performance of the Company, are more indicative of operating performance of the Company, and facilitate a better comparison among fiscal periods, as the non-
GAAP measures exclude items that are not considered core to the Company’s operations. In particular, Adjusted EBITDA is a key measure used by the Company to
evaluate its performance, and is calculated by the Company in a manner consistent with the definition of Consolidated EBITDA in the Company’s Credit Agreement.
The Company does not intend for any of the non-GAAP financial measures contained in this presentation to be a substitute for any GAAP financial information.
Readers of this presentation should use these non-GAAP financial measures only in conjunction with the comparable GAAP financial measures. A reconciliation of
non-GAAP Adjusted EBITDA to the most comparable GAAP measure is provided in the appendix to this presentation.
SmartFresh, Harvista, RipeLock, AdvanStore and LandSpring are trademarks of AgroFresh Solutions, Inc.
Safe Harbor

3
• Secular growth story addressing
global trends in food production and
consumption
• Transformative 1-MCP technology
used today primarily to preserve
apples using SmartFreshTM
• Industry leader operating with capital
light, high service driven, direct sales
business model to diversified
customer base >3,000 customers
• Focus on expansion with
SmartFreshTM comprising ~90% of
current sales
• Significant growth potential with 80%
gross margins and 50+% EBITDA
margins
AgroFresh Provides Solutions for Food Freshness
Apples 87%
Pears 6%
Kiwis 2%
Flowers 2%
Other 3%
North America 36%
EMEA 40%
Latin America 15%
Asia Pacific 9%
FY2015 Revenue by Crop
FY2015 Revenue by Region

4
AgroFresh Holds Leadership Position
with High Service Business Model
Solid
Financial
Profile
• Asset-light business model and proprietary technologies generate strong margins and cash flow
• Consistent cash flow supports leverage profile and funding of future acquisitions
• New technologies expected to drive sustained, profitable growth
• Strong underlying global demand dynamics
• Growth driven by penetration and adoption of current technologies with existing customers,
current and new geographies, and additional crops
• Additional acquisition-driven growth from adjacent technologies and services
Attractive
Growth
Potential
• Over a decade of delivering technologies, services and expertise to produce market
• 400+ registrations in 45+ countries
• $100+ million invested in our technologies during the past 10 years
Proven
Solutions
• Low-cost, high-impact solutions throughout value chain
• Compelling return on investment for customers
• Offerings changed the game on providing consumers year-round access to produce
• Long-term relationships and proven performance results in high customer satisfaction
Compelling
Customer
Benefits

5
Fruits &
Vegetables
Cereals Milk & Dairy
Products
Roots & Tubers Meat Oilseeds &
Pulses
Fish Total
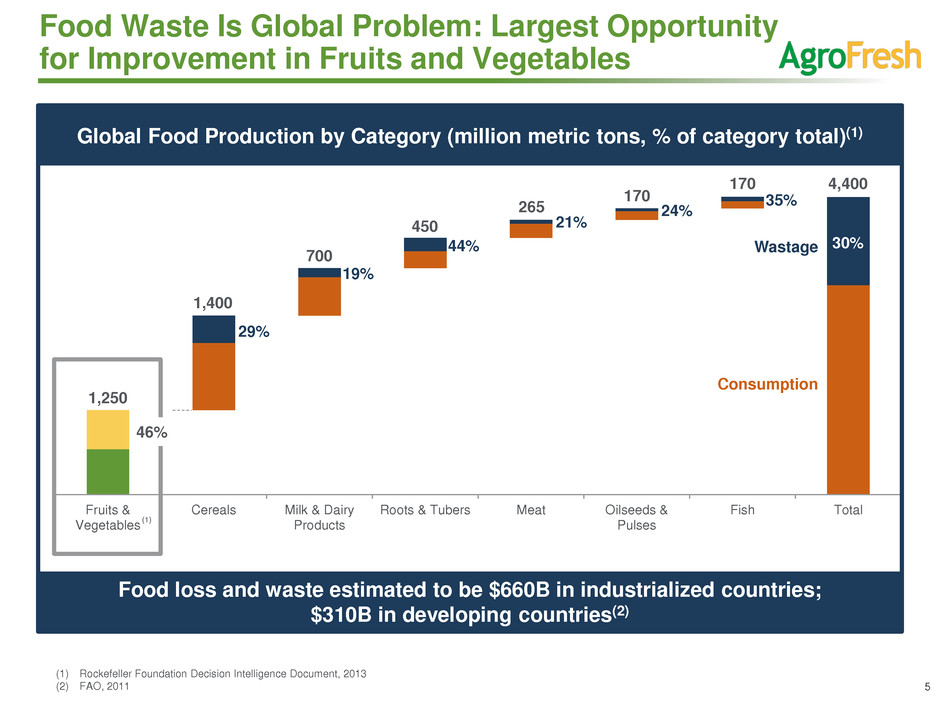
Food Waste Is Global Problem: Largest Opportunity
for Improvement in Fruits and Vegetables
Food loss and waste estimated to be $660B in industrialized countries;
$310B in developing countries(2)
1,400
700
1,250
450
265
170
170 4,400
29%
19%
44%
21%
24%
35%
30% Wastage
Consumption
46%
(1) Rockefeller Foundation Decision Intelligence Document, 2013
(2) FAO, 2011
(1)
Global Food Production by Category (million metric tons, % of category total)(1)

6
AgroFresh Addresses All Five
Supply Chain Points of Food Loss
Source: NRDC, 2012; FAO, 2011
2%
11%
20%
3%
3%
Grain Products
Seafood
Fruits & Vegetables
Meat
Milk
2%
0.5%
3%
2%
0.25%
Grain Products
Seafood
Fruits & Vegetables
Meat
Milk
10%
5%
1%
4%
0.5%
Grain Products
Seafood
Fruits & Vegetables
Meat
Milk
2%
9.5%
12%
4%
0.25%
Grain Products
Seafood
Fruits & Vegetables
Meat
Milk
27%
28%
12%
17%
Grain Products
Seafood
Fruits & Vegetables
Meat
Milk
Production
Losses
Postharvest,
Handling and
Storage Losses
Processing and
Packaging
Losses
Distribution and
Retail Losses
Consumer
Losses
33%

7
Bananas
and
apples
are high
in
volume,
but lower
in value
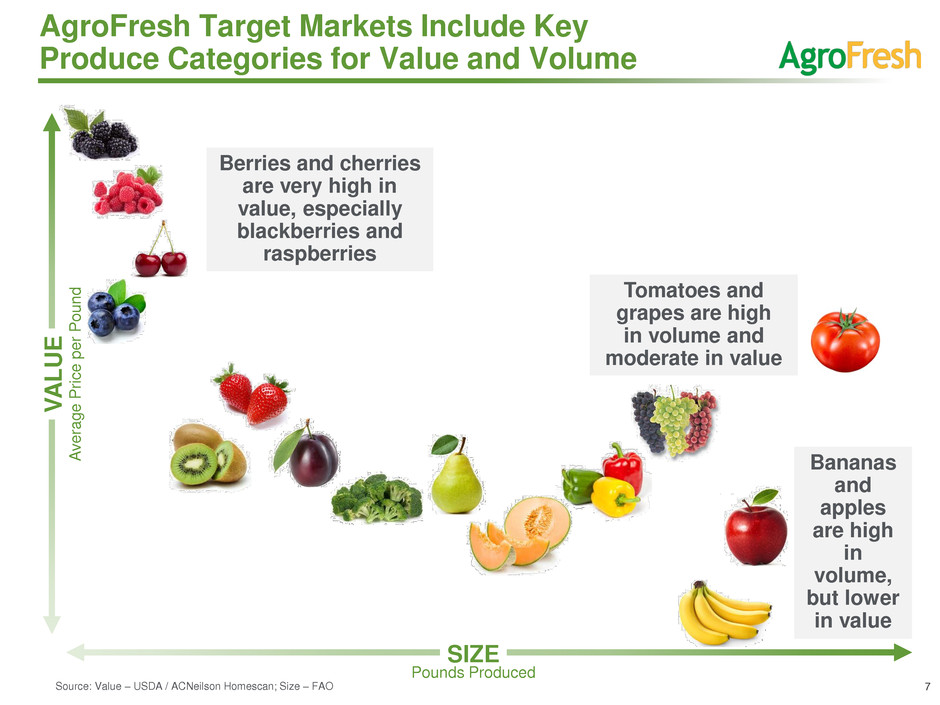
AgroFresh Target Markets Include Key
Produce Categories for Value and Volume
V
A
LU
E
SIZE
Pounds Produced
A
v
e
ra
g
e
P
ri
c
e
p
e
r
P
o
u
n
d
Berries and cherries
are very high in
value, especially
blackberries and
raspberries
Tomatoes and
grapes are high
in volume and
moderate in value
Source: Value – USDA / ACNeilson Homescan; Size – FAO

8
Global Pear Production
(excluding China and Iran)
(metric tons in millions)
Global Apple Production
(excluding China and Iran)
(metric tons in millions)
Global Apple and Pear Production are
Top Two Segments for AgroFresh Today
30.4
32.0
31.4
32.4
33.8
32.3
2010 2011 2012 2013 2014 2015
6.6
7.0
6.0
6.5 6.4 6.3
2010 2011 2012 2013 2014 2015
Source: USDA

9
Proprietary 1-MCP Technology Preserves
and Enhances Quality of Fruit
Current Portfolio New Product Launches
Product
Function Maintains fruit
quality post-
harvest during
storage and
transport
Pre-harvest
application to
maximize peak
ripening, fruit
quality and
harvest
management
Regulates
banana
ripening,
benefiting
retailers and
consumers
Proprietary
sensor
technology and
analytics to
optimize fruit
storage
Improves
seedling vigor
and produce
yields
Key
Markets
Apples, pears Apples, pears Bananas Apples, pears Tomatoes,
peppers
Status Market leader Launching in
four countries in
2016
Product trials
under way with
key customers
Prototype
scheduled for
Q3 introduction
Announced in
July; initial sales
expected in H2
2016
1-MCP Underpins Five Product Offerings that Drive Growth

10
Strong market position driven by differentiated
technologies, customer-focused service model and
deeply-ingrained customer relationships
Ethylene Control Product Sales
For Apple Treatment(1)
~25%
of AgroFresh sales under no or
limited patent protection(1)
SmartFresh and Harvista Provide
Unparalleled Performance and Service
All Others
SmartFreshTM α-CD Encapsulated 1-MCP
Preferred Method of Ethylene Control Delivery
▼ Produced on site by mixing numerous chemicals
▼ Requires two-step application process
Gas
1-MCP
▼ Requires specialized handling and storage
▼ Must be transported at extremely low
temperatures
Liquid
1-MCP
▲ Accurate and consistent dosing and application
▲ Easy to store and transport
▲ Consistent quality and purity
α-CD
Encapsulated
1-MCP
80% +
gross margins in countries with
and without patent protection(2)
97%
(1) Management estimate
(2) Includes countries with both molecule and encapsulation patents and just encapsulation patents.

11
Long-term, RipeLock expected
to add $25M in sales by 2020
Registrations for RipeLock
technology held in countries that
import estimated 16.5 billion
pounds of bananas annually
RipeLock Opens Adjacent Space in Bananas
• RipeLock couples 1-MCP technology with
unique packaging system to control
ripening and reduce spoilage
• Creates value from post-harvest through
shipment; from retail store to consumer
• Trials with 20 retail customers being
completed in 2016
• Production sales expected by year-end
• Along value chain, various partners could
experience a 3-to-6 times return on
investment
Target market is traded volume
of bananas: ~22 billion pounds
imported into U.S. and Europe
More than 230 billion pounds
of bananas produced annually
globally

12
Extensions into New Crops
Early Signals of Expansion Strategy
Market Need
Reduces transplant shock, resulting in
less seedling mortality and faster crop
establishment, which leads to a
healthier crop
Provides customers with a natural
solution to improve storage stability and
shelf life, effectively suppressing the
spread of fungal pathogens and the
resulting damages
Value Created Increased crop yield Extends post-harvest lifespan
Crops Served Tomatoes, peppers Grapes, strawberries, raspberries and blackberries
Launch Status Initial sales expected in Q3 2016 Sales expected in 1-to-2 years
Patent or
Registration Data
Registered in Florida; registration
package filed in California
Registration in Israel currently; further
registrations to be sought in U.S., Latin
America and Europe.

13
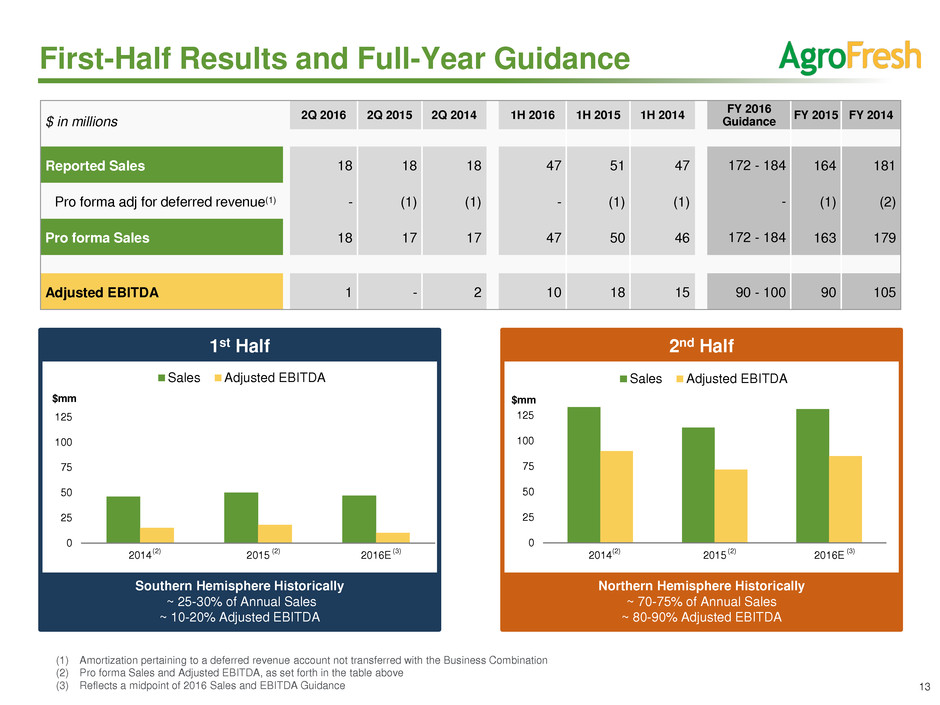
First-Half Results and Full-Year Guidance
0
25
50
75
100
125
2014 2015 2016E
$mm
Sales Adjusted EBITDA
0
25
50
75
100
125
2014 2015 2016E
$mm
Sales Adjusted EBITDA
Southern Hemisphere Historically
~ 25-30% of Annual Sales
~ 10-20% Adjusted EBITDA
Northern Hemisphere Historically
~ 70-75% of Annual Sales
~ 80-90% Adjusted EBITDA
(1) Amortization pertaining to a deferred revenue account not transferred with the Business Combination
(2) Pro forma Sales and Adjusted EBITDA, as set forth in the table above
(3) Reflects a midpoint of 2016 Sales and EBITDA Guidance
(2) (3) (2) (3) (2) (2)
1st Half 2nd Half
$ in millions
2Q 2016 2Q 2015 2Q 2014 1H 2016 1H 2015 1H 2014
FY 2016
Guidance
FY 2015 FY 2014
Reported Sales
18 18 18 47 51 47 172 - 184 164 181
Pro forma adj for deferred revenue(1)
- (1) (1) - (1) (1) - (1) (2)
Pro forma Sales
18 17 17 47 50 46 172 - 184 163 179
Adjusted EBITDA
1 - 2 10 18 15 90 - 100 90 105

14
~25 - 30%
Historically
~80 - 90%
Historically
~10 - 20%
Historically
EBITDA
~70 - 75%
Historically
REVENUE
Apple Production Seasons Creates Significant
Cyclicality for AgroFresh Services
Northern Hemisphere
Southern Hemisphere
HarvistaTM Sales
HarvistaTM Sales
SmartFreshTM Sales
Jan Feb Mar Apr May Jun Jul Aug Sep Oct Nov Dec
Flowering Fruit Set and
Growing
Harvest Storage 1-12 Months
Flowering Harvest Fruit Set and Growing
Storage 1-12
Months Storage 1-12 Months
Fruit Set and
Growing
SmartFreshTM Sales
TM Trademark of AgroFresh

15
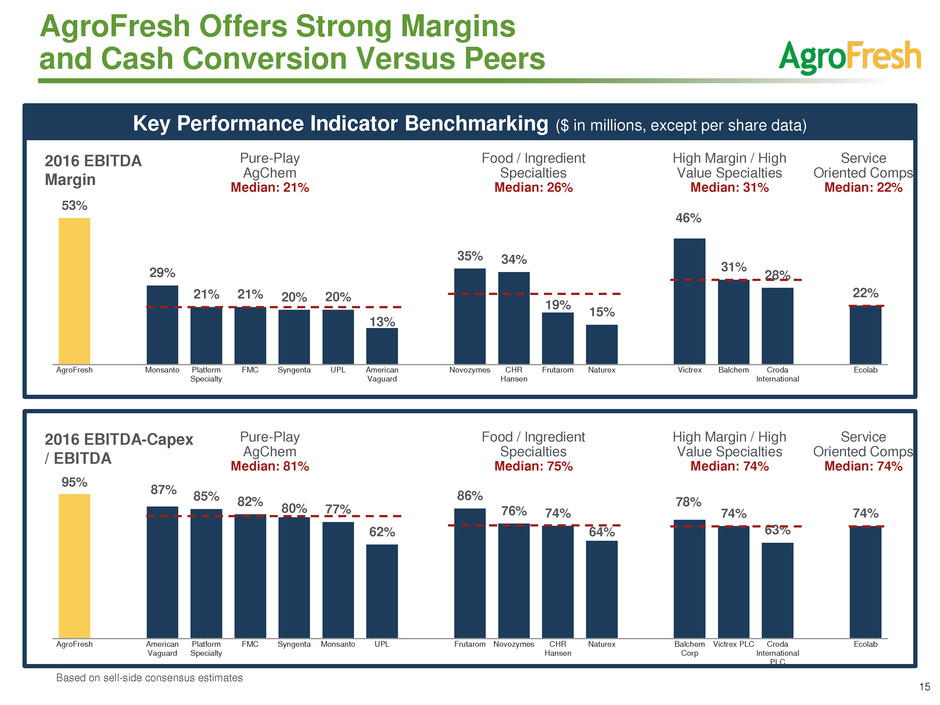
AgroFresh Offers Strong Margins
and Cash Conversion Versus Peers
Key Performance Indicator Benchmarking ($ in millions, except per share data)
95%
87%
85% 82%
80% 77%
62%
86%
76% 74%
64%
78%
74%
63%
74%
AgroFresh American
Vaguard
Platform
Specialty
FMC Syngenta Monsanto UPL Frutarom Novozymes CHR
Hansen
Naturex Balchem
Corp
Victrex PLC Croda
International
PLC
Ecolab
Pure-Play
AgChem
Median: 81%
Food / Ingredient
Specialties
Median: 75%
High Margin / High
Value Specialties
Median: 74%
Service
Oriented Comps
Median: 74%
2016 EBITDA-Capex
/ EBITDA
53%
29%
21% 21% 20% 20%
13%
35% 34%
19%
15%
46%
31%
28%
22%
AgroFresh Monsanto Platform
Specialty
FMC Syngenta UPL American
Vaguard
Novozymes CHR
Hansen
Frutarom Naturex Victrex Balchem Croda
International
Ecolab
Pure-Play
AgChem
Median: 21%
Food / Ingredient
Specialties
Median: 26%
High Margin / High
Value Specialties
Median: 31%
Service
Oriented Comps
Median: 22%
2016 EBITDA
Margin
Based on sell-side consensus estimates

16
AgroFresh Provides Solutions for Food Freshness
• Secular growth story addressing
global trends in food production and
consumption
• Transformative 1-MCP technology
used today primarily to preserve
apples using SmartFreshTM
• Industry leader operating with capital
light, high service driven, direct sales
business model to diversified
customer base >3,000 customers
• Focus on expansion with
SmartFreshTM comprising ~90% of
current sales
• Significant growth potential with 80%
gross margins and 50+% EBITDA
margins
Apples 87%
Pears 6%
Kiwis 2%
Flowers 2%
Other 3%
North America 36%
EMEA 40%
Latin America 15%
Asia Pacific 9%
FY2015 Revenue by Crop
FY2015 Revenue by Region

17
Appendix
Reg G Reconciliation of U.S. GAAP
to non-GAAP Financial Measures

18
Reg G Reconciliation
The following is a reconciliation between the non-GAAP financial measure of Adjusted EBITDA to its most directly comparable GAAP financial
measure, net loss:
*During the three months ended June 30, 2016, the Company identified certain additional non-recurring professional fees and other costs that were not previously included as add-backs in
the Company's calculation of Adjusted EBITDA but are included in the above calculation for the three and six months ended June 30, 2016. Approximately $0.5 million of such non-recurring
professional fees and other costs were incurred during the three months ended March 31, 2016. Such amounts are included as an add-back to net income to calculate Adjusted EBITDA for
the six months ended June 30, 2016. Had such amounts been included in the calculation of Adjusted EBITDA for the three months ended March 31, 2016 as previously reported by the
Company, Adjusted EBITDA for such period would have been $9.0 million, as compared to the $8.5 million originally reported.
(1) The amortization of inventory step-up related to the acquisition of AgroFresh is charged to income based on the pace of inventory usage.
(2) Expenses incurred during the period added back to EBITDA related to equity compensation, depreciation and amortization largely associated with the asset step-up and other non-recurring
expenses incurred during the period.
(3) Interest paid on the term loan, inclusive of accretion for debt discounts, debt issuance costs and contingent consideration.
(4) Non-recurring professional fees associated with becoming a stand-alone public company.
(5) R&D savings related to two projects (Invinsa and IDC).
(6) Severance costs related to our former Chief Executive Officer, former President, and other personnel, including the net share-based compensation cost due to acceleration of vesting on
restricted stock and forfeiture of stock options.
(7) Non-cash fair value measurement adjustment related to the contingent earn-out liability.
(8) Deferred revenue associated with a revenue agreement not included in the Business Combination.
