Attached files
| file | filename |
|---|---|
| EX-99.1 - EX-99.1 - LANDAUER INC | ldr-20160809xex99_1.htm |
| 8-K - 8-K - LANDAUER INC | ldr-20160809x8k.htm |
 Investor Presentation February 2016
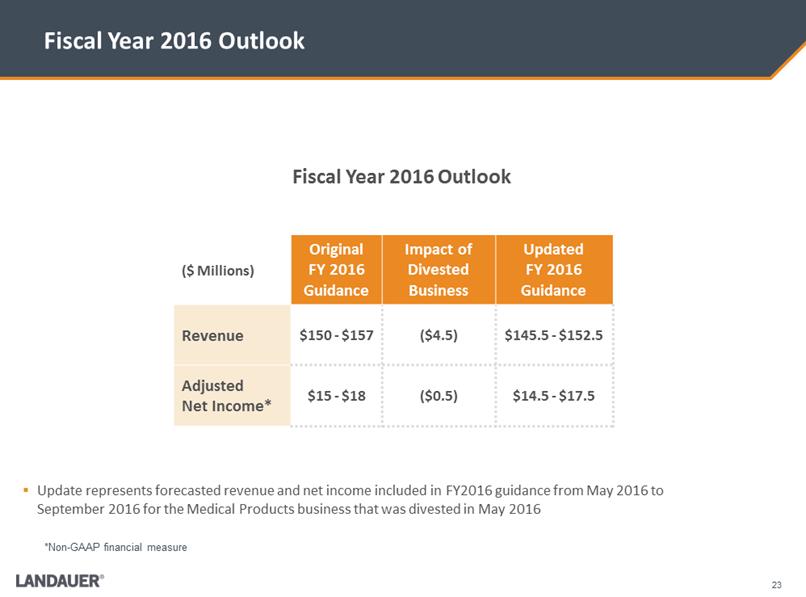
2 Safe Ha  f the information shared here (including, in particular, the section titled “Fiscal 2016
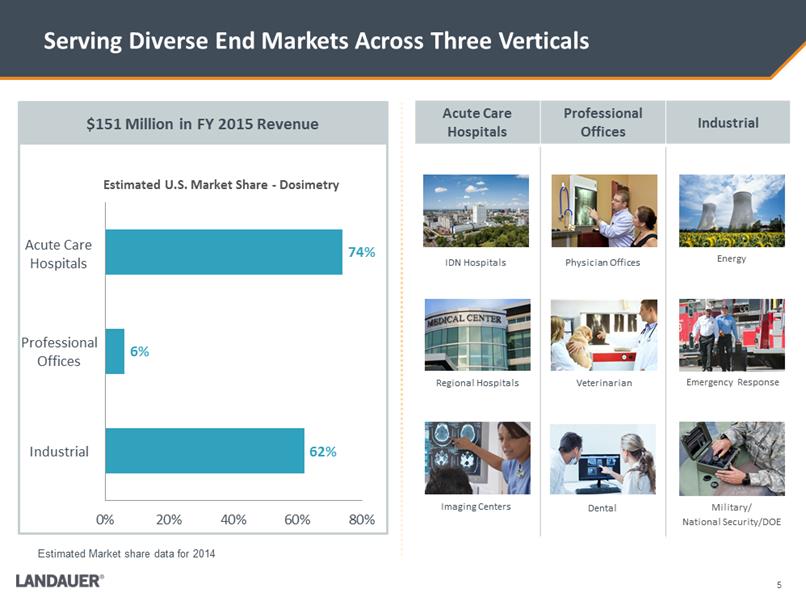
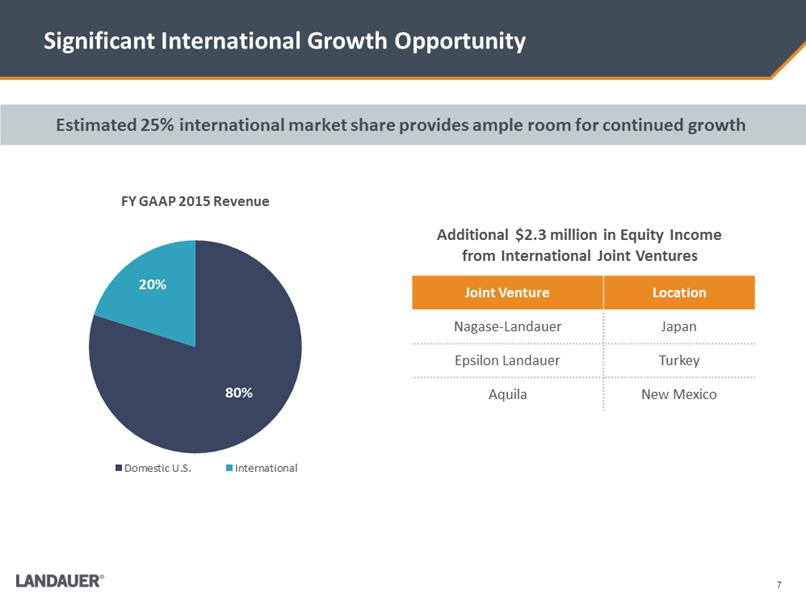
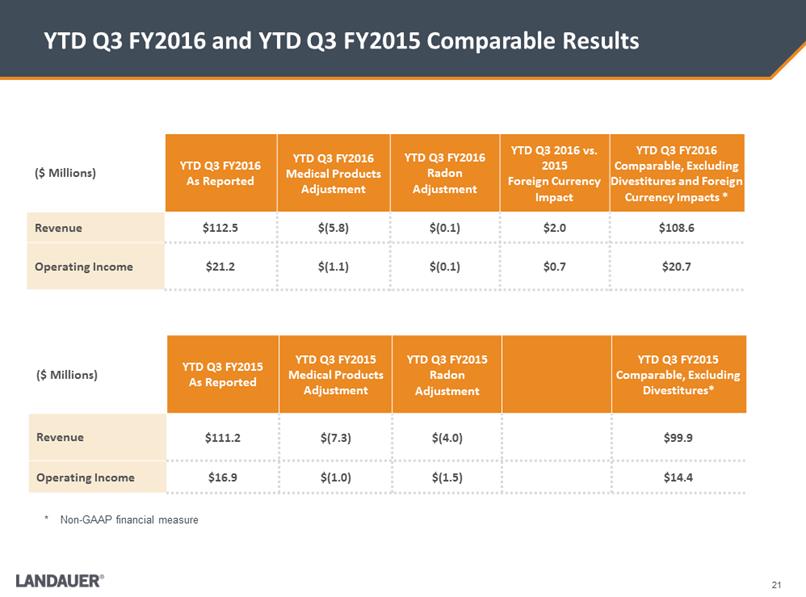
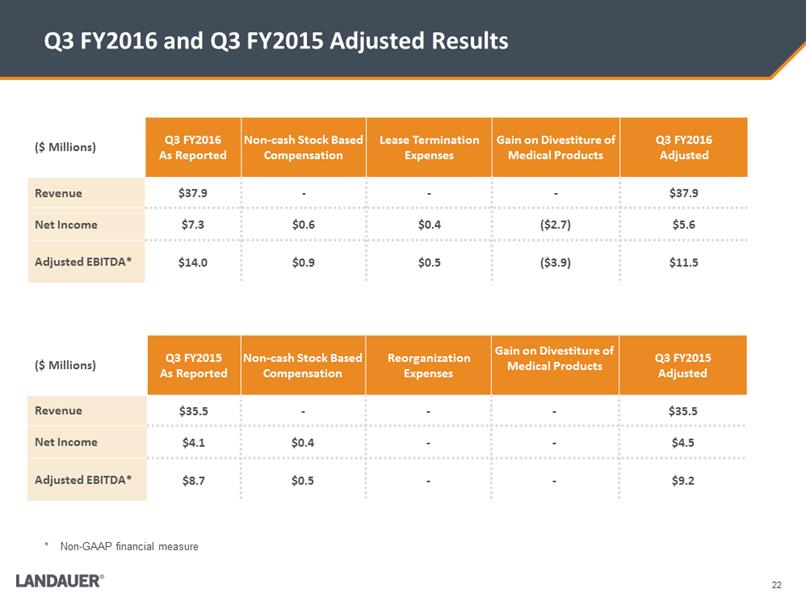
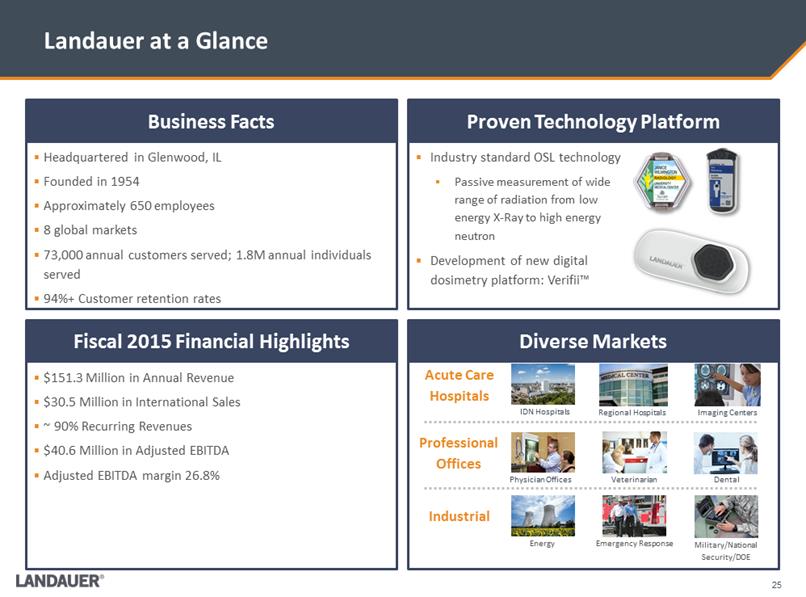
 Outlook”) constitutes forward-looking statements that are based on assumptions and involve certain risks and uncertainties. These include the following, without limitation: assumptions, risks and uncertainties associated with the Company’s future performance, the Company’s development and introduction of new technologies in general; the ability to protect and utilize the Company’s intellectual property; continued customer acceptance of the InLight technology; the adaptability of optically stimulated luminescence (OSL) technology to new platforms and formats; military and other government funding for the purchase of certain of the Company’s equipment and services; the impact on sales and pricing of certain customer group purchasing arrangements; changes in spending or reimbursement for medical products or services; the costs associated with the Company’s research and business development efforts; the usefulness of older technologies and related licenses and intellectual property; the effectiveness of and costs associated with the Company’s IT platform enhancements and investments in cyber security enhancements; the anticipated results of operations of the Company and its subsidiaries or ventures; valuation of the Company’s long-lived assets or business units relative to future cash flows; changes in pricing of services and products; changes in postal and delivery practices; the Company’s business plans; anticipated revenue and cost growth; the Appendix Business Facts Proven Technology Platform Fiscal 2015 Financial Highlights Diverse Markets .$151.3 Million in Annual Revenue .$30.5 Million in International Sales .~ 90% Recurring Revenues .$40.6 Million in Adjusted EBITDA .Adjusted EBITDA margin 26.8% .Headquartered in Glenwood, IL .Founded in 1954 .Approximately 650 employees .8 global markets .73,000 annual customers served; 1.8M annual individuals served .94%+ Customer retention rates Luxel_Waist.pnginlight_clip_holder_front_L.png.Industry standard OSL technology .Passive measurement of wide range of radiation from low energy X-Ray to high energy neutron .Development of new digital dosimetry platform: Verifii™ Landauer at a Glance 23 C:\Users\mdegraff\AppData\Local\Microsoft\Windows\Temporary Internet Files\Content.Outlook\EQH1N7PW\Dosimeter.2.pngIDN Hospitals Imaging Centers Regional Hospitals Physician Offices Veterinarian Dental Energy Emergency Response Military/National Security/DOE W:\Landauer\Investors\Investor deck\Images\73470968_5.jpgW:\Landauer\Investors\Investor deck\Images\L41513.2429.jpgAcute Care Hospitals Professional Offices Industrial Adjusted EBITDA is presented here not as an alternative to net income, but rather as a measure of the Company’s operating performance and is not intended to be a presentation in accordance with GAAP. Since EBITDA (generally, net income plus interest expenses, taxes, depreciation and amortization) is not calculated identically by all companies, this presentation may not be comparable to EBITDA or Adjusted EBITDA presentations disclosed by other companies. Adjusted EBITDA represents net income with adjustments for net financing costs, depreciation and amortization, provision for income taxes, stock compensation expense, goodwill and other intangible assets impairments, loss on disposition of business, transaction expenses and acquisition, reorganization and nonrecurring costs. Management believes that Adjusted EBITDA is useful in evaluating the Company’s operating performance compared to that of other companies in its industry because the calculation of Adjusted EBITDA generally eliminates the effects of certain non-cash and other items that may vary for different companies for reasons unrelated to overall operating performance. In addition, the Company’s management used Adjusted Net Income as a measure of earnings to eliminate the effects of certain non-cash and nonrecurring items of the Company. Adjusted Net Income represents net income with tax-effected adjustments for stock compensation expense, goodwill and other intangible assets impairments, loss on disposition of business, transaction expenses and acquisition, reorganization and nonrecurring costs. However, Adjusted EBITDA and Adjusted Net Income are not recognized measurements under GAAP and should not be considered as an alternative to the most
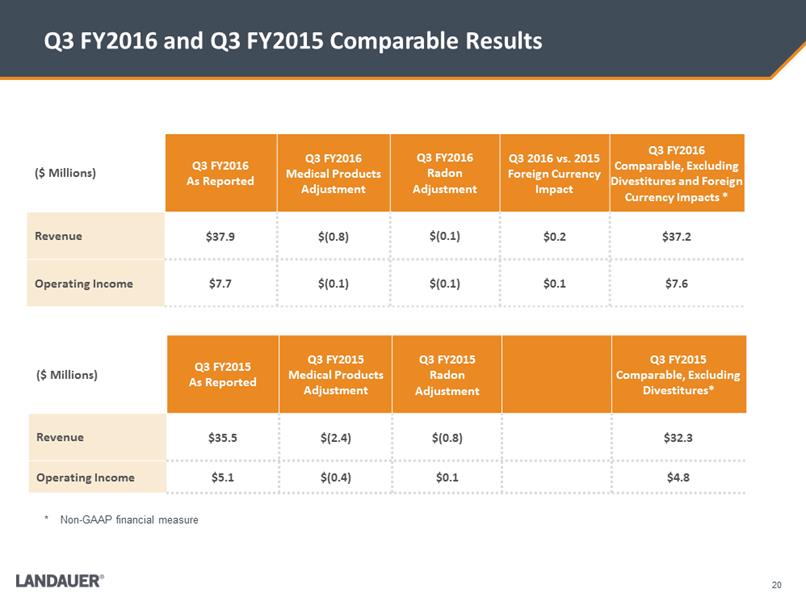
 directly comparable measures presented in accordance with GAAP. A reconciliation of these non-GAAP measures to the most directly comparable GAAP measures is included above. Use of Non-GAAP Financial Measures