Attached files
| file | filename |
|---|---|
| EX-32.2 - EX-32.2 - LANDAUER INC | ldr-20150930xex322.htm |
| EX-31.1 - EX-31.1 - LANDAUER INC | ldr-20150930xex311.htm |
| EX-32.1 - EX-32.1 - LANDAUER INC | ldr-20150930xex321.htm |
| EX-31.2 - EX-31.2 - LANDAUER INC | ldr-20150930xex312.htm |
| EX-21 - EX-21 - LANDAUER INC | ldr-20150930ex2170e03e2.htm |
| EX-23.(A) - EX-23.(A) - LANDAUER INC | ldr-20150930ex23a97a317.htm |
| EX-23.(B) - EX-23.(B) - LANDAUER INC | ldr-20150930ex23b3a4387.htm |
Securities and Exchange Commission
Washington, DC 20549
form 10-K
[ X ] ANNUAL REPORT PURSUANT TO SECTION 13 OR 15(d) OF THE SECURITIES EXCHANGE ACT OF 1934
For the fiscal year ended September 30, 2015
or
[ ] TRANSITION REPORT PURSUANT TO SECTION 13 OR 15(d) OF THE SECURITIES EXCHANGE ACT OF 1934
For the transition period from ________ to ________
Commission File Number 1-9788
LANDAUER, INC.
(Exact Name of Registrant as Specified in Its Charter)
|
Delaware |
06-1218089 |
|
(State or Other Jurisdiction of Incorporation or Organization) |
(I.R.S. Employer Identification No.) |
2 Science Road, Glenwood, Illinois 60425
(Address of Principal Executive Offices and Zip Code)
Registrant’s Telephone Number, Including Area Code: (708) 755-7000
Securities registered pursuant to Section 12(b) of the Act:
|
Common Stock with Par Value of $.10 |
New York Stock Exchange |
|
(Title of each class) |
(Name of exchange on which registered) |
Securities registered pursuant to Section 12(g) of the Act: None
Indicate by check mark if the registrant is a well-known seasoned issuer, as defined in Rule 405 of the Securities Act. Yes [ ] No [ X ]
Indicate by check mark if the registrant is not required to file reports pursuant to Section 13 or Section 15(d) of the Act. Yes [ ] No [ X ]
Indicate by check mark whether the registrant (1) has filed all reports required to be filed by Section 13 or 15(d) of the Securities Exchange Act of 1934 during the preceding 12 months (or for such shorter period that the registrant was required to file such reports), and (2) has been subject to such filing requirements for the past 90 days. Yes [ X ] No [ ]
Indicate by check mark whether the registrant has submitted electronically and posted on its corporate Web site, if any, every Interactive Data File required to be submitted and posted pursuant to Rule 405 of Regulation S-T (§ 232.405 of this chapter) during the preceding 12 months (or for such shorter period that the registrant was required to submit and post such files). Yes [ X ] No [ ]
Indicate by check mark if disclosure of delinquent filers pursuant to Item 405 of Regulation S-K (§ 229.405 of this chapter) is not contained herein, and will not be contained, to the best of registrant’s knowledge, in definitive proxy or information statements incorporated by reference in Part III of this Form 10-K or any amendment to this Form 10-K. [ X ]
1
Indicate by check mark whether the registrant is a large accelerated filer, an accelerated filer, a non-accelerated filer, or a smaller reporting company. See the definitions of “large accelerated filer,” “accelerated filer” and “smaller reporting company” in Rule 12b-2 of the Exchange Act.
|
|
Large accelerated filer |
[ ] |
|
Accelerated filer |
[ X ] |
|
|
|
Non-accelerated filer |
[ ] |
|
Smaller reporting company |
[ ] |
|
|
|
(Do not check if a smaller reporting company) |
|
|
|
||
Indicate by check mark whether the registrant is a shell company (as defined in Rule 12b-2 of the Act). Yes [ ] No [ X ]
As of March 31, 2015 the aggregate market value, based upon the closing price on the New York Stock Exchange, of the voting and non-voting common equity held by non-affiliates was approximately $334,000,000. The number of shares of common stock ($0.10 par value) outstanding as of December 10, 2015 was 9,568,051.
DOCUMENTS INCORPORATED BY REFERENCE
Certain information required for Part III of this Annual Report on Form 10-K is incorporated herein by reference to the Registrant’s definitive Proxy Statement in connection with the 2016 Annual Meeting of Stockholders (the “Proxy Statement”).
2
Landauer, Inc.
Table of Contents
For the Fiscal Year Ended September 30, 2015
|
|
|
|
|
|
|
Page |
|
4 |
||
|
|
|
|
|
PART I |
|
|
|
Item 1. |
4 |
|
|
|
4 |
|
|
|
6 |
|
|
|
7 |
|
|
|
7 |
|
|
|
7 |
|
|
|
8 |
|
|
|
8 |
|
|
|
8 |
|
|
|
9 |
|
|
|
11 |
|
|
|
11 |
|
|
Item 1A. |
12 |
|
|
Item 1B. |
21 |
|
|
Item 2. |
22 |
|
|
Item 3. |
22 |
|
|
Item 4. |
22 |
|
|
PART II |
||
|
Item 5. |
23 |
|
|
Item 6. |
27 |
|
|
Item 7. |
Management’s Discussion and Analysis of Financial Condition and Results of Operations |
28 |
|
Item 7A. |
40 |
|
|
Item 8. |
42 |
|
|
Item 9. |
Changes in and Disagreements With Accountants on Accounting and Financial Disclosure |
78 |
|
Item 9A. |
79 |
|
|
Item 9B. |
83 |
|
|
PART III |
||
|
Item 10. |
84 |
|
|
Item 11. |
84 |
|
|
Item 12. |
Security Ownership of Certain Beneficial Owners and Management and Related Stockholder Matters |
84 |
|
Item 13. |
Certain Relationships and Related Transactions, and Director Independence |
84 |
|
Item 14. |
84 |
|
|
PART IV |
||
|
Item 15. |
85 |
|
|
|
85 |
|
|
|
86 |
|
|
|
|
|
|
88 |
||
3
Forward-Looking Statements
Certain matters contained in this report constitute forward-looking statements that are based on certain assumptions and involve certain risks and uncertainties. These include the following, without limitation: assumptions, risks and uncertainties associated with the Company’s future performance; the Company’s development and introduction of new technologies in general; the ability to protect and utilize the Company’s intellectual property; events or circumstances which result in an impairment of assets, including but not limited to, goodwill and identifiable intangible assets; continued customer acceptance of the InLight technology; the adaptability of optically stimulated luminescence (“OSL”) technology to new platforms and formats; military and other government funding for the purchase of certain of the Company’s equipment and services; the impact on sales and pricing of certain customer group purchasing arrangements; changes in spending or reimbursement for medical products or services; the costs associated with the Company’s research and business development efforts; the usefulness of older technologies and related licenses and intellectual property; the effectiveness of and costs associated with the Company’s IT platform enhancements and investments in cyber security enhancements; the anticipated results of operations of the Company and its subsidiaries or joint ventures; valuation of the Company’s long-lived assets or reporting units relative to future cash flows; changes in pricing of services and products; changes in postal and delivery practices; the Company’s business plans; anticipated revenue and cost growth; the ability to integrate the operations of acquired businesses and to realize the expected benefits of acquisitions; the risks associated with conducting business internationally; costs incurred for potential acquisitions or similar transactions; other anticipated financial events; the effects of changing economic and competitive conditions, including instability in capital markets which could impact availability of short and long-term financing; the timing and extent of changes in interest rates; the level of borrowings; foreign exchange rates; government regulations; accreditation requirements; changes in the trading market that affect the costs of obligations under the Company’s benefit plans; and pending accounting pronouncements. These assumptions may not materialize to the extent assumed, and risks and uncertainties may cause actual results to be different from what is anticipated today. These risks and uncertainties also may result in changes to the Company’s business plans and prospects, and could create the need from time to time to write down the value of assets or otherwise cause the Company to incur unanticipated expenses. Additional information may be obtained by reviewing the information set forth in Item 1A. “Risk Factors” and Item 7A. “Quantitative and Qualitative Disclosures about Market Risk” and information contained in the Company’s reports filed, from time to time, with the Securities and Exchange Commission (“SEC”). The Company does not undertake, and expressly disclaims, any duty to update any forward-looking statement whether as a result of new information, future events or changes in the Company’s expectations, except as required by law.
PART I
Landauer, Inc. is a Delaware corporation organized on December 22, 1987. As used herein, the “Company,” “we,” “our,” “us” or “Landauer” refers to Landauer, Inc. and its subsidiaries. The Company’s common stock is listed on the New York Stock Exchange under the ticker symbol “LDR.”
Landauer is a leading global provider of technical and analytical services to determine occupational and environmental radiation exposure, the leading domestic provider of outsourced medical physics services, and a provider of radiology related medical products. Since November 2011, the Company has operated in three primary business segments: Radiation Measurement, Medical Physics and Medical Products.
Radiation Measurement
Radiation Measurement has been the core business for over 60 years. The Company has provided complete radiation dosimetry services to hospitals, medical and dental offices, universities, national laboratories, nuclear facilities and other industries in which radiation poses a potential threat to employees. Landauer’s services include the manufacture of various types of radiation detection monitors, the distribution and collection of the monitors to and from customers, and the analysis and reporting of exposure findings. These services are provided to approximately 1.8 million individuals globally. In addition to providing analytical services, the Company may sell
4
dosimetry detectors and reading equipment to large customers that want to manage their own dosimetry programs, or into smaller international markets in which it is not economical to establish a direct service.
The majority of Radiation Measurement revenues are realized from radiation measurement services and other services incidental to radiation dose measurement. The Company enters into agreements with customers to provide them with radiation measurement services, generally for a twelve-month period. Such agreements generally have a high renewal rate, resulting in customer relationships that are generally stable and recurring. As part of its services, the Company provides to its customers radiation detection badges, which are produced and owned by the Company. The badges are worn for a period selected by the customer (“wear period”), which is usually one, two, or three months in duration. At the end of the wear period, the badges are returned to the Company for analysis. The Company analyzes the badges that have been worn and provides the customer with a report indicating their radiation exposures. The Company recycles certain badge components for reuse, while also producing replacement badges on a continual basis.
The Company offers its service for measuring the dosages of x-ray, gamma radiation and other penetrating ionizing radiations to which the wearer has been exposed, primarily through badges, which contain OSL material, and are worn by customer personnel. This technology is marketed under the trade names Luxel+® and InLight®.
A key component of the Company’s dosimetry system is OSL crystal material. Radiation Measurement operates a crystal manufacturing facility in Stillwater, Oklahoma. The Company’s base OSL material is manufactured utilizing a proprietary process to create aluminum oxide crystals in a unique structure that is able to retain charged electrons following the crystal’s exposure to radiation.
Radiation Measurement’s InLight dosimetry system provides in-house and commercial laboratories with the ability to provide in-house radiation measurement services using OSL technology. InLight services may involve a customer acquiring dosimetry devices as well as analytical reading equipment from the Company. The system is based on the Company’s proprietary technology and instruments, and dosimetry devices developed in Japan. The InLight system allows customers the flexibility to tailor their precise dosimetry needs.
Radiation Measurement’s RadWatch and RadLight system provides the military and first responder user with a portable, field-ready option for tactical radiation monitoring using OSL technology. RadWatch and RadLight is offered through a joint venture with Yamasato, Fujiwara, Higa & Associates, Inc. (“YFH”), doing business as Aquila Group, a small business supplier to the International Atomic Energy Agency and the U.S. Military. The Company provides dosimetry parts to Aquila Group for their military contract. RadWatch and RadLight solution fulfills a recognized gap for acquiring a legal dose of record for radiation emergency response teams.
Other radiation measurement-related services augment the basic radiation measurement services that the Company offers, providing administrative and informational tools to customers for the management of their radiation safety programs.
Medical Physics
Medical physics services are provided through the Company’s Landauer Medical Physics (“LMP”) division. In November 2009, Landauer completed its first LMP acquisition by acquiring Global Physics Solutions, Inc. (“GPS”). In June 2010, Landauer, through its Medical Physics business segment, acquired the assets of Upstate Medical Physics (“UMP”), a provider of imaging physics services in upstate New York. In addition, four smaller regional practices were also acquired in fiscal 2011 and 2012 to augment the LMP operations. With primary offices in Illinois and New York, LMP has operations throughout the United States (“U.S.”).
The Company uses LMP as a platform to expand into the medical physics services market, serving domestic hospitals, radiation therapy centers and imaging centers. LMP is the leading nationwide service provider of clinical physics support, equipment commissioning and accreditation support and imaging equipment testing. Clinical physics support is provided by medical physicists, who individually focus on either imaging or therapeutic medical physics. Imaging physicists are concerned primarily with the radiation delivered by imaging equipment, image quality and compliance with safe practices in nuclear pharmacies. Therapeutic physicists are concerned with the safe delivery of radiation in cancer treatment. Therapeutic physicists contribute to the development of therapeutic
5
techniques, collaborate with radiation oncologists to design treatment plans, and monitor equipment and procedures to ensure that cancer patients receive the prescribed dose of radiation to the correct location. Both specialties are aligned with critical treatment trends in the continued increase in utilization of radiation for the diagnosis and treatment of disease. The ability to target treatments and reduce the impact of surgical procedures is often aided by imaging and therapeutic techniques. The Company reports the operating results of LMP in the Medical Physics reporting segment.
Medical Products
In November 2011, Landauer completed the acquisition of IZI Medical Products, LLC (“IZI”), which is headquartered in Maryland, as a platform to expand into the radiation oncology, radiology, and image guided surgery end markets of its Medical Products segment. IZI is a provider of high quality medical consumable accessories used in radiology, radiation therapy, and image guided surgical procedures. IZI’s medical accessories range from consumables used with magnetic resonance imaging (“MRI”), computed tomography (“CT”), and mammography technologies to highly engineered passive reflective markers used during image guided surgical procedures. In alignment with treatment trends which increasingly utilize radiation for the diagnosis and treatment of disease, as well as growing demand for minimally invasive procedures, IZI products provide the ability to increase procedural accuracy while decreasing procedural time. In December 2013, the Company completed the acquisition of ilumark GmbH, a German limited liability company (“ilumark”), which provides sterile, single-use retro-reflective navigation markers for image guided surgery systems using passive tracking technology. The Company reports the operating results of IZI and ilumark in the Medical Products reporting segment.
Landauer believes that its business is largely dependent upon the Company’s technical competence, the quality, reliability and price of its services and products, and its prompt and responsive service.
A summary of selected financial data for Landauer for the last five fiscal years is set forth in Part II – Item 6. “Selected Financial Data.” Financial information about geographic areas and segments is provided in Part II – Item 8. “Notes to Consolidated Financial Statements.”
Landauer’s Radiation Measurement services and products are marketed in the U.S. and Canada primarily by full-time Company personnel located in 11 sales regions. The Company’s non-U.S. and Canadian Radiation Measurement services and products are marketed through its wholly-owned subsidiaries operating in the United Kingdom, France and Sweden, its joint ventures in Japan and Turkey and its consolidated subsidiaries in Brazil, Australia, Mexico and China. Other firms and individuals market the Company’s radiation measurement products and services on a distributorship or commission basis, generally to small customers or in geographic regions in which the Company does not have a direct presence.
Worldwide, the Company’s Radiation Measurement segment serves approximately 51,000 customers representing approximately 1.8 million individuals annually. The customer base is diverse and fragmented with no single customer representing greater than 2% of revenue. Typically, a customer will contract on a subscription basis for one year of service in advance, representing monthly, bimonthly, quarterly, semi-annual or annual badges, readings and reports. Customer relationships in the radiation measurement market are generally stable and recurring. Details of the Company’s revenue recognition and deferred contract revenue policy are set forth in Part II – Item 7. “Management’s Discussion and Analysis of Financial Condition and Results of Operations – Critical Accounting Policies.”
The Company’s U.S. and Canadian Radiation Measurement services are largely based on the Luxel+ dosimeter system in which all analyses are performed at the Company’s laboratories in Glenwood, Illinois. Luxel+ employs the Company’s proprietary OSL technology. The Company’s InLight dosimetry system enables certain customers to make their own measurements using OSL technology.
For most radiation dosimetry laboratories operating around the world, the laboratory must maintain accreditation with a regulatory body to provide the user with a formal record of dose – a process that is expensive and time consuming. By combining the implementation of an InLight system in the laboratory and “dose of record” determination by Landauer or a Landauer affiliated and accredited facility, the user can provide its workers with the
6
periodic radiation safety management infrastructure without the need to maintain its own accreditation. Additionally, dosimetry management software options provide the ability to measure the incremental radiation dose of workers at regular intervals over long periods of time.
InLight also forms the basis for Landauer’s operations in Europe, Asia, and Latin America and other future operations that might occur where local requirements preclude using a U.S. or other foreign-based laboratory.
Medical Physics outsourced services are marketed to hospitals and free-standing cancer centers or free-standing imaging centers across the U.S. The Company’s medical physicists partner with other healthcare professionals to deliver services to address evolving technology, safety and regulatory needs, with the objective of improving patient outcomes through safe and effective use of radiation in medicine. The services are marketed to radiation oncology and imaging customers by a team of business development professionals supported by LMP’s senior leadership and physicists.
Medical Products medical devices are marketed to buyers at several stages along the supply chain including distributors, manufacturers of image guided navigation equipment, and product end users such as community hospitals, radiation oncology clinics, mammography clinics, and imaging centers. Products are marketed in the U.S. and Canada primarily by full-time Company telesales representatives located in Maryland. Outside of the U.S. and Canada, the Company primarily utilizes the companies that manufacture image-guided navigation equipment to market and distribute the navigation products. The Company uses distributors to sell its radiology and radiation therapy products.
The services provided by the Company to its Radiation Measurement customers are on-going and are of a subscription nature. As such, revenues are recognized in the periods in which such services are rendered, irrespective of whether invoiced in advance or in arrears. Given the subscription nature of Radiation Measurement services, quarterly revenues are fairly consistent.
There is no identifiable seasonality to the Company’s Medical Physics or Medical Products segments as their services and products are utilized in radiographic, radiation therapy and surgical procedures that are performed throughout the year.
Information regarding the Company’s activities by geographic region is contained in Part II – Item 8. “Notes to Consolidated Financial Statements.”
Patents, Proprietary Technologies and Licenses
The Company holds exclusive worldwide licenses to patent rights for certain technologies that measure and image radiation exposure to crystalline materials when stimulated with light. These licenses were acquired by the Company from Oklahoma State University (“OSU”) as part of collaborative efforts to develop and commercialize a new generation of radiation dosimetry technology. The underlying patents for these licenses expire in 2023. The OSU patents are specific to the stimulation process, imaging and data interpretation. As of September 30, 2015, the Company is using OSL technology to provide dosimetry services to the majority of its domestic and international customers. Landauer from time to time evaluates the continued need and benefits of licensing certain patent rights and may discontinue such licenses in instances where Landauer does not believe that such licenses remain necessary.
Additionally, the Company holds certain patents generated from the Company’s research and development activities that relate to various dosimeter designs, radiation measurement materials and methods, optical data storage techniques using aluminum oxide, and marking technologies used in radiology, radiation therapy and image-guided procedures. These patents expire between 2017 and 2035.
Rights to inventions of employees working for the Company are assigned to the Company.
7
Raw Materials
The Company has multiple sources for most of its raw materials and supplies, and believes that the number of sources and availability of these items are adequate. Landauer internally produces certain of its required materials, such as OSL detector materials and plastic badge holders. All crystal materials used in the Company’s OSL technology are produced at the Company’s crystal manufacturing facility in Stillwater, Oklahoma. The InLight dosimetry system and its components are manufactured by a Japanese company under an exclusive agreement. The Company sources the RadWatch and RadLight analytical instrument sold for military and emergency radiological response applications from its joint venture partner, YFH, on a sole source basis. The Company sources a key component of its medical products from a sole supplier. If the Company were to lose availability of its Stillwater facility or materials from its sole suppliers due to a fire, natural disaster or other disruptions, such loss could have a material adverse effect on the Company and its operations.
In the U.S., the Company competes against a number of dosimetry service providers. One of these providers is a division of Mirion Technologies, Inc., a significant competitor with substantial resources. Other competitors in the U.S. that provide dosimetry services tend to be smaller companies, some of which operate on a regional basis. Most government agencies in the U.S., such as the Department of Energy and Department of Defense, have their own in-house radiation measurement services, as do many large private nuclear power plants. Outside of the U.S., radiation measurement activities are conducted by a combination of private entities and government agencies.
The Company competes on the basis of advanced technologies, competent execution of these technologies, the quality, reliability and price of its services, and its prompt and responsive performance. The Company’s InLight dosimetry system competes with other dosimetry systems based on the technical advantages of OSL methods combined with an integrated systems approach featuring comprehensive software, automation and value. Changing market demand for combining active and passive dosimetry will be redefining the competition and the opportunities going forward.
Medical Physics outsourced services represent a large fragmented market where LMP has many small competitors. In addition, many facilities directly employ full-time physicists as an alternative for obtaining services from an outsourced provider. LMP competes with other outsourced medical physicists by having responsive regional practices that are backed by the safety, stability and standards of a global company. LMP offers a complementary alternative for clients who require support for their full-time staff in meeting patient care needs.
The Medical Products segment generally competes against a limited number of companies. Two of its primary competitors are a division of Roper Industries, Inc. and Medtronic, Inc., each of which is a significant competitor with substantial resources.
The Company’s technological expertise has been an important factor in its growth. The Company regularly pursues product improvements to maintain its technical position. The development of OSL dosimetry, announced in 1994, was funded by the Company in its collaborative effort with Battelle Memorial Institute and OSU. The Company commercialized this technology beginning in 1998 and has converted most of its customers to the technology. Current research efforts seek to expand the use of OSL technology, particularly as it applies to radiation measurements in therapeutic and imaging radiology and nuclear medicine as well as to environmental radiation dosimetry. In addition, the Company is evaluating new badge and InLight reader configurations that have military application and is designing a badge that will support global standardization.
The Company also participates regularly in several technical professional societies, both domestic and international, that are active in the fields of health physics and radiation detection and measurement.
The Company’s Medical Products segment has a product development process, which focuses on identifying products that will increase the accuracy of procedures and reduce procedural time. Current research efforts are focused on radiology products, which reduce radiation exposure to physicians and patients, as well as products that increase the accuracy of imaging by using reference markers.
8
The Company spent $4.6 million, $5.8 million, and $4.1 million in research and development activities during fiscal 2015, 2014 and 2013, respectively.
Domestic and International Regulations
The Company manufactures and markets products that are medical devices subject to regulation by numerous government agencies, including the U.S. Food and Drug Administration (“FDA”), and similar regulatory bodies outside the U.S. FDA regulations, and similar regulations outside the U.S., govern the following activities that the Company performs and will continue to perform: product design and development; document and purchasing controls; production and process controls; acceptance controls; product testing; product manufacturing; product safety; product labeling; product storage; recordkeeping; complaint handling; pre-market clearance; advertising and promotion; and product sales and distribution.
FDA pre-market clearance and approval requirements. Unless an exemption applies, each medical device the Company wishes to commercially distribute in the U.S. will require either prior 510(k) clearance or pre-market approval from the FDA. The FDA classifies medical devices into one of three classes. Devices deemed to pose lower risks are placed in either class I or II, which requires the manufacturer to submit to the FDA a pre-market notification to commercially distribute the device. This process is generally known as 510(k) clearance. Some low- risk devices are exempted from this requirement. Devices deemed by the FDA to pose the greatest risks, such as life-sustaining, life-supporting or implantable devices, or devices deemed not substantially equivalent to a previously cleared 510(k) device, are placed in class III and require pre-market approval. All of the Company’s current products are either class I or class II devices.
Pervasive and continuing U.S. regulation. After a device is placed on the market in the U.S., numerous regulatory requirements apply. These include, but are not limited to:
|
· |
Quality System Regulation (“QSR”), which requires manufacturers, including third-party manufacturers, to follow stringent design, testing, documentation and other quality assurance procedures during product design and throughout the manufacturing process; |
|
· |
Labeling regulations and FDA prohibitions against the promotion of products for uncleared, unapproved or off-label uses and against making false and misleading claims; and |
|
· |
Medical device reporting regulations, which require that manufacturers report to the FDA if their device may have caused or contributed to a death or serious injury or malfunctioned in a way that would likely cause or contribute to a death or serious injury if the malfunction were to recur. |
The FDA has broad post-market and regulatory enforcement powers. Failure to comply with FDA requirements could result in criminal and civil penalties. The Company is subject to unannounced inspections by the FDA to determine its compliance with QSR and other regulations. The Company’s subcontractors also may be subject to FDA inspection. Refer to the following risk factors set forth in Item 1A. “Risk Factors” for additional information regarding FDA regulations that may impact the Company:
|
· |
“The Company’s medical device business is subject to many laws and government regulations governing the manufacture and sale of medical devices, including the FDA’s 510(k) clearance process.” |
|
· |
“The Company’s medical device business is subject to unannounced inspections by the FDA to determine our compliance with FDA requirements.” |
9
The Company’s Medical Physics business and Medical Device business are subject to regulation by the U.S. Department of Health and Human Services and similar local, state and foreign health regulatory agencies. As a result of applicable regulatory requirements the Company’s arrangements with physicians and other health care professionals or entities must be structured appropriately to comply with applicable law, including but not limited to the federal Anti-kickback Statute. The Company may also be subject to certain transparency reporting requirements related to any payments or other transfers of value to physicians or teaching hospitals under the federal Physician Payment Sunshine Act and similar state laws. In addition, the Company may need to comply with applicable requirements of federal and state privacy and data security laws with respect to health care and other personally identifiable information that they may access, use, disclose, create, receive, transmit or maintain when conducting business. Finally, changes in health care delivery and reimbursement structures, particularly those brought about by federal and state health reform in the U.S., may impact the Company. Various penalties and sanctions exist for violations of these laws, including fines, imprisonment and exclusion from doing business with federal agencies in the United States. Refer to the following risk factors set forth in Item 1A. “Risk Factors” for additional information regarding healthcare fraud and abuse, reimbursement, privacy and data security laws and policies that may impact the Company:
|
· |
“The current United States and state health reform legislative initiatives, and similar initiatives outside the United States, could adversely affect our operations and business condition.” |
|
· |
“The applicable healthcare fraud and abuse, privacy, and data security laws and regulations, along with the increased enforcement environment, may lead to an enforcement action targeting the Company, which could adversely affect our business.” |
Recently released U.S. accreditation standards. The Joint Commission (“TJC”) recently released new and revised Diagnostic Imaging Services Requirements (“Imaging Standards”) for accredited hospitals, critical access hospitals and certain ambulatory health care organizations that took effect July 1, 2015. The Imaging Standards incorporate recommendations from imaging experts, professional associations and accredited organizations about areas that must be evaluated to ensure the safe delivery of diagnostic imaging services, including the following:
|
· |
Requirements for annual performance evaluations of advanced imaging modalities (CT, Nuclear Medicine, magnetic resonance and positron emission tomography) by a medical physicist or MRI scientist (for MRI only); |
|
· |
Inspecting, testing and maintaining medical equipment; and |
|
· |
Ongoing annual education and training for CT and magnetic resonance technologists on radiation dose and patient safety concerns and screening criteria. |
The revised TJC requirements also specify that the radiation dose of every CT exam must be recorded, and that high radiation dose incidents must be evaluated against industry benchmarks. Although not directly applicable to the Company, these new standards may increase the need for the services of the Company’s Medical Physics business by existing customers, or result in the acquisition of new customers. The Company’s inability to comply with these Imaging Standards when providing such services to customers, however, may adversely impact the Company. See the following risk factor in Item 1A. “Risk Factors:” “The applicable healthcare fraud and abuse, privacy, and data security laws and regulations, along with the increased enforcement environment, may lead to an enforcement action targeting the Company, which could adversely affect our business.”
10
International Regulations. Outside the U.S., similar requirements and procedures related to the marketing of medical devices exist and must be complied with. For example, in the European Union (“EU”), medical devices must meet minimum standards of performance, safety and quality, and follow one of several conformity assessment routes, depending on their classification. Some of these conformity assessment routes involve an assessment and certification by a notified body. Manufacturers indicate compliance with applicable EU medical device regulations by preparing a Declaration of Conformity and by applying a CE Mark to their medical devices before placing them on the market in the EU. An appropriate quality system is required and manufacturers must report certain product and safety-related information to government agencies of individual EU Member States. Various penalties and sanctions exist in different EU Member States for non-compliance with EU medical device regulations and related requirements, for example with respect to data protection and privacy.
Environmental Regulations
The Company believes that it complies with international, federal, state and local provisions that have been enacted or adopted regulating the discharge of materials into the environment or otherwise protecting the environment. This compliance has not had, nor is it expected to have, a material effect on the capital expenditures, financial condition, liquidity, results of operations, or competitive position of the Company.
Other Governmental Regulations
Many of the Company’s technology-based services must comply with various national and international standards that are used by regulatory and accreditation bodies for approving such services and products. These accreditation bodies include, for example, the National Voluntary Laboratory Accreditation Program in the U.S. and governmental agencies, generally, in international markets. Changes in these standards and accreditation requirements can result in the Company having to incur costs to adapt its offerings and procedures. Such adaptations may introduce quality assurance issues during transition that need to be addressed to ensure timely and accurate analyses and data reporting. Additionally, changes affecting radiation protection practices, including new understandings of the hazards of radiation exposure and amended regulations, may impact how the Company’s services are used by its customers and may, in some circumstances, cause the Company to alter its products and delivery of its services.
As of September 30, 2015, the Company employed approximately 600 full-time employees worldwide, of which 151 employees and 33 employees were in the Company’s Medical Physics and Medical Products segments, respectively. None of the Company’s employees are represented by labor organizations. The Company believes that it generally maintains good relations with employees at all locations.
Our annual reports on Form 10-K, quarterly reports on Form 10-Q, current reports on Form 8-K and amendments to those reports filed or furnished pursuant to Section 13(a) or 15(d) of the Securities Exchange Act of 1934, as amended (the “Exchange Act”) may be accessed free of charge through the Company’s website, www.landauer.com/investor, as soon as reasonably practicable after they are filed electronically with, or furnished to, the SEC. We are providing the address to our internet site solely for the information of investors. We do not intend the address to be an active link or to otherwise incorporate the contents of the website into this report. A copy of any of these reports is available free of charge upon the written request from any shareholder. Requests should be submitted to the following address: Landauer, Inc., Attention: Corporate Secretary, 2 Science Road, Glenwood, Illinois 60425.
Pursuant to Section 303A.12(a), Landauer, Inc. has complied with the New York Stock Exchange requirement to provide an annual CEO certification no later than 30 days following the Company’s annual meeting.
11
In addition to factors discussed elsewhere in this Annual Report on Form 10-K, set forth below are certain risks and uncertainties that could adversely affect the Company’s results of operations or financial condition and cause actual results or events to differ materially from those expressed in any forward-looking statements made by or on behalf of the Company.
We have identified material weaknesses in our internal control over financial reporting which could, if not remediated, result in material misstatements in our financial statements.
We previously identified and reported material weaknesses in our internal control over financial reporting, which still exist, and have concluded that the Company’s internal control over financial reporting was not effective as of September 30, 2015. Under standards established by the Public Company Accounting Oversight Board, a material weakness is a deficiency, or combination of deficiencies, in internal control over financial reporting, such that there is a reasonable possibility that a material misstatement of our annual or interim financial statements will not be prevented or detected on a timely basis.
In response to the identified material weaknesses, our management, with oversight from our Audit Committee, has dedicated significant resources and efforts to improve our control environment and risk assessment and to remedy the identified material weaknesses. We believe that we have designed and implemented the appropriate controls to fully remediate the material weaknesses. The corrective actions that we implemented in fiscal 2015 are discussed in more detail in Item 9A. of this Annual Report on Form 10-K. However, we will continue to report these material weaknesses until we have demonstrated the effectiveness of the new processes for a sufficient period of time and have independently validated their operating effectiveness.
If the Company is unable to successfully remediate these material weaknesses and if we are unable to produce accurate and timely financial statements, our stock price may be adversely affected and the Company may be unable to maintain compliance with applicable stock exchange listing requirements.
We rely on a single facility for the primary manufacturing and processing of our dosimetry services and products, and a single facility for the manufacturing and processing of our medical devices.
The Company conducts its primary dosimetry manufacturing and laboratory processing operations and performs significant functions for some of its international operations from a single facility in Glenwood, Illinois. The Company’s IZI subsidiary conducts its medical device manufacturing and operations from a single facility in Baltimore, Maryland. If the Company were to lose availability of either of these primary facilities due to fire, natural disaster or other disruptions, the Company’s operations could be significantly impaired. Despite the Company’s business continuity preparedness efforts, there can be no assurance that such plan could ensure the Company’s ability to rapidly respond to a disaster. Although the Company maintains business interruption insurance, there can be no assurance that the proceeds of such insurance would be sufficient to offset any loss the Company might incur or that the Company would be able to retain its customer base if operations were so disrupted.
Increased IT security threats and more sophisticated and targeted computer crime could pose a risk to our systems, networks, products, solutions and services.
Increased global IT security threats and more sophisticated and targeted computer crime pose a risk to the security of our systems and networks and the confidentiality, availability and integrity of our data. While we attempt to mitigate these risks by employing a number of measures, including employee training; comprehensive monitoring of our networks and systems; and maintenance of backup and protective systems, our systems, networks, products, solutions and services remain potentially vulnerable to advanced persistent threats. Depending on their nature and scope, such threats could potentially lead to the compromising of confidential information; improper use of our systems and networks; manipulation and destruction of data; defective products; production downtimes; and operational disruptions, which in turn could adversely affect our reputation, competitiveness, and operating results.
12
We rely on a single source for the manufacturing of crystal material, a key component in our OSL technology, a single vendor for the manufacturing of InLight products and a single vendor for a key component of our medical devices.
Crystal material is a key component in Landauer’s OSL technology. The Company operates a single crystal manufacturing facility in Stillwater, Oklahoma that currently supplies all OSL crystal radiation measurement material used by the Company. Although multiple sources for raw crystal material exist and inventory levels provide a significant reduction of risk, there can be no assurance that the Company could secure another source to produce finished crystal materials to Landauer’s specification in the event of a disruption at the Stillwater facility. The InLight dosimetry system and its components are manufactured by Panasonic Communications Company (“Panasonic”) under an exclusive agreement. IZI sources a key component of its medical accessories from a sole supplier. If the Company were to lose availability of its Stillwater facility or materials from Panasonic or IZI’s sole supplier due to a fire, natural disaster or other disruptions, such loss could have a material adverse effect on the Company and its operations.
If we are not successful in the development or introduction of new technologies, our financial condition and results of operations could be materially and adversely affected.
The Company’s radiation measurement business is a mature business and the number of workers being monitored for radiation exposure has not grown in recent years. Additionally, economic pressures can adversely affect the value of occupational measurement perceived by customers or increase pricing pressures. The Company believes that the development and introduction of new technologies and products will be essential to help counter these pressures. The Company regularly pursues product improvements to maintain its technical position. The development and introduction of new technologies, the adaptability of OSL to new platforms and new formats, the usefulness of older technologies and the introduction of new technologies by the competition present various risks to the Company’s business. The failure or lack of market acceptance of a new technology or the inability to respond to market requirements for new technologies could adversely affect the Company’s operations or reputation with customers. The cancellation of technology projects or the cessation of use of an existing technology could result in write-downs and charges to the Company’s earnings.
As a medical device accessory provider, introducing new products is critical to growing the Company’s business. If the Company does not manage its new product development projects on time or experiences unforeseen problems, the launch of those products would be put at risk which could have a negative effect on the Medical Products segment revenue opportunity and the Company’s results of operations. The failure or lack of market acceptance of a new product or the inability to respond to market requirements for new technologies could adversely affect the Company’s operations and reputation with customers.
We may fail to adequately protect our customer data.
We may fail to adequately protect our customer data. In the normal course of operations, we collect and maintain confidential data from our customers. Our failure to adequately preserve the security of this data, whether due to technological failures or errors in or deviations from our data maintenance policies and procedures, could result in data loss or corruption. If we fail to adequately maintain and protect our customer data, we could be exposed to government enforcement actions or potential litigation from our customers and could face risk for loss or breach of customer data under state privacy laws or applicable data privacy laws outside the U.S. Additionally, our reputation could be harmed, and we could lose existing and have difficulty attracting new customers, all of which could adversely affect our operating results.
If we are unable to successfully execute business development activities and diversification such as the acquisition and integration of strategic businesses, our on-going business and results of operations may be adversely affected.
A principal growth strategy of the Company is to explore opportunities to selectively enhance its business through development activities, such as strategic acquisitions, investments and alliances. In furtherance of this objective, in November 2011, the Company acquired IZI. In August 2012, the Company acquired a 49% minority interest in YFH. In December 2013, the Company acquired ilumark. The Company may not be able to identify
13
appropriate acquisition candidates or successfully negotiate, finance or integrate acquisitions. Covenants in the Company’s revolving credit facility may also limit the amount and types of indebtedness that it may incur to finance acquisitions. If the Company is unable to make further acquisitions, it may be unable to realize its growth strategy. Additionally, if the Company is unable to successfully manage acquisition risks, future earnings may be adversely affected. Acquisitions and other business development activities involve various significant challenges and risks, including the following:
|
· |
Difficulty in acquiring desired businesses or assets on economically acceptable terms; |
|
· |
Difficulty in integrating new employees, business systems and technology; |
|
· |
Difficulty in consolidating facilities and infrastructure; |
|
· |
Potential need to operate and manage new lines of business; |
|
· |
Potential loss of key personnel; |
|
· |
Diversion of management’s attention from on-going operations; |
|
· |
Realization of satisfactory returns on investments; and |
|
· |
Disputes with strategic partners, due to conflicting priorities or conflicts of interest. |
Development activities could result in the incurrence of debt, contingent liabilities, interest and amortization expenses or periodic impairment charges related to goodwill and other intangible assets as well as significant charges related to integration costs. If the Company is unable to successfully integrate and manage businesses that it acquires within expected terms and in a timely manner, its business and results of operations could be adversely affected.
Unforeseen problems with the stabilization and maintenance of our equipment and information systems could interfere with our operations.
In the normal course of its business, the Company must record and process significant amounts of data quickly and accurately and relies on various computer and telecommunications equipment and information technology systems. Any failure of such equipment or systems could adversely affect the Company’s operations.
During 2012, the Company implemented a new enterprise resource planning solution to manage certain business operations of its Order to Cash, Procure to Pay, and Radiation Measurement - Reporting and Analysis business processes. The Company will continue to incur additional costs associated with stabilization and ongoing development of the new solution. As new applications and functionality are added in order to increase the efficiency of the Company workforce and business processes, unforeseen problems could arise. Such problems could adversely impact the Company’s operations, including the ability to perform the following in a timely manner: customer quotes, customer orders, product shipment, customer services and support, order billing and tracking, contractual obligations fulfillment and other related operations.
Certain of our operations are conducted through joint ventures in which we rely significantly on our joint venture partners.
A substantial portion of the Company’s operations are conducted through joint ventures with third parties. In Australia, Brazil, China, and Mexico, the Company has a controlling interest in the related joint ventures. The Company has a 50% equity interest in Nagase-Landauer, Ltd. (“Nagase”), a radiation measurement company located in Japan, a 50% equity interest in Epsilon-Landauer Dozimetri, a radiation measurement company located in Turkey, as well as a 49% equity interest in YFH, located in New Mexico. In all of these joint ventures and others, the Company relies significantly on the services and skills of its joint venture partners to manage and conduct the local operations and ensure compliance with local laws and regulations. If the joint venture partners were unable to perform these functions adequately, the Company’s operations in such regions could be adversely affected.
14
There can be no assurances that our operations will generate cash flows in an amount sufficient to enable us to pay our indebtedness.
The Company’s ability to make scheduled payments on its existing or future debt obligations and fund operations will depend on its future financial and operating performance. While the Company believes it will continue to have sufficient cash flows to operate its businesses, there can be no assurances that its operations will generate sufficient cash flows to enable it to pay its remaining indebtedness or to fund its other liquidity needs. If the Company cannot make scheduled payments on its debt, the Company will be in default and, as a result, among other things, all outstanding principal and interest under its revolving credit facility will automatically be due and payable which could force the Company to liquidate certain assets or substantially restructure or alter its business operations or debt obligations. Moreover, if the Company is unable to obtain additional capital or if its current sources of financing are reduced or unavailable, the Company may be required to eliminate or reduce the scope of its plans for expansion and growth and this could affect its overall operations.
If we experience decreasing prices for our goods and services and we are unable to reduce our expenses, our results of operations could suffer.
The Company may experience decreasing prices for the goods and services it offers due to customer consolidation, increased influence of hospital group purchasing organizations, and pricing pressure experienced by its customers from managed care organizations, the Medicare and Medicaid programs and other third-party payers, including outside the U.S. Decreasing prices may also be due to increased market power of its customers as the medical industry consolidates and increased competition among dosimetry and physics services providers. If the prices for its goods and services decrease and it is unable to reduce its expenses, the Company’s results of operations could be adversely affected.
The Company may also experience decreasing prices for the products offered by its medical device business due to competition, potential changes in the reimbursement levels of hospitals and other customers. The customers and the other entities with which the Company has a business relationship are affected by changes in statutes, regulations and limitations in governmental spending for Medicare, Medicaid and other programs, including outside the U.S. Recent government actions and future legislative and administrative changes could limit government spending for the Medicare and Medicaid programs, limit payments to hospitals and other providers, increase emphasis on competition, consolidation, or integrated delivery systems, impose price controls, initiate new and expanded value-based reimbursement programs and/or create other programs that potentially could have an adverse effect on the Company’s customers and the other entities with which it has a business relationship. If the Company’s pricing experiences significant downward pressure, its business will be less profitable and its results of operations could be adversely affected.
We may be subject to future impairment losses due to potential declines in the fair value of our assets.
As a result of acquisitions and capital expenditures, the Company has goodwill, intangible assets and fixed assets on our balance sheets. The Company tests goodwill, intangible assets and fixed assets for impairment on a periodic basis as required and whenever events or changes in circumstances indicate that the carrying value may not be recoverable. The events or changes that could require the Company to test its goodwill, intangible assets and fixed assets for impairment include a reduction in the Company’s stock price and market capitalization, changes in estimated future cash flows and changes in rates of growth in the Company’s industry or in any of the Company’s reporting units.
The potential for goodwill impairment is increased during a period of economic uncertainty. To the extent the Company acquires a company at a negotiated price based on anticipated future performance, subsequent market conditions may result in the acquired business performing at a lower level than was anticipated at the time of the acquisition. Any of these charges would reduce our operating results and could cause the price of our common stock to decline. A slowing recovery in the U.S., a prolonged recovery or second recession in Europe, and slowing growth in the global economy may result in declining performance that would require the Company to examine its goodwill for potential additional impairment.
15
The Company will continue to evaluate the carrying value of the remaining goodwill, intangible assets and fixed assets, and if it determines in the future that there is a potential further impairment, the Company may be required to record additional losses, which could materially and adversely affect operating results.
Restrictions in our revolving credit facility could adversely affect our business, financial condition, and results of operations.
The Company has a committed $175.0 million, secured revolving credit facility syndicated with a group of commercial banks that expires on August 2, 2018.
The facility also contains certain financial covenants, which were amended in June 2014. The maximum leverage ratio covenant is 3.50 to 1.00 for the remaining loan. The minimum fixed charge coverage ratio covenant is 1.10 to 1.00 for the remaining loan. The facility’s interest rate is equal to the London Interbank Offered Rate (“LIBOR”) plus a margin of between 1.25% and 2.50% and for the base rate a margin of between 0.25% and 1.50%.
If the Company has significant borrowings under the facility and it violates a covenant or an event of default occurs and the lenders accelerate the maturity of any outstanding borrowings and terminate their commitment to make future loans, it could have a material adverse effect on the Company’s business, results of operations and financial condition. There can be no assurance that the Company will be able to comply with its financial or other covenants or that any covenant violations will be waived. In addition, if the Company fails to comply with its financial or other covenants, it may need additional financing in order to service or extinguish its indebtedness. In the future, the Company may not be able to obtain financing or refinancing on terms acceptable to it, if at all.
Our radiation-measurement and technology-based services business is subject to extensive domestic and foreign government regulations, which could increase our costs, cause us to incur liabilities and adversely affect our results of operations.
Regulation, present and future, is a constant factor affecting the Company’s business. The radiation measurement industry is subject to federal, state and international governmental regulation. Unknown matters, new laws and regulations, or stricter interpretations of existing laws or regulations may materially affect the Company’s business or operations in the future and/or could increase the cost of compliance. The equipment commissioning business of LMP, which the Company acquired in November 2009, and the employment of physicists and other healthcare professionals also are subject to federal, state and international governmental regulation and licensing requirements.
Many of the Company’s technology-based services must comply with various domestic and international standards that are used by regulatory and accreditation bodies for approving such services and products. The failure of the Company to obtain accreditation for its services and products may adversely affect the Company’s business, require the Company to alter its products or procedures or adversely affect the market perception of the effectiveness of its services and products. Changes in these standards and accreditation requirements may also result in the Company having to incur substantial costs to adapt its offerings and procedures to maintain accreditations and approvals. Such adaptations may introduce quality assurance issues during transition that need to be addressed to ensure timely and accurate analyses and data reporting. Additionally, changes affecting radiation protection practices, including new understandings of the hazards of radiation exposure and amended regulations, may impact how the Company’s services are used by its customers and may, in some circumstances, cause the Company to alter its products and delivery of its services.
16
The Company’s medical device business is subject to many laws and government regulations governing the manufacture and sale of medical devices, including the FDA’s 510(k) clearance process.
Several of the Company’s products are medical devices that are subject to extensive regulation in the U.S. by the federal government, including by the FDA, various state agencies, and other government agencies outside the U.S. The FDA regulates virtually all aspects of a medical device’s design, development, testing, manufacturing, labeling, storage, record keeping, adverse event reporting, sale, promotion, distribution and shipping. In addition, certain states have registration or licensing requirements and may impose other regulatory requirements similar to those imposed by the FDA. The Company must report to the FDA when evidence suggests that one of its devices may have caused or contributed to death or serious injury or has malfunctioned and the device or a similar device would be likely to cause or contribute to death or serious injury if the malfunction were to recur. If such adverse event occurred, the Company could incur substantial expense and harm to its reputation and the Company’s business and results of operations could be adversely affected. Similar reporting requirements and risks exist and apply to the Company’s activities outside the U.S.
In September 2013, the FDA issued a final rule creating the Unique Device Identification (“UDI”) System that will be phased in over seven years. The UDI System will require manufacturers to mark certain medical devices distributed in the United States with unique identifiers. The FDA expects that the UDI System will help track products during recalls and improve patient safety. The Company is taking the necessary steps to meet the requirements of the UDI System. The labeling and identification of our products will be updated to meet this new unique identifier approach.
Before a new medical device can be marketed in the U.S., it must first receive either premarket approval or 510(k) clearance from the FDA, unless an exemption exists. The same rule applies when a manufacturer plans to market a medical device for a new use. The process can be costly and time-consuming. The FDA is expected to respond to a section 510(k) notification in 90 days, but often takes much longer. The premarket approval process usually takes six months to three years, but may take longer. The Company cannot assure that any new medical devices or new use for an existing medical device that it develops will be cleared or approved in a timely or cost-effective manner, if cleared or approved at all. Even if such devices are cleared or approved, the products may not be cleared or approved for all indications. Because medical devices may only be marketed for cleared or approved indications, this could significantly limit the market for that product and may adversely affect the Company’s results of operations.
Currently, all IZI medical devices have been cleared through the 510(k) clearance process or are exempt from this requirement. Any modification to a 510(k) device that could significantly affect its safety or efficacy, or that would constitute a significant change in its intended use, will require a new clearance process or premarket approval. Any modification to an exempt device could potentially subject the exempt device to the 510(k) clearance requirements or premarket approval. The FDA requires device manufacturers to make their own determination regarding whether a modification requires a new clearance; however, the FDA can review and invalidate a manufacturer’s decision not to file for a new clearance. The Company cannot guarantee that the FDA will agree with its decisions not to seek clearances for particular device modifications or that it will be successful in obtaining 510(k) clearances for modifications. Any such additional clearance processes with the FDA could delay the Company’s ability to market a modified product and may adversely affect the Company’s results of operations.
Similar risks exist and apply to the Company’s activities in the EU. Notified bodies or government agencies may challenge the Company’s classification, certification or marketing of medical devices in the EU, and may request additional clinical evidence to support their continued marketing. The Company may not be able to sufficiently address all concerns or questions raised by notified bodies or government agencies in the EU, and may not be able to maintain or place its products on the EU market.
17
Proposed new EU medical device regulations, and changed enforcement practices, could adversely affect our marketing of medical devices in the EU.
New EU medical device regulations intended to replace the existing EU legal framework are under consideration and may become applicable to medical devices placed on the EU market. The requirements imposed by the proposed new EU medical device requirements, and related implementing regulations or guidelines, may be more stringent and comprehensive than existing requirements, and, if adopted, could adversely affect our marketing of medical devices in the EU. In addition, notified bodies and government agencies in the EU may change their enforcement practices, both with respect to the existing and proposed new regulations, including by performing unannounced inspections to determine compliance with applicable regulation, and by imposing different or more stringent penalties or sanctions. These and other regulatory and enforcement developments in the EU may also have a material adverse effect on our business and reputation.
The Company’s medical device business is subject to unannounced inspections by the FDA to determine our compliance with FDA requirements.
FDA inspections can result in inspectional observations on the FDA’s Form 483, warning letters or other forms of more significant enforcement action. More specifically, if the FDA concludes that the Company is not in compliance with applicable laws or regulations, or that any of IZI’s medical devices are ineffective or pose an unreasonable health risk, the FDA could:
|
· |
require the Company to notify health professionals and others that its devices present unreasonable risk of substantial harm to public health; |
|
· |
order the Company to recall, repair, replace or refund the cost of any medical device that it manufactured or distributed; |
|
· |
detain, seize or ban adulterated or misbranded medical devices; |
|
· |
refuse to provide the Company with documents necessary to export its products; |
|
· |
refuse requests for 510(k) clearance or premarket approval of new products or new intended uses; |
|
· |
withdraw 510(k) clearances or premarket approvals that are already granted; |
|
· |
impose operating restrictions, including requiring a partial or total shutdown of production; |
|
· |
enjoin or restrain conduct resulting in violations of applicable law pertaining to medical devices; and/or |
|
· |
assess criminal or civil penalties against the Company’s officers, employees or the Company. |
If the FDA concludes that the Company failed to comply with any regulatory requirement during an inspection, it could have a material adverse effect on its business and financial condition. The Company could incur substantial expense and harm to its reputation and its ability to introduce new or enhanced products in a timely manner could be adversely affected.
18
The current United States and state health reform legislative initiatives, and similar initiatives outside the United States, could adversely affect our operations and business condition.
In both the U.S. and some foreign jurisdictions, there have been a number of legislative and regulatory proposals to change the health care system in ways that might affect the Company’s business. In March 2010, President Obama signed into law the Patient Protection and Affordable Care Act, as amended by the Health Care and Education Reconciliation Act, or collectively, the Health Care Reform Law, a sweeping law intended to broaden access to health insurance, reduce or constrain the growth of healthcare spending, enhance remedies against fraud and abuse, add new transparency requirements for healthcare and health insurance industries, impose new taxes and fees on the health industry and impose additional health policy reforms. This legislation includes reforms and reductions that could affect Medicare reimbursements and health insurance coverage for certain services and treatments. Effective January 1, 2013, the Health Reform Law also imposed a 2.3% excise tax on the sale of certain medical devices by manufacturers or importers in the U.S., and the new American Health Benefit Insurance Exchanges and their qualified health plans began offering coverage on January 1, 2014. Some states also have pending health reform legislative initiatives. Further, the Joint Select Committee on Deficit Reduction, which was created by the Budget Control Act of 2011, concluded its work in November 2011, and issued a statement that it was not able to make a bipartisan agreement, thus triggering the sequestration process. The sequestration process combined with past and potential future government shutdowns have resulted and may result in spending reductions and have and could result in reduced Medicare, Medicaid and other Federal health care reimbursements for the Company’s services and products. Changes in reimbursements and coverages, including risk-sharing arrangements and quality-based reimbursement initiatives, could adversely affect hospitals and other medical services and products providers, which could result in reduced demand for certain services and products offered by the Company, including services offered by its Medical Physics business and products manufactured by its Medical Products business. Similarly, as the Health Care Reform Law continues to be implemented various states and large insurance companies continue to make decisions about the extent to which they will participate in the programs offered under the law. Reduced participation could also adversely affect hospitals and other medical services and products providers, which could result in reduced demand for certain services and products offered by the Company, including services offered by its Medical Physics business and products manufactured by its Medical Products business. The Company cannot predict whether or when future healthcare reform initiatives at the Federal or state level or other initiatives affecting its business will be proposed, enacted or implemented or what impact those initiatives may have on its business, financial condition or results of operations. The Company’s customers and the other entities with which it has a business relationship could react to these initiatives and the uncertainty surrounding these proposals by curtailing or deferring investments, including those for the Company’s services and products.
The applicable healthcare fraud and abuse, privacy, and data security laws and regulations, along with the increased enforcement environment, may lead to an enforcement action targeting the Company, which could adversely affect our business.
The medical device business is subject to healthcare fraud and abuse laws and regulations including, but not limited to, the Federal Anti-Kickback Statute, state anti-kickback statutes, the Federal False Claims Act, and state false claims acts, as well as similar regulations outside the U.S. Additionally, to the extent the Company maintains financial relationships with physicians and other healthcare providers, the Company may be subject to Federal and state physician payment sunshine laws and regulations, and similar regulations outside the U.S., which require the Company to track and disclose these financial relationships. These and other laws regulate interactions amongst health care entities and with sources of referrals of business, among other things. The Federal Anti-Kickback Statute is a criminal statute that imposes substantial penalties on persons or entities that offer, solicit, pay or receive payments in return for referrals, recommendations, purchases or orders of items or services that are reimbursable by Federal healthcare programs. The False Claims Act imposes liability on any person or entity that submits or causes to be submitted a claim to the Federal government that he or she knows (or should know) is false. The Health Reform Law further provides that a claim submitted for items or services, the provision of which resulted from a violation of the Anti-Kickback Statute, is “false” under the False Claims Act and certain other false claims statutes. In addition, many of the Company’s customers must now comply with the TJC’s new Imaging Standards to maintain accreditation, which among other things, is typically needed to bill and receive payment from government and private payors. To the extent that the Company’s Medical Physics or other businesses provide services subject to these Imaging Standards, it may be adversely affected by potential government enforcement actions, or similar
19
adverse actions by its customers, should its services, or those of its customers, fail to meet the Imaging Standards or reimbursement requirements related to such standards.
The Company may also be subject to liability under these laws based on the activities of its Medical Device business for its conduct prior to acquisition and may also be subject to liability for any future conduct that is deemed by the government or the courts to violate these laws. Additionally, over the past ten years, partially as the result of the passage of the Health Insurance Portability and Accountability Act of 1996 and of the Health Reform Law, the government has pursued an increasing number of enforcement actions. This increased enforcement environment may increase scrutiny of the Company, directly or indirectly, and could increase the likelihood of an enforcement action targeting the Company. The Company’s Medical Products segment has entered into complex distribution and collaboration agreements, as well as purchase agreements with a number of its customers, including parties that bill Federal healthcare programs for the Company’s products, which may be subject to government scrutiny. Finally, to the extent that any of the agreements are breached or terminated, the Company’s medical device business may experience a decrease in sales, and accordingly, revenue. In addition, to the extent that its customers, many of whom are providers, may be affected by this increased enforcement environment, the Company’s business could correspondingly be affected. It is possible that a review of the Company’s business practices or those of its customers by courts or government authorities could result in a determination with an adverse effect on its business. The Company cannot predict the effect of possible future enforcement actions on the Company.
Changes in, or interpretations of, tax rules and regulations may adversely affect our effective tax rates.
The Company is subject to income and other taxes in the U.S. and several foreign jurisdictions. Significant judgment is required in evaluating our provision for income taxes. During the ordinary course of business, there are many transactions for which the ultimate tax determination is uncertain. For example, there could be changes in the valuation of our deferred income tax assets and liabilities; or changes in the relevant tax, accounting, and other laws, regulations, principles and interpretations. The Company is subject to audits in various jurisdictions, and such jurisdictions may assess additional tax against us. Although the Company believes our tax estimates are reasonable, the final determination of tax audits and any related litigation could be materially different from our historical income tax provisions and accruals. The results of an audit or litigation, or the effects of a change in tax policy in the U.S. or international jurisdictions where we do business, could have a material effect on our operating results in the period or periods for which that determination is made.
As a portion of our business is conducted outside of the United States, adverse international developments could negatively impact our business and results of operations.
The Company conducts business in numerous international markets such as Australia, Brazil, Canada, China, France, Germany, Japan, Mexico, Sweden, Turkey and the United Kingdom. Foreign operations are subject to a number of special risks, including, among others, currency exchange rate fluctuations; disruption in relations; changes in a specific country’s or region’s political, social or economic conditions; political and economic unrest; trade barriers; exchange controls; expropriation; restrictions on the Company’s ability to own or operate subsidiaries; the burden of complying with numerous and potentially conflicting laws; and changes in laws and policies, including those governing foreign owned operations.
Fluctuations in currency exchange rates could adversely affect our results.
The Company is exposed to market risk, including changes in foreign currency exchange rates. The financial statements of the Company’s non-U.S. subsidiaries are remeasured into U.S. dollars monthly using the U.S. dollar as the reporting currency. To date, the market risk associated with foreign currency exchange rates has not been material in relation to the Company’s financial position, results of operations or cash flows. These risks could increase, however, as the Company expands in international markets.
20
Several of our current and potential competitors have significantly greater resources and increased competition could impair sales of our products.
The Company competes on the basis of advanced technologies, competent execution of these technologies, the quality, reliability and price of its services and its prompt and responsive performance. In much of the world, radiation measurement activities are conducted by a combination of private entities and governmental agencies. The Company’s primary radiation measurement and medical physics competitor in the U.S., Global Dosimetry Solutions, a division of Mirion Technologies, is large, has substantial resources, and has been particularly active in recent years in soliciting business from the Company’s customers. IZI generally competes against a limited number of companies. Two of its primary competitors are a division of Roper Technologies, Inc., and Medtronic, each of which is a significant competitor with substantial resources.
Our failure to attract, motivate and retain qualified and key personnel to support our business may have a material adverse effect on our business plans, prospects, results of operations and financial condition.
The Company’s success depends, in large part, upon the talent and efforts of key individuals including highly skilled scientists, physicists and engineers, as well as experienced senior management, sales, marketing and finance personnel. Competition for these individuals is intense and there can be no assurance that the Company will be successful in attracting, motivating, or retaining key personnel. The loss of the services of one or more of these senior executives or key employees, or the inability to continue to attract these personnel may have a material effect on its business plans, prospects, results of operations and financial condition. The Company’s continued ability to compete effectively depends on its ability to attract new skilled employees and to retain and motivate its existing employees.
The Medical Physics business involves the delivery of professional services and is highly labor-intensive. Its success depends largely on its general ability to attract, develop, motivate and retain highly skilled licensed medical physicists. Further, the Company must successfully maintain the right mix of physicists with relevant experience and skill sets as it expands into new service offerings, and as the market evolves. The loss of a significant number of its physicists, the inability to attract, hire, develop, train and retain additional skilled personnel, or not maintaining the right mix of professionals could have a serious negative effect on the Company, including its ability to manage, staff and successfully complete its existing engagements and obtain new engagements. Qualified physicists are in great demand, and the Company faces significant competition for both senior and junior physicists with the requisite credentials and experience. The Company’s principal competition for talent comes from other outsourced medical physicist firms, hospitals and free-standing radiation therapy centers. Many of these competitors may be able to offer significantly greater compensation and benefits or more attractive lifestyle choices, career paths or geographic locations than those of the Company. Therefore, the Company may not be successful in attracting and retaining the skilled physicists it requires to conduct and expand its operations successfully. Increasing competition for these revenue-generating physicists may also significantly increase the Company’s labor costs, which could negatively affect its margins and results of operations.
We could be subject to professional liability lawsuits, some of which we may not be fully insured against or reserved for, which could adversely affect our financial condition and results of operations.
In recent years, physicians, hospitals and other participants in the healthcare industry have become subject to an increasing number of lawsuits alleging medical malpractice and related legal theories such as negligent hiring, supervision and credentialing, and vicarious liability for acts of their employees or independent contractors. In addition, the level and effect of radiation being administered by certain radiation equipment is also attracting increased scrutiny and giving rise to patient safety claims. Many of these lawsuits involve large claims and substantial defense costs. As the Company increases its presence in the healthcare industry, through the Medical Physics business, it could be exposed to litigation or subject to fines, penalties or suspension of services relating to the compliance with regulatory requirements.
21
Item 1B. Unresolved Staff Comments.
None.
The Company owns three adjacent buildings totaling approximately 59,100 square feet in Glenwood, Illinois, about 30 miles south of Chicago, leases a 23,600 square foot warehouse in Chicago Heights, Illinois and leases 6,100 square feet of office space in Chicago. The properties house the Company’s administrative offices, information technology resources, and laboratory, assembly and reading operations. The properties and equipment of the Company are in good condition and, in the opinion of management, are suitable and adequate for the Company’s operations. For its Radiation Measurement operations, the Company leases a crystal growth facility in Stillwater, Oklahoma and laboratories in Australia, Brazil, China, France, Mexico, Sweden, and Turkey, as well as a sales office in England. The Company leases offices in New York, North Carolina and Missouri for its Medical Physics operations, and leases manufacturing and office space in Maryland and office space in Germany for its Medical Products operations.
The Company is a party, from time to time, to various legal proceedings, lawsuits and other claims arising in the ordinary course of its business. The Company does not believe that any such litigation pending as of September 30, 2015, if adversely determined, would have a material effect on its business, financial position, results of operations, or cash flows.
Item 4. Mine Safety Disclosures.
Not Applicable.
22
PART II
Item 5. Market for Registrant’s Common Equity, Related Stockholder Matters and Issuer Purchases of Equity Securities.
The Company’s common stock is listed on the New York Stock Exchange under the ticker symbol “LDR.” The following table shows, for the periods indicated, the high and low sales prices per share of the Company’s common stock and dividends paid per share for each quarterly period during the last two fiscal years:
|
Year |
Quarter |
High |
Low |
Dividends |
||||||
|
2015 |
||||||||||
|
First |
$ |
36.25 |
$ |
32.02 |
$ |
0.550 | ||||
|
Second |
$ |
38.78 |
$ |
27.87 |
$ |
0.550 | ||||
|
Third |
$ |
37.38 |
$ |
29.36 |
$ |
0.275 | ||||
|
Fourth |
$ |
42.90 |
$ |
34.31 |
$ |
0.275 | ||||
|
2014 |
||||||||||
|
First |
$ |
53.51 |
$ |
47.14 |
$ |
0.550 | ||||
|
Second |
$ |
53.20 |
$ |
43.23 |
$ |
0.550 | ||||
|
Third |
$ |
48.80 |
$ |
41.35 |
$ |
0.550 | ||||
|
Fourth |
$ |
44.53 |
$ |
32.78 |
$ |
0.550 |
The Board of Directors continually reviews the appropriateness of the quarterly cash dividends policy and its status is reviewed based on future earnings, capital requirements and financial condition. On December 4, 2015, the Board of Directors declared a fiscal 2016 first quarter cash dividend of $0.275 per common share.
As of December 10, 2015, there were 231 shareholders of record.
23
Issuer Purchases of Equity Securities
The following table provides information about Company purchases of equity securities that are registered by the Company pursuant to Section 12 of the Exchange Act during the quarter ended September 30, 2015:
|
Period |
Total Number of Shares Purchased (a) |
Average Price Paid Per Share |
Total Number of Shares Purchased as Part of Publicly Announced Plans or Programs |
Maximum Number of Shares that May Yet be Purchased Under the Plans or Programs |
|||||
|
October 1 – October 31, 2014 |
490 |
$ |
32.74 |
- |
- |
||||
|
November 1 – November 30, 2014 |
- |
- |
- |
- |
|||||
|
December 1 – December 31, 2014 |
- |
- |
- |
- |
|||||
|
Quarter ended December 31, 2014 |
490 |
$ |
32.74 |
- |
- |
||||
|
January 1 – January 31, 2015 |
- |
- |
- |
- |
|||||
|
February 1 – February 29, 2015 |
- |
- |
- |
- |
|||||
|
March 1 – March 31, 2015 |
- |
- |
- |
- |
|||||
|
Quarter ended March 31, 2015 |
- |
$ |
- |
- |
- |
||||
|
April 1 – April 30, 2015 |
750 | 35.75 |
- |
- |
|||||
|
May 1 – May 31, 2015 |
- |
- |
- |
- |
|||||
|
June 1 – June 30, 2015 |
341 | 35.60 |
- |
- |
|||||
|
Quarter ended June 30, 2015 |
1,091 |
$ |
35.70 |
- |
- |
||||
|
July 1 – July 31, 2015 |
- |
- |
- |
- |
|||||
|
August 1 – August 31, 2015 |
- |
- |
- |
- |
|||||
|
September 1 – September 30, 2015 |
3,133 | 37.00 |
- |
- |
|||||
|
Quarter ended September 30, 2015 |
3,133 |
$ |
37.00 |
- |
- |
|
(a) |
This column includes the deemed surrender of existing shares of the Company’s common stock to the Company by stock-based compensation plan participants to satisfy the exercise price or tax liability of employee stock awards at the time of exercise or vesting. These surrendered shares are not part of any publicly announced share repurchase program. |
24
Performance Graph
The following graph reflects a comparison of the cumulative total return (change in stock price plus reinvested dividends) assuming $100 invested in: (a) Landauer’s common stock, (b) the S&P Smallcap 600 index, (c) the S&P Smallcap 600 industry index represented by a group of health care services companies, (d) a group of twenty-one health care and equipment services companies discussed in further detail below, (e) a group of life science tool companies composed of ticker symbols QGEN, SIAL, BRKR, PKI, TMO, A, WAT, FEIC and MTD, and (f) a group of detection/test and measurement companies composed of ticker symbols OSIS, VAR and ASEI during the period from September 30, 2010 through September 30, 2015.
The Company included the group of health care and equipment services companies as an additional benchmark for investors. Management believes this new peer group will be helpful to investors, because it represents a set of companies based on Landauer’s GICS code (3510 – Health Care Equipment and Services), with annual revenues and capitalizations comparable to Landauer, and whose primary business focuses on either (1) design and manufacturing of medical devices and/or (2) diagnostic, analytic, imaging and/or testing services in the life sciences and health care markets. The resulting group of twenty-one companies is composed of Abaxis, ABIOMED, Accuray, Affymetrix, AngioDynamics, ATRION, BioTelemetry, Cardiovascular Systems, CryoLife, Endologix, Exactech, ICU Medical, LDR Holding, Luminex, Meridian Bioscience, Natus Medical, Nxstage Medical, Quidel, RTI Surgical, Spectranetics and Vascular Solutions.
The comparisons in the following table are historical and are not intended to forecast or be indicative of possible future performance of Landauer’s common stock.
|
Value of Investment at September 30, |
||||||||||||
|
(Dollars) |
2010 |
2011 |
2012 |
2013 |
2014 |
2015 |
||||||
|
Landauer, Inc. |
$ |
100 |
$ |
82.16 |
$ |
103.22 |
$ |
92.28 |
$ |
62.44 |
$ |
72.77 |
|
S&P Smallcap 600 Index |
100 | 100.21 | 133.63 | 175.74 | 185.83 | 192.92 | ||||||
|
S&P Smallcap 600 Health Care Services Index |
100 | 100.16 | 149.65 | 173.04 | 197.49 | 229.70 | ||||||
|
Health Care Equipment & Services |
100 | 105.84 | 127.91 | 149.30 | 167.32 | 201.86 | ||||||
|
Life Sciences Tools |
100 | 100.94 | 121.98 | 170.69 | 205.87 | 207.24 | ||||||
|
Detection/Test & Measurement |
100 | 86.52 | 108.56 | 127.15 | 131.43 | 124.43 | ||||||
25
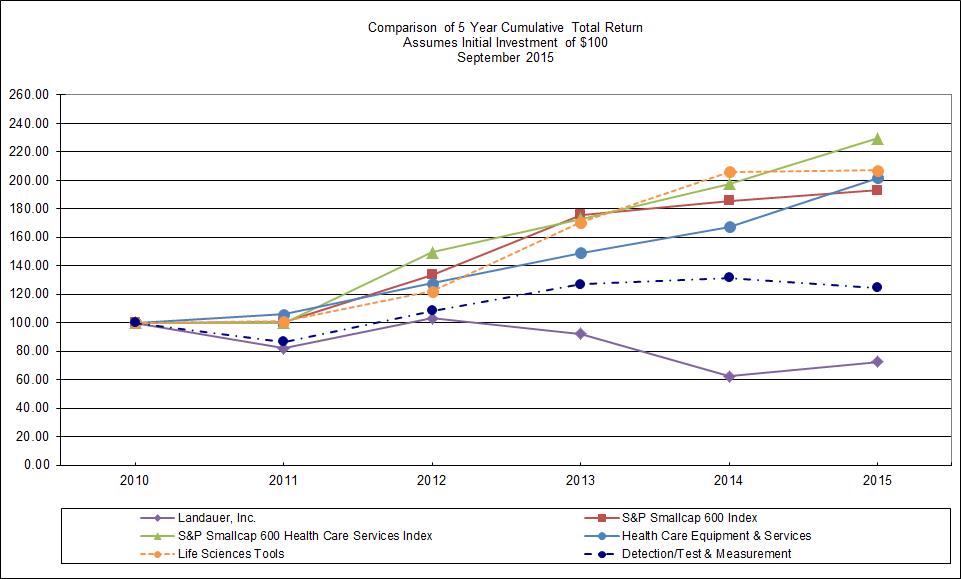
26
Item 6. Selected Financial Data.
|
(Dollars in Thousands, Except per Share) |
2015 |
2014 |
2013 |
2012 |
2011 |
||||||||||
|
Operating results: |
|||||||||||||||
|
Net revenues |
$ |
151,314 |
$ |
155,062 |
$ |
149,690 |
$ |
152,102 |
$ |
120,458 | |||||
|
Operating income (loss)(1) |
23,699 | (39,987) | 3,389 | 27,707 | 34,731 | ||||||||||
|
Net income (loss) attributable to Landauer, Inc. |
14,543 | (25,203) | 2,782 | 18,546 | 24,041 | ||||||||||
|
Basic net income (loss) per share |
$ |
1.52 |
$ |
(2.65) |
$ |
0.28 |
$ |
1.96 |
$ |
2.55 | |||||
|
Diluted net income (loss) per share |
$ |
1.52 |
$ |
(2.65) |
$ |
0.27 |
$ |
1.95 |
$ |
2.53 | |||||
|
Weighted average diluted shares outstanding |
9,540 | 9,524 | 9,482 | 9,437 | 9,477 | ||||||||||
|
Cash dividends per share |
$ |
1.65 |
$ |
2.20 |
$ |
2.20 |
$ |
2.20 |
$ |
2.20 | |||||
|
Total assets |
$ |
208,744 |
$ |
216,586 |
$ |
274,706 |
$ |
300,271 |
$ |
167,156 | |||||
|
Short-term debt |
$ |
- |
$ |
- |
$ |
- |
$ |
- |
$ |
19,805 | |||||
|
Long-term debt |
$ |
133,385 |
$ |
133,585 |
$ |
142,785 |
$ |
141,347 |
$ |
- |
|||||
(1)Results include additional expenses related to goodwill and other intangible assets impairment charges of $62,188 and $22,700 recorded in fiscal 2014 and fiscal 2013, respectively.
27
Item 7. Management’s Discussion and Analysis of Financial Condition and Results of Operations.
The following discussion and analysis of our consolidated financial condition and results of operations should be read in conjunction with Item 6. “Selected Financial Data” and our annual audited consolidated financial statements and related notes thereto. The following discussion includes forward-looking statements that involve certain risks and uncertainties. Refer to Part I – “Forward-Looking Statements” and Item 1A. “Risk Factors.” for additional information.
Executive Overview
Landauer is a leading global provider of technical and analytical services to determine occupational and environmental radiation exposure, the leading domestic provider of outsourced medical physics services, and a provider of radiology related medical products. The Company operates in three primary reporting segments (Radiation Measurement, Medical Physics, and Medical Products) and one functional group (Corporate).
|
· |
Radiation Measurement. The Company’s Radiation Measurement segment is a mature business and growth in the number of customers in existing markets is modest. In recent years, the Company’s strategy has been to expand into new international markets, primarily by partnering with existing dosimetry service providers with a prominent local presence. In addition, the Company has leveraged its OSL technology with product introductions (including InLight®, RadWatch® and RadLight®) to gain access to markets where the Company previously did not have a significant presence, such as smaller in-house and commercial laboratories, nuclear power facilities, tactical military and first responder measurement and hospitals to support measurement of patient exposure to radiation. Revenue growth in recent years has occurred as a result of entry into new markets through joint ventures and acquisitions, modest unit growth, sale of InLight equipment and badges, RadWatch and RadLight, and new ancillary opportunities. The continued pressure on the cost structure of our healthcare clients and the impact of healthcare reform has resulted in increased pricing pressure with the Company’s healthcare customer base, which is expected to continue into the future. |
|
· |
Medical Physics. The Company’s Medical Physics segment provides therapeutic and imaging physics services to hospitals, free-standing imaging centers and radiation therapy centers in a large fragmented market. We expect market growth in general to be driven by the increased use of radiation in the provision of healthcare; trends toward the outsourcing of medical physics services in healthcare settings; and a contraction in the domestic supply of qualified medical physicists. Increased customer spending, in response to The Joint Commission’s new Diagnostic Imaging requirements that became effective for hospitals and ambulatory care centers on July 1, 2015, is expected to drive future growth. |
|
· |
Medical Physics. The Company’s Medical Products segment provides medical consumable accessories used in radiology, radiation therapy, and image guided surgery procedures. The Company’s customer base includes buyers at several stages along the supply chain including distributors, manufacturers of image guided navigation equipment, and product end users such as community hospitals, radiation oncology clinics, mammography clinics, and imaging centers. Medical Products’ medical accessories range from consumables used with MRI, CT, and mammography technologies to highly engineered passive reflective markers used during image guided surgery procedures. In alignment with treatment trends which increasingly utilize radiation for the diagnosis and treatment of disease, as well as growing demand for minimally invasive procedures, these products provide the ability to increase procedural accuracy while decreasing procedural time. |
Corporate expenses for shared functions, including corporate management, corporate finance and human resources, are recognized in the Corporate functional group. In addition, acquisition and reorganization costs are included in Corporate expenses and are not allocated to the reporting segments.
The following table summarizes the Company’s consolidated results of operations for the periods presented. The results include additional expenses related to goodwill and other intangible assets impairment charges recorded during 2014 and 2013 and acquisition, reorganization and nonrecurring costs recorded during 2015, 2014 and 2013.
28
|
Consolidated Results of Operations |
|||||||||||||||
|
Fiscal Year Ended September 30, |
% Change Higher/Lower |
||||||||||||||
|
(Dollars in Thousands, Except per Share) |
2015 |
2014 |
2013 |
2015 vs. 2014 |
2014 vs. 2013 |
||||||||||
|
Revenues: |
|||||||||||||||
|
Service revenues |
$ |
128,771 |
$ |
127,698 |
$ |
126,528 | 0.8 |
% |
0.9 |
% |
|||||
|
Product revenues |
22,543 | 27,364 | 23,162 | (17.6) |
% |
18.1 |
% |
||||||||
|
Total revenues |
151,314 | 155,062 | 149,690 | (2.4) |
% |
3.6 |
% |
||||||||
|
Costs and expenses: |
|||||||||||||||
|
Service costs |
63,876 | 61,649 | 59,931 | 3.6 |
% |
2.9 |
% |
||||||||
|
Product costs |
8,709 | 12,506 | 11,163 | (30.4) |
% |
12.0 |
% |
||||||||
|
Total cost of sales |
72,585 | 74,155 | 71,094 | (2.1) |
% |
4.3 |
% |
||||||||
|
Gross profit |
78,729 | 80,907 | 78,596 | (2.7) |
% |
2.9 |
% |
||||||||
|
Selling, general and administrative |
53,989 | 54,904 | 51,115 | (1.7) |
% |
7.4 |
% |
||||||||
|
Goodwill and other intangible assets impairment charge |
- |
62,188 | 22,700 | (100.0) |
% |
174.0 |
% |
||||||||
|
Acquisition, reorganization and nonrecurring costs |
1,041 | 3,802 | 1,392 | (72.6) |
% |
173.1 |
% |
||||||||
|
Operating income (loss) |
23,699 | (39,987) | 3,389 | (159.3) |
% |
(1,279.9) |
% |
||||||||
|
Equity in income of joint ventures |
2,307 | 2,939 | 3,251 | (21.5) |
% |
(9.6) |
% |
||||||||
|
Interest expense, net |
(4,370) | (3,424) | (4,311) | 27.6 |
% |
(20.6) |
% |
||||||||
|
Other (expense) income, net |
(314) | (26) | 747 | 1,107.7 |
% |
(103.5) |
% |
||||||||
|
Income (loss) before taxes |
21,322 | (40,498) | 3,076 | (152.6) |
% |
(1,416.6) |
% |
||||||||
|
Income tax expense (benefit) |
6,273 | (15,800) | (560) | (139.7) |
% |
2,721.4 |
% |
||||||||
|
Net income (loss) |
15,049 | (24,698) | 3,636 | (160.9) |
% |
(779.3) |
% |
||||||||
|
Less: Net income attributed to noncontrolling interest |
506 | 505 | 854 | 0.2 |
% |
(40.9) |
% |
||||||||
|
Net income (loss) attributed to Landauer, Inc. |
$ |
14,543 |
$ |
(25,203) |
$ |
2,782 | (157.7) |
% |
(1,005.9) |
% |
|||||
|
Net income (loss) per share attributed to Landauer, Inc. shareholders: |
|||||||||||||||
|
Basic |
$ |
1.52 |
$ |
(2.65) |
$ |
0.28 | (157.4) |
% |
(1,046.4) |
% |
|||||
|
Weighted average basic shares outstanding |
9,511 | 9,524 | 9,434 | ||||||||||||
|
Diluted |
$ |
1.52 |
$ |
(2.65) |
$ |
0.27 | (157.4) |
% |
(1,081.5) |
% |
|||||
|
Weighted average diluted shares outstanding |
9,540 | 9,524 | 9,482 | ||||||||||||
29
Results of Operations
Comparison of the Fiscal Years Ended September 30, 2015 and 2014
Revenues for fiscal 2015 were $151.3 million, a decrease of $3.8 million, or 2.4%, compared to revenues of $155.1 million for fiscal 2014. Revenues in the Radiation Measurement segment decreased $7.6 million, which was primarily due to an unfavorable foreign currency impact of $5.3 million and a decrease in product sales to the military of $2.2 million. Revenues in the Medical Physics segment increased $3.2 million, primarily driven by a $2.2 million increase in imaging services as well as a $1.5 million increase in commissioning services. Revenues in the Medical Products segment increased $0.6 million primarily due to the full year impact from a modest acquisition in December 2013.
Gross margin for fiscal 2015 was 52.0% compared to 52.2% for fiscal 2014. Gross margin in the Radiation Measurement segment increased by 1.2%, due to an improved mix of higher margin service revenues versus lower margin product revenues. Gross margin in the Medical Physics segment increased by 0.3%, primarily due to an increase in higher margin commissioning revenues. Gross margin in the Medical Products segment decreased by 1.3%, due to continued Spherz pricing pressure.
Selling, general and administrative expenses for fiscal 2015 were $54.0 million, a decrease of $0.9 million, or 1.7%, compared to $54.9 million for fiscal 2014, primarily due to lower amortization expense and lower research and development expenses, partially offset by higher professional fees and sales and marketing spending. Amortization expense decreased $1.8 million as a result of impairments recorded in fiscal 2014 to reduce the carrying value of intangible assets in the Medical Products segment. Changes in foreign currency rates resulted in a $1.6 million decrease in expenses. Research and development expenses decreased $1.2 million due to early-stage design services incurred in fiscal 2014 to support the Verifii next generation dosimetry platform that were not present in fiscal 2015. Audit, legal and other professional fees increased $2.0 million in the current year primarily associated with the fiscal 2014 Form 10-K restatement and accounting control issues. Sales and marketing spending increased approximately $1.5 million to support growth initiatives in the Radiation Measurement segment.
Operating income for fiscal 2015 was $23.7 million, compared to an operating loss of $40.0 million for fiscal 2014. The increase in operating income was primarily due to the $62.2 million goodwill and other intangible assets impairment charge recorded in fiscal 2014 that was not present in fiscal 2015 and a $2.8 million reduction in acquisition, reorganization and nonrecurring costs.
Equity in income of joint ventures for fiscal 2015 was $2.3 million, a decrease of $0.6 million, or 21.5%, compared to $2.9 million for fiscal 2014. The decrease resulted primarily from the unfavorable foreign currency impact on equity earnings from our joint venture in Japan.
Interest expense, net for fiscal 2015 was $4.4 million, an increase of $0.9 million, or 27.6%, compared to interest expense, net of $3.4 million for fiscal 2014. The increase was due to lower investment and interest income.
The effective tax rate for fiscal 2015 was 29.4%, or a $6.3 million provision, compared to 39.0%, or a ($15.8) million benefit, for fiscal 2014. The decrease in the fiscal 2015 effective tax rate was primarily due to the retroactive enactment of the research and development credit for calendar year 2014 in the first fiscal quarter of 2015, the mix of earnings between jurisdictions with differing tax rates and the realization of an unrecognized tax benefit.
Net income attributed to Landauer, Inc. for fiscal 2015 was $14.5 million compared to a net loss of $25.2 million for fiscal 2014. The increase in net income was driven primarily by the fiscal 2014 impairment charges that were not present in fiscal 2015.
Radiation Measurement Segment
Radiation Measurement revenues for fiscal 2015 were $106.0 million, a decrease of $7.6 million, or 6.7%, compared to revenues of $113.6 million for fiscal 2014. The decrease in revenues was primarily due to the unfavorable impact of changes in foreign currency exchange rates of $5.3 million and a decrease in product sales to the military of $2.2 million.
30
Radiation Measurement operating income for fiscal 2015 was $35.6 million, a decrease of $2.6 million, or 6.8%, compared with operating income of $38.2 million for fiscal 2014. The decrease in operating income was primarily due to $0.7 million in lower military sales in fiscal 2015, and a $1.7 million sale of custom equipment to Canada in fiscal 2014. In addition, the net impact of unfavorable foreign currency exchange rates on revenues and operating expenses was $1.3 million.
Medical Physics Segment
Medical Physics revenues for fiscal 2015 were $35.4 million, an increase of $3.2 million, or 9.9%, compared to revenues of $32.2 million for fiscal 2014. The increase in revenue was primarily attributable to increased imaging services of $2.2 million, driven by higher demand for the Company’s solutions for The Joint Commission’s new Diagnostic Imaging requirements that became effective for hospitals and ambulatory care centers on July 1, 2015. In addition, commissioning revenue increased by $1.5 million due to a higher volume of projects. These increases were partially offset by a decrease in therapy services of $0.5 million.
Medical Physics operating income for fiscal 2015 was $3.1 million, an increase of $1.3 million, or 72.2%, compared with operating income of $1.8 million for fiscal 2014. The increase in operating income was primarily due to higher imaging and commissioning services revenue.
Medical Products Segment
Medical Products revenues for fiscal 2015 were $9.9 million, an increase of $0.6 million, or 6.5%, compared to revenues of $9.3 million for fiscal 2014. The increase was primarily due to the full year impact of a modest acquisition in December 2013.
Medical Products operating income for fiscal 2015 was $1.5 million, compared to an operating loss of $62.6 million for fiscal 2014. The increase in operating income was due to the $62.2 million goodwill and other intangible assets impairment charge recorded in fiscal 2014 that was not present in fiscal 2015.
Corporate Selling, General and Administrative Expenses
Corporate selling, general and administrative expenses reflect costs associated with supporting the Company, including executive management and administrative functions such as accounting, treasury, legal, human resources, and information technology management, as well as other costs required to support the Company. Corporate expenses for fiscal 2015 were $16.6 million, a decrease of $0.9 million, or 5.1%, compared to $17.5 million for fiscal 2014. The decrease was primarily due to a reduction in reorganization costs of $2.4 million in fiscal 2015 compared to the prior year, partially offset by higher legal, audit and other professional fees of $2.0 million recorded in the current year as a result of the fiscal 2014 Form 10-K restatement and the fees incurred to remediate the internal control deficiencies.
Comparison of the Fiscal Years Ended September 30, 2014 and 2013
Revenues for fiscal 2014 were $155.1 million, an increase of $5.4 million, or 3.6%, compared with revenues of $149.7 million for fiscal 2013. The Radiation Measurement segment increased $4.2 million due to higher international equipment sales and service revenue growth. The Medical Physics segment increased $1.4 million due to increased imaging and radiation therapy services. The Medical Products segment decreased $0.2 million as a result of continued pressure on Spherz product pricing partially offset by $0.8 million from a modest acquisition in Germany.
Gross margin was 52.2% for fiscal 2014, compared with 52.5% for fiscal 2013. Approximately 1.0% of the decline in gross margin was driven by increased staffing expenses in the Medical Physics segment to support additional contracts in the imaging and therapy divisions, and 0.6% of the decline in gross margin was due to the Medical Products segment, driven by Spherz price pressure. The decrease in gross margins in the Medical Physics and Medical Products segments more than offset higher gross margins in the Radiation Measurement segment due to a favorable product mix.
31
Selling, general and administrative expenses for fiscal 2014 were $54.9 million, an increase of $3.8 million, or 7.4%, compared with selling, general and administrative expenses of $51.1 million for fiscal 2013. The increase was due to a $1.7 million increase in research and development costs, primarily to support the Verifii next generation dosimetry platform, higher legal, audit and other expenses of $1.4 million and increased bad debt expense of $1.1 million.
During the third quarter of fiscal 2014, revenue and profitability trends in our IZI Medical Products reporting unit were not being achieved to the extent forecasted, and early budget reviews also indicated future sales growth and margins may be less than expected. The forecast for the IZI Medical Products reporting unit was updated based on the most recent financial results and our best estimates of future operations. The updated forecast reflected slower growth in revenues and lower margins, primarily due to anticipated continued competitive pricing pressure. As a result, the Company performed an impairment analysis of goodwill and intangible assets in the IZI Medical Products reporting unit, which indicated that the carrying amounts of these assets exceeded their fair values. The Company recorded a pretax charge of $41.4 million to reduce the carrying amount of goodwill and a pretax charge of $20.8 million to reduce the carrying amount of intangible assets. During fiscal 2013, the Company recorded a $22.7 million pretax goodwill impairment charge for this same reporting unit. The impairment charges were non-cash in nature and do not affect the Company’s liquidity or debt covenant compliance.
Acquisition, reorganization and nonrecurring costs were $3.8 million for fiscal 2014 and consisted of $3.5 million for severance related to changes in selected management roles and $0.3 million of costs related to acquisitions.
Operating loss for fiscal 2014 was $40.0 million, compared with operating income of $3.4 million for fiscal 2013. The difference was due primarily to increased impairment charges of $39.5 million, increased selling, general and administrative expenses of $3.8 million, and increased acquisition, reorganization and nonrecurring costs of $2.4 million, offset by an increase in gross profit of $2.3 million as a result of higher revenue and favorable product mix.
Equity in income of joint ventures for fiscal 2014 was $2.9 million, a decrease of $0.4 million, or 12.1%, compared with equity in income of joint ventures of $3.3 million for fiscal 2013. The decrease in equity income resulted from a $0.3 million decrease in equity income from the Nagase joint venture due to the unfavorable impact of foreign exchange.
Interest expense, net for fiscal 2014 was $3.4 million, a decrease of $0.9 million, or 20.9%, compared with interest expense of $4.3 million for fiscal 2013. The decrease was due to a reduction in long-term borrowings during fiscal 2014.
The effective tax rate was 39.0%, or ($15.8) million benefit, and (18.1%), or ($0.6) million benefit, for fiscal 2014 and 2013, respectively. The fiscal 2014 effective tax rate decreased due primarily to the mix of domestic and foreign earnings, permanently reinvested earnings, income from investments and permanent differences.
Net loss attributed to Landauer, Inc. for fiscal 2014 was $25.2 million, compared with net income of $2.8 million for fiscal 2013. The difference was due primarily to increased impairment charges of $39.5 million, increased selling, general and administrative expenses of $3.8 million, and increased acquisition, reorganization and nonrecurring costs of $2.4 million, partially offset by an increase in gross profit of $2.3 million and an increase in income tax benefit of $15.2 million.
Radiation Measurement Segment
Radiation Measurement revenues for fiscal 2014 were $113.6 million, an increase of $4.2 million, or 3.8%, compared with revenues of $109.3 million for fiscal 2013. The increase was due primarily to product and service revenue growth in Europe of $3.4 million and a custom equipment sale in Canada of $1.7 million partially offset by lower revenue in China of $1.7 million due to significant equipment sales in fiscal 2013. Domestic Radiation Measurement revenues increased $0.9 million due to InLight product sales.
32
Radiation Measurement operating income for fiscal 2014 was $38.2 million, a decrease of $0.5 million, or 1.3%, compared with operating income of $38.7 million for fiscal 2013. The increase in gross profit as a result of higher sales was more than offset by increases in research and development expenses of $1.5 million, primarily related to Verifii next generation dosimetry platform development, bad debt expense of $1.1 million, and professional and consulting fees of $0.6 million.
Medical Physics Segment
Medical Physics revenues were $32.2 million for fiscal 2014, an increase of $1.3 million, or 4.2%, compared with revenues of $30.9 million for fiscal 2013. The increase in revenue is primarily attributable to increased imaging and radiation therapy services.
Medical Physics operating income for fiscal 2014 was $1.8 million, a decrease of $1.7 million, or 48.6%, compared with operating income of $3.5 million for fiscal 2013. The increase in revenues was more than offset by increased staffing expenses of $2.9 million to support additional contracts in the imaging and therapy divisions and to support the increasing demand for our outsourced enterprise radiation safety solutions.
Medical Products Segment
Medical Products revenues for fiscal 2014 were $9.3 million, a decrease of $0.2 million, or 2.1%, compared with revenues of $9.5 million for fiscal 2013. The $0.2 million decrease is a result of continued pressure on Spherz product pricing partially offset by $0.8 million from a modest acquisition in Germany.
Medical Products operating loss for fiscal 2014 was $62.6 million, compared to an operating loss of $21.8 million for fiscal 2013. Operating loss included impairment charges of $62.2 million and $22.7 million for fiscal 2014 and 2013, respectively. The additional increase in operating loss, not related to impairment charges, of $0.9 million was due primarily to lower Spherz price and higher research and development expense.
Corporate, General and Administrative Expenses
Corporate, general and administrative expenses reflect costs associated with supporting the Company, including executive management and administrative functions such as accounting, treasury, legal, human resources, and information technology management, as well as other costs required to support the Company. Corporate expenses for fiscal 2014 were $17.5 million, an increase of $0.5 million as compared to $17.0 million for fiscal 2013. The increase was due to a $2.4 million increase in restructuring and other non-recurring expenses, primarily severance, and legal, audit and other expenses, partially offset by a decrease in incentive compensation for executive management.
Liquidity and Capital Resources
Cash and cash equivalents increased $8.5 million to $15.3 million during fiscal 2015. The Company’s primary sources of liquidity are cash flows from operating activities and funds available under its syndicated credit facility. As of September 30, 2015, the Company had $41.6 million of unused availability under its current $175.0 million credit facility and was in compliance with all covenants. The change in cash and cash equivalents is as follows:
|
(Dollars in Thousands) |
2015 |
2014 |
2013 |
||||||
|
Net cash provided by (used in): |
|||||||||
|
Operating activities |
$ |
28,253 |
$ |
36,685 |
$ |
25,349 | |||
|
Investing activities |
(2,278) | (7,216) | (11,679) | ||||||
|
Financing activities |
(16,523) | (30,905) | (20,673) | ||||||
|
Effect of foreign currency translation |
(899) | (475) |
- |
||||||
|
Net increase (decrease) in cash and cash equivalents |
$ |
8,553 |
$ |
(1,911) |
$ |
(7,003) |
33
Net cash provided by operating activities for fiscal 2015 was $28.3 million, a 22.9% decrease compared to $36.7 million for fiscal 2014. The decrease was primarily due to the change in operating liabilities in fiscal 2015 compared to fiscal 2014, driven by a $4.1 million decrease in accounts payable and other accrued liabilities and a $4.5 million decrease in other operating liabilities, net.
Net cash used in investing activities for fiscal 2015 was $2.3 million, a 68.1% decrease compared to $7.2 million for fiscal 2014. The decrease was primarily due to the $7.0 million in proceeds received from the disposition of the Radon business in fiscal 2015. Spending on property, plant and equipment increased by $3.8 million during fiscal 2015 to $8.0 million, primarily due to increased information technology expenditures associated with the Verifii next-generation dosimetry platform, partially offset by the acquisition of a small German distributor for $1.8 million in fiscal 2014.
Net cash used in financing activities for fiscal 2015 was $16.5 million, a 46.6% decrease compared to $30.9 million for fiscal 2014. Cash flows from financing activities are comprised primarily of long-term borrowings on the credit facility, repayments of long-term borrowings and payments of cash dividends to shareholders. The decrease was primarily due to $12.5 million in lower debt repayments partially offset by $3.5 million in lower debt borrowings, and $5.1 million in reduced dividend payments.
During fiscal 2015, the Company paid cash dividends of $15.9 million, or $1.65 per share, compared to $21.0 million, or $2.20 per share, during fiscal 2014. The Company reduced its quarterly dividend payment from $0.55 per share in the previous quarters to $0.275 per share during the third fiscal quarter of 2015. The Company has no indefinite reinvested foreign earnings and profits.
Borrowings under the credit agreement are classified as long-term debt. The balance outstanding under the Company’s credit agreement was $133.4 million and $133.6 million as of September 30, 2015 and 2014, respectively. Interest expense on the borrowings was $3.8 million, $4.0 million and $4.3 million for the fiscal years ended September 30, 2015, 2014 and 2013, respectively. The weighted average interest rate for the base and LIBOR rate was 2.7%, 2.6% and 2.9% for fiscal 2015, 2014 and 2013, respectively. The applicable interest rate for the base and LIBOR rate separately was 4.75% and 2.69% per annum at September 30, 2015 and 4.50% and 2.65% per annum at September 30, 2014.
The Company expects to meet short-term liquidity requirements (including capital expenditures) through net cash from operating activities and cash on hand. As of September 30, 2015, long-term liquidity requirements consist primarily of obligations under the long-term debt obligations. The Company does not have any required debt repayments until August 2, 2018, when the credit facility expires. Management expects that cash flows from operations and available lines of credit will be sufficient to support both the Company’s current operations and its anticipated debt obligations for the foreseeable future.
Contractual Obligations
The Company has various contractual obligations, which are recorded as liabilities in our consolidated financial statements. Other items, such as purchase commitments and other executory contracts are not recognized as liabilities in our consolidated financial statements but are required to be disclosed in the footnotes to the financial statements. For example, the Company is contractually committed to make certain minimum lease payments for the use of property under operating lease agreements.
The following table summarizes our significant contractual obligations and commitments on an undiscounted basis at September 30, 2015, and the future periods in which such obligations are expected to be settled in cash. In addition, the table reflects the timing of principal and interest payments on outstanding borrowings based on their contractual maturities. Additional details regarding these obligations are provided in the Notes to Consolidated Financial Statements, as referenced in the table:
34
|
Scheduled Payments by Period |
|||||||||||||||
|
(Dollars in Thousands) |
Total |
2016 |
2017-18 |
2019-20 |
Thereafter |
||||||||||
|
Long-term debt (Note 10) |
$ |
133,385 |
$ |
- |
$ |
133,385 |
$ |
- |
$ |
- |
|||||
|
Estimated interest on long-term debt (1) |
10,582 | 3,735 | 6,847 |
- |
- |
||||||||||
|
Capital leases |
49 | 15 | 34 |
- |
- |
||||||||||
|
Operating leases |
4,557 | 1,125 | 1,770 | 1,519 | 143 | ||||||||||
|
Purchase obligations (2) |
13,714 | 13,486 | 171 | 57 |
- |
||||||||||
|
Dividends (3) |
2,684 | 2,684 |
- |
- |
- |
||||||||||
|
Pension and postretirement benefits (Note 12) (4) |
4,283 | 405 | 838 | 875 | 2,165 | ||||||||||
|
Severance |
972 | 972 |
- |
- |
- |
||||||||||
|
Other long-term liabilities |
615 |
- |
615 |
- |
- |
||||||||||
|
Total obligations |
$ |
170,841 |
$ |
22,422 |
$ |
143,660 |
$ |
2,451 |
$ |
2,308 | |||||
(1)Estimated interest expense on the corresponding long-term debt using a variable interest rate of 2.8% for the current outstanding borrowing facility at September 30, 2015 with no planned repayment until the expiration date in August 2018.
(2)Includes accounts payable at September 30, 2015 and other agreements to purchase goods or services including open purchase orders; also includes the remaining contractual obligations associated with the Company’s IT platform enhancement.
(3)Cash dividends in the amount of $0.275 per share were declared on August 25, 2015. The dividend was paid on October 2, 2015.
(4)Includes estimated future benefit payments for supplemental key executive retirement plans and a terminated retirement plan that provides certain retirement benefits payable to non-employee directors. The amounts are actuarially determined, which includes the use of assumptions, and may vary significantly from expectations.
The Company is not able to reasonably estimate the ultimate timing of the payments or the amount by which its uncertain tax positions of $2.3 million will be settled. Therefore, the liability is excluded from the preceding table. See Note 9 to the Consolidated Financial Statements for additional information regarding the Company’s income taxes.
Off-Balance Sheet Arrangements
At September 30, 2015, the Company had no off-balance sheet financing or other arrangements with unconsolidated entities or financial partnerships (such as entities often referred to as structured finance or special purpose entities) established for purposes of facilitating off-balance sheet financing or other debt arrangements or for other contractually narrow or limited purposes.
35
Critical Accounting Policies and Estimates
The preparation of financial statements in conformity with U.S. GAAP requires that management apply accounting policies and make estimates and assumptions that affect the results of operations and the amounts of assets and liabilities reported in the financial statements, as well as related disclosures. Management discusses these policies, estimates and assumptions with its accounting and disclosure governance committee on a regular basis and provides periodic updates on management decisions to the Audit Committee of the Landauer Board of Directors. Critical accounting policies are those that are most important to the portrayal of a company’s financial condition and results of operations, and that require management’s most difficult, subjective or complex judgments, often as a result of the need to make estimates about the effect of matters that are inherently uncertain. We believe that the application of the accounting policies described below require significant judgments and estimates on the part of management in the preparation of the Company’s financial statements and accompanying notes. For a summary of our significant accounting policies, including the accounting policies discussed below, see Note 1 to the Consolidated Financial Statements.
Revenue Recognition and Deferred Contract Revenue
The majority of Radiation Measurement revenues are realized from radiation measurement services and other services incidental to radiation dose measurement. The measuring and monitoring services provided by the Company to its customers are of a subscription nature and are continuous. The Company views its business in the Radiation Measurement segment as services provided to customers over a period of time and the wear period is the period over which those services are provided. Badge production, wearing of badges, badge analysis, and report preparation are integral to the benefit that the Company provides to its customers. These services are provided to customers on an agreed-upon recurring basis (monthly, bi-monthly, quarterly, semi-annually or annually) that the customer chooses for the wear period. Revenue is recognized on a straight-line basis, adjusted for changes in pricing and volume, over the wear period. Revenues are recognized over the periods in which the customers wear the badges irrespective of whether invoiced in advance or in arrears. To a lesser degree, the Company provides equipment and sells badges to smaller distributors and joint ventures. Radiation Measurement segment product revenues are recognized upon delivery of goods when title and risk of loss pass to customers.
The Company, through its Medical Physics segment, offers full scope medical physics services to hospitals and radiation therapy centers. Services offered include, but are not limited to, clinical physics support in radiation oncology, commissioning services, special projects support and imaging physics services. Delivery of medical physics services can be of a contracted, recurring nature or as a discrete project with a defined service outcome. Recurring services often are provided on the customer’s premises by a full-time employee or fraction of a full-time employee. These services are recognized as revenue on a straight-line basis over the life of the contract unless there is another discernable pattern as the services are rendered. Fee for service revenue is recognized when the service is delivered.
Contracted services are billed on an agreed-upon recurring basis, either in advance or arrears of the service being delivered. Customers may be billed monthly, quarterly, or at some other regular interval over the contracted period. The amounts recorded as deferred contract revenue represent invoiced amounts in advance of delivery of the service. Management believes that the amount of deferred contract revenue fairly represents remaining business activity with customers invoiced in advance. Fee for service revenue is typically associated with much shorter contract periods, or with discrete individual projects, and revenue is recognized upon completion of the project and customer acceptance.
The Medical Products segment offers a broad product portfolio ranging from consumables used with MRI, CT, and mammography technologies to highly engineered consumable passive reflective markers used during image guided surgery procedures. The Medical Products segment recognizes revenues upon shipment or delivery of goods when title and risk of loss pass to customers.
36
Property, Plant & Equipment and Other Assets
Maintenance and repairs are charged to expense and renewals and betterments are capitalized. Plant and equipment and other assets, primarily dosimetry badges, are recorded at cost and are depreciated or amortized on a straight-line basis over the estimated useful lives, which are primarily 30 years for buildings, 3 to 8 years for equipment, 5 to 10 years for internal software and 30 months to 8 years for dosimetry devices. The Company assesses the carrying value and the remaining useful lives of its property, plant, equipment and other assets when events or circumstances indicate the carrying value may not be recoverable or the estimated useful life may no longer be appropriate. Factors that could trigger this review include competitive conditions, government regulations and technological changes. Any change in the carrying value or estimated useful lives of property, plant, equipment and other assets could materially impact the Company’s results of operation, financial position and liquidity.
The Company capitalizes costs of software which is acquired, internally developed, or modified solely to meet the Company’s internal needs. Internal and external costs incurred to develop internal-use computer software during the application development stage are capitalized. Costs incurred during the preliminary project stage as well as training costs and maintenance costs during the post implementation-operation stage are expensed. Capitalized costs of software amounted to $0.7 million and $1.0 million for fiscal 2015 and 2014, respectively.
Goodwill and Other Intangible Assets
The Company’s intangible assets include purchased customer lists, licenses, patents, trademarks, tradenames and goodwill. Purchased customer lists are recorded at cost and are amortized on a straight-line basis over estimated useful lives, which range from 4 to 15 years. Patents and licenses are also recorded at cost and are amortized on a straight-line basis over their useful lives, which range from 10 to 20 years. Tradenames have both definite lives up to 10 years and indefinite lives. The Company acquired goodwill primarily from its acquisitions of Landauer-Europe, SAPRA-Landauer, LMP and IZI as well as other smaller investments. Goodwill has an indefinite life.
Goodwill and certain intangible assets with indefinite lives are reviewed annually for impairment and more frequently if an event occurs or circumstances change that would require the Company to perform an interim review. The Company has three reporting units: Radiation Measurement; Medical Physics; and Medical Products.
Goodwill impairment testing first requires a comparison between the carrying value and fair value of a reporting unit with associated goodwill. Carrying value is based on the assets and liabilities associated with the operations of that reporting segment. The Company estimates the fair value of the reporting units using the income approach and the market approach. If the Company believes that the fair value of a reporting unit exceeds its carrying value by a substantial margin, the Company may perform a qualitative analysis instead.
If the fair value of a reporting unit exceeds its carrying amount, goodwill of the reporting unit is considered not to be impaired and the second step of the impairment test is unnecessary. If the carrying amount of the reporting unit exceeds its fair value, the second step of the goodwill impairment test is performed to measure the amount of the impairment loss, if any. The second step of the goodwill impairment test compares the implied fair value of the reporting unit’s goodwill with the carrying amount of that goodwill. If the carrying amount of the reporting unit’s goodwill exceeds the implied fair value of that goodwill, an impairment loss is recognized in an amount equal to that excess. The implied fair value of goodwill is determined in the same manner as the amount of goodwill recognized in a business combination. That is, the fair value of the reporting unit is allocated to all of the assets and liabilities of that reporting unit (including any unrecognized intangible assets) as if the reporting unit had been acquired in a business combination, and the fair value of the reporting unit was the purchase price paid to acquire the reporting unit.
37
The Company estimated the fair value of the Radiation Measurement, Medical Physics and Medical Products reporting units as of September 30, 2015 using the income approach and the market approach, and no impairment charges resulted. In the income approach, the Company utilized a discounted cash flow analysis, which involved estimating the expected after-tax cash flows that will be generated by the reporting segments and then discounting these cash flows to present value reflecting the relevant risks associated with the reporting unit and the time value of money. This approach requires the use of significant estimates and assumptions, including long-term projections of future cash flows, market conditions, discount rates reflecting the risk inherent in future cash flows, revenue growth, perpetual growth rates and profitability, among others.
The market approach is primarily comprised of comparable companies. This approach compares the subject segment to selected reasonably similar companies whose securities are actively traded in the public markets. For companies providing services similar to those provided by the Company, the income and market approaches will generally provide the most reliable indications of value because the value of such companies is more dependent on their ability to generate earnings than on the value of the individual assets.
The Company completed an impairment test for Medical Products as of June 30, 2014 when it became apparent that anticipated revenue and profitability trends in Medical Products were not being achieved to the extent forecasted. Based on the testing performed, the Company recorded a non-cash impairment charge of $62.2 million, of which $41.4 million related to goodwill and $20.8 million related to intangible assets for the fiscal year ended September 30, 2014.
Intangible assets represent purchased assets that lack physical substance but can be distinguished from goodwill. The Company uses valuation techniques in estimating the initial fair value of acquired intangible assets. These valuations are primarily based on the present value of the estimated net cash flows expected to be derived from the intangible assets, discounted for assumptions such as future customer attrition. The Company evaluates intangible assets for impairment annually or whenever events or changes in circumstances indicate that the carrying amount of the assets may not be recoverable. Therefore, changes such as higher or earlier-than-expected customer attrition or obsolescence of technology may result in higher future amortization charges or an impairment charge for intangible assets. See Note 7 to the Consolidated Financial Statements for additional information regarding the value of goodwill and other intangible assets.
Income Taxes
The Company estimates the income tax provision for income taxes that are currently payable and records deferred income tax assets and liabilities for the temporary differences in tax consequences between the financial statements and tax returns. Temporary differences result from, among other events, revenues, expenses, gains, or losses that are included in taxable income of an earlier or later year than the year in which they are recognized in financial statement income. These deferred income tax assets and liabilities are measured using enacted tax rates expected to apply to taxable income in the years in which those temporary differences are expected to be recovered or settled. To the extent that deferred income tax assets will not likely be recovered from future taxable income, a valuation allowance is established against such deferred income tax assets. The Company has no indefinite reinvestment assertions on its foreign earnings and profits.
Management exercises significant judgment in the valuation of its current and deferred income tax assets and liabilities. The Company recognizes the financial statement effects of its tax positions in its current and deferred income tax assets and liabilities when it is more likely than not that the position will be sustained upon examination by a taxing authority. Management considers, among other factors, the Company’s current and past performance, the market environment in which the Company operates, and tax planning strategies. Further, the Company provides for income tax issues not yet resolved with federal, state, local, and foreign tax authorities. The Company assesses and updates its tax positions when significant changes in circumstances occur, which may cause a change in judgment about the likelihood of realizing the deferred items. Changes in circumstances or judgment about tax positions may cause a change in the Company’s uncertain tax position. Variations in the actual outcome of these future tax consequences could materially impact the Company’s results of operations, financial position and liquidity. See Note 9 to the Consolidated Financial Statements for additional information regarding the Company’s income taxes.
38
Defined Benefit Pension and Other Postretirement Benefit Plans
The defined benefit pension and other postretirement benefit plans were frozen as of March 2009. The pension expenses and benefit obligations recorded for the Company’s defined benefit plans are dependent on actuarial assumptions. These assumptions include discount rates, expected return on plan assets, interest costs, expected compensation increases, benefits earned, mortality rates, and other factors. Management reviews the plan assumptions on an annual basis to ensure that the most current, relevant information is considered. During fiscal 2014, the Company adopted the RP-2014 mortality tables and the Mortality Improvement Scale MP-2014 published by the Society of Actuaries’ Retirement Plans Experience Committee. The pension expense for fiscal year 2014 was derived based on the 2013 IRS Static Mortality table, while the pension expense for fiscal year 2015 was derived based on the RP-2014 Mortality Table with Scale MP, to reflect future mortality improvements. If actual results vary considerably from those that are expected or if future changes are made to these assumptions, the amounts recognized for these plans could change significantly.
The weighted-average assumed discount rates used to determine plan expenses were 4.14% for pension benefits and 3.40% for other benefits in fiscal 2015, compared to 4.72% for both pension and other benefits in fiscal 2014. For fiscal 2015 expense, the expected long-term rate of return of plan assets was 6.50%, unchanged from fiscal 2014. In establishing the rate, management considered the historical rates of return and the current and planned asset classes of the plan investment portfolio. The weighted-average discount rate used to determine benefit obligations at September 30, 2015 was 4.15%, 3.80%, 4.06% and 2.98% for Pension, Key Executive SERP, Manager SERP and Directors plans, respectively, under “Pension Benefits” in the “Employee Benefit Plans” footnote of this Annual Report on Form 10-K. The weighted-average discount rate used to determine benefit obligations under “Other Benefits” was 3.43% at September 30, 2015. Comparatively, the weighted-average discount rates used to determine benefit obligations at September 30, 2014 was 4.14%, 3.77%, 4.12% and 2.98% for Pension, Key Executive SERP, Manager SERP and Directors plans, respectively, and the weighted-average discount rate used to determine benefit obligations under “Other Benefits” was 3.40% at September 30, 2014.
The Company recognizes on its balance sheet the amount by which the projected benefit obligations of its defined benefit plans exceed the fair value of plan assets. Subsequent changes in the funded status of the plans as a result of future transactions and events, amortization of previously unrecognized costs, and changes to actuarial assumptions are recognized as an asset or a liability and amortized as components of net periodic pension cost or accumulated other comprehensive income. An increase or decrease in the assumptions or economic events outside of management’s control could have a material effect on the Company’s results of operations or financial condition. See Note 12 to the Consolidated Financial Statements for additional information regarding these benefit plans.
Stock-Based Compensation
The Company measures and recognizes compensation cost at fair value for all stock-based awards, net of the estimated impact of forfeited awards. The Company has not granted stock options subsequent to fiscal 2005. The fair values of options were estimated using a Black-Scholes option pricing model. In addition to stock options, key employees and/or non-employee directors are eligible to receive performance shares and restricted stock.
Upon the adoption of the Company’s Incentive Compensation Plan in February 2008, the fair value of the restricted stock and performance shares granted under the new plan is based on the Company’s closing stock price on the grant date. Stock-based compensation expense for restricted stock is cliff vested and recognized ratably over the vesting period. The terms of performance share awards allow the recipients of such awards to earn a variable number of shares based on the achievement of the performance goals specified in the awards. Stock-based compensation expense associated with performance share awards is cliff vested and recognized based on management’s best estimates of the achievement of the performance goals specified in such awards and the resulting number of shares that are expected to be earned. The Company evaluates on a quarterly basis the progress towards achieving the performance criteria. The cumulative effect on current and prior periods of a change in the estimated number of performance share awards expected to be earned is recognized as compensation cost or as a reduction of cost in the period of the revised estimate. The Company also retains the discretion to make additional awards to executives at other times for recruiting or retention purposes. Stock-based compensation for these awards can be either cliff or graded vested depending on the agreement, and recognized ratably over the vesting period.
39
Forfeitures of awards are estimated at the time of grant and stock-based compensation cost is recognized only for those awards expected to vest. The Company uses historical experience to estimate projected forfeitures. The Company recognizes the cumulative effect on current and prior periods of a change in the forfeiture rate, or actual forfeitures, as compensation cost or as a reduction of cost in the period of the revision. If revisions are made to management’s assumptions and estimates or if actual results vary considerably from those that are expected, stock-based compensation expense could change significantly, impacting the Company’s results of operations or financial condition. See Note 14 to the Consolidated Financial Statements for additional information regarding the Company’s stock-based awards.
Recent Accounting Pronouncements
See Note 1 to the Consolidated Financial Statements for additional information regarding recent accounting pronouncements.
Inflation
The Company strives to reflect the inflationary impact of materials, labor and other operating costs and expenses in its prices. The market for the services and products that the Company offers, however, is highly competitive, and in some cases has limited the ability of the Company to offset inflationary cost increases.
Item 7A. Quantitative and Qualitative Disclosures about Market Risk.
The Company is exposed to market risk, including changes in foreign currency exchange rates. The financial statements of the Company’s international subsidiaries are remeasured into U.S. dollars monthly using the U.S. dollar as the reporting currency. To date, the market risk associated with foreign currency exchange rates has not been material in relation to the Company’s financial position, results of operations, or cash flows. These risks could increase, however, as the Company expands in international markets and markets becomes more volatile. The Company estimates that a 10% and 20% adverse change in the underlying foreign currency exchange rates would have decreased reported net income in fiscal 2015 by approximately $0.5 million and $1.0 million, respectively. Historically, the Company believes that adverse changes in foreign exchange rates have not materially impacted its financial condition.
The Company is subject to interest rate risk related to borrowings under the credit facility. The variable rate identified is based on LIBOR plus a calculated margin. See Note 10 to the Consolidated Financial Statements for additional information regarding the credit facility.
40
Item 8. Financial Statements and Supplementary Data.
Index to the Consolidated Financial Statements
|
|
|
|
|
42 |
||
|
43 |
||
|
46 |
||
|
47 |
||
|
48 |
||
|
49 |
||
|
50 |
||
| 50 | ||
|
Note 2 – Fair Value Measurements |
57 | |
|
Note 3 – Acquisition, Reorganization and Non-recurring Costs |
58 | |
|
Note 4 – Disposition of Business |
58 | |
|
Note 5 – Income (Loss) per Common Share |
59 | |
|
Note 6 – Equity in Joint Ventures |
59 | |
|
Note 7 – Goodwill and Other Intangible Assets |
60 | |
|
Note 8 – Accumulated Other Comprehensive Loss |
62 | |
|
Note 9 – Income Taxes |
63 | |
|
Note 10 – Credit Facility |
66 | |
|
Note 11 – Capital Stock |
66 | |
|
Note 12 – Employee Benefit Plans |
67 | |
|
Note 13 – Commitments and Contingencies |
72 | |
|
Note 14 – Stock-Based Compensation |
72 | |
|
Note 15 – Geographic Information |
74 | |
|
Note 16 – Segment Information |
74 | |
|
Note 17 – Related Party Transactions |
76 | |
|
Note 18 – Quarterly Financial Data (unaudited) |
77 | |
|
|
|
|
41
Report of Independent Registered Public Accounting Firm
Board of Directors and Stockholders
Landauer, Inc.
Glenwood, IL
We have audited the accompanying consolidated balance sheet of Landauer, Inc. and its subsidiaries as of September 30, 2015 and the related consolidated statements of operations and comprehensive income, stockholders’ equity, and cash flows for the year ended September 30, 2015. In connection with our audit of the consolidated financial statements, we have also audited the financial statement schedule listed in the accompanying index. These consolidated financial statements and schedule are the responsibility of the Company’s management. Our responsibility is to express an opinion on these consolidated financial statements and schedule based on our audit.
We conducted our audit in accordance with the standards of the Public Company Accounting Oversight Board (United States). Those standards require that we plan and perform the audit to obtain reasonable assurance about whether the consolidated financial statements are free of material misstatement. An audit also includes examining, on a test basis, evidence supporting the amounts and disclosures in the consolidated financial statements, assessing the accounting principles used and significant estimates made by management, as well as evaluating the overall presentation of the consolidated financial statements and schedule. We believe that our audit provides a reasonable basis for our opinion.
In our opinion, the consolidated financial statements referred to above present fairly, in all material respects, the financial position of Landauer, Inc. and its subsidiaries at September 30, 2015, and the results of its operations and its cash flows for the year ended September 30, 2015, in conformity with accounting principles generally accepted in the United States of America.
Also, in our opinion, the financial statement schedule, when considered in relation to the basic consolidated financial statements taken as a whole, presents fairly, in all material respects, the information set forth therein.
We also have audited, in accordance with the standards of the Public Company Accounting Oversight Board (United States), Landauer, Inc.’s internal control over financial reporting as of September 30, 2015, based on criteria established in Internal Control - Integrated Framework (1992) issued by the Committee of Sponsoring Organizations of the Treadway Commission (COSO) and our report dated December 14, 2015 expressed an adverse opinion thereon.
/s/ BDO USA, LLP
Chicago, IL
December 14, 2015
42
Report of Independent Registered Public Accounting Firm
To Stockholders and Board of Directors of Landauer, Inc.
In our opinion, the consolidated balance sheet as of September 30, 2014 and the related consolidated statements of operations, comprehensive (loss) income, stockholders’ equity and cash flows for each of two years in the period ended September 30, 2014 present fairly, in all material respects, the financial position of Landauer, Inc. and its subsidiaries at September 30, 2014, and the results of their operations and their cash flows for each of the two years in the period ended September 30, 2014, in conformity with accounting principles generally accepted in the United States of America. In addition, in our opinion, the financial statement schedule listed in the index appearing under Item 15(a)(2) for each of the two years in the period ended September 30, 2014 presents fairly, in all material respects, the information set forth therein when read in conjunction with the related consolidated financial statements. These financial statements and financial statement schedule are the responsibility of the Company's management. Our responsibility is to express an opinion on these financial statements and financial statement schedule based on our audits. We conducted our audits of these statements in accordance with the standards of the Public Company Accounting Oversight Board (United States). Those standards require that we plan and perform the audit to obtain reasonable assurance about whether the financial statements are free of material misstatement. An audit includes examining, on a test basis, evidence supporting the amounts and disclosures in the financial statements, assessing the accounting principles used and significant estimates made by management, and evaluating the overall financial statement presentation. We believe that our audits provide a reasonable basis for our opinion.
/s/ PricewaterhouseCoopers LLP
Chicago, IL
February 2, 2015
43
Landauer, Inc. and Subsidiaries
Consolidated Balance Sheets
As of September 30,
|
(Dollars in Thousands) |
2015 |
2014 |
||||
|
Assets |
||||||
|
Cash and cash equivalents |
$ |
15,314 |
$ |
6,761 | ||
|
Receivables, net of allowances of $1,556 in 2015 and $1,872 in 2014 |
32,412 | 34,707 | ||||
|
Inventories |
7,035 | 6,687 | ||||
|
Deferred income tax assets - current (Note 9) |
4,871 | 2,369 | ||||
|
Prepaid income taxes (Note 9) |
40 | 1,836 | ||||
|
Prepaid expenses and other current assets |
2,081 | 1,973 | ||||
|
Total current assets |
61,753 | 54,333 | ||||
|
Property, plant and equipment, at cost: |
||||||
|
Land and improvements |
626 | 626 | ||||
|
Buildings and improvements |
4,905 | 5,144 | ||||
|
Internal software |
50,746 | 50,710 | ||||
|
Equipment |
48,045 | 47,530 | ||||
|
Total property, plant and equipment |
104,322 | 104,010 | ||||
|
Accumulated depreciation and amortization |
(57,955) | (57,253) | ||||
|
Property, plant and equipment, net |
46,367 | 46,757 | ||||
|
Equity in joint ventures (Note 6) |
24,010 | 23,835 | ||||
|
Goodwill (Note 7) |
35,072 | 43,218 | ||||
|
Intangible assets, net of accumulated amortization of $38,662 in 2015 and $37,579 in 2014 |
13,052 | 14,077 | ||||
|
Dosimetry devices, net of accumulated depreciation of $5,282 in 2015 and $4,353 in 2014 |
3,562 | 3,958 | ||||
|
Deferred income tax assets (Note 9) |
16,702 | 18,374 | ||||
|
Other assets (Note 2) |
8,226 | 12,034 | ||||
|
Total Assets |
$ |
208,744 |
$ |
216,586 | ||
The accompanying notes are an integral part of these consolidated financial statements.
44
Landauer, Inc. and Subsidiaries
Consolidated Balance Sheets
As of September 30,
|
(Dollars in Thousands) |
2015 |
2014 |
||||
|
Liabilities |
||||||
|
Accounts payable |
$ |
5,773 |
$ |
6,248 | ||
|
Dividends payable (Note 11) |
2,684 | 5,329 | ||||
|
Deferred contract revenue |
13,904 | 14,750 | ||||
|
Accrued compensation and related costs |
8,603 | 7,132 | ||||
|
Accrued severance (Note 3) |
972 | 2,731 | ||||
|
Other accrued expenses |
6,557 | 8,538 | ||||
|
Total current liabilities |
38,493 | 44,728 | ||||
|
Long-term debt (Note 10) |
133,385 | 133,585 | ||||
|
Pension and postretirement obligations (Note 12) |
20,508 | 19,475 | ||||
|
Deferred income tax liabilities (Note 9) |
270 | 509 | ||||
|
Uncertain income tax liabilities (Note 9) |
2,310 | 3,284 | ||||
|
Other non-current liabilities |
1,451 | 1,271 | ||||
|
Total liabilities |
196,417 | 202,852 | ||||
|
Commitments and Contingencies (Note 13) |
||||||
|
Stockholders’ Equity |
||||||
|
Preferred stock, $.10 par value per share, authorized 1,000,000 shares; none issued |
- |
- |
||||
|
Common stock, $.10 par value per share, authorized 20,000,000 shares; 9,641,532 and 9,577,874 issued and outstanding, respectively, in 2015 and 2014 (Note 11) |
964 | 958 | ||||
|
Additional paid in capital |
41,531 | 40,317 | ||||
|
Accumulated other comprehensive loss |
(13,741) | (10,148) | ||||
|
(Accumulated deficit) retained earnings |
(17,559) | (18,873) | ||||
|
Landauer, Inc. stockholders’ equity |
11,195 | 12,254 | ||||
|
Noncontrolling interest |
1,132 | 1,480 | ||||
|
Total stockholders’ equity |
12,327 | 13,734 | ||||
|
Total Liabilities and Stockholders’ Equity |
$ |
208,744 |
$ |
216,586 | ||
The accompanying notes are an integral part of these consolidated financial statements.
45
Landauer, Inc. and Subsidiaries
Consolidated Statements of Operations
For the Years Ended September 30,
|
(Dollars in Thousands, Except per Share) |
2015 |
2014 |
2013 |
||||||
|
Revenues: |
|||||||||
|
Service revenues |
$ |
128,771 |
$ |
127,698 |
$ |
126,528 | |||
|
Product revenues |
22,543 | 27,364 | 23,162 | ||||||
|
Total revenues |
151,314 | 155,062 | 149,690 | ||||||
|
Costs and expenses: |
|||||||||
|
Service costs |
63,876 | 61,649 | 59,931 | ||||||
|
Product costs |
8,709 | 12,506 | 11,163 | ||||||
|
Total cost of sales |
72,585 | 74,155 | 71,094 | ||||||
|
Gross profit |
78,729 | 80,907 | 78,596 | ||||||
|
Selling, general and administrative |
53,989 | 54,904 | 51,115 | ||||||
|
Goodwill and other intangible assets impairment charge |
- |
62,188 | 22,700 | ||||||
|
Acquisition, reorganization and nonrecurring costs |
1,041 | 3,802 | 1,392 | ||||||
|
Operating income (loss) |
23,699 | (39,987) | 3,389 | ||||||
|
Equity in income of joint ventures |
2,307 | 2,939 | 3,251 | ||||||
|
Interest expense, net |
(4,370) | (3,424) | (4,311) | ||||||
|
Other (expense) income, net |
(314) | (26) | 747 | ||||||
|
Income (loss) before taxes |
21,322 | (40,498) | 3,076 | ||||||
|
Income tax expense (benefit) |
6,273 | (15,800) | (560) | ||||||
|
Net income (loss) |
15,049 | (24,698) | 3,636 | ||||||
|
Less: Net income attributed to noncontrolling interest |
506 | 505 | 854 | ||||||
|
Net income (loss) attributed to Landauer, Inc. |
$ |
14,543 |
$ |
(25,203) |
$ |
2,782 | |||
|
Net income (loss) per share attributed to Landauer, Inc. shareholders: |
|||||||||
|
Basic |
$ |
1.52 |
$ |
(2.65) |
$ |
0.28 | |||
|
Weighted average basic shares outstanding |
9,511 | 9,524 | 9,434 | ||||||
|
Diluted |
$ |
1.52 |
$ |
(2.65) |
$ |
0.27 | |||
|
Weighted average diluted shares outstanding |
9,540 | 9,524 | 9,482 | ||||||
The accompanying notes are an integral part of these consolidated financial statements.
46
Landauer, Inc. and Subsidiaries
Consolidated Statements of Comprehensive Income (Loss)
For the Years Ended September 30,
|
2015 |
|||||||||
|
(Dollars in Thousands) |
Landauer, Inc. |
Noncontrolling |
Total |
||||||
|
Net income |
$ |
14,543 |
$ |
506 |
$ |
15,049 | |||
|
Other comprehensive income (loss): |
|||||||||
|
Defined benefit pension and postretirement plans activity, net of taxes of $418 |
(711) |
- |
(711) | ||||||
|
Unrealized gains (losses) on available-for-sale securities, net of taxes of $17 |
93 |
- |
93 | ||||||
|
Foreign currency translation adjustment, net of taxes of $1,602 |
(2,975) | (379) | (3,354) | ||||||
|
Comprehensive income |
$ |
10,950 |
$ |
127 |
$ |
11,077 | |||
|
2014 |
|||||||||
|
(Dollars in Thousands) |
Landauer, Inc. |
Noncontrolling |
Total |
||||||
|
Net (loss) income |
$ |
(25,203) |
$ |
505 |
$ |
(24,698) | |||
|
Other comprehensive income (loss): |
|||||||||
|
Defined benefit pension and postretirement plans activity, net of taxes of $2,152 |
(3,664) |
- |
(3,664) | ||||||
|
Unrealized gains (losses) on available-for-sale securities, net of taxes of $4 |
34 |
- |
34 | ||||||
|
Foreign currency translation adjustment, net of taxes of $1,188 |
(2,110) | (111) | (2,221) | ||||||
|
Comprehensive (loss) income |
$ |
(30,943) |
$ |
394 |
$ |
(30,549) | |||
|
2013 |
|||||||||
|
(Dollars in Thousands) |
Landauer, Inc. |
Noncontrolling |
Total |
||||||
|
Net income |
$ |
2,782 |
$ |
854 |
$ |
3,636 | |||
|
Other comprehensive income (loss): |
|||||||||
|
Defined benefit pension and postretirement plans activity, net of taxes of ($1,790) |
3,015 |
- |
3,015 | ||||||
|
Unrealized gains (losses) on available-for-sale securities, net of taxes of $5 |
30 |
- |
30 | ||||||
|
Foreign currency translation adjustment, net of taxes of ($53) |
(2,078) | (177) | (2,255) | ||||||
|
Comprehensive income |
$ |
3,749 |
$ |
677 |
$ |
4,426 | |||
The accompanying notes are an integral part of these consolidated financial statements.
47
Landauer, Inc. and Subsidiaries
Consolidated Statements of Stockholders’ Equity
|
Landauer, Inc. Stockholders’ Equity |
|||||||||||||||||||
|
(Dollars in Thousands) |
Common Stock Shares |
Common |
Additional Paid In Capital |
Accumulated Other Comprehensive |
(Accumulated Deficit) Retained Earnings |
Non-controlling |
Total |
||||||||||||
|
Balance September 30, 2012 |
9,493,368 |
$ |
949 |
$ |
35,898 |
$ |
(5,375) |
$ |
45,596 |
$ |
1,334 |
$ |
78,402 | ||||||
|
Stock-based compensation arrangements |
82,558 | 9 | 3,567 |
- |
- |
- |
3,576 | ||||||||||||
|
Dividends |
- |
- |
- |
- |
(20,966) | (426) | (21,392) | ||||||||||||
|
Net income |
- |
- |
- |
- |
2,782 | 854 | 3,636 | ||||||||||||
|
Foreign currency translation adjustment |
- |
- |
- |
(2,078) |
- |
(177) | (2,255) | ||||||||||||
|
Unrealized gains (losses) on available-for-sale securities, net of tax |
- |
- |
- |
30 |
- |
- |
30 | ||||||||||||
|
Defined benefit pension and postretirement plans activity, net of tax |
- |
- |
- |
3,015 |
- |
- |
3,015 | ||||||||||||
|
Balance September 30, 2013 |
9,575,926 |
$ |
958 |
$ |
39,465 |
$ |
(4,408) |
$ |
27,412 |
$ |
1,585 |
$ |
65,012 | ||||||
|
Stock-based compensation arrangements |
1,948 |
- |
852 |
- |
- |
- |
852 | ||||||||||||
|
Dividends |
- |
- |
- |
- |
(21,082) | (499) | (21,581) | ||||||||||||
|
Net income |
- |
- |
- |
- |
(25,203) | 505 | (24,698) | ||||||||||||
|
Foreign currency translation adjustment |
- |
- |
- |
(2,110) |
- |
(111) | (2,221) | ||||||||||||
|
Unrealized gains (losses) on available-for-sale securities, net of tax |
- |
- |
- |
34 |
- |
- |
34 | ||||||||||||
|
Defined benefit pension and postretirement plans activity, net of tax |
- |
- |
- |
(3,664) |
- |
- |
(3,664) | ||||||||||||
|
Balance September 30, 2014 |
9,577,874 |
$ |
958 |
$ |
40,317 |
$ |
(10,148) |
$ |
(18,873) |
$ |
1,480 |
$ |
13,734 | ||||||
|
Stock-based compensation arrangements |
63,658 | 6 | 1,214 |
- |
- |
- |
1,220 | ||||||||||||
|
Dividends |
- |
- |
- |
- |
(13,229) | (475) | (13,704) | ||||||||||||
|
Net (loss) income |
- |
- |
- |
- |
14,543 | 506 | 15,049 | ||||||||||||
|
Foreign currency translation adjustment |
- |
- |
- |
(2,975) |
- |
(379) | (3,354) | ||||||||||||
|
Unrealized gains (losses) on available-for-sale securities, net of tax |
- |
- |
- |
93 |
- |
- |
93 | ||||||||||||
|
Defined benefit pension and postretirement plans activity, net of tax |
- |
- |
- |
(711) |
- |
- |
(711) | ||||||||||||
|
Balance September 30, 2015 |
9,641,532 |
$ |
964 |
$ |
41,531 |
$ |
(13,741) |
$ |
(17,559) |
$ |
1,132 |
$ |
12,327 | ||||||
The accompanying notes are an integral part of these consolidated financial statements.
48
Landauer, Inc. and Subsidiaries
Consolidated Statements of Cash Flows
For the Years Ended September 30,
|
(Dollars in Thousands) |
2015 |
2014 |
2013 |
||||||
|
Cash flows from operating activities: |
|||||||||
|
Net income (loss) |
$ |
15,049 |
$ |
(24,698) |
$ |
3,636 | |||
|
Adjustments to reconcile net income (loss) to net cash provided by operating activities: |
|||||||||
|
Depreciation and amortization |
12,312 | 13,915 | 15,051 | ||||||
|
Goodwill and other intangible assets impairment charge |
- |
62,188 | 22,700 | ||||||
|
Loss (gain) on sale, disposal and abandonment of assets |
181 | 208 | (32) | ||||||
|
Loss (gain) on investments |
176 | (419) | (366) | ||||||
|
Loss on disposition of business |
366 |
- |
- |
||||||
|
Equity in income of joint ventures |
(2,307) | (2,939) | (3,251) | ||||||
|
Dividends from joint ventures |
1,144 | 1,340 | 1,891 | ||||||
|
Stock-based compensation and related net tax benefits |
1,583 | 2,074 | 2,541 | ||||||
|
Current and long-term deferred income taxes, net |
238 | (26,920) | (4,680) | ||||||
|
Changes in operating assets and liabilities: |
|||||||||
|
Decrease (increase) in accounts receivable, net |
471 | 2,568 | (3,012) | ||||||
|
Decrease (increase) in prepaid income taxes |
1,694 | 1,363 | (1,130) | ||||||
|
(Increase) decrease in other operating assets, net |
(544) | 1,497 | (4,547) | ||||||
|
(Decrease) increase in accounts payable and other accrued liabilities |
(1,246) | 2,854 | 49 | ||||||
|
(Decrease) increase in other operating liabilities, net |
(864) | 3,654 | (3,501) | ||||||
|
Net cash provided by operating activities |
28,253 | 36,685 | 25,349 | ||||||
|
Cash flows from investing activities: |
|||||||||
|
Acquisition of property, plant and equipment |
(7,974) | (4,161) | (9,145) | ||||||
|
Proceeds from disposition of business |
6,958 |
- |
- |
||||||
|
Acquisition of joint ventures and businesses, net of cash acquired |
- |
(1,800) |
- |
||||||
|
Other investing activities, net |
(1,262) | (1,255) | (2,534) | ||||||
|
Net cash used in investing activities |
(2,278) | (7,216) | (11,679) | ||||||
|
Cash flows from financing activities: |
|||||||||
|
Net borrowings on revolving credit facility |
- |
(60) | (19) | ||||||
|
Long-term borrowings – loan |
30,300 | 33,800 | 27,691 | ||||||
|
Long-term borrowings – repayment |
(30,500) | (43,000) | (27,187) | ||||||
|
Dividends paid to stockholders |
(15,874) | (21,048) | (20,897) | ||||||
|
Other financing activities, net |
(449) | (597) | (261) | ||||||
|
Net cash used in financing activities |
(16,523) | (30,905) | (20,673) | ||||||
|
Effects of foreign currency translation |
(899) | (475) |
- |
||||||
|
Net increase (decrease) in cash and cash equivalents |
8,553 | (1,911) | (7,003) | ||||||
|
Opening balance – cash and cash equivalents |
6,761 | 8,672 | 15,675 | ||||||
|
Ending balance – cash and cash equivalents |
$ |
15,314 |
$ |
6,761 |
$ |
8,672 | |||
|
Supplemental disclosure of cash flow information: |
|||||||||
|
Accrued capital spending included in accounts payable and other accrued liabilities |
$ |
1,068 |
$ |
351 |
$ |
347 | |||
|
Cash paid for interest, net of amounts capitalized |
$ |
3,799 |
$ |
3,930 |
$ |
4,441 | |||
|
Cash paid for income taxes, net of refunds |
$ |
6,661 |
$ |
6,704 |
$ |
7,374 | |||
The accompanying notes are an integral part of these consolidated financial statements.
49
Landauer, Inc. and Subsidiaries
Notes to Consolidated Financial Statements
(Dollars in thousands)
1.Summary of Significant Accounting Policies
Description of Business
Landauer, Inc., together with the subsidiaries through which businesses are conducted (the “Company”), is a leading global provider of technical and analytical services to determine occupational and environmental radiation exposure, the leading domestic provider of outsourced medical physics services, and a provider of radiology related medical products. The Company operates in three primary business segments: Radiation Measurement; Medical Physics; and Medical Products. Additional information regarding the Company’s segments is contained in Note 16.
Basis of Presentation and Consolidation
The consolidated financial statements have been prepared in accordance with accounting principles generally accepted in the United States of America (“U.S. GAAP”) and include the accounts of the Company, its subsidiaries and variable interest entities in which the Company has a controlling financial interest. All intercompany balances and transactions have been eliminated in consolidation. Entities in which the Company does not have a controlling financial interest, but is considered to have significant influence, are accounted for on the equity method.
Use of Estimates
The preparation of financial statements in conformity with U.S. GAAP requires management to make estimates and assumptions that affect the reported amounts of assets and liabilities and disclosure of contingent assets and liabilities at the date of the consolidated financial statements and the reported amounts of revenues and expenses during the reporting period. Actual results could differ from those estimates.
Cash and Cash Equivalents
Cash and cash equivalents include all unrestricted cash and highly liquid investments with an original maturity of three months or less, primarily short-term money market instruments.
Restricted Cash
Restricted cash represents funds that are restricted to satisfy designated current liabilities. As of September 30, 2014, the Company’s restricted cash represented deposits from an international customer that were held from the Company subject to the achievement of specified conditions. This balance was included in “Other current assets.” The Company successfully fulfilled the conditions in October 2014 and the funds were released and no longer restricted.
Receivables, Net of Allowances
Receivables, principally trade accounts receivable, are generally due within 30 to 90 days and are stated at amounts due from customers, net of an allowance for sales returns and doubtful accounts. The Company performs ongoing credit evaluations of its customers and adjusts credit limits based upon payment history and the customer’s current creditworthiness, as determined by a review of their current credit information. We continuously monitor aging reports, collections and payments from customers, and a provision for estimated credit losses is maintained based upon the Company’s historical experience and any specific customer collection issues that have been identified. While such credit losses have historically been within our expectations and the provisions established, we cannot guarantee that the same credit loss rates will be experienced in the future. The Company writes off accounts receivable when they are determined to be uncollectible.
50
Inventories
Inventories primarily include the components associated with dosimetry devices, which are stated at lower of cost or market utilizing a first-in, first-out method.
Long-lived Assets
Property, plant and equipment are stated at cost, net of accumulated depreciation and amortization. Plant, equipment and internal use software are depreciated on a straight-line basis over their respective estimated useful lives. Dosimetry devices, principally badges, and the accompanying software are amortized on a straight-line basis over their estimated useful lives. Expenditures for maintenance and repairs are charged to expense as incurred, and renewals and betterments are capitalized. The following table provides a summary of estimated useful lives by asset category:
|
Estimated Useful Lives |
||
|
Buildings and improvements |
30 years |
|
|
Internal software |
5- 10 years |
|
|
Equipment |
3 - 8 years |
|
|
Dosimetry devices |
30 months - 8 years |
Long-lived assets, including definite-lived intangible assets, are reviewed for impairment whenever events or changes in business circumstances indicate that the carrying value of the assets may not be fully recoverable. The Company performs undiscounted operating cash flow analyses to determine if an impairment exists. For purposes of recognition and measurement of an impairment for assets held for use, the Company groups assets and liabilities at the lowest level for which cash flows are separately identifiable. If an impairment is determined to exist, any related impairment loss is calculated based on fair value. Impairment losses on assets to be disposed of, if any, are based on the estimated proceeds to be received, less costs of disposal. The Company also reviews the estimated remaining useful lives of long-lived assets whenever events or changes in business circumstances indicate the lives may have changed.
Equity in Joint Ventures
Entities in which the Company does not have a controlling financial interest but is considered to have significant influence are accounted for on the equity method. Under the equity method, a company records its share of net income or loss of an investment based on its percentage ownership. Additional information regarding the Company’s equity in joint ventures is contained in Note 6.
Goodwill and Other Intangible Assets
Goodwill and other indefinite-lived intangible assets must be assessed for impairment annually or more frequently if events or changes in circumstances indicate that such assets might be impaired. Triggering events include, but are not limited to a current period operating or cash flow loss; a product, technology or service introduced by a competitor; or a loss of key personnel.
Goodwill impairment testing first requires a comparison between the carrying value and fair value of a reporting unit with associated goodwill. Carrying value is based on the assets and liabilities associated with the operations of that reporting unit. The Company estimates the fair value of the reporting units using the income approach and the market approach. If the Company believes that the fair value of a reporting unit exceeds its carrying value by a substantial margin, the Company may perform a qualitative analysis instead.
51
If the fair value of a reporting unit exceeds its carrying amount, goodwill of the reporting unit is considered not to be impaired and the second step of the impairment test is unnecessary. If the carrying amount of the reporting unit exceeds its fair value, the second step of the goodwill impairment test is performed to measure the amount of the impairment loss, if any. The second step of the goodwill impairment test compares the implied fair value of the reporting unit’s goodwill with the carrying amount of that goodwill. If the carrying amount of the reporting unit’s goodwill exceeds the implied fair value of that goodwill, an impairment loss is recognized in an amount equal to that excess. The implied fair value of goodwill is determined in the same manner as the amount of goodwill recognized in a business combination. That is, the fair value of the reporting unit is allocated to all of the assets and liabilities of that unit (including any unrecognized intangible assets) as if the reporting unit had been acquired in a business combination, and the fair value of the reporting unit was the purchase price paid to acquire the segment.
The impairment test for an indefinite-lived intangible asset other than goodwill consists of first assessing qualitative factors, such as company, industry and economic trends. If determined to be necessary, the next step compares the fair value of the intangible asset to its carrying amount. If the carrying amount exceeds the fair value, an impairment loss is recognized for the difference.
Additional information regarding the Company’s goodwill and other intangible assets is contained in Note 7.
Long-term Investments
The Company had long-term investments of $3,509 and $3,734 at September 30, 2015 and 2014, respectively that are held in a Rabbi trust for benefits under the Company’s deferred compensation plan. Under the plan, participants designate investment options to serve as the basis for measurement of the notional value of their accounts. The investments, classified as trading securities, include a money market fund and mutual funds that are publicly traded. Trading securities are carried at fair value with unrealized gains and losses included in earnings. The fair values of the shares or underlying securities of these funds are based on quoted market prices.
The Company had long-term investments of $1,763 and $2,382 at September 30, 2015 and 2014, respectively, consisting of fixed income mutual funds classified as available-for-sale securities. Available-for-sale securities are carried at fair value with unrealized gains and losses, net of tax, reported in other comprehensive income. The cost of securities sold is based on the specific identification method. The investments are valued based on the net asset value of the underlying securities as provided by the investment account manager. The investments are not restricted or subject to a lockup and may be redeemed on demand. Notice within a certain period of time prior to redemption is not required.
Long-term investments are included in other long-term assets.
Revenue Recognition and Deferred Contract Revenue
The majority of the Radiation Measurement revenues are realized from radiation measurement services and other services incidental to radiation dose measurement. The measuring and monitoring services provided by the Company to its customers are of a subscription nature and are continuous. The Company views its business in the Radiation Measurement segment as services provided to customers over a period of time and the wear period is the period over which those services are provided. Badge production, wearing of badges, badge analysis, and report preparation are integral to the benefit that the Company provides to its customers. These services are provided to customers on an agreed-upon recurring basis (monthly, bi-monthly, quarterly, semi-annually or annually) that the customer chooses for the wear period. Revenue is recognized on a straight-line basis, adjusted for changes in pricing and volume, over the wear period. Revenues are recognized over the periods in which the customers wear the badges irrespective of whether invoiced in advance or in arrears.
Many customers pay for these services in advance. The amounts recorded as deferred contract revenue in the consolidated balance sheets represent customer deposits invoiced in advance during the preceding twelve months for services to be rendered over the succeeding twelve months, and are net of services rendered through the respective consolidated balance sheet date. Management believes that the amount of deferred contract revenue fairly represents the remaining business activity with customers invoiced in advance.
52
Other services incidental to measuring and monitoring augment the basic radiation measurement services that the Company offers, providing administrative and informational tools to customers for the management of their radiation detection programs. Other service revenues are recognized upon delivery of the reports to customers or as other such services are provided.
The Company sells radiation measurement products to its customers, principally InLight products, for their use in conducting radiation measurements or managing radiation detection programs. The Company recognizes Radiation Measurement segment product revenues upon shipment or delivery of goods when title and risk of loss pass to customers.
The Company, through its Medical Physics segment, offers full scope medical physics services to hospitals and radiation therapy centers. Services offered include, but are not limited to, clinical physics support in radiation oncology, commissioning services, special projects support and imaging physics services. Delivery of the medical physics services can be of a contracted, recurring nature or as a discrete project with a defined service outcome. Recurring services often are provided on the customer’s premises by a full-time employee or fraction of a full-time employee. Revenue is recognized for recurring services on a straight-line basis over the life of the contract unless there is another discernable pattern as the services are rendered. Revenue is recognized for fee for service projects when the service is delivered.
Contracted services are billed on an agreed-upon recurring basis, either in advance or arrears of the service being delivered. Customers may be billed monthly, quarterly, or at some other regular interval over the contracted period. The amounts recorded as deferred contract revenue represent amounts invoiced in advance of delivery of the service. Management believes that the amount of deferred contract revenue fairly represents remaining business activity with customers invoiced in advance.
Fee for service revenue is typically associated with much shorter contract periods, or with discrete individual projects, and revenue is recognized upon completion of the project and customer acceptance thereof.
Additional medical physics services under the full scope offering of the medical physics practice groups comprising the Medical Physics segment include radiation center design and consulting, accreditation work and quality assurance reviews.
The Company, through its Medical Products segment, offers high quality medical consumable accessories used in radiology, radiation therapy, and image guided surgery procedures. The Medical Products segment recognizes revenues upon shipment or delivery of goods when title and risk of loss pass to customers.
The amounts recorded as deferred contract revenue in the consolidated balance sheets represent invoiced amounts in advance of delivery of the service, and are net of services rendered through the respective consolidated balance sheet date. Deferred contract revenue was $13,904 and $14,750, respectively, as of September 30, 2015 and 2014.
Concentrations of credit risk with respect to accounts receivable are limited due to the high credit quality of the Company’s major customers, as well as the large number and geographic dispersion of smaller customers. The large diversified customer base results in no single customer representing greater than 5% of revenue. The Company routinely reviews outstanding customer balances and records allowances for bad debts as necessary.
Research and Development
The cost of research and development programs is charged to selling, general and administrative expense as incurred and amounted to $4,579, $5,813 and $4,121 in fiscal 2015, 2014 and 2013, respectively. Research and development costs include salaries and allocated employee benefits, third-party research contracts and supplies.
53
Advertising
The Company expenses the costs of advertising as incurred. Advertising expense, primarily related to product shows and exhibits, amounted to $1,023, $1,191 and $1,339 in fiscal 2015, 2014 and 2013, respectively.
Income Taxes
The Company files income tax returns in the jurisdictions in which it has sufficient presence. The Company estimates the income tax provision for income taxes that are currently payable, and records deferred income tax assets and liabilities for the temporary differences in tax consequences between the financial statements and tax returns. The Company records a valuation allowance in situations where the realization of deferred income tax assets is not more likely than not. The Company recognizes the financial statement effects of its tax positions in its current and deferred income tax assets and liabilities when it is more likely than not that the position will be sustained upon examination by a taxing authority. Additional information regarding the Company’s income taxes is contained in Note 9.
Stock-Based Compensation
The Company measures and recognizes compensation cost at fair value for all share-based payments, including stock options.
The Company has not granted stock options subsequent to fiscal 2005. Awards of stock options in prior fiscal years were granted with an exercise price equal to the market value of the stock on the date of grant. The fair value of stock options was estimated using the Black-Scholes option-pricing model. Expected volatility and the expected life of stock options were based on historical experience. The risk free interest rate was derived from the implied yield available on U.S. Treasury zero-coupon issues with a remaining term, as of the date of grant, equal to the expected term of the option. The dividend yield was based on annual dividends and the fair market value of the Company’s stock on the date of grant. Compensation expense was recognized ratably over the vesting period of the stock option.
Subsequent to fiscal 2005, key employees and/or non-employee directors have been granted restricted share awards that consist of performance shares and time vested restricted stock. Performance shares represent a right to receive shares of common stock upon satisfaction of performance goals or other specified metrics. Restricted stock represents a right to receive shares of common stock upon the passage of a specified period of time. Upon the adoption of the Company’s Incentive Compensation Plan in February 2008, the fair value of performance shares and restricted stock granted under the new plan is based on the Company’s closing stock price on the date of grant. Compensation expense for performance shares is recorded ratably over the vesting period, assuming that achievement of performance goals is deemed probable. Compensation expense for restricted stock is cliff vested and recognized ratably over the vesting period. The Company also retains the discretion to make additional awards to executives at other times for recruiting or retention purposes. Stock-based compensation for these awards can be either cliff or graded vested depending on the agreement, and recognized ratably over the vesting period.
Forfeitures of awards are estimated at the time of grant and stock-based compensation cost is recognized only for those awards expected to vest. The Company uses historical experience to estimate projected forfeitures. The Company recognizes the cumulative effect on current and prior periods of a change in the forfeiture rate, or actual forfeitures, as compensation cost or as a reduction of cost in the period of the revision.
Foreign Currency Translation
Financial statements of foreign subsidiaries are translated into U.S. dollars using period-end exchange rates for assets and liabilities and weighted-average exchange rates for revenues and expenses. Adjustments resulting from translating net assets are reported as a separate component of accumulated other comprehensive loss within common shareholders’ equity as currency translation adjustment.
54
Recent Accounting Pronouncements
Adoption of Accounting Standards Updates
In April 2014, the Financial Accounting Standards Board (“FASB”) issued revised guidance to reduce the diversity in presentation of an unrecognized tax benefit when a net operating loss carryforward, a similar tax loss or a tax credit carryforward exists. This requires an unrecognized tax benefit to be presented in the financial statements as a reduction to a deferred income tax asset for a net operating loss carryforward, a similar tax loss, or a tax credit carryforward, with certain exceptions listed in the guidance. This guidance was adopted by the Company in the first quarter of fiscal 2015. The adoption of this guidance did not have a material impact on the Company’s results of operations, financial position and liquidity.
In November 2014, the FASB issued new guidance on accounting for pushdown accounting in the event of a business combination. This update provides an acquired entity with an option to apply pushdown accounting in its separate financial statements upon occurrence of an event in which an acquirer obtains control of the acquired entity. This guidance was adopted by the Company in the first quarter of fiscal 2015. The adoption of this guidance did not have a material impact on the Company’s results of operations, financial position and liquidity.
In April 2014, the FASB issued new guidance related to the definition of a discontinued operation and requires new disclosure of both discontinued operations and certain other disposals that do not meet the definition of a discontinued operation. This new guidance is effective for annual periods beginning on or after December 15, 2014 and interim periods within those years. The Company early adopted this guidance beginning in the fourth quarter of fiscal 2015. The adoption of this guidance did not have a material impact on the Company’s results of operations, financial position and liquidity.
Accounting Standards Not Yet Adopted
In May 2014, the FASB issued new guidance for recognizing revenue from contracts with customers, which provides a single comprehensive model for entities to use in accounting for revenue arising from contracts with customers and will supersede most current revenue recognition guidance. In July 2015, the FASB deferred the effective date of the new revenue standard by one year. Public companies would now be required to adopt the new guidance for fiscal years, and interim periods within those fiscal years, beginning after December 15, 2017. The FASB decided to allow earlier adoption of the new revenue standard, but not earlier than the original effective date. This guidance is effective for the Company in the first quarter of fiscal 2019. The Company is currently evaluating the impact this guidance will have on its results of operations, financial position and liquidity.
In June 2014, the FASB issued new guidance on accounting for share-based payments requiring a specific performance target to be achieved in order for employees to become eligible to vest in the awards when that performance target may be achieved after the requisite service period for the award. This update further clarifies that compensation cost should be recognized in the period in which it becomes probable that the performance target will be achieved and should represent the compensation cost attributable to the period for which the requisite service has already been rendered. This guidance is effective for the Company in the first quarter of fiscal 2017. Early adoption is permitted. The Company is currently evaluating the impact this guidance will have on its results of operations, financial position and liquidity.
In August 2014, the FASB issued new guidance on determining when and how to disclose going-concern uncertainties in the financial statements. The new standard requires management to perform interim and annual assessments of an entity’s ability to continue as a going concern within one year of doubt about the entity’s ability to continue as a going concern. An entity must provide certain disclosures if conditions or events raise substantial doubt about the entity’s ability to continue as a going concern. This guidance will be effective for the Company in the first quarter of fiscal 2017, with early adoption permitted. The Company does not expect the adoption of this guidance will have a material impact on its results of operations, financial position and liquidity.
55
In January 2015, the FASB issued new guidance on accounting for unusual and infrequently occurring items, which eliminates the concept of extraordinary items. An unusual and infrequently occurring item will no longer be classified as an extraordinary item and segregated from ordinary operations in the income statement, but will be shown as a component of income from continuing operations or separately disclosed in notes to the financial statements. This guidance is effective for the Company in the first quarter of fiscal 2017, with early adoption permitted. The Company does not expect the adoption of this guidance will have a material impact on its results of operations, financial position and liquidity.
In February 2015, the FASB issued amended guidance on the model used to evaluate whether certain legal entities should be consolidated. This guidance is effective for the Company in the first quarter of fiscal 2017. Early adoption is permitted. The Company is currently evaluating the impact this guidance will have on its results of operations, financial position and liquidity.
In April 2015, the FASB issued new guidance on the presentation of debt issuance costs. This update requires a company to present debt issuance costs related to a recognized debt liability in the balance sheet as a direct deduction from the carrying amount of the related debt liability, consistent with the presentation of debt discounts. Currently, debt issuance costs are presented as a deferred asset. The recognition and measurement requirements will not change as a result of this guidance. The update requires retrospective application and represents a change in accounting principle. This guidance is effective for the Company in the first quarter of fiscal 2017, with early adoption permitted. The Company does not expect the adoption of this guidance will have a material impact on its results of operations, financial position and liquidity.
In July 2015, the FASB issued new guidance on simplifying the measurement of inventory. This update requires a company to measure inventory at the lower of cost and net realizable value. Net realizable value is the estimated selling prices in the ordinary course of business, less reasonably predictable costs of completion, disposal, and transportation. This guidance is effective for the Company in the first quarter of fiscal 2018, and should be applied prospectively with early adoption permitted. The Company is currently evaluating the impact this guidance will have on its results of operations, financial position and liquidity.
In September 2015, the FASB issued new guidance on business combination provisional adjustments during the measurement period. The new standard requires that an acquirer recognize adjustments to provisional amounts that are identified during the measurement period in the reporting period in which the adjustment amounts are determined and sets forth new disclosure requirements related to the adjustments. This guidance is effective for the Company in the first quarter of fiscal 2017, with early adoption permitted. The Company is currently evaluating the impact this guidance will have on its results of operations, financial position and liquidity.
In November 2015, the FASB issued new guidance on the presentation of deferred income taxes. This update requires a company to present deferred tax liabilities and assets as noncurrent in a classified statement of financial position rather than the current requirement to separate deferred income tax liabilities and assets into current and noncurrent amounts. This guidance is effective for the Company in the first quarter of fiscal 2018, with early adoption permitted. The Company does not expect the adoption of this guidance will have a material impact on its results of operations, financial position and liquidity.
56
The Company estimates the fair value of assets and liabilities in accordance with the framework established by the authoritative guidance for fair value measurements. The framework is based on the inputs used in valuation, gives the highest priority to quoted prices in active markets and requires that observable inputs be used in the valuations when available. The disclosure of fair value estimates in the fair value accounting guidance hierarchy is based on whether the significant inputs into the valuation are observable. In determining the level of the hierarchy in which the estimate is disclosed, the highest priority is given to unadjusted quoted prices in active markets and the lowest priority to unobservable inputs that reflect the Company’s significant market assumptions. The level in the fair value hierarchy within which the fair value measurement is reported is based on the lowest level input that is significant to the measurement in its entirety.
The three levels of the hierarchy are as follows:
|
· |
Level 1 – Unadjusted quoted prices in active markets for identical assets or liabilities that the Company has the ability to access as of the reporting date. |
|
· |
Level 2 – Inputs other than quoted prices included within Level 1 that are directly observable for the asset or liability or indirectly observable through corroboration with observable market data. |
|
· |
Level 3 – Unobservable inputs for the asset or liability used to measure fair value that reflect the Company’s own assumptions about the assumptions market participants would use in pricing the asset or liability. |
Financial assets measured at fair value on a recurring basis are summarized below:
|
Fair Value Measurements at September 30, 2015 |
|||||||||
|
(Dollars in Thousands) |
Level 1 |
Level 2 |
Level 3 |
||||||
|
Asset Category |
|||||||||
|
Cash equivalents |
$ |
272 |
$ |
- |
$ |
- |
|||
|
Mutual funds |
3,237 |
- |
- |
||||||
|
Available-for-sale securities |
- |
1,763 |
- |
||||||
|
Total Financial Assets at Fair Value |
$ |
3,509 |
$ |
1,763 |
$ |
- |
|||
|
Fair Value Measurements at September 30, 2014 |
|||||||||
|
(Dollars in Thousands) |
Level 1 |
Level 2 |
Level 3 |
||||||
|
Asset Category |
|||||||||
|
Cash equivalents |
$ |
105 |
$ |
- |
$ |
- |
|||
|
Mutual funds |
3,629 |
- |
- |
||||||
|
Available-for-sale securities |
- |
2,382 |
- |
||||||
|
Total Financial Assets at Fair Value |
$ |
3,734 |
$ |
2,382 |
$ |
- |
|||
Following is a description of each category in the fair value hierarchy and the financial assets and liabilities of the Company that were included in each category at September 30, 2015 and 2014, measured on a recurring basis.
The Level 1 financial assets were comprised of investments in trading securities, which are reported in other long-term assets. The investments are held in a Rabbi trust for benefits under the Company’s deferred compensation plan. Under the plan, participants designate investment options to serve as the basis for measurement of the notional value of their accounts. The investments include a money market fund and mutual funds that are publicly traded. The fair values of the shares or underlying securities of these funds are based on quoted market prices.
57
The Level 2 financial assets are long-term investments consisting primarily of fixed income mutual funds classified as available-for-sale securities. These investments are reported in other long-term assets. The investments in fixed income mutual funds are valued based on the net asset value of the underlying securities as provided by the investment account manager. The investments are not restricted or subject to a lockup and may be redeemed on demand. Notice within a certain period of time prior to redemption is not required.
The Company’s long term debt is classified as Level 2. The carrying amount of the Company’s long-term debt approximated fair value as the stated interest rates were variable in relation to prevailing market rates.
The Company recorded a liability for contingent consideration during the second quarter of fiscal 2014 related to the acquisition of ilumark and the launch of its new medical products. The liability was recorded at fair value, which was determined using a discounted cash flow model based on assumptions and projections relevant to revenues. A discount rate of 11% was used and payments are projected to occur in fiscal 2016 and 2017. The contingent consideration liability is classified as Level 3.
The Company had no material assets or liabilities that were measured at fair value on a non-recurring basis during the fiscal year ended September 30, 2015. As discussed in Note 7, the Company completed an impairment test for Medical Products goodwill and long-lived assets as of June 30, 2014 when it became apparent that anticipated revenue and profitability trends in our IZI Medical Products reporting unit were not being achieved to the extent forecasted. There were no transfers between fair value hierarchy levels during these periods.
3.Acquisition, Reorganization and Non-recurring Costs
Acquisition, reorganization and non-recurring costs during fiscal 2015, 2014 and 2013 were $1,041, $3,802 and $1,392, respectively.
Acquisition expenses, consisting primarily of fees for accounting, financial, legal and tax advice to support the due diligence, transaction structure and accounting for acquisitions, as well as costs in the pursuit of acquisitions that may not be consummated, were $0, $232 and $351, for fiscal 2015, 2014 and 2013, respectively. Acquisition costs were expensed as incurred.
Reorganization costs for severance to support changes in selected management roles throughout the organization were $1,041, $3,486 and $647, for fiscal 2015, 2014 and 2013, respectively. In fiscal 2015 and 2014 the Company made severance payments of $2,677 and $398, respectively. Remaining payments of $972 and $246 are expected to be paid in fiscal 2016 and 2017, respectively.
The Company divested its radon business on September 30, 2015, and received cash proceeds of approximately $7.0 million, net of cash assumed by the acquirer and net of cash paid for transaction expenses. Approximately $0.7 million of transaction expenses were paid subsequent to the closing of the divestiture and were recorded in other accrued expenses on the Consolidated Balance Sheet as of September 30, 2015. The Company recognized a $1.0 million pre-tax gain on sale from the disposition of this business. In conjunction with this transaction, the Company released $1.4 million of foreign currency translation losses previously recorded in accumulated other comprehensive loss, resulting in a $0.4 million net loss on the disposition of business. The Company has evaluated whether this divestiture qualifies as a discontinued operation pursuant to FASB Accounting Standards Codification 205-20 “Discontinued Operations.” The Company has concluded that the transaction should not be reported as a discontinued operation and is not material to the Company’s financial results.
58
5.Income (Loss) per Common Share
Basic net income (loss) per share was computed by dividing net income (loss) available to common stockholders for the period by the weighted average number of shares of common stock outstanding during the period. Diluted net income (loss) per share was computed by dividing net income (loss) available to common stockholders for the period by the weighted average number of shares of common stock that would have been outstanding assuming dilution from stock-based compensation awards during the period.
Unvested stock-based compensation awards that contain non-forfeitable rights to dividends are treated as participating securities and included in the computation of earnings per share pursuant to the two-class method. The Company’s time vested restricted stock is a participating security. The following table sets forth the computation of net income (loss) per share for the years ended September 30:
|
(Dollars in Thousands, Except per Share) |
2015 |
2014 |
2013 |
||||||
|
Basic Net Income (Loss) per Share: |
|||||||||
|
Net income (loss) attributed to Landauer, Inc. |
$ |
14,543 |
$ |
(25,203) |
$ |
2,782 | |||
|
Less: Income allocated to unvested restricted stock |
86 |
- |
165 | ||||||
|
Net income (loss) available to common stockholders |
$ |
14,457 |
$ |
(25,203) |
$ |
2,617 | |||
|
Basic weighted average shares outstanding |
9,511 | 9,524 | 9,434 | ||||||
|
Net income (loss) per share – Basic |
$ |
1.52 |
$ |
(2.65) |
$ |
0.28 | |||
|
Diluted Net Income (Loss) per Share: |
|||||||||
|
Net income (loss) attributed to Landauer, Inc. |
$ |
14,543 |
$ |
(25,203) |
$ |
2,782 | |||
|
Less: Income allocated to unvested restricted stock |
86 |
- |
165 | ||||||
|
Net income (loss) available to common stockholders |
$ |
14,457 |
$ |
(25,203) |
$ |
2,617 | |||
|
Basic weighted average shares outstanding |
9,511 | 9,524 | 9,434 | ||||||
|
Effect of dilutive securities |
29 |
- |
48 | ||||||
|
Diluted weighted average shares outstanding |
9,540 | 9,524 | 9,482 | ||||||
|
Net income (loss) per share – Diluted |
$ |
1.52 |
$ |
(2.65) |
$ |
0.27 | |||
In periods where losses are recorded, inclusion of potentially dilutive securities in the calculation would decrease the loss per common share and, therefore, these securities are not added to the weighted average number of shares outstanding. The computations of diluted net loss per common share for fiscal 2014 did not include the following outstanding shares of restricted stock as well as the effects of options to acquire common stock as the inclusion of these securities would have been antidilutive:
|
2015 |
2014 |
2013 |
|||||||
|
Effect of dilutive securities |
- |
51 |
- |
||||||
59
Equity in Joint Ventures consists of amounts invested in joint ventures in which the Company holds a noncontrolling interest. These investments are accounted for using the equity method of accounting.
At September 30, 2015, the Company had a 50% equity interest in Nagase-Landauer, Ltd. (“Nagase”), a radiation measurement company in Japan; a 50% equity interest in Epsilon-Landauer Dozimetri, a radiation measurement company in Turkey; and a 49% equity interest in Yamasato, Fujiwara, Higa & Associates, Inc., a domestic small business supplier to the International Atomic Energy Agency and the U.S. military.
The combined summary financial information as of and for the years ended September 30, 2015, 2014 and 2013 is presented for all equity method investments owned during the respective periods.
|
(Dollars in Thousands) |
2015 |
2014 |
2013 |
||||||
|
Revenues |
$ |
46,591 |
$ |
48,897 |
$ |
60,523 | |||
|
Gross profit |
17,141 | 18,244 | 24,289 | ||||||
|
Net income |
4,782 | 4,740 | 7,810 | ||||||
|
(Dollars in Thousands) |
2015 |
2014 |
||||
|
Current assets |
$ |
23,053 |
$ |
20,864 | ||
|
Other assets |
41,885 | 43,831 | ||||
|
Current liabilities |
15,077 | 14,231 | ||||
|
Other liabilities |
5,009 | 2,576 | ||||
7.Goodwill and Other Intangible Assets
Changes in the carrying amount of goodwill, by reportable segment, for the years ended September 30, 2015 and 2014 were as follows:
|
(Dollars in Thousands) |
Radiation |
Medical |
Medical |
Total |
||||||||
|
Balance as of September 30, 2013 |
$ |
20,456 |
$ |
22,611 |
$ |
41,369 |
$ |
84,436 | ||||
|
Increase related to acquisitions |
- |
- |
1,775 | 1,775 | ||||||||
|
Effects of foreign currency |
(1,495) |
- |
(130) | (1,625) | ||||||||
|
Accumulated goodwill impairment charges |
- |
- |
(41,368) | (41,368) | ||||||||
|
Balance as of September 30, 2014 |
$ |
18,961 |
$ |
22,611 |
$ |
1,646 |
$ |
43,218 | ||||
|
Decrease related to dispositions |
(5,579) |
- |
- |
(5,579) | ||||||||
|
Effects of foreign currency |
(2,380) |
- |
(187) | (2,567) | ||||||||
|
Goodwill net, as of September 30, 2015 |
$ |
11,002 |
$ |
22,611 |
$ |
1,459 |
$ |
35,072 | ||||
60
Goodwill and certain intangible assets with indefinite lives are reviewed annually for impairment and more frequently if an event occurs or circumstances change that would require the Company to perform an interim review. The Company has three segments: Radiation Measurement; Medical Physics; and Medical Products.
The Company completed a quantitative assessment for the Radiation Measurement, Medical Physics and Medical Products reporting segments as of September 30, 2015 using the income approach and the market approach, and the estimated fair value of these reporting segments significantly exceeded their carrying values. The discount rates used in this valuation ranged from 11% to 13%. The accumulated impairment charge as of the beginning of the year and end of the year September 30, 2015 is $64.1 million as explained below.
The Company completed an impairment test for the Medical Products segment as of June 30, 2014 when it became apparent that anticipated revenue and profitability trends in Medical Products were not being achieved to the extent forecasted. Based on the testing performed, the Company recorded a non-cash impairment charge of $62.2 million, of which $41.4 million related to goodwill and $20.8 million related to intangible assets for the fiscal year ended September 30, 2014. The tax benefit associated with the goodwill impairment charge was $15.3 million, and the tax benefit associated with the intangible assets charge was $7.7 million.
During the third quarter of fiscal 2013, the Company performed an impairment analysis with respect to the carrying value of the goodwill in the Medical Products reporting unit. Based on the testing performed, the Company recorded a non-cash goodwill impairment charge of $22.7 million. The tax benefit associated with this charge was $8.5 million.
Intangible assets for the years ended September 30 were as follows:
|
2015 |
||||||||||||
|
(Dollars in Thousands) |
Gross Carrying |
Accumulated |
Net Carrying Amount |
Accumulated Intangibles Impairment Charge |
||||||||
|
Customer lists |
$ |
43,131 |
$ |
33,716 |
$ |
9,415 |
$ |
18,657 | ||||
|
Trademarks and tradenames |
2,181 | 2,051 | 130 | 1,498 | ||||||||
|
Licenses and patents |
5,825 | 2,338 | 3,487 | 665 | ||||||||
|
Other intangibles |
577 | 557 | 20 |
- |
||||||||
|
Intangible assets |
$ |
51,714 |
$ |
38,662 |
$ |
13,052 |
$ |
20,820 | ||||
|
2014 |
||||||||||||
|
(Dollars in Thousands) |
Gross Carrying |
Accumulated |
Net Carrying Amount |
Accumulated Intangibles Impairment Charge |
||||||||
|
Customer lists |
$ |
44,138 |
$ |
32,934 | 11,204 |
$ |
18,657 | |||||
|
Trademarks and tradenames |
2,176 | 2,051 | 125 | 1,498 | ||||||||
|
Licenses and patents |
4,765 | 2,037 | 2,728 | 665 | ||||||||
|
Other intangibles |
577 | 557 | 20 |
- |
||||||||
|
Intangible assets |
$ |
51,656 |
$ |
37,579 |
$ |
14,077 |
$ |
20,820 | ||||
The Company assumed customer lists relating to business combinations of $0 and $711 during fiscal 2015 and 2014, respectively. No tradenames were assumed during fiscal 2015 and 2014 relating to business combinations. Amortization of intangible assets was $2,243, $3,978 and $4,095 for the years ended September 30, 2015, 2014 and 2013, respectively. Annual aggregate amortization expense related to intangible assets is estimated to be approximately $1,834 in fiscal 2016 and 2017, $1,709 in fiscal 2018, $1,048 in fiscal 2019 and $905 in fiscal 2020.
61
8.Accumulated Other Comprehensive Loss
The components of accumulated other comprehensive loss included in the accompanying consolidated balance sheets consist of defined benefit pension and postretirement plan adjustments for net gains, losses and prior service costs, unrealized gains and losses on available-for-sale securities and cumulative foreign currency translation adjustments. Accumulated elements of other comprehensive loss, net of tax, are included in the stockholders’ equity section of the consolidated balance sheets. Changes in each component are as follows:
|
Cumulative Foreign Currency Translation Adjustments |
Unrealized Gains and Losses on Available-for-Sale Securities |
Pension and Postretirement Plan Adjustments |
Comprehensive (Loss) |
|||||||||
|
Balance at September 30, 2012 |
$ |
1,695 |
$ |
102 |
$ |
(7,172) |
$ |
(5,375) | ||||
|
Other comprehensive income before reclassifications |
(2,078) | 101 | 2,436 | 459 | ||||||||
|
Amounts reclassified from accumulated other comprehensive income |
- |
(71) | 579 | 508 | ||||||||
|
Net period other comprehensive income |
(2,078) | 30 | 3,015 | 967 | ||||||||
|
Balance at September 30, 2013 |
$ |
(383) |
$ |
132 |
$ |
(4,157) |
$ |
(4,408) | ||||
|
Other comprehensive income before reclassifications |
(2,110) | 161 | (3,988) | (5,937) | ||||||||
|
Amounts reclassified from accumulated other comprehensive income |
- |
(127) | 324 | 197 | ||||||||
|
Net period other comprehensive income |
(2,110) | 34 | (3,664) | (5,740) | ||||||||
|
Balance at September 30, 2014 |
$ |
(2,493) |
$ |
166 |
$ |
(7,821) |
$ |
(10,148) | ||||
|
Other comprehensive income before reclassifications |
(4,417) | 177 | (1,354) | (5,594) | ||||||||
|
Amounts reclassified from accumulated other comprehensive income |
1,442 | (84) | 643 | 2,001 | ||||||||
|
Net current period other comprehensive income |
(2,975) | 93 | (711) | (3,593) | ||||||||
|
Balance at September 30, 2015 |
$ |
(5,468) |
$ |
259 |
$ |
(8,532) |
$ |
(13,741) | ||||
The tables below presents impacts on net income of significant amounts reclassified out of each component of accumulated other comprehensive income:
|
Pension and Postretirement Plan Adjustments (1) |
2015 |
2014 |
2013 |
||||||
|
Service cost |
$ |
51 |
$ |
62 |
$ |
63 | |||
|
Interest cost |
1,586 | 1,550 | 1,402 | ||||||
|
Expected return on plan assets |
(1,584) | (1,508) | (1,460) | ||||||
|
Amortization of net loss |
416 | 183 | 432 | ||||||
|
Total before tax |
469 | 287 | 437 | ||||||
|
(Benefit) provision for income taxes |
(174) | (37) | (142) | ||||||
|
Total net of tax |
$ |
643 |
$ |
324 |
$ |
579 | |||
|
(1) |
These accumulated other comprehensive (loss) income components are included in the computation of net periodic benefit costs (refer to Note 12 for additional details regarding employee benefit plans). |
62
|
Unrealized Gains and Losses on Available-for-Sale Securities |
2015 |
2014 |
2013 |
||||||
|
Realized losses on available-for-sale investments into earnings (1) |
$ |
(99) |
$ |
(150) |
$ |
(84) | |||
|
Total before tax |
(99) | (150) | (84) | ||||||
|
Provision for income taxes (2) |
(15) | (23) | (13) | ||||||
|
Total net of tax |
$ |
(84) |
$ |
(127) |
$ |
(71) | |||
|
(1) |
This amount is reported in Interest Expense, net on the Consolidated Statements of Operations. |
|
(2) |
This amount is reported in Income Tax (Benefit) Expense on the Consolidated Statements of Operations. |
The components of pretax income for the years ended September 30 were as follows:
|
(Dollars in Thousands) |
2015 |
2014 |
2013 |
||||||
|
Pretax income: |
|||||||||
|
U.S. |
$ |
14,940 |
$ |
(46,061) |
$ |
(4,481) | |||
|
Foreign |
6,382 | 5,563 | 7,557 | ||||||
|
Total pretax income |
$ |
21,322 |
$ |
(40,498) |
$ |
3,076 | |||
The components of the provision for income taxes for the years ended September 30 were as follows:
|
(Dollars in Thousands) |
2015 |
2014 |
2013 |
||||||
|
Current: |
|||||||||
|
U.S. Federal |
$ |
2,407 |
$ |
5,581 |
$ |
4,458 | |||
|
State and local |
405 | 591 | 465 | ||||||
|
Foreign |
2,708 | 1,858 | 1,970 | ||||||
|
Current tax provision |
$ |
5,520 |
$ |
8,030 |
$ |
6,893 | |||
|
Deferred: |
|||||||||
|
U.S. Federal |
$ |
990 |
$ |
(22,261) |
$ |
(6,848) | |||
|
State and local |
68 | (1,320) | (372) | ||||||
|
Foreign |
(305) | (249) | (233) | ||||||
|
Deferred tax provision |
$ |
753 |
$ |
(23,830) |
$ |
(7,453) | |||
|
Income tax provision |
$ |
6,273 |
$ |
(15,800) |
$ |
(560) | |||
63
The effective tax rates for the fiscal years ended September 30, 2015, 2014 and 2013 were 29.4%, 39.0% and (18.1%), respectively. The decrease in the fiscal 2015 effective tax rate was primarily due to the retroactive enactment of the research and development credit for calendar year 2014 in the first fiscal quarter of 2015, the mix of earnings between jurisdictions with differing tax rates and the realization of an unrecognized tax benefit. The following is a reconciliation of the U.S. federal statutory rate of 35.0% to the effective income tax rate:
|
2015 |
2014 |
2013 |
|||||||
|
U.S. Federal statutory rate |
35.0% | 35.0% | 35.0% | ||||||
|
State and local taxes net of Federal tax benefit |
1.3% | 2.4% |
-4.9% |
||||||
|
Effect of foreign affiliates |
-4.4% |
1.1% |
-20.7% |
||||||
|
Earnings of unconsolidated affiliates |
-3.2% |
1.9% |
-26.4% |
||||||
|
R&D credit |
-0.4% |
0.0% |
-9.5% |
||||||
|
Domestic production activity deduction |
-0.8% |
0.7% |
-8.3% |
||||||
|
Partnership income |
1.9% |
-1.3% |
14.9% | ||||||
|
Provision to return adjustments |
-0.9% |
-0.4% |
-16.4% |
||||||
|
Meals and entertainment |
0.5% |
-0.3% |
2.7% | ||||||
|
Change in deferred rate |
0.0% | 0.1% | 2.7% | ||||||
|
Uncertain tax positions |
-1.6% |
-0.3% |
13.6% | ||||||
|
Other |
2.0% | 0.1% |
-0.8% |
||||||
|
Effective income tax rate |
29.4% | 39.0% |
-18.1% |
||||||
The tax effects of temporary differences that gave rise to deferred income tax assets and liabilities consisted of the following at September 30:
|
(Dollars in Thousands) |
2015 |
2014 |
||||
|
Deferred tax assets: |
||||||
|
Pension accrual |
$ |
3,544 |
$ |
3,073 | ||
|
Compensation expense |
3,510 | 3,530 | ||||
|
Transaction costs |
954 | 1,040 | ||||
|
Medical insurance claims |
374 | 480 | ||||
|
Retirement plans |
2,310 | 2,248 | ||||
|
Accruals not currently deductible |
347 | 250 | ||||
|
NOLs and attributes |
289 | 272 | ||||
|
Intangible asset amortization |
19,782 | 21,888 | ||||
|
Cumulative translation adjustment |
2,820 | 1,218 | ||||
|
Other |
1,921 | 739 | ||||
| 35,851 | 34,738 | |||||
|
Deferred tax liabilities: |
||||||
|
Depreciation |
1,085 | 1,411 | ||||
|
Software development |
12,400 | 12,957 | ||||
|
Other |
1,063 | 136 | ||||
| 14,548 | 14,504 | |||||
|
Net deferred tax asset |
$ |
21,303 |
$ |
20,234 | ||
The Company believes that the realization of deferred tax assets is more likely than not based upon the expectation the Company will generate the necessary taxable income in the future periods. Therefore, no valuation allowances have been provided.
64
The Company has provided for U.S. deferred income taxes and foreign withholding tax in the amount of $347 on undistributed earnings not considered permanently reinvested in its non-U.S. subsidiaries. The Company has no indefinite reinvested foreign earnings and profits. As of September 30, 2015, 2014 and 2013, permanently reinvested cumulative undistributed earnings attributable to certain foreign operations were approximately $0, $0, and $13,085, respectively. The change in the indefinitely reinvested cumulative undistributed earnings from fiscal 2013 to fiscal 2014 is due to the Company no longer asserting indefinite reinvestment of any foreign earnings and profits.
As of September 30, 2015, the Company’s U.S. income tax returns for fiscal 2013 and subsequent years remained subject to examination by the Internal Revenue Service (“IRS”). During fiscal 2015, the Company received a no change audit letter from the IRS officially closing the audit of fiscal 2012. State income tax returns generally have statute of limitations for periods between three and four years from the date of filing. The Company is currently undergoing a state income tax audit. The Company does not expect the audit to have a material impact on its consolidated financial statements. The Company is not currently under audit in any foreign jurisdictions. The Company’s foreign operations have statute of limitations on the examination of tax returns for periods between two and six years.
The Company operates in numerous taxing jurisdictions and is subject to regular examinations by various U.S. federal, state, local and foreign jurisdictions for various tax periods. The Company’s income tax positions are based on research and interpretations of the income tax laws and rulings in each of the jurisdictions in which it does business. Due to the subjectivity of interpretations of the income tax laws and rulings in each jurisdiction, the differences and interplay in tax laws between those jurisdictions, as well as the inherent uncertainty in estimating the final resolution of complex tax audit matters, the Company’s estimates of income tax liabilities may differ from actual payments or assessments.
Accounting for uncertainty in income taxes requires a more-likely-than-not threshold for financial statement recognition and measurement of tax positions taken or expected to be taken in a tax return. The Company records a liability for the difference between the benefit recognized and measured for financial statement purposes and the tax position taken or expected to be taken on its tax return. To the extent that the Company’s assessment of such tax positions changes, the change in estimate is recorded in the period in which the determination is made.
A reconciliation of gross unrecognized tax benefits, exclusive of interest and penalties, is as follows:
|
(Dollars in Thousands) |
2015 |
2014 |
2013 |
||||||
|
Balance at beginning of year |
$ |
2,917 |
$ |
2,775 |
$ |
2,030 | |||
|
Tax positions related to current year: |
|||||||||
|
Gross increases |
112 | 358 | 832 | ||||||
|
Tax positions related to prior periods: |
|||||||||
|
Gross increases |
81 | 65 | 99 | ||||||
|
Decreases related to lapse of statute of limitations |
(1,117) | (281) | (186) | ||||||
|
Balance at end of year |
$ |
1,993 |
$ |
2,917 |
$ |
2,775 | |||
The total amount of unrecognized tax benefits, net of federal benefit that, if recognized, would affect the effective tax rate was $1,274, $1,840 and $1,362, as of September 30, 2015, 2014 and 2013, respectively.
The Company recognizes accrued interest and penalties related to unrecognized tax benefits in the provision for income taxes. As of September 30, 2015 and 2014, the gross amount of interest and penalties recorded was $316 and $375, respectively. The Company’s unrecognized tax benefits are primarily due to intercompany allocations between jurisdictions. The amount of unrecognized tax benefits and the related interest and penalties expected to reverse within the next fiscal year is estimated to be approximately $636.
65
On August 2, 2013, the Company entered into an Amended and Restated Credit Agreement (the “Credit Agreement”) with its group of lenders that provided, among other things, the extension of the expiration date from November 14, 2016 to August 2, 2018 and the increase of the accordion feature from $25,000 to $50,000.
In addition, the covenants for minimum net worth were deleted from the Credit Agreement. The leverage ratio covenants changed to a maximum 3.50 to 1.00 for the period of September 30, 2013 through June 30, 2015, and to a maximum 3.25 to 1.00 for the periods September 30, 2015 and thereafter. The fixed charge ratio covenants changed to a minimum 1.10 to 1.00 for the period of September 30, 2013 through June 30, 2015, and to a minimum 1.15 to 1.00 for the periods September 30, 2015 and thereafter. The amended terms also provide for an interest rate equal to LIBOR plus a margin of between 1.25% and 2.50% and for the base rate a margin of between 0.25% and 1.50%.
On June 30, 2014, the Company and its subsidiaries GPS and IZI (collectively, the “Borrowers”), entered into a First Amendment to Amended and Restated Credit Agreement (the “Amendment”) with BMO Harris Bank N.A., as administrative agent (the “Administrative Agent”), and the lenders that are party thereto (collectively, the “Lenders”). The Amendment amended, among other things, (i) the definition of Capital Expenditures and EBITDA and (ii) kept the fixed charge coverage ratio covenant and the leverage ratio covenant constant (1.10 to 1.00 and 3.50 to 1.00, respectively) through the remainder of the term of the Credit Agreement. In connection with the Amendment, the Company paid certain amendment fees to the Lenders and certain other fees and expenses to the Administrative Agent.
On December 18, 2014, the Borrowers entered into a Consent and Amendment to the Credit Agreement (the “Consent”) with the Administrative Agent and the Lenders. The Company and the Lenders and the Administrative Agent agreed to consent, on a one time basis only, to a delay in the delivery of audited financial statements and related deliveries for fiscal 2014. The Company was required to provide its annual audited financial statements and related deliveries for fiscal 2014 only within 120 days after the end of fiscal 2014. The Company also was required to provide unaudited financial statements and related deliveries for fiscal 2014 within 90 days after the end of fiscal 2014. The Company paid a non-refundable consent fee to the Lenders in connection with the Consent.
On January 28, 2015, the Borrowers, entered into a second Consent and Amendment to the Credit Agreement (the “Second Consent”) with the Administrative Agent and the Lenders. The Company and the Lenders and the Administrative Agent agreed to consent, on a one time basis only, to a delay in the delivery of audited financial statements and related deliveries for fiscal 2014, whereby the Company was required to provide its annual audited financial statements and related deliveries for fiscal 2014 no later than February 11, 2015. The Company complied with the terms and conditions of the Second Consent.
Borrowings under the credit agreement are classified as long-term debt. The Company repaid $30,500, $43,000 and $27,187 of the borrowings under the credit facility for the fiscal years ended September 30, 2015, 2014 and 2013, respectively. The balance outstanding under the Company’s credit agreement was $133,385 and $133,585 as of September 30, 2015 and 2014, respectively. Interest expense on the borrowings was $3,833, $3,968 and $4,320 for the fiscal years ended September 30, 2015, 2014 and 2013, respectively. The weighted average interest rate for the base and LIBOR rate was 2.7%, 2.6% and 2.9% for fiscal 2015, 2014 and 2013, respectively. The applicable interest rate for the base and LIBOR rate separately was 4.75% and 2.69% per annum at September 30, 2015 and 4.50% and 2.65% per annum at September 30, 2014.
The Company has two classes of capital stock, preferred and common, with a par value of $0.10 per share for each class. Of 20,000,000 common shares which are authorized, there were 9,641,532, and 9,577,874 shares of common stock issued and outstanding as of September 30, 2015 and 2014, respectively. Of 1,000,000 preferred shares which are authorized, there were no shares of preferred stock issued. Cash dividends of $1.375 per common share were declared in fiscal year 2015. As of September 30, 2015, there were accrued and unpaid dividends of $2,684. The Company has reserved 500,000 shares of common stock under the Landauer, Inc. Incentive Compensation Plan approved by shareholders on February 7, 2008.
66
The Company sponsors postretirement benefit plans to provide pension, supplemental retirement funds, and medical expense reimbursement to eligible retired employees, as well as a directors’ retirement plan that provides for certain retirement benefits payable to non-employee directors. Following is a description of these benefit plans.
Defined Contribution Plans
The Company sponsors a 401(k) retirement savings plan covering substantially all Radiation Measurement U.S. full-time employees as well as substantially all of the employees of the Company’s Medical Physics and Medical Products segments. The Company also maintains a supplemental defined contribution plan for certain executives, which allows participating executives to make voluntary deferrals and provides for employer contributions at the Company’s discretion.
The plans are qualified under applicable sections of the Internal Revenue Code and allow employees to contribute a portion of their pre-tax income in accordance with specified guidelines. The Company matches a percentage of the employee contributions up to certain limits. Amounts expensed for Company contributions under these plans during the fiscal years ended September 30, 2015, 2014 and 2013 were $1,784, $1,723 and $1,699, respectively.
Defined Benefit Plans
Historically the Company provided, to substantially all full-time employees in the U.S., a qualified noncontributory defined benefit pension plan to provide a basic replacement income benefit upon retirement. For key executives, the basic benefit was augmented with a supplemental executive retirement plan to address U.S. tax law limitations placed on the benefits under the qualified pension plan. The supplemental plan is not separately funded and costs of the plan are expensed annually. The qualified noncontributory defined benefit pension plan and the supplemental executive retirement plan were frozen in fiscal 2009 and future benefit accruals under such plans ceased. The Company formerly maintained a directors’ retirement plan that provided certain retirement benefits for non-employee directors. The directors’ plan was terminated in January 1997 and benefits accrued under the retirement plan were frozen.
The Company also maintains an unfunded retiree medical expense reimbursement plan. Under the terms of the plan, which covers retirees with ten or more years of service, the Company reimburses retirees to age 70, or to age 65 in accordance with plan changes effective October 1, 2005, for (i) a portion of the cost of coverage under the then-current medical and dental insurance plans if the retiree is under age 65, or (ii) all or a portion of the cost of Medicare and supplemental coverage if the retiree is over age 64. The assumptions for health-care cost ultimate trend rates were 6% for those younger than 65, and 5% for those 65 and older.
The Company recognizes the over- or underfunded status of its defined benefit pension and postretirement plans on its balance sheet and recognizes changes in the funded status, as the changes occur, through comprehensive income. The Company uses its fiscal year end, September 30, as the measurement date for its plans. The following tables set forth the status of the combined defined benefit pension plans and the postretirement medical plan, as pension benefits and other benefits, respectively, at September 30.
67
|
Pension Benefits |
Other Benefits |
|||||||||||
|
(Dollars in Thousands) |
2015 |
2014 |
2015 |
2014 |
||||||||
|
Change in benefit obligation: |
||||||||||||
|
Benefit obligation at beginning of year |
$ |
38,976 |
$ |
32,374 |
$ |
1,299 |
$ |
1,080 | ||||
|
Service cost |
- |
- |
51 | 62 | ||||||||
|
Interest cost |
1,554 | 1,500 | 32 | 50 | ||||||||
|
Actuarial (gain) loss |
(251) | 6,307 | (347) | 150 | ||||||||
|
Benefits paid |
(1,230) | (1,205) | (22) | (43) | ||||||||
|
Benefit obligation at end of year |
39,049 | 38,976 | 1,013 | 1,299 | ||||||||
|
Change in plan assets: |
||||||||||||
|
Fair value of plan assets at beginning of year |
24,785 | 23,621 |
- |
- |
||||||||
|
Actual return on plan assets |
(561) | 1,967 |
- |
- |
||||||||
|
Employer contributions |
405 | 402 | 22 | 43 | ||||||||
|
Benefits paid |
(1,230) | (1,205) | (22) | (43) | ||||||||
|
Fair value of plan assets at end of year |
23,399 | 24,785 |
- |
- |
||||||||
|
Funded status at end of year |
$ |
(15,650) |
$ |
(14,191) |
$ |
(1,013) |
$ |
(1,299) | ||||
|
Pension Benefits |
Other Benefits |
|||||||||||
|
(Dollars in Thousands) |
2015 |
2014 |
2015 |
2014 |
||||||||
|
Amounts recognized in consolidated balance sheets: |
||||||||||||
|
Current liabilities – accrued pension and postretirement costs |
$ |
(398) |
$ |
(391) |
$ |
(68) |
$ |
(67) | ||||
|
Noncurrent liabilities – pension and postretirement obligations |
(15,252) | (13,800) | (945) | (1,232) | ||||||||
|
Net amount recognized |
$ |
(15,650) |
$ |
(14,191) |
$ |
(1,013) |
$ |
(1,299) | ||||
|
Amounts recognized in accumulated other comprehensive income (loss): |
||||||||||||
|
Net loss (gain) |
$ |
13,550 |
$ |
12,120 |
$ |
(330) |
$ |
(30) | ||||
|
Net amount recognized in accumulated other comprehensive income (loss) |
$ |
13,550 |
$ |
12,120 |
$ |
(330) |
$ |
(30) | ||||
As of September 30, 2015 and 2014, the accumulated benefit obligation for all defined benefit pension plans was $39,049 and $38,976 respectively. Information for pension plans with an accumulated benefit obligation in excess of plan assets as of September 30 is set forth in the following table:
|
(Dollars in Thousands) |
2015 |
2014 |
||||
|
Projected benefit obligation |
$ |
39,049 |
$ |
38,976 | ||
|
Accumulated benefit obligation |
39,049 | 38,976 | ||||
|
Fair value of plan assets |
23,399 | 24,785 | ||||
68
The components of net periodic benefit cost that were amortized from Accumulated Other Comprehensive Income were as follows:
|
Pension Benefits |
|||||||||
|
(Dollars in Thousands) |
2015 |
2014 |
2013 |
||||||
|
Interest cost |
$ |
1,554 |
$ |
1,500 |
$ |
1,361 | |||
|
Expected return on plan assets |
(1,584) | (1,508) | (1,460) | ||||||
|
Amortization of net loss |
464 | 194 | 433 | ||||||
|
Net periodic benefit cost |
$ |
434 |
$ |
186 |
$ |
334 | |||
|
Other Benefits |
|||||||||
|
(Dollars in Thousands) |
2015 |
2014 |
2013 |
||||||
|
Service cost |
$ |
51 |
$ |
62 |
$ |
63 | |||
|
Interest cost |
32 | 51 | 41 | ||||||
|
Amortization of net gain |
(48) | (11) | (1) | ||||||
|
Net periodic benefit cost |
$ |
35 |
$ |
102 |
$ |
103 | |||
Other changes in plan assets and benefit obligations recognized in other comprehensive income, pre-tax, were as follows:
|
Pension Benefits |
|||||||||
|
(Dollars in Thousands) |
2015 |
2014 |
2013 |
||||||
|
Net loss (gain) |
$ |
1,894 |
$ |
5,848 |
$ |
(4,151) | |||
|
Amortization of net loss |
(464) | (194) | (433) | ||||||
|
Total recognized in other comprehensive income (loss) |
1,430 | 5,654 | (4,584) | ||||||
|
Total recognized in net periodic benefit cost and other comprehensive income (loss) |
$ |
1,864 |
$ |
5,840 |
$ |
(4,250) | |||
|
Other Benefits |
|||||||||
|
(Dollars in Thousands) |
2015 |
2014 |
2013 |
||||||
|
Net (gain) loss |
$ |
(348) |
$ |
150 |
$ |
(222) | |||
|
Amortization of net gain |
48 | 11 | 1 | ||||||
|
Total recognized in other comprehensive income (loss) |
(300) | 161 | (221) | ||||||
|
Total recognized in net periodic benefit cost and other comprehensive income (loss) |
$ |
(265) |
$ |
263 |
$ |
(118) | |||
The estimated pre-tax amount in accumulated other comprehensive income expected to be recognized in net periodic benefit cost over the next fiscal year for pension benefits is a net loss of $553. The estimated pre-tax amount in accumulated other comprehensive income expected to be recognized in net periodic benefit cost over the next fiscal year for other benefits is a net gain of $39.
During fiscal 2014, the Company adopted the RP-2014 mortality tables and the Mortality Improvement Scale MP-2014 published by the Society of Actuaries’ Retirement Plans Experience Committee. The adoption of the updated mortality tables and the mortality improvement scale increased the Company’s pension liability more than $3 million.
69
Assumptions
The weighted-average discount rate used to determine benefit obligations at September 30, 2015 was 4.15%, 3.80%, 4.06% and 2.98% for Pension, Key Executive SERP, Manager SERP and Directors plans, respectively, which all fall under “Pension Benefits” in this footnote. The weighted-average discount rate used to determine benefit obligations under “Other Benefits” was 3.43% at September 30, 2015.
The weighted-average assumptions used to determine net periodic benefit cost for years ended September 30 were as follows:
|
Pension Benefits |
Other Benefits |
|||||||||||
|
2015 |
2014 |
2013 |
2015 |
2014 |
2013 |
|||||||
|
Discount rate |
4.14% | 4.72% | 3.77% | 3.40% | 4.72% | 3.77% | ||||||
|
Expected long-term return on plan assets |
6.50% | 6.50% | 6.50% |
na |
na |
na |
||||||
|
Rate of compensation increase |
na |
na |
na |
na |
na |
na |
||||||
The expected long-term rate of return of plan assets is based on historical and projected rates of return for current and planned asset classes in the plan’s investment portfolio. Based on the target asset allocation for each asset class, the overall expected rate of return for the portfolio was developed and adjusted for historical and expected experience of the active portfolio management results compared to the benchmark returns and for the effect of expenses paid from plan assets. The Company reviews this long-term assumption on an annual basis.
Assumed health care cost trend rates at September 30 were as follows:
|
2015 |
2014 |
||||
|
Health care cost trend rate assumed for next year |
10% | 10% | |||
|
Rate to which the cost trend rate is assumed to decline (the ultimate trend rate) |
6% | 6% | |||
|
Year that the rate reaches the ultimate trend rate |
2019 | 2018 |
Assumed health care cost trend rates have a significant effect on the amounts reported for the health care plans. A one-percentage-point change in assumed health care cost trend rates would have the following effects as of September 30, 2015.
|
(Dollars in Thousands) |
1-Percentage- |
1-Percentage- |
|||
|
Effect on aggregate of service and interest cost |
$ |
7 |
$ |
6 | |
|
Effect on postretirement benefit obligation |
$ |
77 |
$ |
68 | |
Contributions
The Company, under IRS minimum funding standards, has no required contributions to make to its defined benefit pension plan during fiscal 2016.
70
Estimated Future Benefit Payments
The following benefit payments, which reflect expected future service as appropriate, are expected to be paid:
|
(Dollars in Thousands) |
Pension |
Other |
|||
|
2016 |
$ |
1,253 |
$ |
69 | |
|
2017 |
1,340 | 90 | |||
|
2018 |
1,542 | 121 | |||
|
2019 |
1,806 | 111 | |||
|
2020 |
1,819 | 104 | |||
|
Years 2021-2025 |
10,807 | 440 |
Plan Assets
The Company’s pension plan weighted-average asset allocations by asset category at September 30 were as follows:
|
Plan Assets at September 30, |
|||||
|
Asset Category: |
2015 |
2014 |
|||
|
Fixed income |
46% | 39% | |||
|
Equity securities |
53% | 58% | |||
|
Cash equivalents |
1% | 3% | |||
|
Total |
100% | 100% | |||
Plan assets for the qualified defined benefit pension plan include marketable equity securities, corporate and government debt securities, and cash and short-term investments. The plan assets are not directly invested in the Company’s common stock. The supplemental executive retirement plans and the directors’ retirement plan are not separately funded.
The plan’s investment strategy supports the objectives of the plan. These objectives are to maximize returns in order to meet long-term cash requirements within reasonable and prudent levels of risk. To achieve these objectives, the Company has established a strategic asset allocation policy which is to maintain approximately one half of plan assets in high quality fixed income securities such as investment grade bonds and short-term government securities, with the other half containing large capitalization equity securities. The plan’s objective is to periodically rebalance its assets to approximate weighted-average target asset allocations. Investments are diversified across classes and within each class to minimize the risk of large losses.
Additional information regarding fair value inputs and hierarchy is contained in Note 2. Plan assets measured at fair value on a recurring basis are summarized below:
|
Fair Value Measurements at September 30, 2015 |
||||||||
|
(Dollars in Thousands) |
(Level 1) |
(Level 2) |
(Level 3) |
|||||
|
Asset Category: |
||||||||
|
Money market accounts |
$ |
129 |
$ |
- |
$ |
- |
||
|
Debt securities: |
||||||||
|
Domestic |
9,095 |
- |
- |
|||||
|
International |
1,679 |
- |
- |
|||||
|
Equity securities: |
||||||||
|
Domestic |
10,245 |
- |
- |
|||||
|
International |
2,251 |
- |
- |
|||||
|
Total assets at fair value |
$ |
23,399 |
$ |
- |
$ |
- |
||
71
|
Fair Value Measurements at September 30, 2014 |
||||||||
|
(Dollars in Thousands) |
(Level 1) |
(Level 2) |
(Level 3) |
|||||
|
Asset Category: |
||||||||
|
Money market accounts |
$ |
150 |
$ |
- |
$ |
- |
||
|
Debt securities: |
||||||||
|
Corporate bonds |
8,900 |
- |
- |
|||||
|
Government bonds |
894 |
- |
- |
|||||
|
Equity securities: |
||||||||
|
Domestic |
11,107 |
- |
- |
|||||
|
International |
3,703 |
- |
- |
|||||
|
Total assets at fair value |
$ |
24,754 |
$ |
- |
$ |
- |
||
13.Commitments and Contingencies
The Company is a party to a variety of legal proceedings that arise in the ordinary course of its business. While the results of these legal proceedings cannot be predicted with certainty, the Company regularly reviews legal matters and records provisions for claims that it can estimate and are considered probable of loss. As of September 30, 2015, management believes that the final outcomes of these proceedings are not probable or estimable and there are no claims that are reasonably possible that require disclosure.
The Company maintains stock-based compensation awards for key employees and/or non-employee directors under the Landauer, Inc. Incentive Compensation Plan (the “IC Plan”), which was approved by shareholders in February 2008. For future grants, the IC Plan replaced the previous three plans. The Company reserved 500,000 shares of its common stock for grant under the IC Plan, and shares reserved for award and unused under the previous three plans were cancelled. The IC Plan provides for grants of options to purchase the Company’s common stock, restricted stock, restricted stock units, performance shares and units, and stock appreciation rights. Shares issued upon settlement of stock-based compensation awards are issued from the Company’s authorized, unissued stock.
Stock-based compensation expense, primarily for grants of restricted stock, totaled approximately $1,583, $2,092 and $2,634 for fiscal 2015, 2014 and 2013, respectively. The total income tax benefit recognized in the consolidated statements of operations related to expense for stock-based compensation was approximately $586, $774 and $981 during fiscal 2015, 2014 and 2013, respectively.
72
Restricted Share Awards
Restricted share awards consist of performance shares and time-vested restricted stock. Expense related to performance shares and restricted stock is recognized ratably over the vesting period. Restricted stock issued to eligible employees and directors under the Plans vests, to date, over a period from 1 year to 5 years, and performance shares contingently vest over various periods, depending on the nature of the performance goal. Restricted share transactions during fiscal 2015 were as follows:
|
Number of Restricted Share Awards |
Weighted-Average Fair Value |
||||
|
Outstanding at October 1, 2014 |
86 |
$ |
51.36 | ||
|
Granted |
88 | 34.62 | |||
|
Vested |
(27) | 48.11 | |||
|
Forfeited |
(20) | 54.24 | |||
|
Outstanding at September 30, 2015 |
127 |
$ |
39.62 |
As of September 30, 2015, unrecognized compensation expense related to restricted share awards totaled $3,161 and is expected to be recognized over a weighted average period of 1.49 years. The total fair value of shares vested during fiscal 2015, 2014 and 2013 was $1,453, $3,556 and $1,999, respectively.
The per share weighted average fair value of restricted shares, including restricted stock and performance shares, granted during fiscal 2015, 2014 and 2013 was $34.62, $47.97 and $58.19, respectively.
Stock Options
Expense related to stock options issued to eligible employees and directors under the IC Plan is recognized ratably over the vesting period. Stock options generally vest over a period of 0 to 4 years and have 10-year contractual terms. A summary of stock option activity during fiscal 2015 is presented below:
|
Number of Options |
Weighted-Average Exercise |
Weighted-Average Remaining Contractual Term (Years) |
Aggregate Intrinsic Value |
||||||||
|
Outstanding at October 1, 2014 |
64 |
$ |
48.35 | ||||||||
|
Exercised |
- |
- |
|||||||||
|
Forfeited |
(62) | 48.30 | |||||||||
|
Outstanding at September 30, 2015 |
2 |
$ |
49.88 |
- |
$ |
- |
|||||
|
Exercisable at September 30, 2015 |
2 |
$ |
49.88 |
- |
$ |
- |
As of September 30, 2015, all outstanding stock options were vested and compensation expense related to stock options was recognized. The Company has not granted stock options subsequent to fiscal 2005. The intrinsic value of options exercised totaled $0, $34 and $216 during fiscal 2015, 2014 and 2013, respectively. The total income tax benefit recognized in the consolidated statements of operations related to the exercise of stock options was $0, $13 and $99 during fiscal 2015, 2014 and 2013, respectively.
73
The Company provides its services primarily to customers in the U.S., as well as to customers in other geographic markets. The Company does not have any significant long-lived assets in foreign countries. The following table shows the geographical distribution of external customer revenues that were attributed to a particular region based on whether the customer had a direct contract with the Company’s subsidiary located in that region for the fiscal years ended September 30:
|
(Dollars in Thousands) |
2015 |
2014 |
2013 |
||||||
|
Domestic |
$ |
120,861 |
$ |
117,853 |
$ |
115,959 | |||
|
Europe |
20,538 | 24,966 | 21,559 | ||||||
|
Other countries |
9,915 | 12,243 | 12,172 | ||||||
|
Consolidated revenues |
$ |
151,314 |
$ |
155,062 |
$ |
149,690 | |||
During fiscal 2014, the Company changed the presentation of its reporting segments to separately disclose certain ‘corporate expenses’ that had previously been reported within the Radiation Measurement segment. As a result, the current segment disclosures reflect three reporting segments (Radiation Measurement, Medical Physics and Medical Products) and one functional group (Corporate). The factors for determining the reportable segments reflect specific markets and the products and services offered combined with the nature of the individual business traits, as well as key financial information reviewed by management.
The Radiation Measurement segment provides analytical services to determine occupational and environmental radiation exposure. These services are provided internationally primarily to hospitals, medical and dental offices, universities, national laboratories, and nuclear facilities. Radiation Measurement activities include the manufacture of various types of radiation detection monitors, the distribution and collection of the monitors to and from customers, and the analysis and reporting of exposure findings. In addition to providing analytical services, the Radiation Measurement segment sells dosimetry detectors and reading equipment.
The Medical Physics segment provides therapeutic and imaging physics services to domestic hospitals and radiation therapy centers. Service offerings include clinical physics support, equipment commissioning, accreditation support and imaging equipment testing. These professional services are provided to customers on-site by skilled physicists.
The Medical Products segment provides medical consumable accessories used in radiology, radiation therapy, and image guided surgery procedures. Medical products range from consumables used with MRI, CT, and mammography technologies to highly engineered passive reflective markers used during image guided surgery procedures.
The Company primarily evaluates performance of the individual segments based upon, among other metrics, segment operating income or loss. Segment operating income or loss is segment revenues less segment cost of sales and segment selling, general and administrative expenses. Corporate expenses for shared functions, including corporate management, corporate finance and human resources, are recognized in the Corporate functional group. In addition, acquisition and reorganization costs are not allocated to the segments. Information about net other income, including interest income and expense, and income taxes is not provided at the segment level. As the Company’s business model evolves in increased complexity, management may determine it necessary to change this reporting practice to reflect any appropriate allocations.
74
The following tables summarize financial information for each reportable segment for the years ended September 30:
|
(Dollars in Thousands) |
2015 |
2014 |
2013 |
||||||
|
Revenues by segment: |
|||||||||
|
Radiation Measurement |
$ |
105,978 |
$ |
113,556 |
$ |
109,326 | |||
|
Medical Physics |
35,449 | 32,213 | 30,859 | ||||||
|
Medical Products |
9,887 | 9,293 | 9,505 | ||||||
|
Consolidated revenues |
$ |
151,314 |
$ |
155,062 |
$ |
149,690 | |||
|
2015 |
2014 |
2013 |
|||||||
|
Operating income (loss) by segment: |
|||||||||
|
Radiation Measurement |
$ |
35,641 |
$ |
38,231 |
$ |
38,682 | |||
|
Medical Physics |
3,126 | 1,827 | 3,499 | ||||||
|
Medical Products (1) |
1,534 | (62,572) | (21,778) | ||||||
|
Corporate |
(16,602) | (17,473) | (17,014) | ||||||
|
Consolidated operating income (loss) |
$ |
23,699 |
$ |
(39,987) |
$ |
3,389 | |||
|
2015 |
2014 |
2013 |
|||||||
|
Depreciation and amortization by segment: |
|||||||||
|
Radiation Measurement |
$ |
10,345 |
$ |
10,250 |
$ |
11,357 | |||
|
Medical Physics |
1,089 | 1,085 | 1,185 | ||||||
|
Medical Products |
878 | 2,580 | 2,509 | ||||||
|
Consolidated depreciation and amortization |
$ |
12,312 |
$ |
13,915 |
$ |
15,051 | |||
(1)Includes goodwill and other intangible assets impairment charge of $62,188 and $22,700 in fiscal 2014 and 2013, respectively.
|
(Dollars in Thousands) |
2015 |
2014 |
||||
|
Segment assets: |
||||||
|
Radiation Measurement |
$ |
142,850 |
$ |
148,151 | ||
|
Medical Physics |
43,677 | 38,851 | ||||
|
Medical Products |
48,308 | 48,164 | ||||
|
Eliminations |
(26,091) | (18,580) | ||||
|
Consolidated assets |
$ |
208,744 |
$ |
216,586 | ||
75
The Company has a minority interest in Yamasato, Fujiwara, Higa & Associates, Inc. doing business as Aquila. The Company provides dosimetry parts to Aquila for their military contract. The Company also has a 50% equity interest in Nagase.
In connection with the preparation of the consolidated financial statements for the interim periods ended March 31, 2015, the Company identified errors in its previously issued financial statements for the interim periods ended June 30, 2014. The Company did not properly report sales to related parties in its Related Party Transactions footnote. As a result of these errors, the Company understated sales to Aquila by $215 and understated sales to Nagase by $271, respectively, as previously reported for the year ended September 30, 2014. In accordance with accounting guidance presented in SAB 99, management assessed the materiality of these errors and concluded that they were not material to the Company’s financial statements for the year ended September 30, 2014.
The sales to and purchases from Aquila are reported in the table below for the fiscal years ended September 30. Sales to Aquila for the fiscal year ended September 30, 2014 has been corrected for the error discussed above.
|
(Dollars in Thousands) |
2015 |
2014 |
2013 |
||||||
|
Sales to Aquila |
$ |
5,844 |
$ |
6,271 |
$ |
7,720 | |||
|
Purchases from Aquila |
647 | 890 | 243 | ||||||
Balance sheet items associated with Aquila at September 30 were as follows:
|
(Dollars in Thousands) |
2015 |
2014 |
||||
|
Amounts in accounts receivable |
$ |
2,795 |
$ |
3,799 | ||
|
Amounts in accounts payable |
284 | 227 | ||||
The sales to and purchases from Nagase are reported in the table below for the fiscal years ended September 30. Sales to Nagase for the fiscal year ended September 30, 2014 has been corrected for the error discussed above.
|
(Dollars in Thousands) |
2015 |
2014 |
2013 |
||||||
|
Sales to Nagase |
$ |
1,924 |
$ |
1,341 |
$ |
296 | |||
|
Purchases from Nagase |
1,189 | 1,710 | 3,092 | ||||||
Balance sheet items associated with Nagase at September 30 were as follows:
|
(Dollars in Thousands) |
2015 |
2014 |
||||
|
Amounts in accounts receivable |
$ |
769 |
$ |
27 | ||
|
Amounts in accounts payable |
33 | 60 | ||||
76
18.Quarterly Financial Data (unaudited)
The following table sets forth certain consolidated statement of operations data for each of the quarters in fiscal 2015 and 2014. This information has been derived from our quarterly unaudited consolidated financial statements.
|
First |
Second |
Third |
Fourth |
||||||||||||
|
(Dollars in Thousands, Except per Share) |
Quarter |
Quarter |
Quarter |
Quarter |
Total Year |
||||||||||
|
2015 |
|||||||||||||||
|
Total revenues |
$ |
37,547 |
$ |
38,139 |
$ |
35,467 |
$ |
40,161 |
$ |
151,314 | |||||
|
Gross profit |
$ |
19,796 |
$ |
19,528 |
$ |
18,646 |
$ |
20,759 |
$ |
78,729 | |||||
|
Operating income(2) |
$ |
6,141 |
$ |
5,630 |
$ |
5,111 |
$ |
6,817 |
$ |
23,699 | |||||
|
Net income attributed to Landauer, Inc. |
$ |
4,377 |
$ |
3,547 |
$ |
4,055 |
$ |
2,564 |
$ |
14,543 | |||||
|
Basic net income per share |
$ |
0.46 |
$ |
0.37 |
$ |
0.42 |
$ |
0.27 |
$ |
1.52 | |||||
|
Diluted net income per share(2) |
$ |
0.46 |
$ |
0.37 |
$ |
0.42 |
$ |
0.27 |
$ |
1.52 | |||||
|
Weighted average basic shares outstanding |
9,446 | 9,493 | 9,509 | 9,533 | 9,511 | ||||||||||
|
Weighted average diluted shares outstanding |
9,474 | 9,520 | 9,534 | 9,570 | 9,540 | ||||||||||
|
2014 |
|||||||||||||||
|
Total revenues |
$ |
38,147 |
$ |
39,054 |
$ |
35,868 |
$ |
41,993 |
$ |
155,062 | |||||
|
Gross profit |
$ |
19,762 |
$ |
20,722 |
$ |
17,938 |
$ |
22,485 |
$ |
80,907 | |||||
|
Operating income (loss)(1) (2) |
$ |
5,425 |
$ |
6,863 |
$ |
(59,627) |
$ |
7,352 |
$ |
(39,987) | |||||
|
Net income (loss) attributed to Landauer, Inc. |
$ |
3,821 |
$ |
4,514 |
$ |
(36,335) |
$ |
2,797 |
$ |
(25,203) | |||||
|
Basic net income (loss) per share |
$ |
0.40 |
$ |
0.47 |
$ |
(3.83) |
$ |
0.31 |
$ |
(2.65) | |||||
|
Diluted net income (loss) per share(1) (2) |
$ |
0.40 |
$ |
0.47 |
$ |
(3.83) |
$ |
0.31 |
$ |
(2.65) | |||||
|
Weighted average basic shares outstanding |
9,422 | 9,460 | 9,482 | 9,524 | 9,524 | ||||||||||
|
Weighted average diluted shares outstanding |
9,467 | 9,501 | 9,482 | 9,572 | 9,524 | ||||||||||
(1)The third quarter of fiscal 2014 includes the goodwill and other intangible assets impairment charge of $62,188 and reorganization expenses of $1,558, which had an adverse impact of ($3.92) and ($0.10), respectively, on diluted net loss per share.
(2)The fourth quarter of fiscal 2015 and fiscal 2014 includes reorganization expenses of $1,041 and $2,024, respectively, which had an adverse impact of ($0.05) and ($0.08), respectively, on diluted net income per share.
77
Item 9. Changes in and Disagreements With Accountants on Accounting and Financial Disclosure.
As disclosed in the Current Report on Form 8-K filed by the Company on June 1, 2015, the Audit Committee of the Board of Directors appointed BDO USA, LLP (“BDO”) to serve as the Company’s independent registered public accounting firm for the fiscal year ending September 30, 2015 and dismissed PricewaterhouseCoopers LLP (“PwC”), both effective as of May 28, 2015.
PwC’s reports on the consolidated financial statements of the Company and its subsidiaries as of and for the fiscal years ended September 30, 2014 and 2013 did not contain an adverse opinion or a disclaimer of opinion, nor were they qualified or modified as to uncertainty, audit scope or accounting principles.
During the fiscal years ended September 30, 2014 and 2013, and the subsequent interim period through May 28, 2015, the date of PwC’s dismissal, there were no disagreements with PwC on any matter of accounting principles or practices, financial statement disclosure, or auditing scope or procedure, which disagreements if not resolved to the satisfaction of PwC would have caused PwC to make reference thereto in their reports for such fiscal years. There were “reportable events” (as that term is defined in Item 304(a)(1)(v) of Regulation S-K), except as disclosed in the Company’s Annual Reports on Form 10-K for the fiscal years ended September 30, 2014 and September 30, 2013 and Quarterly Reports on Form 10-Q for the quarters ending March 31, 2014, June 30, 2014, December 31, 2014 and March 31, 2015, related to the existence of material weaknesses in the Company’s internal controls over financial reporting related to the following:
|
· |
the Company did not maintain a sufficient complement of personnel with an appropriate level of knowledge of accounting, experience and training commensurate with its financial reporting requirements; additionally, the Company did not consistently establish appropriate authorities and responsibilities in pursuit of financial reporting objectives; |
|
· |
the Company did not design effective controls over the preparation and review of its Consolidated Statement of Cash Flows. Specifically, controls were not designed to evaluate whether transactions were properly classified within the Consolidated Statement of Cash Flows, including nonrecurring transactions and adjustments pertaining to purchases of property, plant and equipment; |
|
· |
the Company did not design and maintain processes and procedures that restrict access to key financial systems and records to appropriate users and evaluate whether appropriate segregation of duties was maintained. Specifically, certain personnel had access to financial applications, programs and data beyond that needed to perform their individual job responsibilities without independent monitoring; |
|
· |
the Company did not design and implement effective risk assessment with regard to its processes and procedures commensurate with its financial reporting requirements. Specifically, the Company did not design and implement controls in response to risks of misstatement of the financial statements; |
|
· |
the Company did not maintain processes and procedures that were adequately designed, documented and executed to support the accurate and timely reporting of revenue and the related receivables. Specifically, the Company did not design and maintain effective controls to evaluate whether revenue was recognized in accordance with agreed-upon terms and conditions, including customer order entry, pricing, customer acceptance provisions, and recorded in the proper period; and |
|
· |
the Company did not design effective controls to evaluate whether cash and investments held by foreign affiliates were appropriately accounted for and classified. |
PwC’s report on the effectiveness of the Company’s internal control over financial reporting as of September 30, 2014, which was included in the Company’s 2014 Annual Report on Form 10-K, contained an adverse opinion thereon. The Audit Committee discussed the material weaknesses in the Company’s internal control over financial reporting with PwC, and authorized PwC to fully respond to the inquiries of BDO, the successor independent registered public accounting firm, concerning such material weaknesses.
78
The Company furnished a copy of the above disclosures to PwC and requested that PwC provide a letter addressed to the SEC stating whether or not it agrees with the statements made above. A copy of such letter was filed as Exhibit 16.1 to the Company’s Current Report on Form 8-K filed with the SEC on June 1, 2015.
During the Company’s fiscal years ended September 30, 2014 and 2013, and the subsequent interim period through May 28, 2015, the date of BDO’s appointment, neither the Company, nor anyone acting on the Company’s behalf, has consulted with BDO regarding either (i) the application of accounting principles to a specified transaction, either completed or proposed, or the type of audit opinion that might be rendered with respect to the Company’s consolidated financial statements, and neither where a written report or oral advice was provided to the Company by BDO that BDO concluded was an important factor considered by the Company in reaching a decision as to any accounting, auditing or financial reporting issue; or (ii) any matter that was either the subject of a “disagreement” (within the meaning of Item 304(a)(1)(iv) of Regulation S-K and the related instructions) or a “reportable event” (as that term is defined in Item 304(a)(1)(v) of Regulation S-K).
Item 9A. Controls and Procedures.
Disclosure Controls and Procedures
Our management, with the participation of our Chief Executive Officer and our Chief Financial Officer, evaluated the effectiveness of our disclosure controls and procedures as of September 30, 2015. The term “disclosure controls and procedures,” as defined in Rules 13a-15(e) and 15d-15(e) under the Securities Exchange Act of 1934, as amended (the “Exchange Act”), means controls and other procedures of a company that are designed to ensure that information required to be disclosed by a company in the reports that it files or submits under the Exchange Act is recorded, processed, summarized and reported, within the time periods specified in the SEC’s rules and forms. Disclosure controls and procedures include, without limitation, controls and procedures designed to ensure that information required to be disclosed by a company in the reports that it files or submits under the Exchange Act is accumulated and communicated to the company’s management, including its Chief Executive Officer and Chief Financial Officer, as appropriate, to allow timely decisions regarding required disclosure. Based on this evaluation, our Chief Executive Officer and Chief Financial Officer concluded as of September 30, 2015 that our disclosure controls and procedures were not effective at the reasonable assurance level due to material weaknesses in our internal control over financial reporting described in “Management’s Report on Internal Control over Financial Reporting.” Notwithstanding the material weaknesses discussed below, our management, including our Chief Executive Officer and Chief Financial Officer, has concluded that the consolidated financial statements included in this Annual Report on Form 10-K present fairly, in all material respects, our financial position, results of operations and cash flows as of and for the periods presented in conformity with accounting principles generally accepted in the United States (“U.S. GAAP”).
Management’s Report on Internal Control over Financial Reporting
Management is responsible for establishing and maintaining adequate internal control over financial reporting, as such term is defined in Exchange Act Rules 13a-15(f) and 15d-15(f). The Company’s internal control over financial reporting is a process designed by, or under the supervision of, our Chief Executive Officer and Chief Financial Officer, to provide reasonable assurance regarding the reliability of financial reporting and the preparation of financial statements for external purposes in accordance with generally accepted accounting principles. Internal control over financial reporting includes those policies and procedures that:
|
· |
pertain to the maintenance of records that, in reasonable detail, accurately and fairly reflect the transactions and dispositions of the assets of the Company; |
|
· |
provide reasonable assurance that transactions are recorded as necessary to permit preparation of financial statements in accordance with generally accepted accounting principles, and that receipts and expenditures of the Company are being made only in accordance with authorizations of management and directors of the Company; and |
|
· |
provide reasonable assurance regarding prevention or timely detection of unauthorized acquisition, use or disposition of the Company’s assets that could have a material effect on the financial statements.
79
|
Because of its inherent limitations, internal control over financial reporting may not prevent or detect all misstatements. Also, projections of any evaluation of effectiveness to future periods are subject to the risk that controls may become inadequate because of changes in conditions, or that the degree of compliance with the policies or procedures may deteriorate.
Management, including our Chief Executive Officer and Chief Financial Officer, assessed the effectiveness of the Company’s internal control over financial reporting as of September 30, 2015. In making this assessment, management used the criteria set forth by the Committee of Sponsoring Organizations of the Treadway Commission (COSO) in Internal Control‑Integrated Framework (1992). Management has concluded that the Company’s internal control over financial reporting was not effective as of September 30, 2015 due to the material weaknesses in the Company’s internal control over financial reporting described below. A material weakness is a deficiency, or a combination of deficiencies, in internal control over financial reporting, such that there is a reasonable possibility that a material misstatement of a company’s annual or interim financial statements will not be prevented or detected on a timely basis.
We identified and reported the following material weaknesses in the Company’s internal control over financial reporting as of September 30, 2015:
Control Environment - We did not maintain an effective control environment as we did not maintain a sufficient complement of personnel with an appropriate level of knowledge of accounting, experience and training commensurate with our financial reporting requirements. Additionally, we did not consistently establish appropriate authorities and responsibilities in pursuit of our financial reporting objectives. These material weaknesses contributed to the following control deficiencies, each of which is considered to be a material weakness:
Consolidated Statement of Cash Flows:
|
· |
We did not design effective controls over the preparation and review of our Consolidated Statements of Cash Flows. Specifically, controls were not designed to evaluate whether transactions were properly classified within the Consolidated Statements of Cash Flows, including nonrecurring transactions and adjustments pertaining to purchases of property, plant and equipment. |
Remediation Activities: We have improved our process over the preparation and review of our Consolidated Statements of Cash Flows to ensure completeness and accuracy over the transactions reported. We created new templates and supporting schedules that facilitate the preparation of our Consolidated Statements of Cash Flows. We also enhanced our cash flow checklist to identify the most common elements of operating, investing and financing activities, including nonrecurring transactions and adjustments. We have completed our testing of internal control effectiveness and believe this material weakness has been remediated as of September 30, 2015.
IT general controls and segregation of duties:
|
· |
We did not design and maintain processes and procedures that restrict access to key financial systems and records to appropriate users and evaluate whether appropriate segregation of duties is maintained. Specifically, certain personnel had access to financial application, programs and data beyond that needed to perform their individual job responsibilities without independent monitoring. With the IT general controls environment ineffective, manual reviews of the completeness and accuracy of reports supporting transaction processing (and, correspondingly, supporting the controls over transaction processing) are not sufficiently designed and implemented. |
Remediation Activities: We have improved our IT general controls and segregation of duties. We adopted a new global IT general controls framework and have implemented this new framework domestically. We have begun to implement this new framework in our European entities. In addition, we removed access to financial application programs and data beyond that needed for certain personnel to perform their individual job responsibilities.
80
Risk Assessment - We did not design and implement an effective risk assessment with regard to our processes and procedures commensurate with our financial reporting requirements. Specifically, we did not design and implement controls in response to risks of misstatement of the financial statements. This material weakness contributed to the following control deficiencies, each of which is considered to be a material weakness:
|
· |
Revenue: We did not maintain processes and procedures that were adequately designed, documented and executed to support the accurate and timely reporting of revenue and the related receivables. Specifically, we did not design and maintain effective controls to evaluate whether revenue was recognized in accordance with agreed-upon terms and conditions, including customer order entry, pricing, customer acceptance provisions, and recorded in the proper period. |
Remediation Activities: We have improved our controls to ensure the accurate and timely reporting of revenue and the related receivables, including the following:
|
· |
Implemented procedures to identify and evaluate customer contracts with nonstandard terms; |
|
· |
Implemented quarterly processes to ensure the proper cut-off of revenue recognition; |
|
· |
Implemented standard terms and conditions; |
|
· |
Designed and implemented pricing compliance templates for custom quotes and new customers; |
|
· |
Enhanced procedures to comply with pricing pursuant to group purchasing organization contracts; |
|
· |
Established a methodology and process to estimate a reserve for credit memos; and |
|
· |
Enhanced calculations to improve the accuracy of deferred contract revenue estimates. |
We commenced a formal risk assessment during fiscal 2015 to assess risks and identify, design, implement, and re-evaluate our control activities and completed the risk assessment as of September 30, 2015.
The risk assessment and revenue material weaknesses also resulted in revisions to second and third quarter fiscal 2014, annual fiscal 2014 and first quarter fiscal 2015 financial statement disclosures related to sales to its equity investees. Management has determined that these revisions, first disclosed in the second quarter of fiscal 2015, are additional effects of the material weaknesses related to risk assessment and revenue described above.
|
· |
Foreign affiliate cash and investments: We did not design effective controls to evaluate whether cash and investments held by foreign affiliates were appropriately accounted for and classified. |
Remediation Activities: We have implemented controls to evaluate the classification of cash and investments held by foreign affiliates. We also designed processes to monitor the establishment of new cash and investment accounts. We have completed our testing of internal control effectiveness and believe this material weakness has been remediated as of September 30, 2015.
Additionally, these material weaknesses could result in a misstatement of the consolidated account balances or disclosures that would result in a material misstatement to the annual or interim consolidated financial statements that would not be prevented or detected.
The effectiveness of the Company’s internal control over financial reporting as of September 30, 2015 has been audited by BDO, an independent registered public accounting firm, as stated in their report which appears below:
81
Report of Independent Registered Public Accounting Firm
on Internal Control over Financial Reporting
Board of Directors and Stockholders
Landauer, Inc.
Glenwood, Illinois
We have audited Landauer, Inc.’s internal control over financial reporting as of September 30, 2015, based on criteria established in Internal Control – Integrated Framework (1992) issued by the Committee of Sponsoring Organizations of the Treadway Commission (the COSO criteria). Landauer, Inc.’s management is responsible for maintaining effective internal control over financial reporting and for its assessment of the effectiveness of internal control over financial reporting, included in the accompanying “Item 9A, Controls and Procedures”. Our responsibility is to express an opinion on the company’s internal control over financial reporting based on our audit.
We conducted our audit in accordance with the standards of the Public Company Accounting Oversight Board (United States). Those standards require that we plan and perform the audit to obtain reasonable assurance about whether effective internal control over financial reporting was maintained in all material respects. Our audit included obtaining an understanding of internal control over financial reporting, assessing the risk that a material weakness exists, and testing and evaluating the design and operating effectiveness of internal control based on the assessed risk. Our audit also included performing such other procedures as we considered necessary in the circumstances. We believe that our audit provides a reasonable basis for our opinion.
A company’s internal control over financial reporting is a process designed to provide reasonable assurance regarding the reliability of financial reporting and the preparation of financial statements for external purposes in accordance with generally accepted accounting principles. A company’s internal control over financial reporting includes those policies and procedures that (1) pertain to the maintenance of records that, in reasonable detail, accurately and fairly reflect the transactions and dispositions of the assets of the company; (2) provide reasonable assurance that transactions are recorded as necessary to permit preparation of financial statements in accordance with generally accepted accounting principles, and that receipts and expenditures of the company are being made only in accordance with authorizations of management and directors of the company; and (3) provide reasonable assurance regarding prevention or timely detection of unauthorized acquisition, use, or disposition of the company’s assets that could have a material effect on the financial statements.
Because of its inherent limitations, internal control over financial reporting may not prevent or detect misstatements. Also, projections of any evaluation of effectiveness to future periods are subject to the risk that controls may become inadequate because of changes in conditions, or that the degree of compliance with the policies or procedures may deteriorate.
A material weakness is a deficiency, or a combination of deficiencies, in internal control over financial reporting, such that there is a reasonable possibility that a material misstatement of the company’s annual or interim financial statements will not be prevented or detected on a timely basis. The following material weaknesses have been identified and described in management’s assessment:
(i) An ineffective control environment, due to a lack of a sufficient complement of personnel with an appropriate level of knowledge, experience and training commensurate with the Company’s reporting requirements, as well as (ii) the Company did not consistently establish appropriate authorities and responsibilities in pursuit of the Company’s financial reporting objectives. These material weaknesses contributed to material weaknesses related to (iii) ineffective design of processes and procedures to restrict access to key financial systems and records to appropriate users and evaluate whether appropriate segregation of duties is maintained. With the IT general controls environment ineffective, manual reviews of the completeness and accuracy of reports supporting transaction processing (and, correspondingly, supporting the controls over transaction processing) are not sufficiently designed and implemented.
82
(iv) An ineffective risk assessment commensurate with the Company’s financial reporting requirements. This material weakness contributed to material weaknesses related to (v) ineffective processes and procedures that were not adequately designed, documented and executed to support the accurate and timely reporting of revenue and the related receivables.
These material weaknesses were considered in determining the nature, timing, and extent of audit tests applied in our audit of the financial statements as of and for the year ended September 30, 2015, and this report does not affect our report dated December 14, 2015 on those financial statements.
In our opinion, Landauer, Inc. did not maintain, in all material respects, effective internal control over financial reporting as of September 30, 2015, based on the COSO criteria. We do not express an opinion or any other form of assurance on management’s statements referring to any corrective actions taken by the company after the date of management’s assessment.
We have also audited, in accordance with the standards of the Public Company Accounting Oversight Board (United States), the consolidated balance sheet of Landauer, Inc. as of September 30, 2015 and the related consolidated statements of operations, comprehensive income, stockholders’ equity, and cash flows for the period ended September 30, 2015, and our report dated December 14, 2015 expressed an unqualified opinion thereon.
/s/ BDO USA, LLP
Chicago, IL
December 14, 2015
Changes in Internal Control over Financial Reporting
We believe the following material weaknesses have been remediated as of September 30, 2015:
|
· |
We have implemented controls over the preparation and review of our Consolidated Statements of Cash Flows to ensure completeness and accuracy over the transactions reported. Specifically, we created new templates and supporting schedules that facilitate the preparation of our Consolidated Statements of Cash Flows. We also improved our cash flow checklist to identify the most common elements of operating, investing and financing activities, including nonrecurring transactions and adjustments. |
|
· |
We have implemented controls over the evaluation and review of cash and investments held by foreign affiliates to ensure proper classification. We also improved our processes to monitor the establishment of new cash and investment accounts. Specifically, we perform a detailed review of the foreign affiliates’ cash and investment statements and bank reconciliations. |
Not Applicable.
83
PART III
Item 10. Directors, Executive Officers and Corporate Governance.
Information pursuant to this Item relating to the directors of the Company, contained under the headings “Election of Directors”, “Beneficial Ownership of Common Stock”, “Process for Nominating Directors” and “Executive Officers” in the Proxy Statement, is incorporated herein by reference.
Disclosure pursuant to this Item regarding Section 16(a) reporting compliance, contained under the heading “Section 16(a) Beneficial Ownership Reporting Compliance” in the Proxy Statement, is incorporated herein by reference. Information pursuant to this Item relating to the Company’s Audit Committee and the Company’s code of ethics, contained under the heading “Board of Directors and Committees” in the Proxy Statement, is incorporated herein by reference.
Item 11. Executive Compensation.
Except for the information relating to Item 13 hereof, the information contained under the headings “Executive Compensation” and “Compensation Committee Report” in the Proxy Statement, is incorporated herein by reference.
Item 12. Security Ownership of Certain Beneficial Owners and Management and Related Stockholder Matters.
The information contained under the headings “Beneficial Ownership of Common Stock” and “Equity Compensation Plan Information” in the Proxy Statement is incorporated herein by reference.
Item 13. Certain Relationships and Related Transactions, and Director Independence.
Except for the information relating to Item 11 hereof, the information contained under the headings “Election of Directors” and “Independence of Directors” in the Proxy Statement is incorporated herein by reference.
Item 14. Principal Accounting Fees and Services.
The information contained under the heading “Fees Billed by Independent Public Accountants” in the Proxy Statement is incorporated herein by reference.
84
PART IV
Item 15. Exhibits and Financial Statement Schedules.
Landauer, Inc. and Subsidiaries
Schedule II – Valuation and Qualifying Accounts
For the Years Ended September 30,
|
Accounts Receivable Allowances |
|||||||||
|
(Dollars in Thousands) |
2015 |
2014 |
2013 |
||||||
|
Balance at beginning of period |
$ |
1,872 |
$ |
1,266 |
$ |
1,567 | |||
|
Additions: |
|||||||||
|
Charged to costs and expenses |
850 | 1,109 | 14 | ||||||
|
Charged to other accounts (1) |
149 | 129 | 20 | ||||||
|
Deductions (2) |
(1,315) | (632) | (335) | ||||||
|
Balance at end of period |
$ |
1,556 |
$ |
1,872 |
$ |
1,266 | |||
|
(1) |
Collection of accounts previously written off. |
|
(2) |
Uncollectible accounts written off. |
|
Inventory Obsolescence Reserve |
|||||||||
|
(Dollars in Thousands) |
2015 |
2014 |
2013 |
||||||
|
Balance at beginning of period |
$ |
484 |
$ |
398 |
$ |
338 | |||
|
Additions: |
|||||||||
|
Charged to costs and expenses |
(1) | 148 | 122 | ||||||
|
Charged to other accounts |
- |
- |
- |
||||||
|
Deductions(1) |
(36) | (62) | (62) | ||||||
|
Balance at end of period |
$ |
447 |
$ |
484 |
$ |
398 | |||
|
(1) |
Inventory written off. |
85
|
(3)(a) |
Certificate of Incorporation of the Registrant, as amended through March 6, 2015, is incorporated by reference to Exhibit 3.1 to the Quarterly Report on Form 10-Q for the quarter ended December 31, 2014. |
|
(3)(b) |
Amended and Restated Bylaws of the Registrant, as amended and restated effective December 15, 2014, are incorporated by reference to Exhibit 3.1 to the Current Report on Form 8-K dated December 18, 2014. |
|
(4)(a) |
Specimen common stock certificate of the Registrant is incorporated by reference to Exhibit (4)(a) to the Annual Report on Form 10-K for the fiscal year ended September 30, 1997. |
|
(10)(a) |
The Landauer, Inc. Executive Special Severance Plan as amended and restated on November 12, 2014 is incorporated by reference to Exhibit (10)(a) to the Annual Report on Form 10-K for the fiscal year ended September 30, 2014. |
|
(10)(b) |
The Landauer, Inc. Executive Severance Plan is incorporated by reference to Exhibit (10)(b) to the Annual Report on Form 10-K for the fiscal year ended September 30, 2014. |
|
(10)(c) |
Promotion Letter with Michael P. Kaminski, dated August 25, 2015, is incorporated by reference to Exhibit 10.1 to the Current Report on Form 8-K dated August 28, 2015. |
|
(10)(d) |
Employment Agreement dated September 28, 2005 between the Registrant and William E. Saxelby is incorporated by reference to Exhibit (10)(q) to the Annual Report on Form 10-K for the fiscal year ended September 30, 2005. |
|
(10)(e) |
Amendment dated as of May 1, 2009 to the Employment Agreement between the Registrant and William E. Saxelby is incorporated by reference to Exhibit 10.1 to the Current Report on Form 8-K dated May 1, 2009. |
|
(10)(f) |
Amendment dated as of December 18, 2012 to the Employment Agreement between the Registrant and William E. Saxelby is incorporated by reference to Exhibit 10.1 to the Current Report on Form 8-K dated December 18, 2012. |
|
(10)(g) |
Separation and Consulting Agreement, dated as of September 12, 2014, between the Registrant and William E. Saxelby is incorporated by reference to Exhibit (10)(f) to the Annual Report on Form 10-K for the fiscal year ended September 30, 2014. |
|
(10)(h) |
Offer Letter dated December 15, 2014 between the Registrant and Michael T. Leatherman is incorporated by reference to Exhibit 10(g) to the Annual Report on Form 10-K for the fiscal year ended September 30, 2014. |
|
(10)(i) |
Letter Agreement with Michael T. Leatherman, dated August 25, 2015, is incorporated by reference to Exhibit 10.2 to the Current Report on Form 8-K dated August 28, 2015. |
|
(10)(j) |
Separation Agreement between the Registrant and Michael K. Burke, dated as of June 17, 2014, is incorporated by reference to Exhibit 10.2 to the Current Report on Form 8-K dated June 17, 2014. |
|
(10)(k) |
Employment agreement dated February 29, 1996 between the Registrant and R. Craig Yoder is incorporated by reference to the Annual Report on Form 10-K for the fiscal year ended September 30, 1998. |
|
(10)(l) |
Amendment to Employment Agreement dated May 2, 2006 between the Registrant and R. Craig Yoder is incorporated by reference to Exhibit 10.1 to the Quarterly Report on Form 10-Q for the quarter ended June 30, 2006. |
|
(10)(m) |
Second Amendment to Employment Agreement dated February 6, 2015 between the Registrant and R. Craig Yoder is incorporated by reference to Exhibit 10.1 to the Current Report on Form 8-K dated February 11, 2015. |
|
(10)(n) |
Promotion Letter with Daniel J. Fujii, dated April 15, 2015, is incorporated by reference to Exhibit 10.1 to the Current Report on Form 8-K dated April 21, 2015. |
|
(10)(o) |
Promotion Letter with Kara B. Venegas, dated April 15, 2015, is incorporated by reference to Exhibit 10.2 to the Current Report on Form 8-K dated April 21, 2015. |
|
(10)(p) |
The Landauer, Inc. Incentive Compensation Plan is incorporated by reference to Exhibit A to the Proxy Statement for the Annual Meeting of Stockholders dated January 7, 2013. |
|
(10)(q) |
The Landauer, Inc. Incentive Compensation Plan, as amended and restated on November 12, 2014, is incorporated by reference to Exhibit (10)(l) to the Annual Report on Form 10-K for the fiscal year ended September 30, 2014. |
|
(10)(r) |
Form of Restricted Stock Award under the Landauer, Inc. Incentive Compensation Plan is incorporated by reference to Exhibit 10.1 to the Current Report on Form 8-K dated February 7, 2008. |
86
|
(10)(s) |
Form of Amended Restricted Stock Award Agreement is incorporated by reference to Exhibit (10)(n) to the Annual Report on Form 10-K for the fiscal year ended September 30, 2014. |
|
(10)(t) |
Form of Performance Stock Award under the Landauer, Inc. Incentive Compensation Plan is incorporated by reference to Exhibit 10.2 to the Current Report on Form 8-K dated February 7, 2008. |
|
(10)(u) |
Form of Amended Performance Stock Award Agreement is incorporated by reference to Exhibit (10)(p) to the Annual Report on Form 10-K for the fiscal year ended September 30, 2014. |
|
(10)(v) |
Amended and Restated Credit Agreement, dated as of August 2, 2013, among Landauer, Inc., Global Physics Solutions, Inc. and IZI Medical Products, LLC, as borrowers. BMO Harris Bank N.A., as administrative agent, the lenders party thereto and PNC Bank, National Association as syndication agent is incorporated by reference to Exhibit 10.1 to the Quarterly Report on Form 10-Q for the fiscal quarter ended June 30, 2013. |
|
(10)(w) |
First Amendment to Amended and Restated Credit Agreement, dated as of June 30, 2014, among Landauer, Inc., Global Physics Solutions, Inc. and IZI Medical Products, LLC, as borrowers, BMO Harris Bank N.A., as administrative agent, and the lenders party thereto is incorporated by reference to Exhibit 10.1 to the Quarterly Report on Form 10-Q for the fiscal quarter ended June 30, 2014. |
|
(10)(x) |
Consent and Amendment to the Amended and Restated Credit Agreement, dated as of December 18, 2014, among Landauer, Inc. Global Physics Solutions, Inc. and IZI Medical Products, LLC, as borrowers, BMO Harris Bank N.A., as administrative agent, and the lenders party thereto is incorporated by reference to Exhibit (10)(s) to the Annual Report on Form 10-K for the fiscal year ended September 30, 2014. |
|
(10)(y) |
Second Consent and Amendment to the Amended and Restated Credit Agreement, dated as of January 28, 2015, among Landauer, Inc. Global Physics Solutions, Inc. and IZI Medical Products, LLC, as borrowers, BMO Harris Bank N.A., as administrative agent, and the lenders party thereto is incorporated by reference to Exhibit (10)(t) to the Annual Report on Form 10-K for the fiscal year ended September 30, 2014. |
|
(16) |
Letter from PricewaterhouseCoopers LLP addressed to the U.S. Securities and Exchange Commission, dated June 1, 2015, is incorporated by reference to Exhibit 16.1 to the Current Report on Form 8-K dated May 28, 2015. |
|
(21) |
Subsidiaries of the Registrant. |
|
(23)(a) |
Consent of BDO USA, LLP. |
|
(23)(b) |
Consent of PricewaterhouseCoopers LLP. |
|
(31.1) |
Certification of Michael P. Kaminski, President and Chief Executive Officer, as adopted pursuant to Section 302 of the Sarbanes-Oxley Act of 2002. |
|
(31.2) |
Certification of Daniel J. Fujii, Chief Financial Officer, as adopted pursuant to Section 302 of the Sarbanes-Oxley Act of 2002. |
|
(32.1) |
Certification of Michael P. Kaminski, President and Chief Executive Officer, pursuant to 18 U.S.C. Section 1350, as adopted pursuant to Section 906 of the Sarbanes-Oxley Act of 2002. |
|
(32.2) |
Certification of Daniel J. Fujii, Chief Financial Officer, pursuant to 18 U.S.C. Section 1350, as adopted pursuant to Section 906 of the Sarbanes-Oxley Act of 2002. |
|
(101) |
The following financial information from our Annual Report on Form 10-K for the year ended September 30, 2015, filed with the Securities and Exchange commission on December 14, 2015, is formatted in Extensible Business Reporting Language (“XBRL”): (i) Consolidated Balance Sheets; (ii) Consolidated Statements of Operations; (iii) Consolidated Statements of Comprehensive Income (Loss); (iv) Consolidated Statements of Stockholders’ Equity; (v) Consolidated Statements of Cash Flows; and (vi) Notes to Consolidated Financial Statements. |
|
|
|
|
Exhibits 10(a) through 10(u) listed above are management contracts and compensatory plans or arrangement. |
|
Click here to enter text.
87
Pursuant to the requirements of Section 13 or 15(d) of the Securities Exchange Act of 1934, the registrant has duly caused this report to be signed on its behalf by the undersigned, thereunto duly authorized.
|
|
|
LANDAUER, INC. |
|
|
|
|
|
|
|
|
|
/s/ Daniel J. Fujii |
December 14, 2015 |
|
|
|
Daniel J. Fujii |
|
|
Chief Financial Officer (Principal Financial Officer) |
Pursuant to the requirements of the Securities Exchange Act of 1934, this report has been signed below by the following persons on behalf of the registrant and in the capacities and on the dates indicated.
|
Signature |
Title |
Date |
|
|
|
|
|
/s/ Michael P. Kaminski |
President, Chief Executive Officer and Director |
December 14, 2015 |
|
Michael P. Kaminski |
(Principal Executive Officer) |
|
|
|
|
|
|
/s/ Daniel J. Fujii |
Vice President, Chief Financial Officer and Secretary |
December 14, 2015 |
|
Daniel J. Fujii |
(Principal Financial Officer) |
|
|
|
|
|
|
/s/ Kara B. Venegas |
Vice President, Corporate Controller |
December 14, 2015 |
|
Kara B. Venegas |
(Principal Accounting Officer) |
|
|
|
|
|
|
/s/ Jeffrey A. Bailey |
Director |
December 14, 2015 |
|
Jeffrey A. Bailey |
|
|
|
|
|
|
|
/s/ Robert J. Cronin |
Director |
December 14, 2015 |
|
Robert J. Cronin |
(Lead Director of the Board) |
|
|
|
|
|
|
/s/ William G. Dempsey |
Director |
December 14, 2015 |
|
William G. Dempsey |
|
|
|
|
|
|
|
/s/ Michael T. Leatherman |
Director |
December 14, 2015 |
|
Michael T. Leatherman |
(Executive Chairman of the Board) |
|
|
|
|
|
|
/s/ David E. Meador |
Director |
December 14, 2015 |
|
David E. Meador |
|
|
|
|
|
|
|
/s/ Stephen C. Mitchell |
Director |
December 14, 2015 |
|
Stephen C. Mitchell |
|
|
|
|
|
|
|
/s/ Thomas M. White |
Director |
December 14, 2015 |
|
Thomas M. White |
|
|
88