Attached files
| file | filename |
|---|---|
| 8-K - 8-K - KAPSTONE PAPER & PACKAGING CORP | a16-16405_18k.htm |
Exhibit 99.1
Opportunities Unique System Optimization & Growth with Victory August 2016 Randy Nebel President-Mill Division Andrea Tarbox Vice President and CFO

Forward-Looking Statements Forward-looking Statements The information in this presentation and statements made during this presentation may contain certain forward-looking statements within the meaning of federal securities laws. These statements reflect management’s expectations regarding future events and operating performance. Risk Factors These forward-looking statements involve a number of risks and uncertainties. A list of the factors that could cause actual results to differ materially from those expressed in, or underlying, any forward-looking statements can be found in the Company’s filings with the Securities and Exchange Commission, such as its annual and quarterly reports. The Company disclaims any obligation to revise or update such statements to reflect the occurrence of events after the date of this presentation. Non-GAAP Financial Measures This presentation refers to non-U.S. GAAP financial information. A reconciliation of non-U.S. GAAP to U.S. GAAP financial measures is available on the company’s website at KapStonepaper.com under Investors. 2
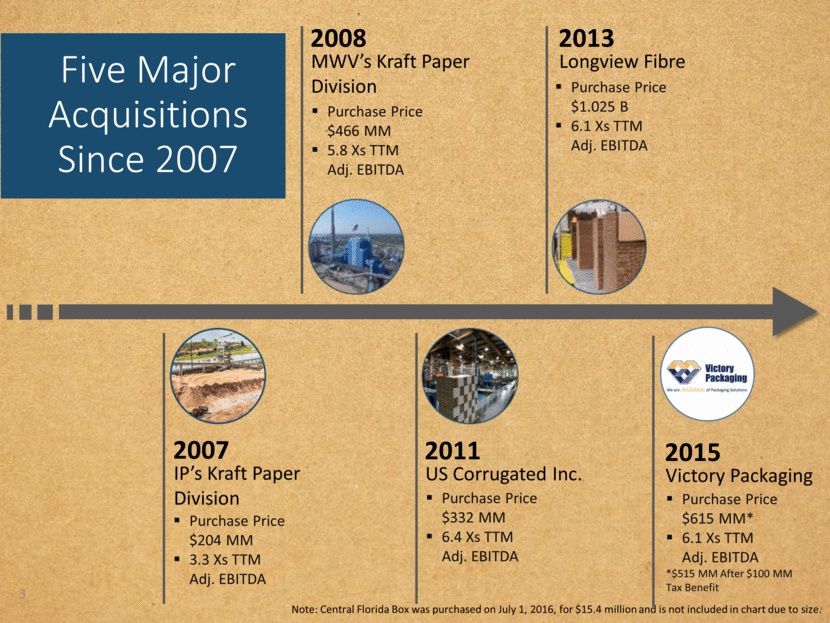
2007 IP’s Kraft Paper Division 2008 MWV’s Kraft Paper Division Purchase Price $204 MM 3.3 Xs TTM Adj. EBITDA 2011 US Corrugated Inc. 2013 Longview Fibre 2015 Victory Packaging Purchase Price $466 MM 5.8 Xs TTM Adj. EBITDA Purchase Price $332 MM 6.4 Xs TTM Adj. EBITDA Purchase Price $1.025 B 6.1 Xs TTM Adj. EBITDA Purchase Price $615 MM* 6.1 Xs TTM Adj. EBITDA *$515 MM After $100 MM Tax Benefit Note: Central Florida Box was purchased on July 1, 2016, for $15.4 million and is not included in chart due to size. Five Major Acquisitions Since 2007 3
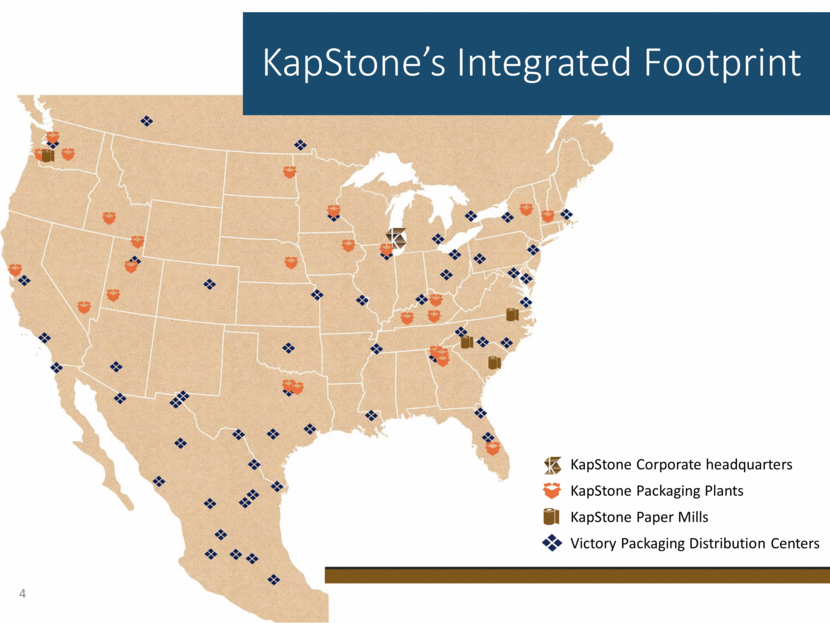
KapStone’s Integrated Footprint KapStone Corporate headquarters KapStone Packaging Plants KapStone Paper Mills Victory Packaging Distribution Centers 4
Containerboard 5th largest producer in North America Leader in development of Ultra Performance grades Full product family includes recycled, high compression and kraft liner and medium Unbleached Kraft Paper Largest producer in North America Extensible, multiwall, bag, converting and industrial grades Specialty DURASORB® and Kraftpak® Leader in niche markets in decorative laminates and specialty folding carton packaging Containerboard Specialty & Kraft Overview of Mills 2015 External Sales (Tons) Location Capacity (Tons) Products Charleston, SC 975,000 UPL, Containerboard, Specialties Roanoke Rapids, NC 460,000 UPL, Containerboard, Kraft Paper Cowpens, SC 255,000 Recycled Linerboard, Recycled Medium Longview, WA 1,300,000 UPL, Containerboard, Kraft Paper, Specialties Total 2,990,000 5 63% 37%
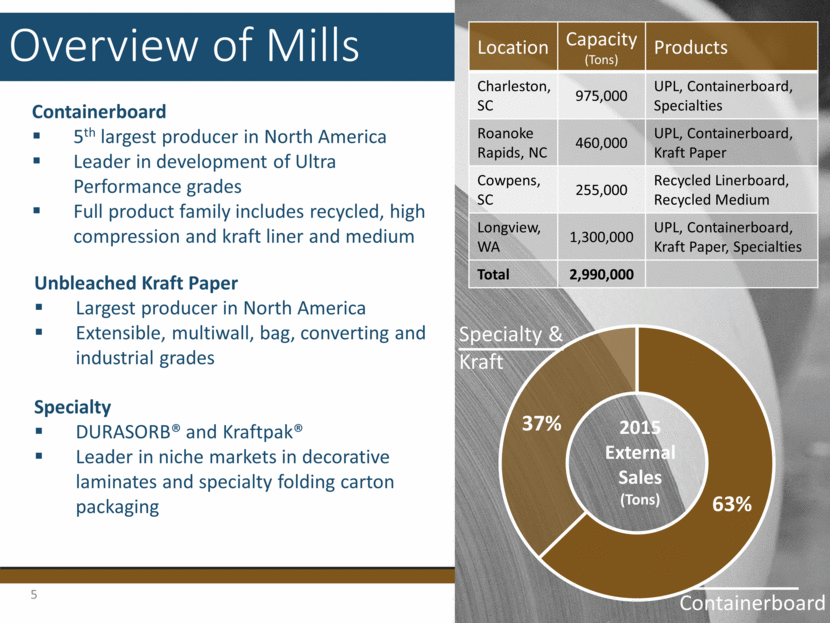
Overview of Converting Nation-wide footprint of 22 corrugated converting facilities Purchases over 50% of KapStone mill’s containerboard production Fully-dedicated customer service and technical teams Full product capabilities including industrial and multi-color retail packaging in multiple flute and paper combinations from mini boxes to jumbo bulk bins Consultative approach to packaging design 6
Victory Packaging Facilities: 65 distribution locations across North America Offerings: We are Architects of Packaging Solutions. We provide everything about the delivery, design, fulfillment, inventory, kitting, ordering, payment, receiving, storage and use of packaging. Packaging Solutions Engineering and Design Fulfillment Logistics Equipment and Automation Sources approximately 1/3 of its corrugated boxes from KapStone’s converting facilities 7
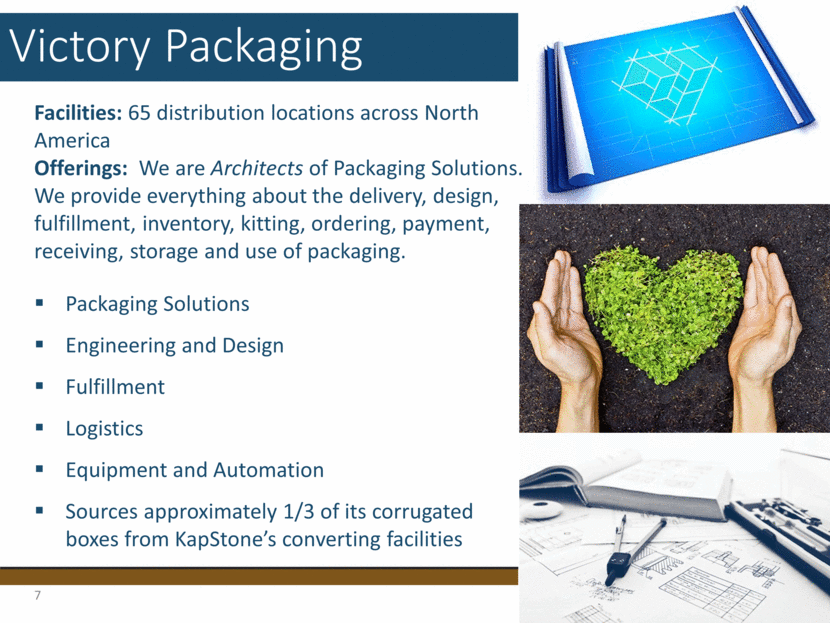
Strong Growth Record *Adjusted to exclude alternative fuel mixture credits, non-cash stock compensation, acquisition, strike costs, start up and other costs, and dunnage bag business sold in March 2009 8 FY Net Sales CAGR of 37% FY Adj. EBITDA* CAGR of 30% $224 $492 $626 $782 $906 $1,217 $1,748 $2,301 $2,789 2007 2008 2009 2010 2011 2012 2013 2014 2015 $s in Millions $50 $78 $27 $95 $165 $183 $333 $456 $404 2007 2008 2009 2010 2011 2012 2013 2014 2015 $s in Millions
Disciplined Capital Allocation Source & Use of Funds Since Inception (Inception – June 30, 2016) Use Source Generated ~$1.74 billion of cash from operations since inception Voluntary debt prepayments since Victory acquisition in June 2015 total $104 million Returned $153 million to shareholders with dividends Invested over $600 million in CAPEX for our operations At June 30, 2016: Net debt was $1.54 billion Bank net debt to EBITDA was 3.6 times Average weighted interest rate was 2.1% Available revolver of $467 million Maintain ability to grow No bank maturities until 4Q17 9 $120 $102 $2,961 $1,674 $1,386 $2,665 $153 $645 $8 $ in Millions
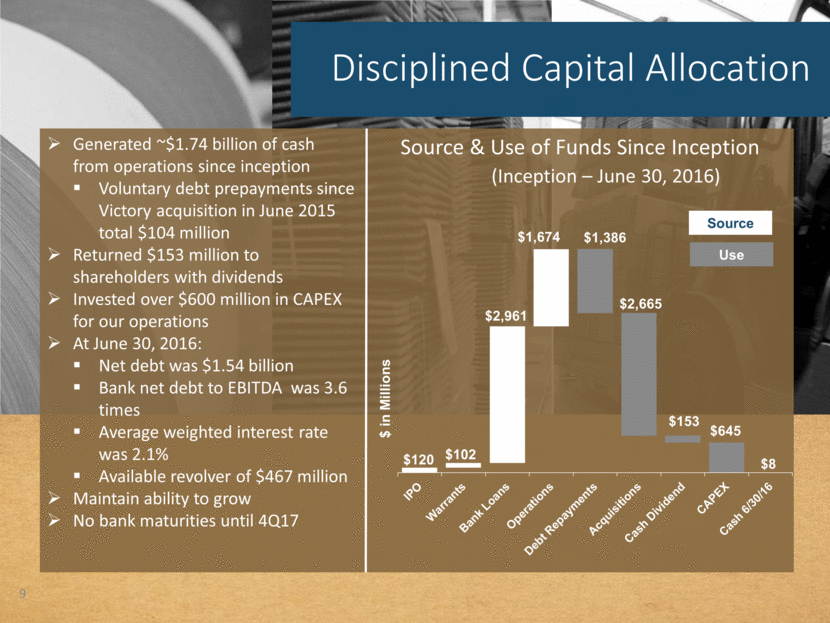
Operations Overview Mill Production Mill/Corrugated Sales Avg. Mill Revenue/Ton Thousands of Tons Thousands of Tons After setting daily production records in Q1 2016, production was lower in Q2 2016 mainly due to a 36 hour electrical service outage at Longview and higher lost tons due to a planned maintenance outage at Roanoke Rapids Year-over-year price erosion of $43 per ton resulted in a $20 million decline in revenue in Q2 2016 10 685 690 668 Q2 2015 Q1 2016 Q2 2016 710 692 704 Q2 2015 Q1 2016 Q2 2016 $667 $625 $624 Q2 2015 Q1 2016 Q2 2016
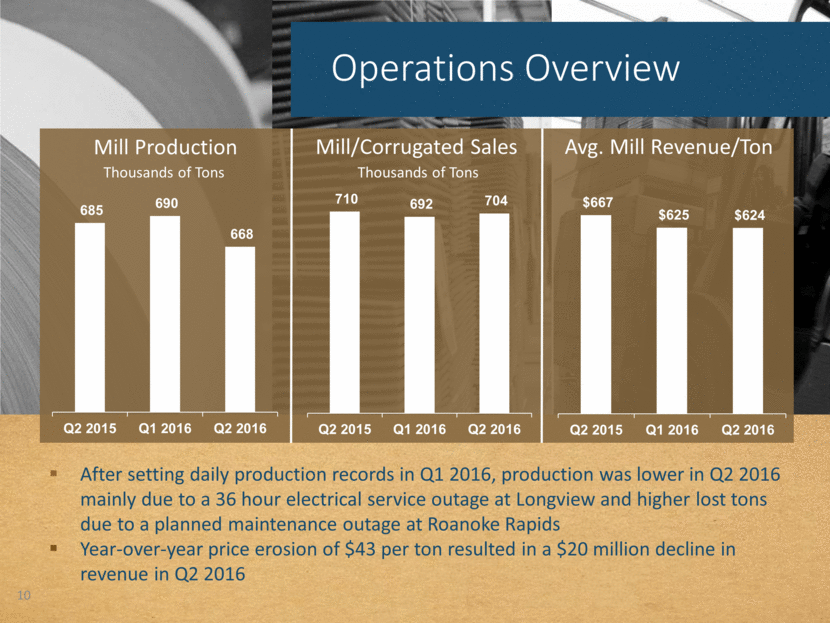
Continued Progress in Lowering Mill Costs Mill Headcount Fiber Costs Energy Costs In early 2014, we identified substantial cost savings opportunities and developed plans to achieve goals Making progress due to process improvements and benefits of capital spending Energy costs included $3 per ton in Q2 2016 and $1.50 per ton in Q2 2015 related to planned outages Further incremental benefits expected in future 11 Per Ton Per Ton 2,407 2,354 2,265 Q2 2015 Q1 2016 Q2 2016 $176.06 $176.25 $170.12 Q2 2015 Q1 2016 Q2 2016 $42.18 $43.75 $41.54 Q2 2015 Q1 2016 Q2 2016
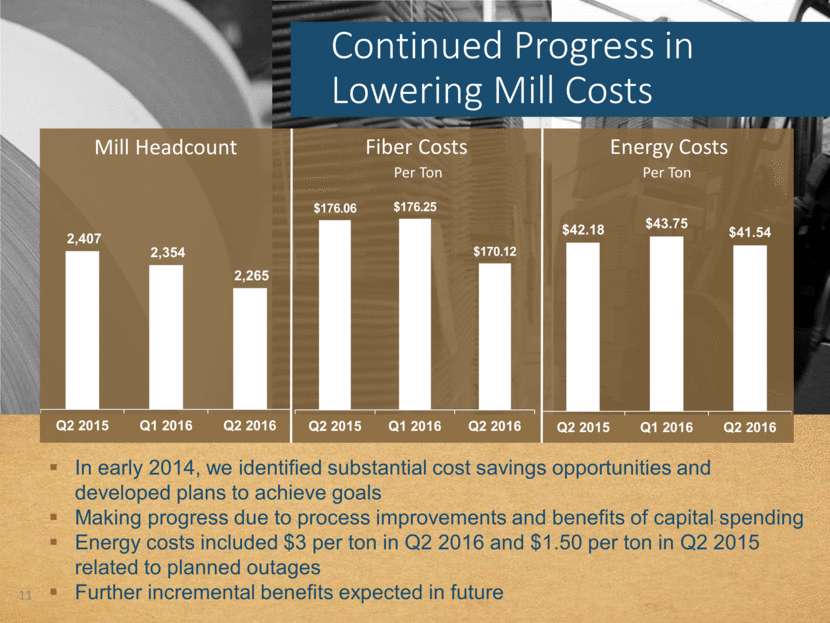
Opportunities & Priorities for 2016 Enhance cash flow generation 6 months YTD free cash flow was $17 million higher than same period 2015 Closer scrutinization of expenses and CAPEX plans Leverage historical CAPEX investments Repay debt and strengthen balance sheet Full year of Victory Packaging Provides unique system optimization and growth opportunity Significant catalyst in reducing exposure to export markets $30 million synergy run rate to realized by mid-2016 Invest to reduce operational volatility Increase consumption of mill production Reduce exposure to markets with weak pricing/demand trends Regain and maintain operating excellence Continue cost reduction programs such as headcount actions taken at end of Q1 (125 less positions lowering annualized costs by $9 million) Complete projects such as Roanoke Rapids and Charleston chip yards Third party provides equipment upgrades for these projects resulting in no significant capital outlay for KapStone 2017 EBITDA benefit of approximately $10 million per year 12
13 Appendix
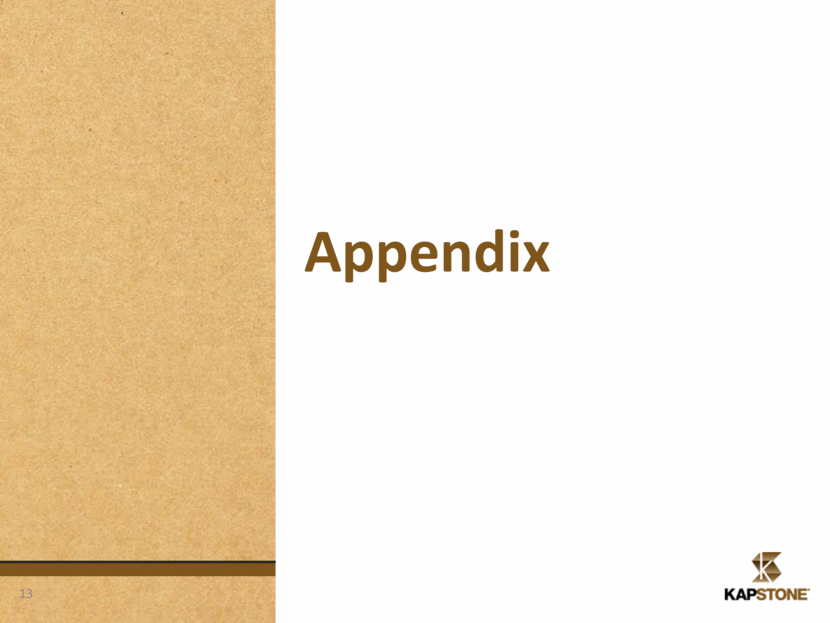
Quarterly Key Performance Indicators 14 Sales and Production Paper and Packaging Product Mix (000 Tons) Containerboard includes all domestic and export sales of linerboard and medium Specialty paper includes Kraftpak, Durasorb, Kraft paper and roll pulp Avg Mill Revenue per Ton Tons Produced (000) Mill External Shipments (000) Containerboard and Corrugated Products1 Specialty Paper2 Internal Consumption $624 $625 $667 2Q 16 1Q 16 2Q 15 668 690 685 2Q 16 1Q 16 2Q 15 480 482 492 2Q 16 1Q 16 2Q 15 449 434 443 257 258 267 189 184 190 2Q 16 1Q 16 2Q 15 2Q 16 1Q 16 2Q 15 2Q 16 1Q 16 2Q 15
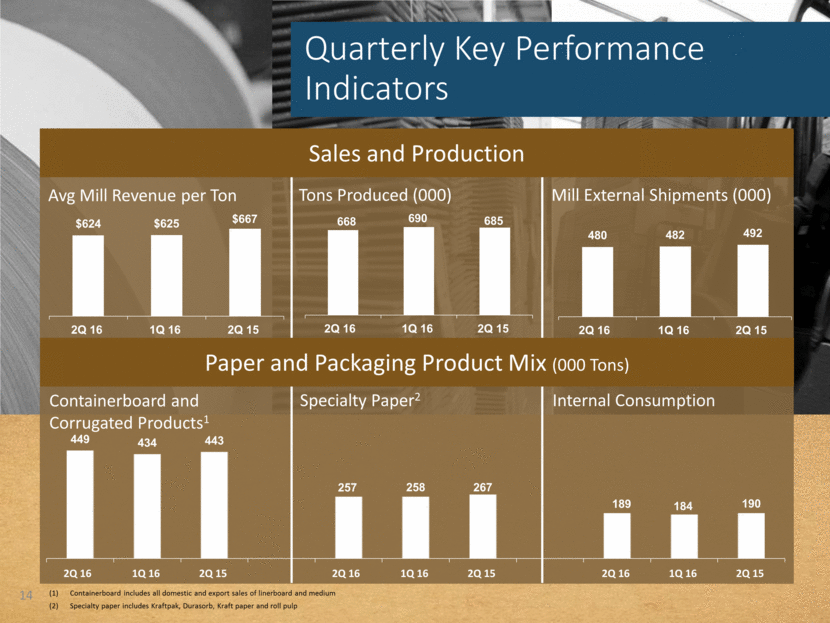
2015 Key Performance Indicators 15 Sales and Production Paper and Packaging Product Mix (000 Tons) Containerboard includes all domestic and export sales of linerboard and medium Specialty paper includes Kraftpak, Durasorb, Kraft paper and roll pulp Containerboard and Corrugated Products1 Specialty Paper2 Internal Consumption Avg Mill Revenue per Ton Tons Produced (000) Mill External Shipments (000) $667 $684 $669 2015 2014 2013 2,679 2,715 2,080 2015 2014 2013 1,857 1,936 2,005 2015 2014 2013 1,686 1,765 1,404 1,021 1,031 799 784 675 563 2015 2014 2013 2015 2014 2013 2015 2014 2013
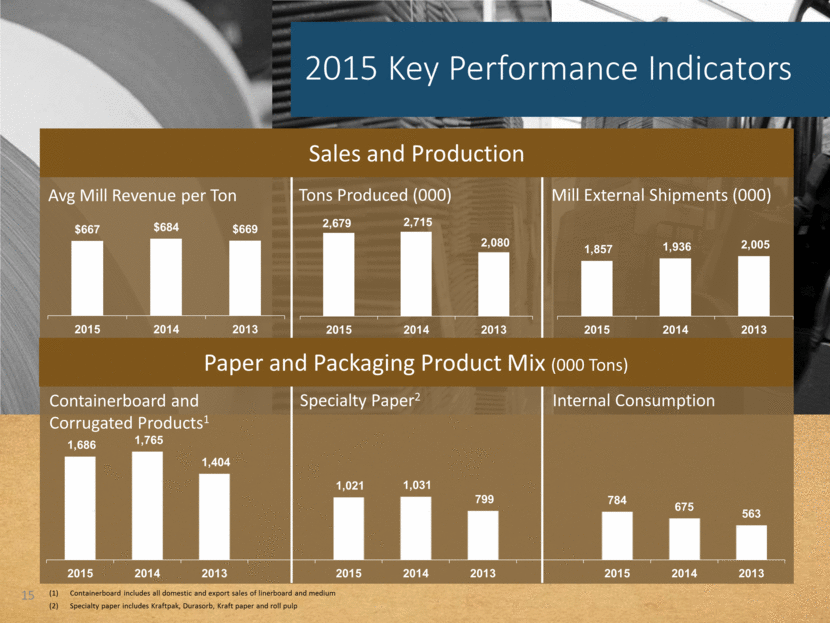
Market Summary Continues to be challenging Containerboard: Domestic markets exhibiting good demand and pricing stability Export markets showing solid demand with static pricing Kraft paper Domestic kraft paper improving demand with stable pricing Export kraft paper stable volume with modestly improving pricing Specialty paper Durasorb and Kraftpak stable demand and pricing Corrugated products July demand consistent with Q2 Stable pricing 16
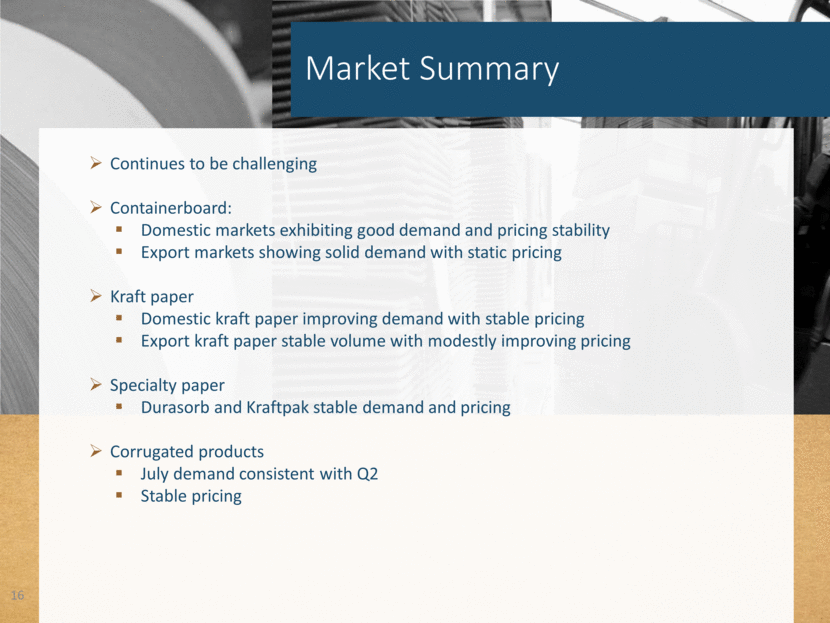
Summary of Key Assumptions for Q3 2016 CFB acquisition effective July 1, 2016 Planned outage maintenance expense approximately $13 million lower than Q2 2016. Loss of 6,100 production tons, approximately 6,800 tons less than Q2 2016 Average fiber costs trending down Q3 2016 fiber costs should be approximately $2 million lower than Q2 OCC costs expected to increase Benefit of headcount reduction of approximately $2 million per quarter CAPEX is expected to be $30 million for Q3 2016, and $125 million for the full year Effective income tax rate of 35 percent 17
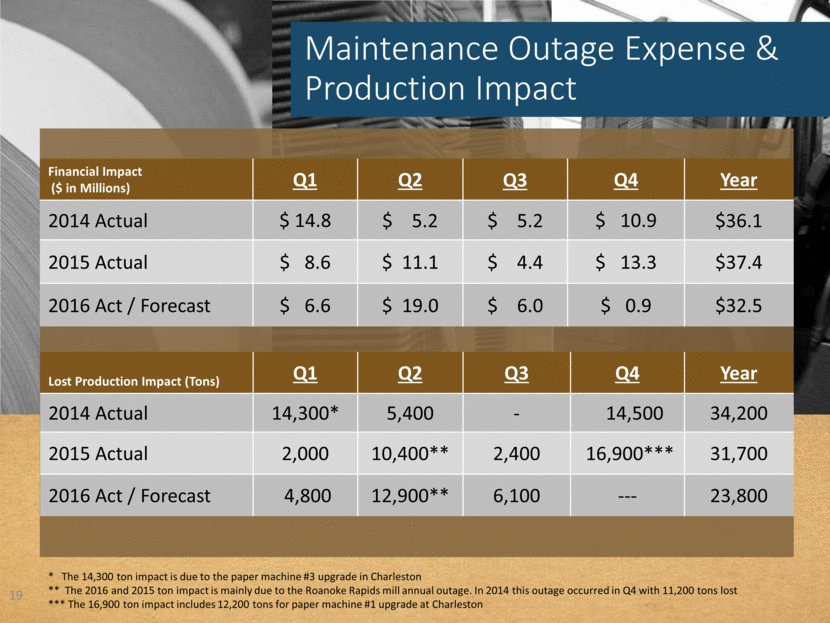
Summary of Key Assumptions for 2016 Full year of Victory Packaging results Price changes: Full year of West coast medium and linerboard reductions of $20 and $10 per ton, respectively (reductions took effect on August 1 and October 1) January 2016 index reductions of $15 per ton for LB and $20 for CM will have annualized impact of approximately $11 million Production and shipping One additional production day due to leap year Planned maintenance outage expense of $32 million, $5 million less than prior year with 7,900 tons less lost production Fiber costs are trending down from year end 2015 Lower pension income (about $7 million) CAPEX is expected to be $125 million for the full year Depreciation and amortization will approximate $190 million annually Annual amortization of purchase accounting intangibles ~ $36 million Effective income tax rate of 35 percent. Cash tax rate for 2016 ~26 percent 18
Maintenance Outage Expense & Production Impact 19 Financial Impact ($ in Millions) Q1 Q2 Q3 Q4 Year 2014 Actual $ 14.8 $ 5.2 $ 5.2 $ 10.9 $36.1 2015 Actual $ 8.6 $ 11.1 $ 4.4 $ 13.3 $37.4 2016 Act / Forecast $ 6.6 $ 19.0 $ 6.0 $ 0.9 $32.5 Lost Production Impact (Tons) Q1 Q2 Q3 Q4 Year 2014 Actual 14,300* 5,400 - 14,500 34,200 2015 Actual 2,000 10,400** 2,400 16,900*** 31,700 2016 Act / Forecast 4,800 12,900** 6,100 --- 23,800 * The 14,300 ton impact is due to the paper machine #3 upgrade in Charleston ** The 2016 and 2015 ton impact is mainly due to the Roanoke Rapids mill annual outage. In 2014 this outage occurred in Q4 with 11,200 tons lost *** The 16,900 ton impact includes 12,200 tons for paper machine #1 upgrade at Charleston
