Attached files
| file | filename |
|---|---|
| 8-K - THE BANCORP, INC. FORM 8-K - Bancorp, Inc. | bancorp8k.htm |
| EX-99.2 - EXHIBIT 99.2 - Bancorp, Inc. | ex99-2.htm |
| EX-10.3 - EXHIBIT 10.3 - Bancorp, Inc. | ex10-3.htm |
| EX-10.2 - EXHIBIT 10.2 - Bancorp, Inc. | ex10-2.htm |
| EX-10.1 - EXHIBIT 10.1 - Bancorp, Inc. | ex10-1.htm |
| EX-3.1 - EXHIBIT 3.1 - Bancorp, Inc. | ex3-1.htm |
Exhibit 99.1

Investor presentation Fourth Quarter, 2015

Safe Harbor Statement under the Private Securities Litigation Reform Act of 1995:Statements in this presentation regarding The Bancorp, Inc.’s business that are not historical facts are “forward-looking statements” that involve risks and uncertainties. These statements may be identified by the use of forward-looking terminology, including the words “may,” “believe,” “will,” “expect,” “anticipate,” “estimate,” “intend,” “plan," or similar words. These forward-looking statements are based upon the current beliefs and expectations of The Bancorp, Inc.’s management and are inherently subject to significant business, economic, regulatory, and competitive uncertainties and contingencies, many of which are difficult to predict and beyond our control. For further discussion of these risks and uncertainties, see the “risk factors” sections of The Bancorp, Inc.’s Annual Report on Form 10-K for the year ended December 31, 2015, and other of its public filings with the SEC. In addition, these forward-looking statements are subject to assumptions with respect to future strategies and decisions that are subject to change. Actual results may differ materially from the anticipated results discussed in these forward-looking statements. The forward-looking statements speak only as of the date of this presentation. The Bancorp, Inc. does not undertake to publicly revise or update forward-looking statements in this presentation to reflect events or circumstances that arise after the date of this presentation, except as may be required under applicable law. Forward looking statements 2
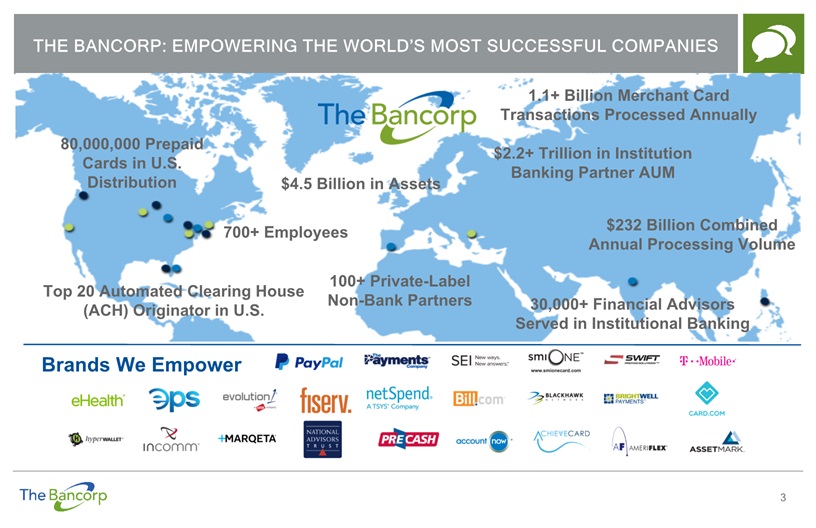
The Bancorp: Empowering the World’s Most Successful Companies 3 $4.5 Billion in Assets 700+ Employees 80,000,000 Prepaid Cards in U.S. Distribution 1.1+ Billion Merchant Card Transactions Processed Annually $2.2+ Trillion in Institution Banking Partner AUM $232 Billion Combined Annual Processing Volume 100+ Private-Label Non-Bank Partners 30,000+ Financial Advisors Served in Institutional Banking Top 20 Automated Clearing House (ACH) Originator in U.S. Brands We Empower
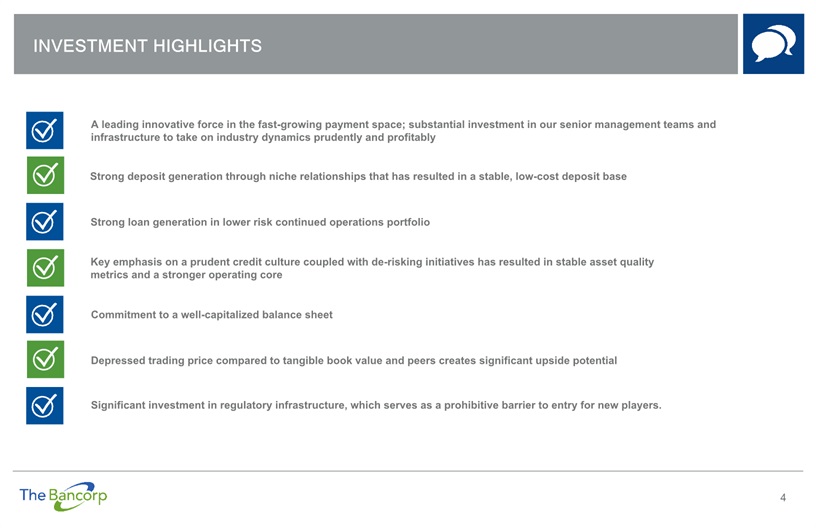
Investment Highlights 4 Depressed trading price compared to tangible book value and peers creates significant upside potential A leading innovative force in the fast-growing payment space; substantial investment in our senior management teams and infrastructure to take on industry dynamics prudently and profitably Strong deposit generation through niche relationships that has resulted in a stable, low-cost deposit base Strong loan generation in lower risk continued operations portfolio Key emphasis on a prudent credit culture coupled with de-risking initiatives has resulted in stable asset quality metrics and a stronger operating core Commitment to a well-capitalized balance sheet Significant investment in regulatory infrastructure, which serves as a prohibitive barrier to entry for new players.

Our Business model REFLECTS a distinct business strategY... 5 Specialty Finance Payments Securities Portfolio Primarily highly rated government obligations & corporate securitiesInterest Income Government Guaranteed Lending (GGL)Includes loans to franchisees; many of which have a 75% guaranty by the U.S. governmentInterest Income Commercial Mortgage-Backed Securities (CMBS)Commercial Loan SalesNon-Interest IncomeInterest Income LeasingAutomobile Fleet LeasingInterest IncomeNon-Interest Income Prepaid CardsOpen Loop Prepaid CardsDepositsNon-Interest Income Payment AcceptanceCredit, Debit Card, and ACH ProcessingDepositsNon-Interest Income Institutional BankingDeposits and Loans for Clients of Wealth FirmsInterest IncomeDepositsNon-Interest Income REVENUE (1) Corporate For reconciliation detail, please see Appendix, page 24. Payments: 67% Specialty Finance: 33%
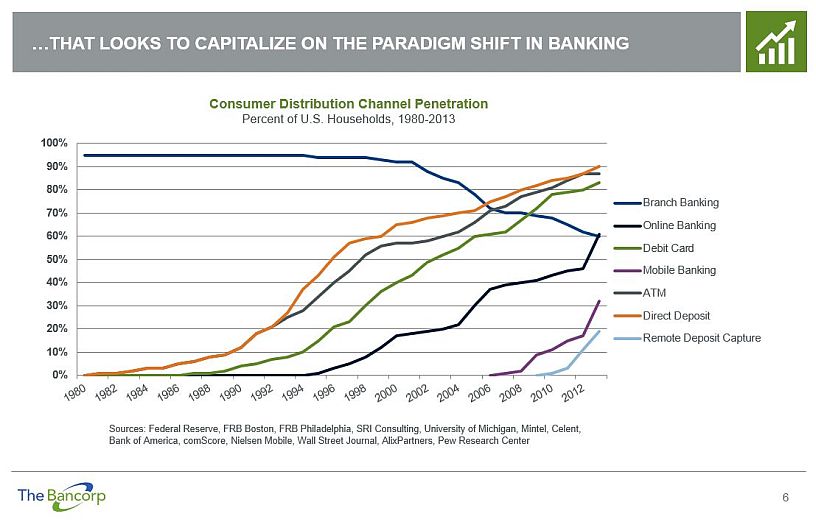
…That LOOKS TO CAPITALIZE ON THE paradigm shift in banking 6 Consumer Distribution Channel PenetrationPercent of U.S. Households, 1980-2013 Sources: Federal Reserve, FRB Boston, FRB Philadelphia, SRI Consulting, University of Michigan, Mintel, Celent, Bank of America, comScore, Nielsen Mobile, Wall Street Journal, AlixPartners, Pew Research Center
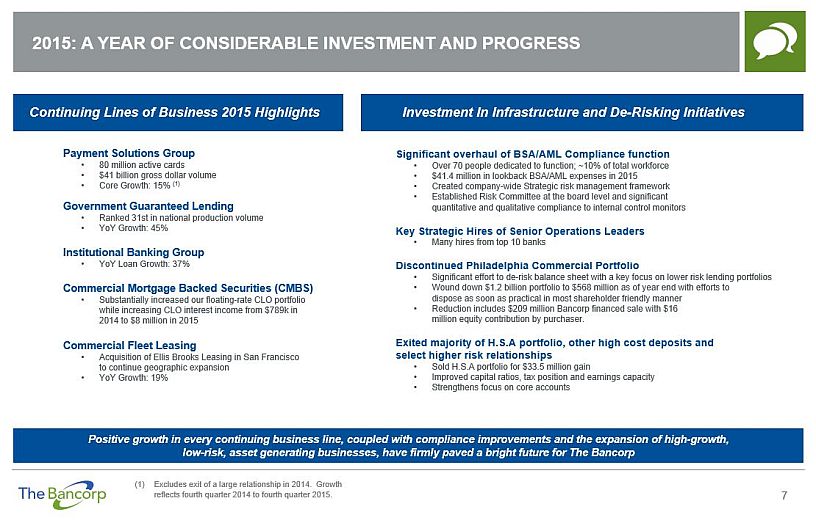
2015: A year of Considerable investment and progress 7 Significant overhaul of BSA/AML Compliance functionOver 70 people dedicated to function; ~10% of total workforce$41.4 million in lookback BSA/AML expenses in 2015Created company-wide Strategic risk management frameworkEstablished Risk Committee at the board level and significant quantitative and qualitative compliance to internal control monitorsKey Strategic Hires of Senior Operations LeadersMany hires from top 10 banksDiscontinued Philadelphia Commercial PortfolioSignificant effort to de-risk balance sheet with a key focus on lower risk lending portfoliosWound down $1.2 billion portfolio to $568 million as of year end with efforts to dispose as soon as practical in most shareholder friendly mannerReduction includes $209 million Bancorp financed sale with $16 million equity contribution by purchaser. Exited majority of H.S.A portfolio, other high cost deposits and select higher risk relationshipsSold H.S.A portfolio for $33.5 million gainImproved capital ratios, tax position and earnings capacityStrengthens focus on core accounts Excludes exit of a large relationship in 2014. Growth reflects fourth quarter 2014 to fourth quarter 2015. Payment Solutions Group80 million active cards$41 billion gross dollar volumeCore Growth: 15% (1)Government Guaranteed LendingRanked 31st in national production volumeYoY Growth: 45%Institutional Banking GroupYoY Loan Growth: 37%Commercial Mortgage Backed Securities (CMBS)Substantially increased our floating-rate CLO portfolio while increasing CLO interest income from $789k in 2014 to $8 million in 2015Commercial Fleet LeasingAcquisition of Ellis Brooks Leasing in San Francisco to continue geographic expansionYoY Growth: 19% Positive growth in every continuing business line, coupled with compliance improvements and the expansion of high-growth, low-risk, asset generating businesses, have firmly paved a bright future for The Bancorp Continuing Lines of Business 2015 Highlights Investment In Infrastructure and De-Risking Initiatives
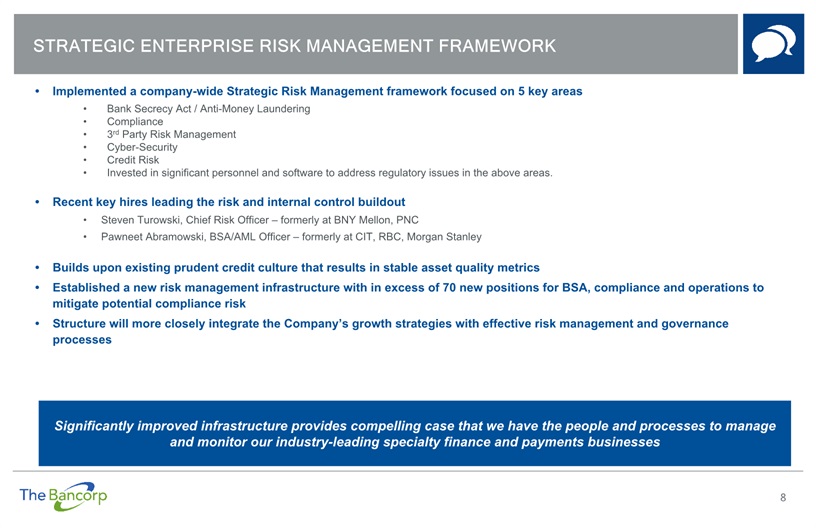
Strategic enterprise risk management framework 8 Implemented a company-wide Strategic Risk Management framework focused on 5 key areas Bank Secrecy Act / Anti-Money Laundering Compliance 3rd Party Risk Management Cyber-Security Credit Risk Invested in significant personnel and software to address regulatory issues in the above areas.Recent key hires leading the risk and internal control buildoutSteven Turowski, Chief Risk Officer – formerly at BNY Mellon, PNCPawneet Abramowski, BSA/AML Officer – formerly at CIT, RBC, Morgan StanleyBuilds upon existing prudent credit culture that results in stable asset quality metricsEstablished a new risk management infrastructure with in excess of 70 new positions for BSA, compliance and operations to mitigate potential compliance riskStructure will more closely integrate the Company’s growth strategies with effective risk management and governance processes Significantly improved infrastructure provides compelling case that we have the people and processes to manage and monitor our industry-leading specialty finance and payments businesses

9 Executive Management Team Daniel Cohen – Executive Vice President and Chairman of the Board[Currently President of Cohen and Company; Chief Executive Officer of FinTech Acquisition Corp] John Chrystal – Interim Chief Executive Officer[Current Board of Directors member; prior experience at DiMaio Ahmad Capital, Credit Suisse] Peter Chiccino – Executive Vice President and Chief Information Officer[Served on Executive Leadership team of The Bancorp since its inception] Paul Frenkiel – Executive Vice President of Strategy, Chief Financial Officer and Secretary[Prior experience at Republic First Bancorp, First Bank Delaware, and JeffBanks] Jeremy Kuiper – Senior Vice President and Managing Director (Payment Solutions)[Prior experience at BankFirst, United Credit National Bank] Donald McGraw Jr. – Executive Vice President and Chief Credit Officer[Prior experience at Jefferson Bank, FDIC] Scott Megargee – Executive Vice President, Commercial Fleet Leasing[Prior experience at Jefferson Bank, Cheltenham Bank] Thomas Pareigat – Senior Vice President and General Counsel[Prior experience at Lindquist & Vennum PLLP, Marshall BankFirst Corp.] Steven Turowski – Executive Vice President and Chief Risk Officer[Prior experience at BNY Mellon, PNC Global Investment Servicing] Pawneet Abramowski – BSA/AML Officer[Prior experience at CIT, RBC, Morgan Stanley] 2015 marked a year of several senior level OPERATIONS hires to Compliment OUR STRONG business GROUP leaders

CATEGORY Q4 2015 BALANCE Q4 2014 BALANCE YoY ’14-’15 Growth Q4 2015 AVG. YIELD(1) (in thousands) Corporate Investment Securities $1,163,688 1,587,404 (26.7%) 2.60% Specialty Finance Institutional Banking 575,948 421,862 36.5% 2.70% CMBS & CLO 380,764 178,376 113.5% 5.40% Government Guaranteed Lending 307,140 211,364 45.3% 4.72% Leasing 231,514 194,464 19.1% 6.30% Other 71,495 84,793 (15.7%) 2.87% Total Specialty Finance $1,566,861 $1,090,859 43.6% 10 AS WITH FUNDING, THE BANCORP EMPLOYS A MULTI-CHANNEL GROWTH STRATEGY FOR ASSET ORIGINATION. Primary asset-generating strategies: business line overview Investment Securities High credit quality tax exempt municipal obligationsU.S. Government agency securities and other highly rated mortgage-backed securitiesCorporate securities which, like other purchases, are validated and monitored by independent credit advisory specialistsInstitutional Banking15 affinity groups, managing & administering $2.2+ trillion in assetsSEI Investments, Legg Mason, AssetMark Trust Company, Franklin TempletonGenerates security backed lines of credit and other loansBancorp offers loan and deposit products to certain of these segmentsCMBS & CLOLoans which are generated for sale into CMBS markets that are held until soldGovernment Guaranteed LendingLoans from $150,000 to $5.0 million including loans to franchisees such as UPS Stores, Massage Envy, FASTSIGNS and Save a Lot, many of which have a ~75% guaranty by the U.S. Small Business AdministrationNational lending in Financial Practice Acquisitions, Franchise and Healthcare-professionalsLeasingWell-collateralized automobile fleet leasingAverage transaction: 8-15 automobiles, $350,00031% of portfolio leased by local, state, and federal government agencies Growth in our core business lines has significantly contributed to our revenue streams while solidifying the Bank’s lower risk strategy

Overview of discontinued operations In an effort to free up capital and de-risk the Bank’s loan portfolio from larger, more outsized real estate credits, the Company decided to discontinue its Philadelphia-based commercial real estate operation in 2014 Company has made significant progress in “winding down” the portfolio through loan sales, a private securitization (“Walnut Street”) in a joint venture with a seasoned hedge fund, and other pay downsCompany is focused on disposing of remainder of discontinued portfolio as soon as practical with best execution mindsetA well-respected credit resolution expert, who has served on high-profile disposition cases, serves as an in-house consultant servicing the discontinued portfolio and Walnut Street Principal Balance - Discontinued Operations Overview ($Millions) $1.2B $367M $267M $611M $75M $536M *Credit marks and mon-performing loans are almost exclusively on the commercial credits. Loans are written down to lower cost or market value based on a third party valuation. CommercialBreakdown (Principal Balance) Credit Mark Breakdown* NPA Breakdown* Top 16 Commercial Relationships (Exceeding $10M Each) Remaining Relationships $536M $44M $43M8% Credit Mark Breakdown of Principal Commercial Balance Principal Balance Credit Mark as % of Portflio Non- Performing Top 16 Commercial Relationships (Exceeding $10M Each) $373 $29 7.8% $17 Remaining Relationships $163 $14 8.6% $27 $536 $43 8.0% $44

Lower risk securities portfolio 12 Total Portfolio: $1.2B as of 12/31/15 Securities Portfolio Overview Lower risk securities portfolio; primarily highly rated government obligations & corporate securities95% of portfolio rated [A] or better, no securities below investment gradePortfolio managed by highly experienced internal team and supported by third party solely dedicated to portfolio monitoringNo other-than-temporary impairment$94 M classified as Held-to-Maturity or 8% of total portfolio Three months ended 12/31/15Yield on investment securities-taxable: 2.07%
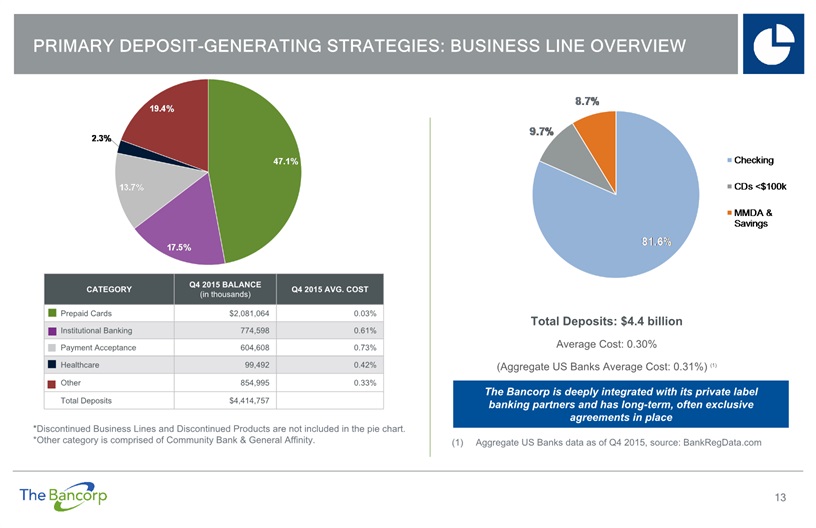
13 Primary deposit-generating strategies: business line overview Total Deposits: $4.4 billionAverage Cost: 0.30%(Aggregate US Banks Average Cost: 0.31%) (1)Aggregate US Banks data as of Q4 2015, source: BankRegData.com CATEGORY Q4 2015 BALANCE(in thousands) Q4 2015 AVG. COST Prepaid Cards $2,081,064 0.03% Institutional Banking 774,598 0.61% Payment Acceptance 604,608 0.73% Healthcare 99,492 0.42% Other 854,995 0.33% Total Deposits $4,414,757 *Discontinued Business Lines and Discontinued Products are not included in the pie chart.*Other category is comprised of Community Bank & General Affinity. The Bancorp is deeply integrated with its private label banking partners and has long-term, often exclusive agreements in place

Prepaid gross dollar volume (GDV)(1) and cardholder growth 14 Gross Dollar Volume (GDV) is the total amount spent on all cards outstanding within a given period. GDV is further broken out according to volume by contract year.Compound annual growth rate is calculated for the years 2010 through 2015. $ Gross Dollar Volume(dollars in thousands) $27,216,931 $6,285,271 $13,311,376 $41,023,873

Revenue composition 15 Post Provision Income (1) (dollars in thousands) $ For reconciliation detail, please see Appendix, (page 25).Compound annual growth rate is calculated for the years 2010 through 2015.Not including one-time gain on sale of HSA portfolio in Q4 2015 for $33.5M.

Non-interest income-generating strategies: growth and sustainability 16 39% Increase $ (dollars in thousands) $84,599 (2) Compound annual growth rate is calculated for the years 2010 through 2015.Excludes gains on sales of investment securities and gain on sale of heath savings portfolio. For reconciliation detail, please refer to the Non-Interest Income section of Post Provision Income Reconciliation, in the Appendix (page 25).

While interest rates are compressed, balance sheet initiatives by the bank are leading to increased net interest income 17 (dollars in thousands) Compound annual growth rate is calculated for the years 2010 through 2015. $

Strong asset quality metrics – continuing operations 18 Asset Quality Highlights Continuing operations portfolio has historically maintained industry-low nonperforming metricsAttributable to The Bancorp’s focus on niche lending segments which traditionally have low credit riskCommitted to maintaining focus on stable asset quality metrics going forward Nonperforming Asset and Loan Ratios Historical Nonperforming Assets ($000)

Investment Highlights 19 Depressed trading price compared to tangible book value and peers creates significant upside potential A leading innovative force in the fast-growing payment space; substantial investment in our senior management teams and infrastructure to take on industry dynamics prudently and profitably Strong deposit generation through niche relationships that has resulted in a stable, low-cost deposit base Strong loan generation in lower risk continued operations portfolio Key emphasis on a prudent credit culture coupled with de-risking initiatives has resulted in stable asset quality metrics and a stronger operating core Commitment to a well-capitalized balance sheet Significant investment in regulatory infrastructure, which serves as a prohibitive barrier to entry for new players.

20
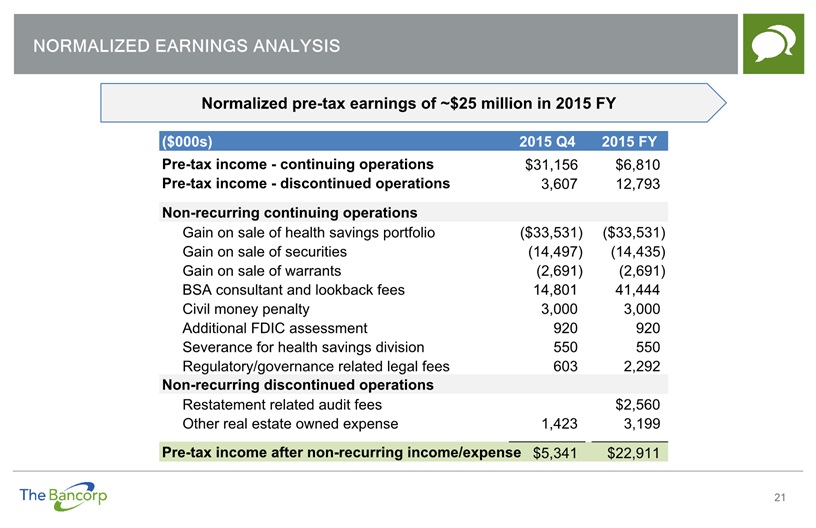
Normalized earnings analysis 21 Normalized pre-tax earnings of ~$25 million in 2015 FY ($000s) 2015 Q4 2015 FY Pre-tax income - continuing operations $31,156 $6,810 Pre-tax income - discontinued operations 3,607 12,793 Non-recurring continuing operations Gain on sale of health savings portfolio ($33,531) ($33,531) Gain on sale of securities (14,497) (14,435) Gain on sale of warrants (2,691) (2,691) BSA consultant and lookback fees 14,801 41,444 Civil money penalty 3,000 3,000 Additional FDIC assessment 920 920 Severance for health savings division 550 550 Regulatory/governance related legal fees 603 2,292 Non-recurring discontinued operations Restatement related audit fees $2,560 Other real estate owned expense 1,423 3,199 Pre-tax income after non-recurring income/expense $5,341 $22,911
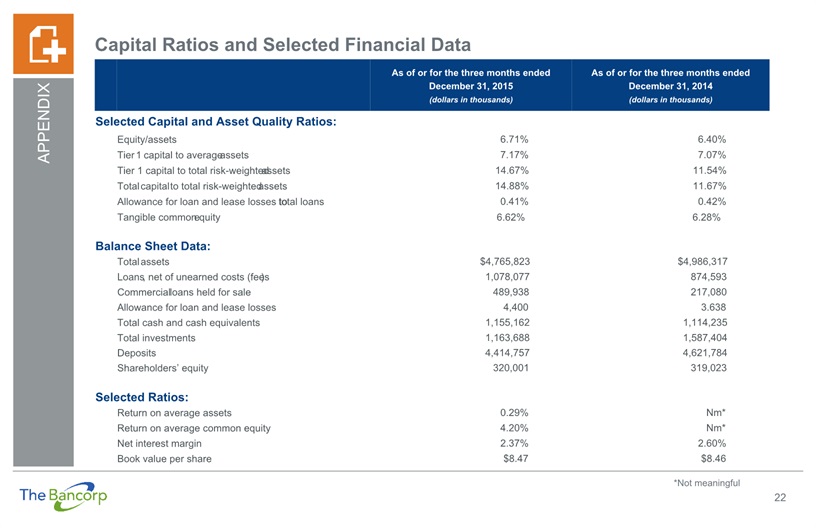
22 Capital Ratios and Selected Financial Data As of or for the three months endedDecember 31, 2015(dollars in thousands) As of or for the three months endedDecember 31, 2014(dollars in thousands) Selected Capital and Asset Quality Ratios: Equity/assets 6.71% 6.40% Tier 1 capital to average assets 7.17% 7.07% Tier 1 capital to total risk-weighted assets 14.67% 11.54% Total capital to total risk-weighted assets 14.88% 11.67% Allowance for loan and lease losses to total loans 0.41% 0.42% Tangible common equity 6.62% 6.28% Balance Sheet Data: Total assets $4,765,823 $4,986,317 Loans, net of unearned costs (fees) 1,078,077 874,593 Commercial loans held for sale 489,938 217,080 Allowance for loan and lease losses 4,400 3.638 Total cash and cash equivalents 1,155,162 1,114,235 Total investments 1,163,688 1,587,404 Deposits 4,414,757 4,621,784 Shareholders’ equity 320,001 319,023 Selected Ratios: Return on average assets 0.29% Nm* Return on average common equity 4.20% Nm* Net interest margin 2.37% 2.60% Book value per share $8.47 $8.46 *Not meaningful

23 Current Loan Portfolio and Asset Quality Overview at 12/31/2015 Category(dollars in thousands) Balance % of Total Loans Nonaccrual Loans Nonaccrual/Total Loans OREO 30-89 Days Delinquent 90+ Days Delinquent Q4 2015 Quarterly Charge-offs (net) SBA $189,893 12% $733 0.4% $- $- $- $46 SBA held for sale 109,174 7% - - - - - - Leasing 231,514 15% - - - 7,065 403 21 Security backed lines of credit 575,948 37% - - - - - - Other consumer lending 23,180 2% 1,194 5.2% - 1,399 - 35 Other specialty lending 48,315 3% - - - - - - CMBS & CLO 380,764 24% - - - - - - Total $1,558,788 100% $1,927 0.1% $- $8,464 $403 $102

Specialty Finance Payments Corporate Category (dollars in thousands) Institutional Banking GGL CMBS & CLO Leasing Prepaid Payment Acceptance Investment Securities Interest income $12,997 $11,213 $11,226 $13,009 $- $10 $33,669 Interest expense 5,037 - - - 2,971 4,474 - Non interest income 2,914 3,097 7,661 2,096 57,174 6,748 14,435 Allocated income from loans 3,649 (5,607) (5,613) (6,505) 11,226 2,849 - Allocated income from investment securities 9,905 - - - 30,468 7,731 (48,104) Total $24,428 $8,703 $13,274 $8,600 $95,897 $12,864 - Percentage 15% 5% 8% 5% 59% 8% - 24 Revenue By Segment Reconciliation(1) Specialty Finance Payments Category (dollars in thousands, average balances) Institutional Banking GGL CMBS & CLO Leasing Prepaid Payment Acceptance Deposits $774,598 $3,273 - - $2,382,769 $604,608 Loans 559,066 289,074 380,827 226,423 - - Net 215,532 - - - 2,382,769 604,608 Percentage of loan allocated income to be received 21% - - - 63% 16% Percent of Investment Securities allocated income to be received 21% - - - 63% 16% Revenue for Specialty Finance departments includes all revenue from the assets they fund with deposits they generate. It also includes half the revenue from assets they generate but do not fund. The other half of the revenue, along with revenue generated through the bank’s Investment Securities portfolio, is allocated to Payments departments and Institutional Banking for funding they provide.

25 Post Provision Income Reconciliation(1) Category (dollars in millions) 2010 2011(2) 2012 2013 2014 2015 Q4 2014 Q4 2015 Interest income $24.3 $31.0 $39.4 $51.1 $70.7 $83.5 $18.5 $22.2 Interest expense 14.5 12.0 11.4 10.8 11.3 13.6 2.8 3.7 Net interest income 9.8 19.0 28.0 40.3 59.4 69.9 15.7 18.5 Provision for loan and lease losses 1.4 1.6 6.6 0.3 1.2 2.1 (1.4) 0.3 Net interest income post provision 8.4 17.4 21.4 40.0 58.2 67.8 17.1 18.2 Total non-interest income 20.6 30.4 49.5 82.0 85.0 133.0 17.6 72.5 Less gain on sales of investment securities 1.2 (0.1) 0.7 1.8 0.4 14.4 - 14.4 Less gain on sales of HSA portfolio - - - - - 33.5 - 33.5 Less other than temporary impairment - - (0.2) - - - - - Change in value of investment in unconsolidated entity - - - - - 1.7 - - Non-interest income 19.4 30.5 49.0 80.2 84.6 83.4 17.6 24.5 Post provision income $27.8 $47.9 $70.5 $120.2 $142.8 $151.2 $34.7 $42.7 Post provision income is calculated as follows: net interest income less provision for loan and lease losses plus non-interest income excluding gains on sales of investment securities and other than temporary impairment on securities.2011 includes a one-time gain of $718,000 related to a legal settlement.

26 The Bancorp Board of Directors Board of Directors Daniel G. CohenChairman of the Board Daniel Gideon Cohen has been the Chairman of Bancorp, Inc. (the “Company”); he was also named Chairman of the Board of Directors of the Company’s wholly-owned subsidiary, Bancorp Bank (the “Bank”), effective January 2015. He had previously been Chairman of the Bank’s Board of Directors from September 2000 to November 2003 and, from July 2000 to September 2000, had been the Bank’s Chief Executive Officer. Additionally, Mr. Cohen is an Executive Vice President at the Company, and oversees the commercial mortgage-backed securities origination and sales division of the Company. John C. ChrystalInterim CEO & Director In addition to becoming interim CEO of the Company on December 14, 2015. Mr. Chrystal has been an Independent Director of The Bancorp, Inc. and its subsidiary, The Bancorp Bank, since January 2013 and Morgan Stanley Derivative Products, a specialized derivative product company established by Morgan Stanley, since 2010, and has served as an Independent Director for funds managed by the Trust for Advised Portfolios, including a long-short credit fund since 2010. Since early 2009, Mr. Chrystal has advised multiple companies concerning restructuring of their credit derivative portfolios, including a successful restructuring of a multi-billion-dollar credit default swap portfolio managed by Primus Asset Management, a subsidiary of Primus Guaranty, Ltd. Mr. Chrystal holds an M.B.A. in finance from the University of Chicago and a B.S. in agricultural business from Iowa State University. Walter T. BeachDirector Walter T. Beach has been a Director of Bancorp, Inc. and Bancorp Bank since 1999. Mr. Beach has been a Managing Director of Beach Investment Counsel, Inc., an investment management firm, since 1997. From 1993 to 1997, Mr. Beach was a Senior Analyst and Director of Research at Widmann, Siff and Co., Inc., an investment management firm, where he was, beginning in 1994, responsible for the firm’s investment decisions for its principal equity product. Before that he was an associate and Financial Analyst at Essex Financial Group, a consulting and merchant banking firm, and an analyst at Industry Analysis Group, an industry and economic consulting firm. Mr. Beach also served as a director of Institutional Financial Markets, Inc. and its predecessor, Cohen & Company, a publicly-traded financial services company specializing in credit related fixed income investments, from December 2009 to 2013.

27 The Bancorp Board of Directors (cont’d) Board of Directors Michael J. BradleyDirector Michael J. Bradley has been a Director of The Bancorp, Inc. and Bancorp Bank since 2005. Mr. Bradley has been a Co-Owner and Managing Director of BF Healthcare, Inc., since 1998. Mr. Bradley serves on the Board of Directors of Resource America, Inc. Mr. Bradley served on the Board of Sourcecorp Inc., from 1994-2012. Mr. Bradley also served on the Managing Board of Atlas Pipeline Partners from 2004-2006. Previously, Mr. Bradley served as Chairman of First Executive Bank, and as Vice Chairman of First Republic Bank. Mr. Bradley is a Certified Public Accountant. Matthew CohnDirector Matthew Cohn has served as a Director of Bancorp, Inc. and Bancorp Bank since 1999. Mr. Cohn founded and serves as Vice Chairman of The ASI Show, a leading producer of trade shows throughout the country and the recipient of prestigious awards. In addition, Mr. Cohn serves as the Chairman of ASI Computer Systems, and the Vice Chairman of the Advertising Specialty Institute, a multi-year winner of the “Best Place to Work” award. Mr. Cohn serves on the international Boards of YPO (the Young Presidents’ Organization) and of the JDRF (formerly known as the Juvenile Diabetes Research Foundation). Mr. Cohn was a past board member of The Society of Independent Show Organizers and CADE. Hersh KozlovDirector Hersh Kozlov has been a Director of Bancorp, Inc. and Bancorp Bank since 2014. He has been a Partner at Duane Morris LLP (an international law firm) since 2009. Previously, he was a Partner at Wolf, Block, Schorr and Solis-Cohen LLP (a law firm) from 2001 to 2009. Mr. Kozlov is a Member of the Board of Directors of Resource America, Inc. and was previously a Member of the Board of Directors of JeffBanks, Inc., TRM Corporation, Hudson United Bank, US Healthcare Life Insurance Company, and Princeton Insurance Company. Mr. Kozlov has also served as counsel to the Board of Directors of US Healthcare, Inc. and was appointed by the President of the United States to be a Member of the Advisory Committee for Trade Policy & Negotiations, serving in that role from 2002 to 2004.

28 The Bancorp Board of Directors (cont’d) Board of Directors William H. LambDirector William H. Lamb has served as a Director of the Bancorp, Inc. and Bancorp Bank since 2004. Mr. Lamb currently serves as Chairman of Lamb McErlane PC and directs the firm's Post-Trial and Appellate Advocacy Group. From January 2003 through January 2004, Mr. Lamb served as a Justice of the Pennsylvania Supreme Court and is the only former Pennsylvania Supreme Court Justice currently in practice. Mr. Lamb has been recognized as a Top 100 Pennsylvania Super Lawyer for appellate law and as a Pennsylvania Super Lawyer since 2005. Mr. Lamb previously served as Director and Corporate Secretary of JeffBanks, Inc. and Jefferson Bank until their acquisition by Hudson United Bank in 1999. Since 2004, Mr. Lamb has been appointed to the President's Advisory Committee on the Arts, the Commonwealth of Pennsylvania's Court of Judicial Discipline, and the Pennsylvania Elections Reform Task Force. James Joseph McEntee IIIDirector James Joseph McEntee has been a Director of Bancorp, Inc. and Bancorp Bank since 2000. Since August 2014, Mr. McEntee has been the Chief Operating Officer and Chief Financial Officer of FinTech Acquisition Corp. Mr. McEntee was the Chief Executive Officer of Alesco Financial, Inc. from its incorporation in 2006 until its merger with Cohen & Company in 2009, and was a Managing Director of Institutional Financial Markets, Inc. (a successor company to Cohen & Company) through October 2013. Previously, Mr. McEntee served as Vice Chairman and Co-Chief Operating Officer of PrinceRidge and also served as a principal in Harron Capital, L.P., a media and communications venture capital fund. From 1990 through 1999, Mr. McEntee was a stockholder at Lamb McErlane PC, and, from 2000 until 2004, was of counsel to Lamb McErlane. Mr. McEntee was previously a Director of Pegasus Communications Corporation, a publicly held provider of communications and other services.

29 The Bancorp Board of Directors (cont’d) Board of Directors Mei-Mei TuanDirector Mei-Mei Tuan has been a Director of both The Bancorp, Inc. and U.S. subsidiary The Bancorp Bank since 2013. Ms. Tuan is the Co-Founder and Managing Partner of Notch Partners LLC, a firm providing leadership capital and management-led buyout strategies exclusively for institutional leveraged buyout funds. Ms. Tuan’s operating experience includes serving as Chief Financial Officer and Chief Operating Officer at the Sierra Foundation, from 1996 through 1997, and the San Francisco Food Bank, from 1997 through 1998. Ms. Tuan is an active Board Member of Friends of Thirteen, Montclair Kimberley Academy, and the Harvard Business School Asian-American Association (HBS4A). She has also served recently on Boards for the Wellesley College Alumnae Association, New Jersey Women’s Forum, New Jersey Network (NJN), Museum of Chinese in America (MOCA), Mid-Manhattan Performing Arts Foundation, and New Jersey Wellesley Club, in which she was President. Ms. Tuan is a Member of Business Leadership Council (BLC) at Wellesley, New Jersey Women’s Forum, and the Committee of 100--an international, non-profit, non-partisan membership organization that brings Chinese-American perspective to issues concerning US-China relations.

Notes 30

31