Attached files
| file | filename |
|---|---|
| 8-K - 8-K - GETTY REALTY CORP /MD/ | d238813d8k.htm |
 Investor Presentation
Exhibit 99.1 |
 Safe Harbor Statement
1 Certain statements in this Presentation constitute “forward-looking statements” within the meaning of the federal securities laws. Forward-looking statements are statements that relate to management’s expectations or beliefs, future plans and strategies, future financial performance and similar expressions concerning matters that are not historical facts. In some cases, forward-looking statements can be identified by the use of forward-looking terminology such as “may,” “will,” “should,” “expects,” “intends,” “plans,” “anticipates,” “believes,” “estimates,” “predicts,” or “potential.” Such forward-looking statements reflect current views with respect to the matters referred to and are based on certain assumptions and involve known and unknown risks, uncertainties and other important factors, many of which are beyond the Company’s control, that could cause the actual results, performance, or achievements of the Company to differ materially from any future results, performance, or achievement implied by such forward- looking statements. While forward-looking statements reflect the Company’s good faith beliefs, assumptions and expectations, they are not guarantees of future performance. The Company does not undertake any obligation to publicly update or revise any forward-looking statements to reflect changes in underlying assumptions or factors, new information, data or methods, future events or other changes. Examples of forward-looking statements in this Presentation include, but are not limited to, statement(s): (a) relating to the Company’s Portfolio, Long-Term Leases and Rent Escalators, Tenant Base, Market Opportunity and Redevelopment Opportunities, (b) relating to Industry Fundamentals and (c) relating to the Company’s Balance Sheet, Dividend Growth and Investment Highlights. Other unknown or unpredictable factors could also have material adverse effects on our business, financial condition, liquidity, results of operations and prospects. For a further discussion of these and other factors that could cause the Company’s future results to differ materially from any forward-looking statements, see the Company’s Annual Report on Form 10-K for the year ended December 31, 2015 and the Company’s other filings with the SEC, including, in particular, the section entitled “Risk Factors” contained therein. In light of these risks, uncertainties, assumptions and factors, there can be no assurance that the results and events contemplated by the forward-looking statements contained in this Presentation will, in fact, transpire. Moreover, because the Company operates in a very competitive and rapidly changing environment, new risks are likely to emerge from time to time. Given these risks and uncertainties, potential investors are cautioned not to place undue reliance on these forward-looking statements as a prediction of future results. Unless otherwise noted in this Presentation, all reported financial data is presented as of the period ended June 30, 2016, and all portfolio data is as of June 30, 2016. Except as required under the federal securities laws and the rules and regulations of the SEC, the Company does not undertake any obligation to release publicly any revisions to the forward-looking statements to reflect events or circumstances after the date of this Presentation or to reflect the occurrence of unanticipated events. The information contained herein has been prepared from public and non-public sources believed to be reliable. However, the Company has not independently verified certain of the information contained herein, and does not make any representation or warranty as to the accuracy or completeness of the information contained in this Presentation. |
 Investment Highlights
2 1 National Retail Net Lease Portfolio Targeting Mature, High Growth Markets
2 Increasingly Institutional Quality Credit Tenant Base with Long-Term Triple-Net
Leases 5 Ongoing Process to Repurpose, Reposition, Redevelop Locations to Maximize Value
3 Attractive Industry Fundamentals with Stable Operator Performance 4 Aggregation Opportunity with Proven Ability to Successfully Pursue Growth in a
Consolidating Sector
6 Strong Balance Sheet Positioned for Future Growth |
 Company Overview |
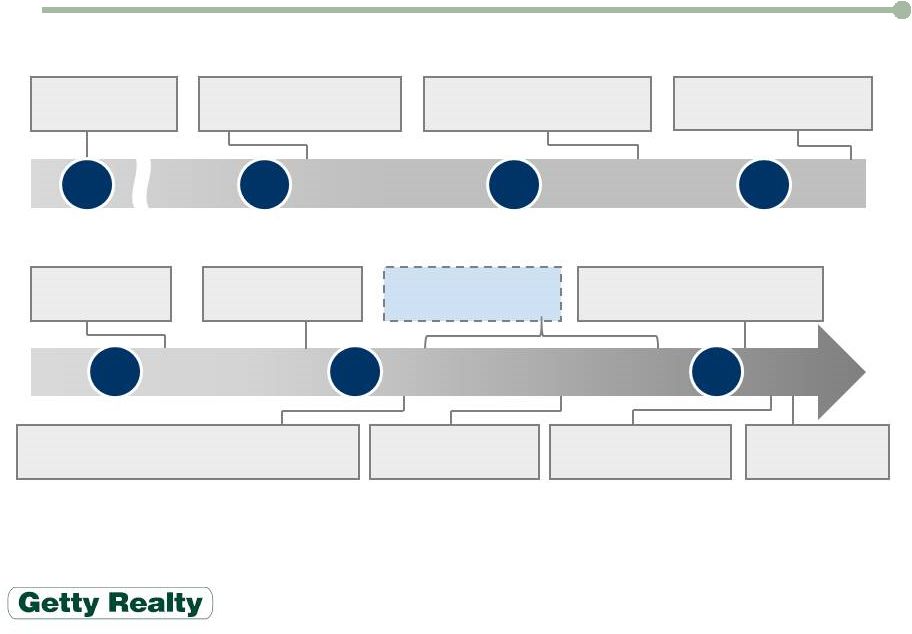                                                   Corporate History
4 1955: Leo Liebowitz
and Milton Safenowitz purchase a gas station in New York City 1985: Acquires the northeastern retail petroleum
distribution and marketing assets, and Getty®
trademark for retail petroleum from Texaco
1971: Getty grows its portfolio to
roughly 75 service stations and holds its initial
public offering under the name Power Test Corp.
January 2016: Completes
successful senior leadership transition and key
employee recruitment
2001: Elects to be taxed as a
REIT with the year beginning
January 1, 2001
June 2015: Acquires 77 convenience
store and retail motor fuel stations from Pacific
Convenience and Fuels LLC and leases the properties to
United Oil 2009: Completes
sale-leaseback of 36 Exxon branded properties from White Oak for $49 million 2011: Acquires 59 Mobil branded properties in a
sale-leaseback and loan transaction with CPD for $111 million; also completes 66 Shell branded
properties in sale-leaseback transaction with Nouria
Energy for $87 million
2012 -
2015: Re-leases 360 properties and sells 377 properties as part of portfolio repositioning 1997: Completes the spin-off of its petroleum
marketing business and forms Getty Realty
Corp. 2013: Completes
sale-leaseback of 36 properties from Capitol Petroleum Group for $72.5 million June 2016: Launches $125
million at-the-market equity
offering program
1955 1990 1980 1970 2015 2010 2000 |
 Executive Management Team
5 Christopher J. Constant, President, Chief Executive Officer, Director
— Promoted to President and Chief Executive Officer in January 2016 — Joined in November 2010 as Director of Planning & Corporate Development and was later promoted to
Treasurer in May 2012, Vice President in May 2013 and Chief Financial Officer in
December 2013 —
Previously Vice President of Morgan Joseph; Began career at ING
Barings Mark J. Olear, EVP, Chief
Operating Officer and Chief Investment Officer
— Promoted to Chief Operating Officer in May 2015 — Joined in May 2014 as Executive Vice President and Chief Investment Officer
— Previously held various real estate positions with TD Bank, Home Depot, Toys “R” Us and A&P
— Joined in February 2016 as Vice President, Chief Financial Officer and Treasurer
— Previously held various positions with Wilbraham Capital, Inc., The Moinian Group, Nationwide Health Properties, Inc., and J.P. Morgan Securities, Inc. Danion Fielding, VP, Chief Financial Officer and Treasurer
— Promoted to Senior Vice President in May 2012 — Joined in February 2008 as General Counsel and Secretary and was later promoted to Vice President in
February 2009 — Previously a Partner at Arent Fox LLP specializing in corporate and transactional matters
Joshua Dicker, SVP, General Counsel,
Secretary |
 National Net Lease Portfolio
6 837 properties (745 fee simple, 92 leased) located in 23 states plus Washington, D.C.
(1) — 799 net lease portfolio properties — 38 transitional properties — 97% occupied $33.3 million mortgage portfolio (9-9.5% yield) 1) As of June 30, 2016 |
 Investment Overview |
 8 Mature, Infill Markets — High replacement costs — Time consuming zoning restrictions — Limited new development Prime Locations and Corners — Mature transportation grid — High daily traffic counts — Optimal corners with traffic lights, high visibility and easy access — Close proximity to freeway entrances or exit ramps Convenience Store and Gasoline Station Properties — Stable, yet growing sector — Increasingly institutional tenant base Alternative Use Opportunities — Retail, banking, service, restaurant — Assemblage, redevelopment, repositioning Attractive Net Lease Portfolio |
 Stable Long-Term Lease Structure
Stable Long-Term Leases with Rent Escalators
9 Sustainable cash flows supported by long-term triple-net leases — Contractual rent increases of 1.0% to 2.0% with coverage of 1.5x – 2.0x or more — Unitary tenant credit visibility via station and tenant financial statements
Majority of triple-net leases have 15-year initial terms
—
Leases are typically 15 to 20 years with extension options
—
Weighted average lease term, excluding renewal options, of approximately 11
years —
69% of contractual annual rent attributable to leases with initial terms
expiring in 2026 or beyond
2% 1% 3% 3% 7% 5% 4% 1% 1% 1% 3% 69% MTM 2016 2017 2018 2019 2020 2021 2022 2023 2024 2025 2026+ |
 Top 10 Tenants
(1) High-Quality, Diversified Tenant Base 10 Total annualized base rent: — Credit rated or national tenants (53%) — Regional unitary tenants (42%) — Individual tenants (5%) Rank Tenant % of ABR Rank Tenant % of ABR 1 * 20% 6 + 7% 2 * 18% 7 + 6% 3 + 17% 8 * 3% 4 + 9% 9 * 2% 5 * 8% 10 + 2% 1) Based on GAAP annualized base rent * Credit rated tenants, including subsidiaries of credit rated companies
+ Regional unitary tenants |
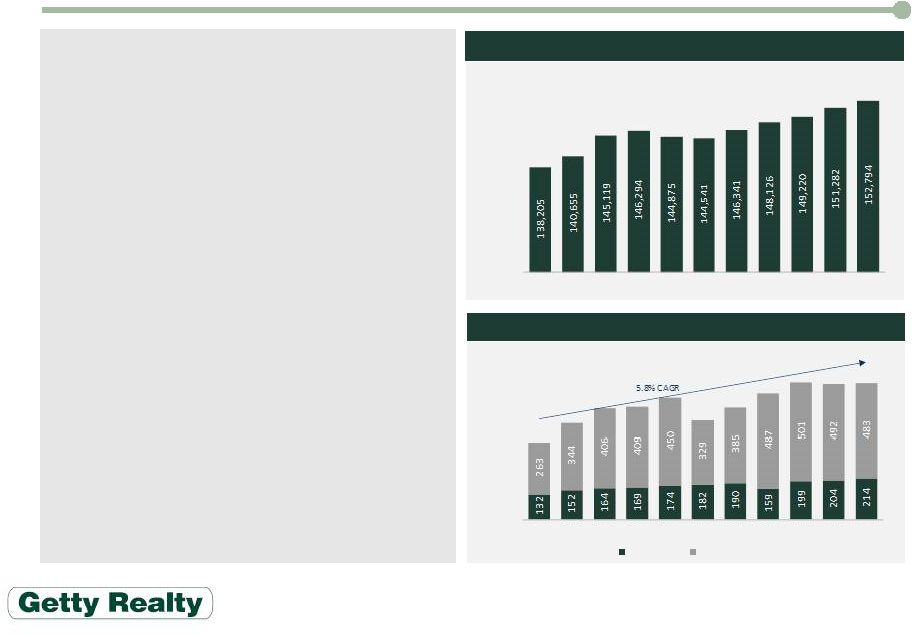 Convenience Stores Dominate Retail Landscape
11 Number of convenience stores in service has remained steady over last 10 years (1) — More than 152,000 properties (84% selling fuel) represents 34% of all retail outlets — 63% of stores are single-store chains Stable Operator Performance (1) — Convenience store sales have grown at a 5.8% CAGR since 2004 — Average industry return on capital of 15.7% — On average gasoline sales account for 77% of sales and 35% of profits — Operator profit margins exhibit less volatility than broader commodity market Consumers embracing convenience stores (1) — Average store with fuel has around 1,100
customer visits per day — Stores expanding offerings to become part grocery, restaurant, bank and drug store — Growth in foodservice is more than offsetting declines in tobacco sales and modest decreases in fuel volumes 1) Source: National Association of Convenience Stores Convenience Store Sales ($bn) (1) Growth in Number of Convenience Stores (1) - 100 200 300 400 500 600 700 800 2004 2005 2006 2007 2008 2009 2010 2011 2012 2013 2014 Inside Sales Motor Fuel Sales 115,000 120,000 125,000 130,000 135,000 140,000 145,000 150,000 155,000 2004 2005 2006 2007 2008 2009 2010 2011 2012 2013 2014 |
 Large Market Opportunity
12 Ability to underwrite unit level and entity level credit Ability to underwrite real estate and execute redevelopment to achieve highest and best use Established record of managing and remediating environmental concerns in a highly regulated industry Proven ability to source off-market transactions The Getty Competitive Advantage Estimated Addressable Market Size (1) — Total market size estimated at $175 billion to $250 billion — Getty estimates up to 40% ($70 billion) of the market is addressable for potential acquisition Aggregation Opportunity — Highly fragmented with current REIT ownership of less than 2% of total stores — Sale/leaseback structure attractive for smaller, capital constrained sellers Industry Consolidation — Traditional owner/operators — Public and non-traded REITs — Public MLPs — Private equity 1) Source: Company estimate based on National Association of Convenience Stores data |
 13 Getty Growth Platform Embedded growth derived from long-term triple-net leases — 1% to 2% contractual annual rent increases Remaining transitional properties create upside — Repositioning continues to drive occupancy increases — Net positive to portfolio profitability Demonstrated ability to execute on repositioning: — Leased 58 transitional properties in 2015 Opportunity to consolidate a fragmented market — Convenience store sector is recession and e-commerce resistant — Significant pipeline of actionable opportunities — Focused on both single asset and portfolio acquisitions Completed $500 million of portfolio and single asset acquisitions since 2011 Unlocking embedded value in existing portfolio — Five-year plan to redevelop 5% to 10% of properties — Targeting 10%+ unlevered yields — Improves tenant credit quality and coverage ratios — Diversifies retail tenant base 2016 year to date: — Completed one redevelopment — Executed leases on six redevelopment projects — Building significant pipeline of high quality projects Organic Redevelopment Acquisitions |
 Acquisition Case Study –
United Oil 14 $214.5 million Acquisition of 77 Properties in June 2015 — Financed with a combination of long-term fixed rate debt and credit facility borrowings — Tenant is United Oil, a leading regional convenience store and gasoline station operator › Operates ~400 locations in the Western United States and Colorado › Fortress Investment Group portfolio company — 20-year triple-net lease with three five-year renewal options Attractive Sites in High Growth Markets — Sites located across California, Colorado, Nevada, Oregon and Washington State — Recognized brands including 7-Eleven, 76, Circle K, Conoco and My Goods Market Credit Enhancement — Properties supplied with fuel by Philips 66 under a long- term supply agreement › Agreement contains credit enhancement consignment features |
 15 Salem, New Hampshire — Property acquired in 1986 and previously leased to Getty Petroleum Marketing, Inc. — Re-leased in 2012 — Vacant as of 2015 Property Attributes — Well located retail location at traffic corner — Several large shopping centers with major retailers adjacent to the site — Surrounded by other single tenant net lease retail stores Redevelopment Project — $1.1 million invested in a build to suit — Corporate guarantee with Mattress Firm Holding Corp. (NASDAQ:MFRM, Moody’s B1) — Rent commenced February 2016 — 14% unlevered return on invested capital Redevelopment Case Study – MattressFIRM Before After |
 Financial Overview |
 Income Growth, Scalable G&A
17 1) AFFO and FFO are non-GAAP measures. For a description of how Getty calculates AFFO and FFO and for a reconciliation to Net Earnings,
see Item 2 of our Quarterly Report on Form 10-Q for the
period ended June 30, 2016. Margins exclude items detailed in footnotes 2 and 3 below. 2) GPMI settlement income. 3) Includes a net $0.8 million and $0.6 million of environmental insurance reimbursements, recoveries of uncollectible accounts, other income and environmental litigation reserves for the three and six months ended June 30, 2016, respectively. G&A ($ thousands) AFFO ($ thousands) (1) Revenue ($ thousands) FFO ($ thousands) (1) 11,137 15,167 21,625 29,543 7,350 (2) 791 (3) 7,350 (2) 562 (3) 42.4% 53.0% 42.4% 51.8% 10.0% 20.0% 30.0% 40.0% 50.0% 60.0% - 5,000 10,000 15,000 20,000 25,000 30,000 35,000 40,000 2Q15 2Q16 1H15 1H16 Margin 11,194 13,670 22,233 27,060 7,350 (2) 791 (3) 7,350 (2) 562 (3) 42.6% 47.8% 43.6% 47.4% 10.0% 20.0% 30.0% 40.0% 50.0% 60.0% - 5,000 10,000 15,000 20,000 25,000 30,000 35,000 40,000 2Q15 2Q16 1H15 1H16 Margin 26,248 28,608 50,957 57,035 - 10,000 20,000 30,000 40,000 50,000 60,000 2Q15 2Q16 1H15 1H16 4,835 3,806 8,624 7,850 2.1% 1.7% 1.9% 1.8% 0.0% 0.5% 1.0% 1.5% 2.0% 2.5% 3.0% - 2,000 4,000 6,000 8,000 10,000 2Q15 2Q16 1H15 1H16 % of Assets |
 Strong Balance Sheet
18 Revolving Credit Facility — $175 million senior unsecured — Matures in 2018 and has a one-year extension option — LIBOR +195 to 325 bps based on Company leverage Bank Term Loan — $50 million senior unsecured — Matures in 2020 — LIBOR +190 to 320 bps based on Company leverage Prudential Series A Notes — 6.0% $100 million senior unsecured — Matures in 2021 Prudential Series B Notes — 5.35% $75 million senior unsecured — Matures in 2023 ATM Equity Issuance Program — $125 million capacity Credit Statistics Maturity Schedule ($ millions) 79 50 100 75 $0 $20 $40 $60 $80 $100 $120 2016 2017 2018 2019 2020 2021 2022 2023 Debt to Total Capitalization 29% Net Debt to EBITDA (1) 4.2x Fixed Charge Coverage (1) 2.7x Weighted Average Interest Rate 4.6% Weighted Average Maturity 4.4 yrs Variable Rate vs. Fixed Rate 42% / 58% 1) As defined in the Company’s loan agreements |
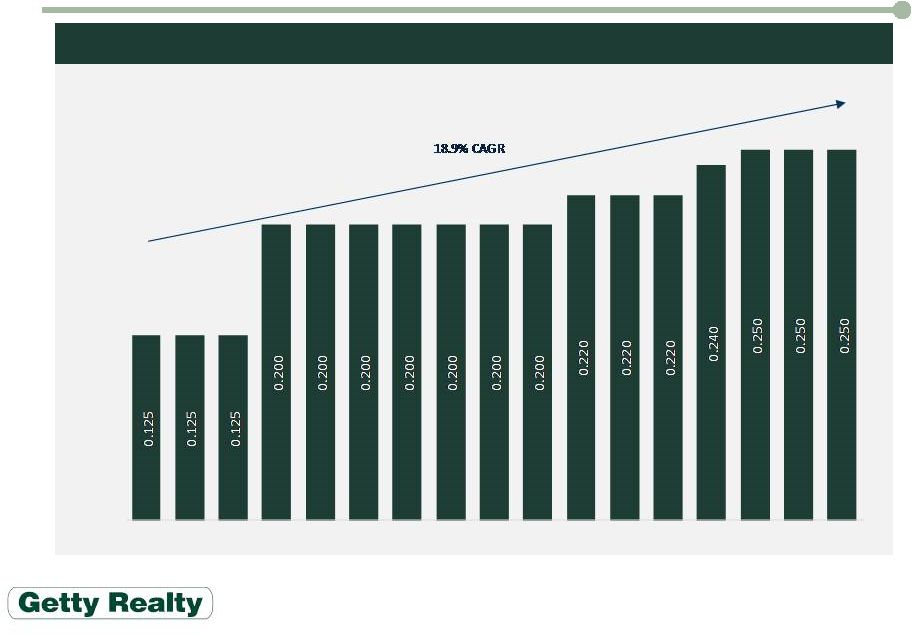 19 Quarterly Dividends Declared per Share Consistent Dividend Growth 1) Excludes special dividends of $0.05, $0.14 and $0.22 per share in Q4 2013, Q4 2014 and Q4 2015, respectively.
$0.00 $0.05 $0.10 $0.15 $0.20 $0.25 $0.30 2Q12 3Q12 4Q12 1Q13 2Q13 3Q13 4Q13 1Q14 2Q14 3Q14 4Q14 1Q15 2Q15 3Q15 4Q15 1Q16 2Q16 |
 Investment Highlights
21 1 National Retail Net Lease Portfolio Targeting Mature, High Growth Markets
2 Increasingly Institutional Quality Credit Tenant Base with Long-Term Triple-Net
Leases 5 Ongoing Process to Repurpose, Reposition, Redevelop Locations to Maximize Value
3 Attractive Industry Fundamentals with Stable Operator Performance 4 Aggregation Opportunity with Proven Ability to Successfully Pursue Growth in a
Consolidating Sector
6 Strong Balance Sheet Positioned for Future Growth |
 Appendix |
 Reconciliation of Net Income to FFO
and AFFO 22 1) AFFO and FFO are non-GAAP measures. For a description of how Getty calculates AFFO and FFO see Item 6 (Selected Financial Data) in the Annual Report on our Form 10-K for the year ended December 31, 2015.
Three months ended June 30,
Six months ended June 30,
$ in thousands, except per share amounts
2015 2016 2015 2016 Net earnings 11,619 $
13,576 $
10,482 $
21,279 $
Depreciation and amortization of real estate assets
3,977 4,616 7,563 9,238 (Gains) losses on dispositions of real estate
8 (4,721)
134
(5,208) Impairments 2,883 2,487 10,796 4,796 FFO 18,487 15,958 28,975 30,105 Revenue recognition adjustments
(756) (760) (1,335) (1,712) Allowance for deferred rental revenue
(14) -
(4) -
Non-cash changes in environmental estimates (815) (1,748) (864) (2,735) Accretion expense
1,229 1,011 2,398 1,964 Acquisition costs
413 -
413 -
AFFO 18,544 14,461 29,583 27,622 Basic and diluted weighted average shares outstanding
33,420 33,714 33,419 33,686 Earnings per share
$0.34 $0.40 $0.31 $0.62 FFO per share 0.55 0.47 0.86 0.88 AFFO per share 0.55 0.42 0.87 0.81 |