Attached files
| file | filename |
|---|---|
| EX-99.1 - EXHIBIT 99.1 - Prestige Consumer Healthcare Inc. | exhibit991fy17-q1earningsr.htm |
| 8-K - 8-K - Prestige Consumer Healthcare Inc. | a8-kpressreleasejune2016.htm |

Exhibit 99.1

This presentation contains certain “forward-looking” statements within the meaning of the Private Securities Litigation Reform Act of 1995, such
as statements regarding the Company’s expected financial performance, including revenue growth, adjusted EPS, and adjusted free cash flow,
expansion of market share for the Company’s Invest for Growth brands, the Company’s investment in digital, product development and
marketing initiatives, the impact of and expected use of proceeds from recent brand divestitures, and the Company’s ability to de-lever and
increase M&A capacity. Words such as "continue," "will," “expect,” “project,” “anticipate,” “likely,” “estimate,” “may,” “should,” “could,” “would,” and
similar expressions identify forward-looking statements. Such forward-looking statements represent the Company’s expectations and beliefs and
involve a number of known and unknown risks, uncertainties and other factors that may cause actual results to differ materially from those
expressed or implied by such forward-looking statements. These factors include, among others, general economic and business conditions,
regulatory matters, competitive pressures, the impact of the Company’s digital, product development and marketing initiatives, supplier issues,
unexpected costs, and other risks set forth in Part I, Item 1A. Risk Factors in the Company’s Annual Report on Form 10-K for the year ended March
31, 2016. You are cautioned not to place undue reliance on these forward-looking statements, which speak only as of the date this presentation.
Except to the extent required by applicable law, the Company undertakes no obligation to update any forward-looking statement contained in
this presentation, whether as a result of new information, future events, or otherwise.
All adjusted GAAP numbers presented are reconciled to their closest GAAP measurement in the attached reconciliation schedule and in our
earnings release in the “About Non-GAAP Financial Measures” section.
Agenda for Today's Discussion
I. Performance Highlights
II. Financial Oueruiew
Ill. FY 17 Outloo� and the Road Ahead
First Qu arter FY 17 Results 3

I. Performance Highlights
Dramamine· Co 41BM#@R+
Cli!Gr
eyes®
MONISTAT�
� (§$1,ffl
Debrox�
Invest for Growth portfolio is comprised of Core OTC brands and International.*
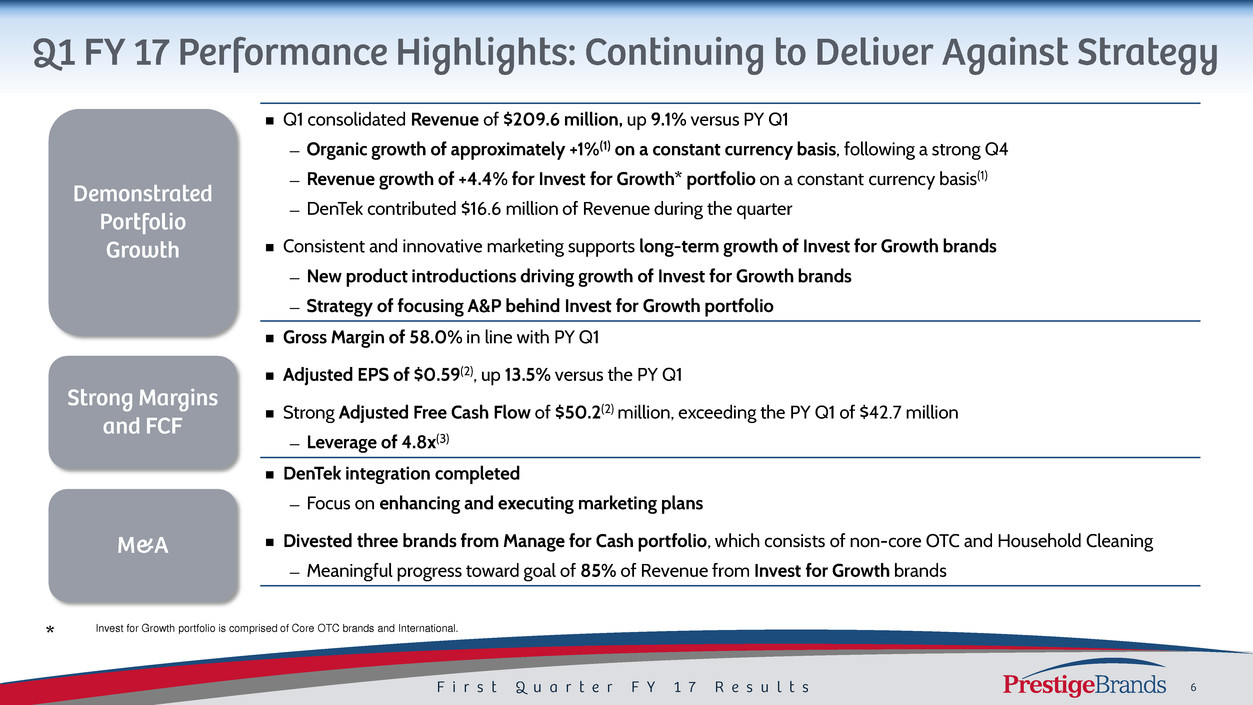
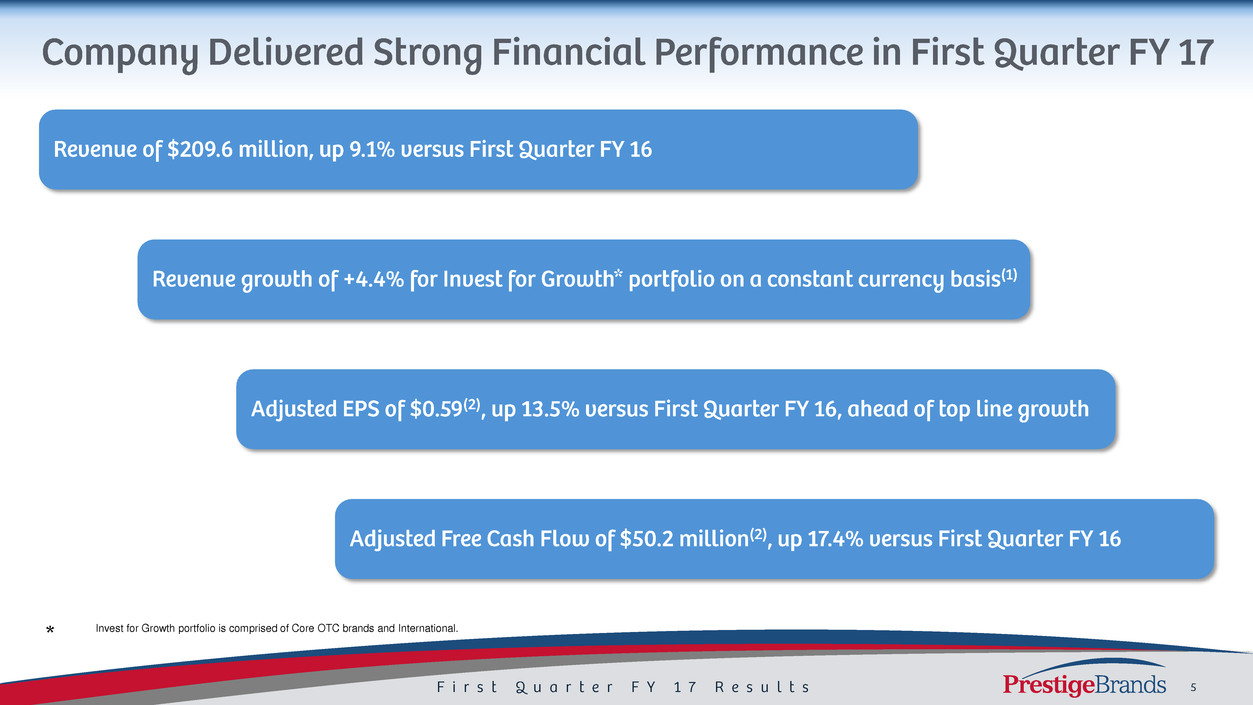
Q1 consolidated Revenue of $209.6 million, up 9.1% versus PY Q1
— Organic growth of approximately +1%(1) on a constant currency basis, following a strong Q4
— Revenue growth of +4.4% for Invest for Growth* portfolio on a constant currency basis(1)
— DenTek contributed $16.6 million of Revenue during the quarter
Consistent and innovative marketing supports long-term growth of Invest for Growth brands
— New product introductions driving growth of Invest for Growth brands
— Strategy of focusing A&P behind Invest for Growth portfolio
Gross Margin of 58.0% in line with PY Q1
Adjusted EPS of $0.59(2), up 13.5% versus the PY Q1
Strong Adjusted Free Cash Flow of $50.2(2) million, exceeding the PY Q1 of $42.7 million
— Leverage of 4.8x(3)
DenTek integration completed
— Focus on enhancing and executing marketing plans
Divested three brands from Manage for Cash portfolio, which consists of non-core OTC and Household Cleaning
— Meaningful progress toward goal of 85% of Revenue from Invest for Growth brands
Invest for Growth portfolio is comprised of Core OTC brands and International.*

Source: Data reflects retail dollar sales percentage growth versus prior period for consumption growth and organic revenue growth.
FY 15 and FY 16 data shown as previously presented for Core OTC.
Q1 FY 17 data for Invest for Growth portfolio comprised of Core OTC brands and International. Core OTC brands reflect: Monistat (after Q2 FY 16), BC/Goody’s, Clear Eyes, Dramamine, Debrox, Chloraseptic, Luden’s, Little Remedies,
Compound W, Nix (after Q2 FY 16), Beano, Efferdent and The Doctor’s IRI multi-outlet + C-Store retail dollar sales for relevant period. International includes Canadian consumption for leading retailers, and Australia/ROW shipment data as
a proxy for consumption.
FY 15
>2x Category
Growth
4.1%
8.3%
3.3%
3.5%
5.9%
4.4%
FY 16
Q1
FY 17 *
*


Canada’s #1 Selling heartburn relief
brand; long-lasting relief
Retail & Club Store
Displays
Begins working immediately;
Acid-shielding foam barrier neutralizes
excess stomach acid

A full line of nasal saline products for
adults and children
A full line of oral rehydration products for
adults and children
+25% Growth Since Acquisition+25% Growth Since Acquisition

Murine/Clear Eyes: Expanding Our International Eye Care
Footprint
•
New Zealand
I 5"'111YON10Cl0SCDC'IEL10S •
Eye mist
"'CfearEyes
PHARMACY MEDICINE •
Clear
eyes
PHARMACY MEDICINE •
Clear
eyes'J\
Australia
� ........ ffltat- loochn.., ...........
RED EYES son'. EY£S ORV EY£S
..G'l.wr.r'- -�-
Nordic
OooM>qn
Cleareyes
0,1.)m,:lml
njendraber
""in-;rw
n11ph;m1tinhtrdmr.hlorid
Cleye
0,12mglml
gyedrAper
opplssning
n•fa,olinhydroldorid
�u arter F y
Hong Kong
South Africa
-
1 7
•,-.1U�""l
:moisture
eyes •
'-"I ••' .;; · •. . . . ' 15 rnl �··pen
1 .. '"
I • t,1UR).!'IE'
ij i clear eyes
_eye_ •
Results
MU�NE ®
Chile
Korea
1 1

Dramamine·
II. Financial Oueruiew
Co
41BM#@R+
Cli!Gr
eyes®
MONISTAT�
� (§$1,ffl
Debrox�
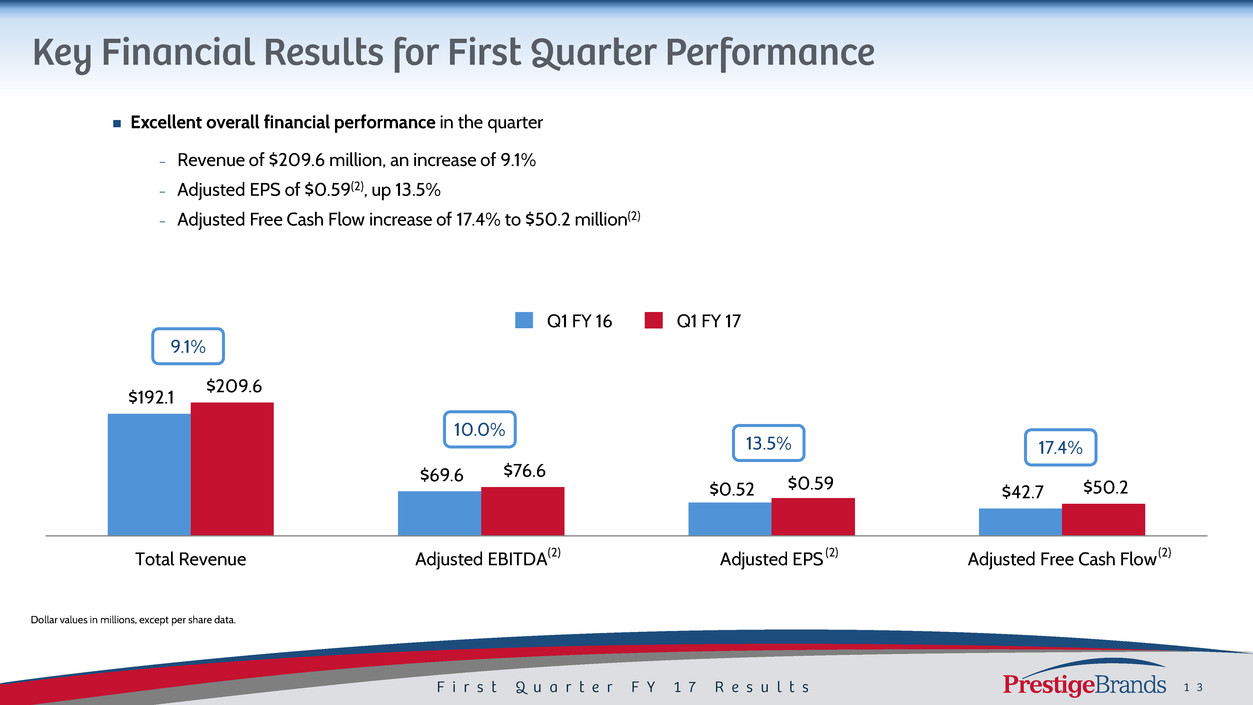
Excellent overall financial performance in the quarter
− Revenue of $209.6 million, an increase of 9.1%
− Adjusted EPS of $0.59(2), up 13.5%
− Adjusted Free Cash Flow increase of 17.4% to $50.2 million(2)
$192.1
$69.6
$42.7
$209.6
$76.6
$50.2
Total Revenue Adjusted EBITDA Adjusted EPS Adjusted Free Cash Flow
Q1 FY 17Q1 FY 16
9.1%
10.0%
13.5% 17.4%
$0.52 $0.59
(2) (2) (2)
Dollar values in millions, except per share data.

Q1 FY 17 Q1 FY 16 % Chg
Total Revenue 209.6$ 192.1$ 9.1%
Gross Margin 121.6 112.2 8.3%
% Margin 58.0% 58.4%
A&P 27.6 26.4 4.6%
% Total Revenue 13.2% 13.8%
Adjusted G&A(2) 17.3 16.2 7.1%
% Total Revenue 8.3% 8.4%
Adjusted EBITDA(2) 76.6$ 69.6$ 10.0%
% Margin 36.6% 36.2%
Adjusted Net Income(2) 31.4$ 27.4$ 14.7%
Adjusted Earnings Per Share(2) 0.59$ 0.52$ 13.5%
Revenue growth of +9.1%
– Organic growth of approximately 1% excluding the impact of Fx
– DenTek contributed $16.6 million of Revenue during the quarter
Gross Margin of 58.0%
A&P 13.2% of Revenue, $1.2 million more than Q1 FY 16
Adjusted EBITDA Margin of 36.6%(2)
Adjusted Net Income +14.7%(2) over Q1 FY16, ahead of topline growth
Dollar values in millions, except per share data.
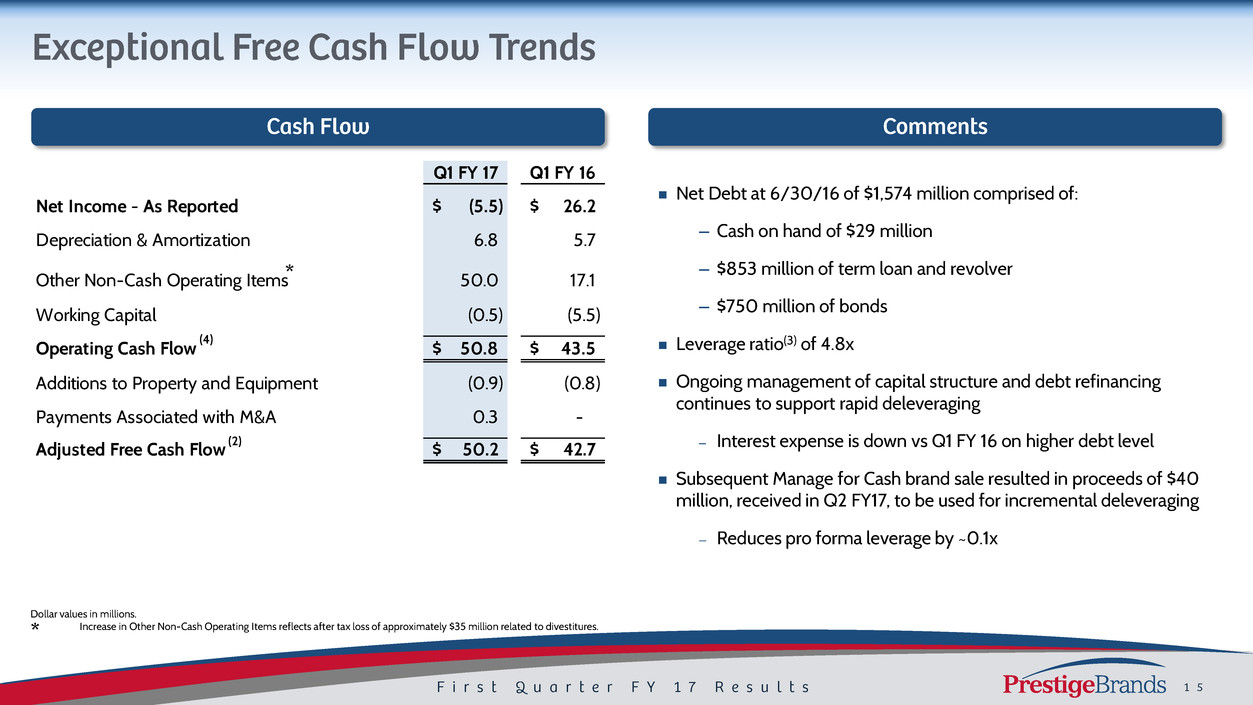
Q1 FY 17 Q1 FY 16
Net Income - As Reported (5.5)$ 26.2$
Depreciation & Amortization 6.8 5.7
Other Non-Cash Operating Items 50.0 17.1
Working Capital (0.5) (5.5)
Operating Cash Flow 50.8$ 43.5$
Additions to Property and Equipment (0.9) (0.8)
Payments Associated with M&A 0.3 -
Adjusted Free Cash Flow 50.2$ 42.7$
Net Debt at 6/30/16 of $1,574 million comprised of:
– Cash on hand of $29 million
– $853 million of term loan and revolver
– $750 million of bonds
Leverage ratio(3) of 4.8x
Ongoing management of capital structure and debt refinancing
continues to support rapid deleveraging
– Interest expense is down vs Q1 FY 16 on higher debt level
Subsequent Manage for Cash brand sale resulted in proceeds of $40
million, received in Q2 FY17, to be used for incremental deleveraging
– Reduces pro forma leverage by ~0.1x
(4)
(2)
Dollar values in millions.
Increase in Other Non-Cash Operating Items reflects after tax loss of approximately $35 million related to divestitures.*
*
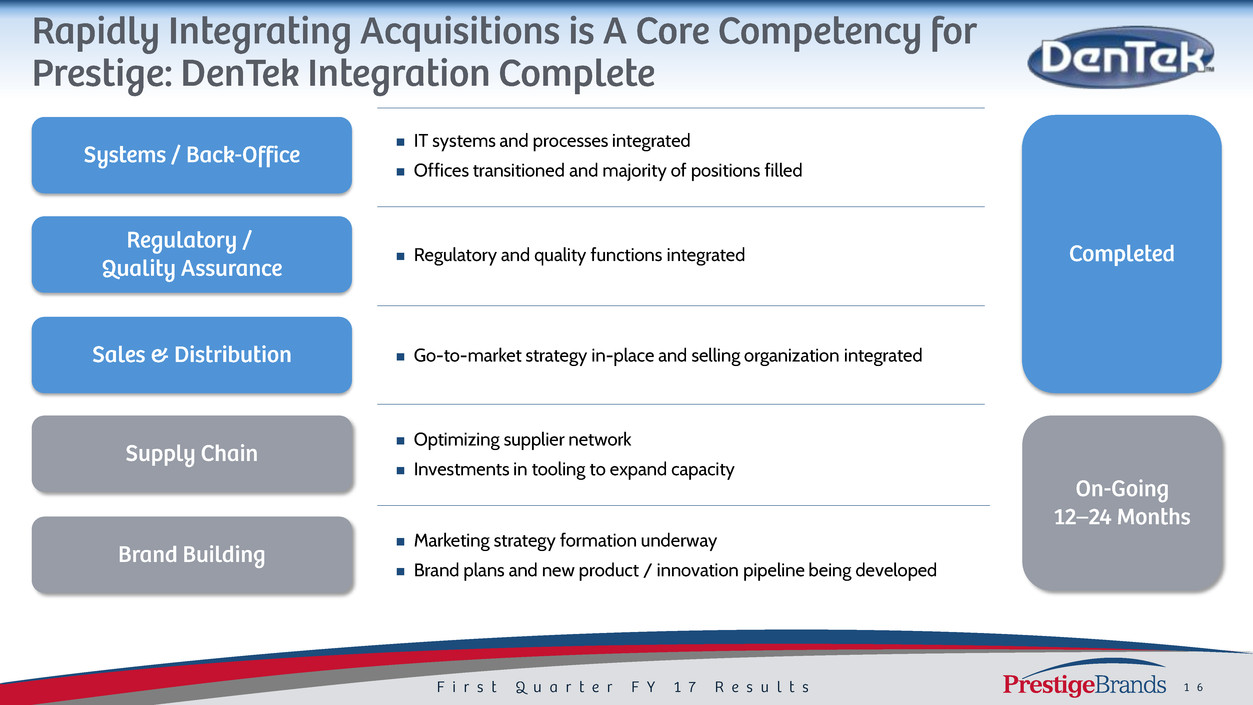
IT systems and processes integrated
Offices transitioned and majority of positions filled
Regulatory and quality functions integrated
Go-to-market strategy in-place and selling organization integrated
Optimizing supplier network
Investments in tooling to expand capacity
Marketing strategy formation underway
Brand plans and new product / innovation pipeline being developed
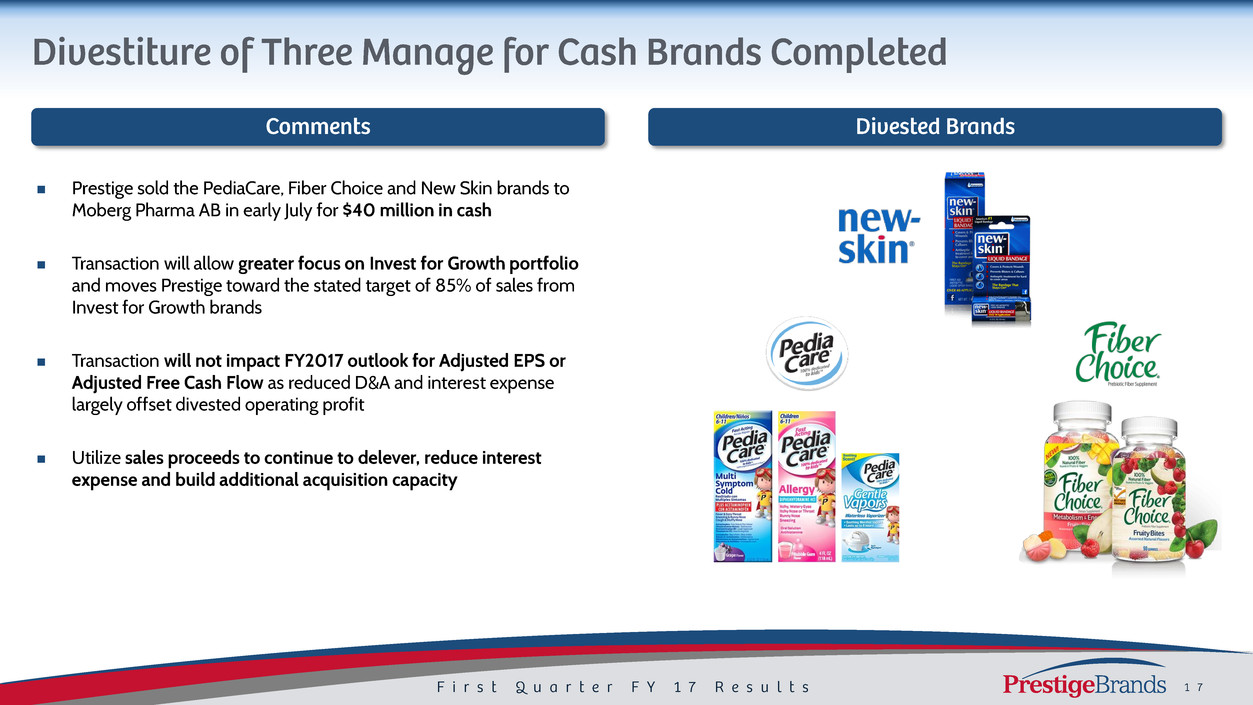
Prestige sold the PediaCare, Fiber Choice and New Skin brands to
Moberg Pharma AB in early July for $40 million in cash
Transaction will allow greater focus on Invest for Growth portfolio
and moves Prestige toward the stated target of 85% of sales from
Invest for Growth brands
Transaction will not impact FY2017 outlook for Adjusted EPS or
Adjusted Free Cash Flow as reduced D&A and interest expense
largely offset divested operating profit
Utilize sales proceeds to continue to delever, reduce interest
expense and build additional acquisition capacity

Ill. FY 17 Outlook and the Road Ahead
Dramamine· Co 41BM#@R+
Cli!Gr
eyes®
MONISTAT�
� (§$1,ffl
Go!'!1f.!-'!!ne Debrox· Ca re
na
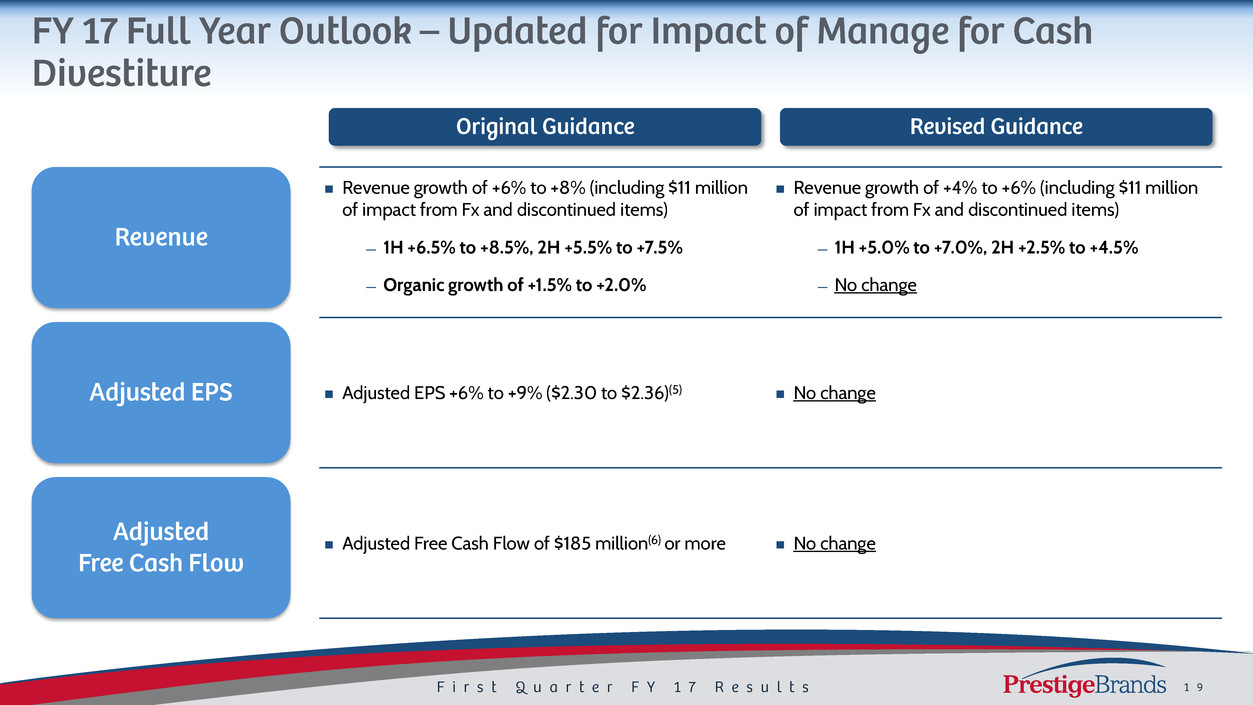
Revenue growth of +6% to +8% (including $11 million
of impact from Fx and discontinued items)
— 1H +6.5% to +8.5%, 2H +5.5% to +7.5%
— Organic growth of +1.5% to +2.0%
Revenue growth of +4% to +6% (including $11 million
of impact from Fx and discontinued items)
— 1H +5.0% to +7.0%, 2H +2.5% to +4.5%
— No change
Adjusted EPS +6% to +9% ($2.30 to $2.36)(5) No change
Adjusted Free Cash Flow of $185 million(6) or more No change

Continue Invest for Growth market share expansion with strong momentum heading into Q2
Increase digital investments
Focus on new product development and marketing innovation
Expand focus on developing professional marketing
Focus on all channels of distribution including c-store, dollar, and e-commerce
Integration completed
Executing on A&P plan, set stage for continued long term growth
Prioritize and invest in new product pipeline
Manage for Cash brand divestitures consistent with stated strategy and accretive to organic growth
Rapid deleveraging and increasing M&A capacity expected in FY 17
Opportunity set consistent with long term trends
Committed to aggressive and disciplined M&A strategy

Care
First �u arter FY 17 Results �21
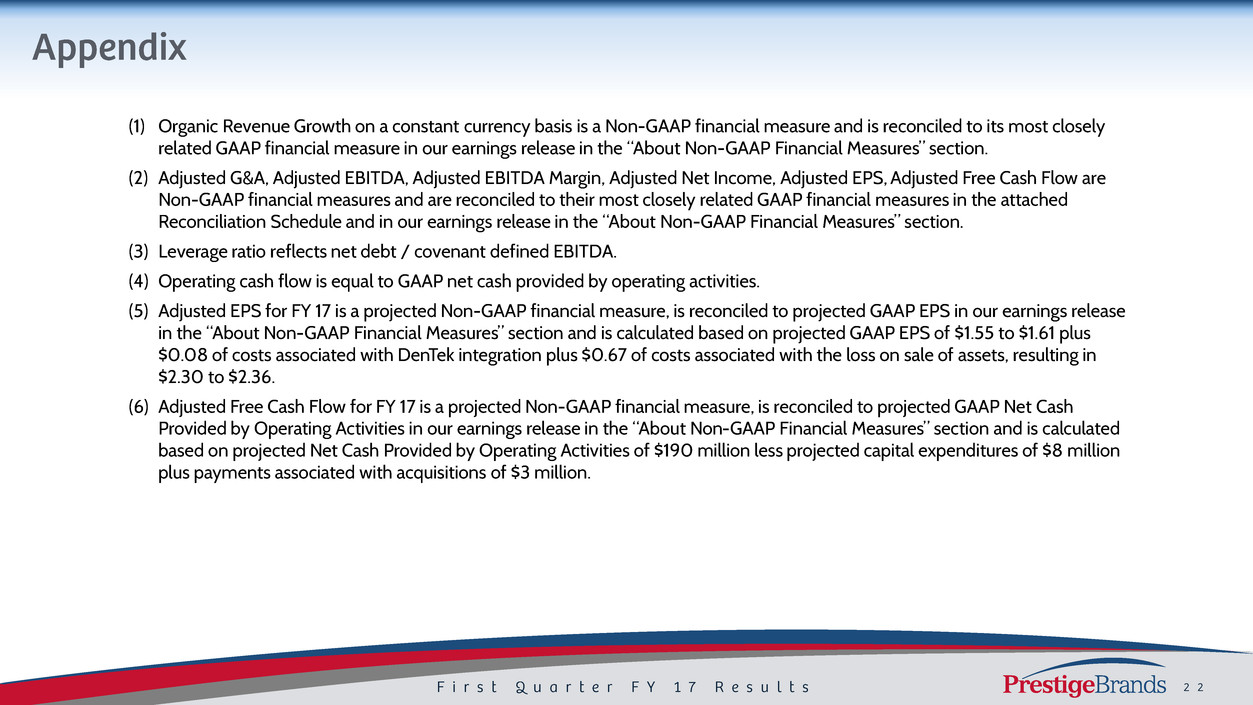
(1) Organic Revenue Growth on a constant currency basis is a Non-GAAP financial measure and is reconciled to its most closely
related GAAP financial measure in our earnings release in the “About Non-GAAP Financial Measures” section.
(2) Adjusted G&A, Adjusted EBITDA, Adjusted EBITDA Margin, Adjusted Net Income, Adjusted EPS, Adjusted Free Cash Flow are
Non-GAAP financial measures and are reconciled to their most closely related GAAP financial measures in the attached
Reconciliation Schedule and in our earnings release in the “About Non-GAAP Financial Measures” section.
(3) Leverage ratio reflects net debt / covenant defined EBITDA.
(4) Operating cash flow is equal to GAAP net cash provided by operating activities.
(5) Adjusted EPS for FY 17 is a projected Non-GAAP financial measure, is reconciled to projected GAAP EPS in our earnings release
in the “About Non-GAAP Financial Measures” section and is calculated based on projected GAAP EPS of $1.55 to $1.61 plus
$0.08 of costs associated with DenTek integration plus $0.67 of costs associated with the loss on sale of assets, resulting in
$2.30 to $2.36.
(6) Adjusted Free Cash Flow for FY 17 is a projected Non-GAAP financial measure, is reconciled to projected GAAP Net Cash
Provided by Operating Activities in our earnings release in the “About Non-GAAP Financial Measures” section and is calculated
based on projected Net Cash Provided by Operating Activities of $190 million less projected capital expenditures of $8 million
plus payments associated with acquisitions of $3 million.
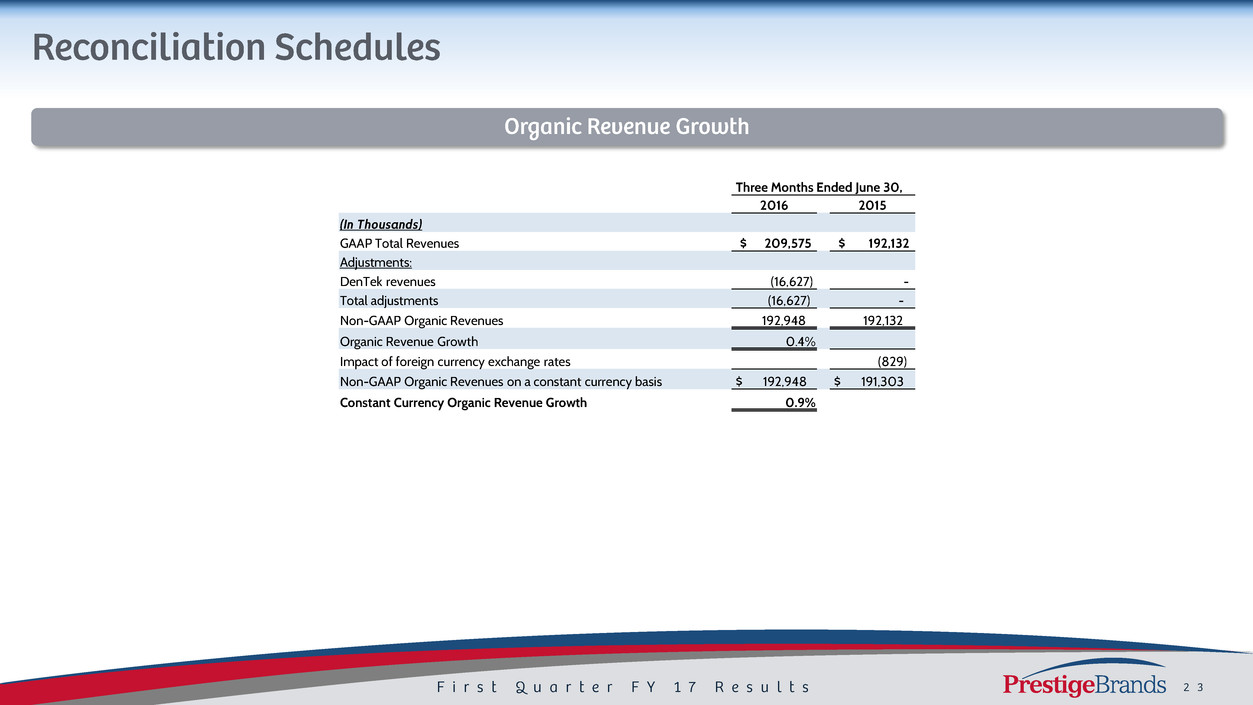
Three Months Ended June 30,
2016 2015
(In Thousands)
GAAP Total Revenues $ 209,575 $ 192,132
Adjustments:
DenTek revenues (16,627) -
Total adjustments (16,627) -
Non-GAAP Organic Revenues 192,948 192,132
Organic Revenue Growth 0.4%
Impact of foreign currency exchange rates (829)
Non-GAAP Organic Revenues on a constant currency basis $ 192,948 $ 191,303
Constant Currency Organic Revenue Growth 0.9%
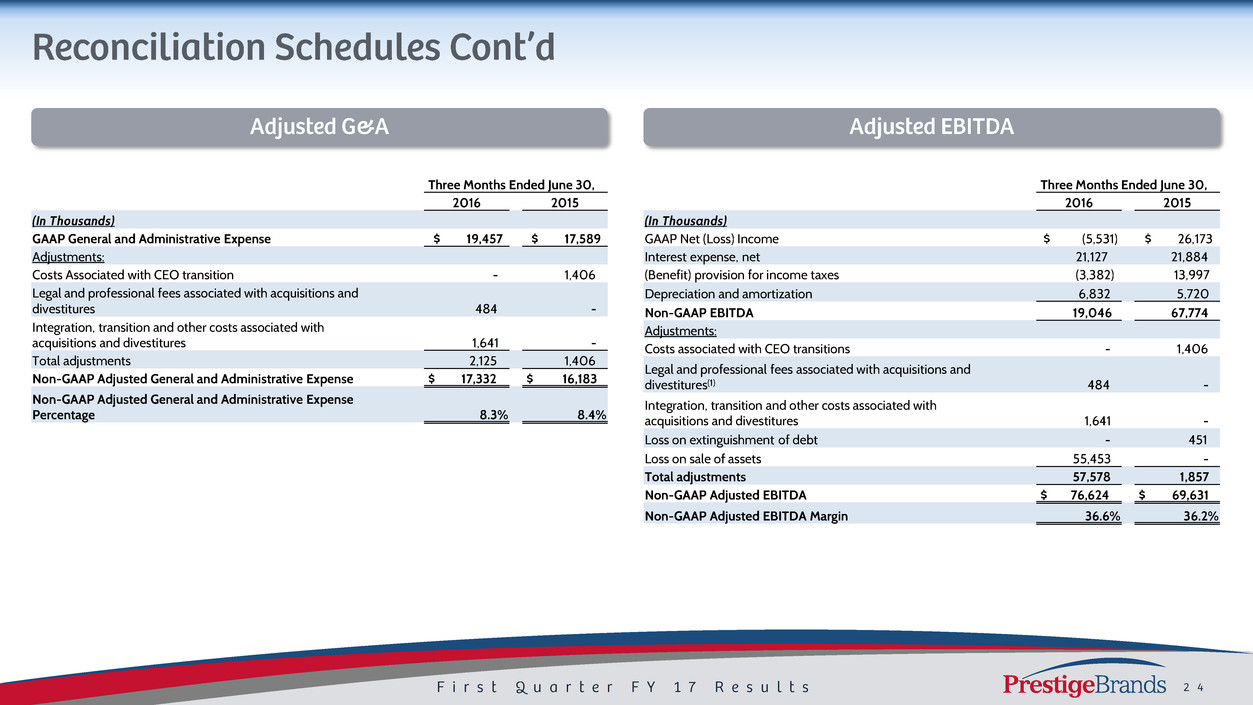
Three Months Ended June 30,
2016 2015
(In Thousands)
GAAP General and Administrative Expense $ 19,457 $ 17,589
Adjustments:
Costs Associated with CEO transition - 1,406
Legal and professional fees associated with acquisitions and
divestitures 484 -
Integration, transition and other costs associated with
acquisitions and divestitures 1,641 -
Total adjustments 2,125 1,406
Non-GAAP Adjusted General and Administrative Expense $ 17,332 $ 16,183
Non-GAAP Adjusted General and Administrative Expense
Percentage 8.3% 8.4%
Three Months Ended June 30,
2016 2015
(In Thousands)
GAAP Net (Loss) Income $ (5,531) $ 26,173
Interest expense, net 21,127 21,884
(Benefit) provision for income taxes (3,382) 13,997
Depreciation and amortization 6,832 5,720
Non-GAAP EBITDA 19,046 67,774
Adjustments:
Costs associated with CEO transitions - 1,406
Legal and professional fees associated with acquisitions and
divestitures(1) 484 -
Integration, transition and other costs associated with
acquisitions and divestitures 1,641 -
Loss on extinguishment of debt - 451
Loss on sale of assets 55,453 -
Total adjustments 57,578 1,857
Non-GAAP Adjusted EBITDA $ 76,624 $ 69,631
Non-GAAP Adjusted EBITDA Margin 36.6% 36.2%

Three Months Ended June 30,
2016 2015
Net Income EPS Net Income EPS
(In Thousands)
GAAP Net (Loss) Income $ (5,531) $(0.10) $ 26,173 $ 0.49
Adjustments:
Costs associated with CEO transition - - 1,406 0.03
Legal and professional fees associated with
acquisitions and divestitures 484 0.01 - -
Integration, transition and other costs associated
with acquisitions and divestitures 1,641 0.03 - -
Loss on extinguishment of debt - - 451 0.01
Loss on sale of assets 55,453 1.04 - -
Tax impact of adjustments (20,658) (0.39) (657) (0.01)
Total Adjustments 36,920 0.69 1,200 0.03
Non-GAAP Adjusted Net Income and Adjusted EPS $ 31,389 $ 0.59 $ 27,373 $ 0.52
Three Months Ended June 30,
2016 2015
(In Thousands)
GAAP Net (Loss) Income $ (5,531) $ 26,173
Adjustments:
Adjustments to reconcile net (loss) income to net
cash provided by operating activities as shown in
the Statement of Cash Flows 56,796 22,856
Changes in operating assets and liabilities, net of
effects from acquisitions as shown in the
Statement of Cash Flows (514) (5,508)
Total Adjustments 56,282 17,348
GAAP Net cash provided by operating activities 50,751 43,521
Purchase of property and equipment (895) (780)
Non-GAAP Free Cash Flow 49,856 42,741
Integration, transition and other payments
associated with acquisitions and divestitures 331 -
Non-GAAP Adjusted Free Cash Flow $ 50,187 $ 42,741

2017 Projected EPS
Low High
Projected FY'17 GAAP EPS $ 1.55 $ 1.61
Adjustments:
Costs associated with DenTek integration 0.08 0.08
Loss on sale of assets 0.67 0.67
Total Adjustments 0.75 0.75
Projected Non-GAAP Adjusted EPS $ 2.30 $ 2.36
2017
Projected
Free Cash
Flow
(In millions)
Projected FY'17 GAAP Net Cash provided by operating activities $ 190
Additions to property and equipment for cash (8)
Projected Non-GAAP Free Cash Flow 182
Payments associated with acquisitions 3
Adjusted Non-GAAP Projected Free Cash Flow 185
