Attached files
| file | filename |
|---|---|
| 8-K - COTT CORPORATION 8-K - Primo Water Corp /CN/ | cott8k.htm |
 |
 |
CONTACT:
Jarrod Langhans
Investor Relations
Tel: (813) 313-1732
Investorrelations@cott.com
COTT ANNOUNCES ACQUISITION OF S&D COFFEE AND TEA, REPORTS SECOND QUARTER 2016 RESULTS AND DECLARES DIVIDEND
(Unless stated otherwise, all second quarter 2016 comparisons are relative to the second quarter of 2015; all information is in U.S. dollars.)
TORONTO, ON and TAMPA, FL – August 4, 2016 – Cott Corporation (NYSE:COT; TSX:BCB) today announced its results for the second quarter ended July 2, 2016, and also announced that it has entered into a definitive stock purchase agreement to acquire S&D Coffee, Inc. ("S&D"), a premium coffee roaster and provider of customized coffee, tea, and extract solutions to the foodservice, convenience, gas, hospitality and office segments in the United States. The purchase price is approximately $355 million, on a debt and cash free basis, and represents a high 6X post synergy adjusted EBITDA multiple. Ron Hinson, S&D's Chief Executive Officer, and S&D's leadership team, have agreed to join Cott and continue to lead the S&D business.
SECOND QUARTER 2016 HIGHLIGHTS
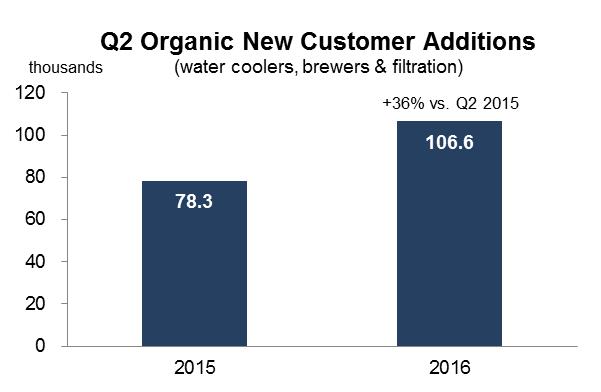
| · | DS Services achieved a 36% increase in organic new customer additions in the United States. |
| · | Cott North America actual case volume increased by 4% due primarily to 10% growth in the sparkling water and mixer category and 15% growth in contract manufacturing, offset in part by declines in carbonated soft drinks and shelf stable juices. |
| · | Gross profit increased to $253 million and gross margin was 33.0% compared to gross profit of $241 million and gross margin of 30.9%. |
| · | With the addition of Eden Springs, and following the S&D transaction, fiscal 2019 operating cash flow is projected to be approximately $395 to $435 million and capital expenditures are expected to be in the range of $160 to $170 million, resulting in adjusted free cash flow of approximately $225 to $275 million. |
|
|
|
"I am very pleased with another quarter of exceptional new customer additions across our entire U.S. Home and Office business as well as the overall increase in our gross margin and free cash flow," commented Jerry Fowden, Cott's Chief Executive Officer. "During the quarter we invested $4 million behind home and office customer programs which helped drive a 36% increase in new customer adds," continued Mr. Fowden.
S&D COFFEE & TEA ACQUISITION
"The S&D acquisition is another great step in our stated strategy to enhance our existing home and office water delivery, coffee, tea and filtration businesses where we believe our platform, operating strength and synergies can be leveraged. The addition of S&D brings our Better for You beverage platform to over 65% of our adjusted EBITDA on a pro forma basis with carbonated soft drinks representing just 12% of adjusted EBITDA," commented Jerry Fowden, Cott's Chief Executive Officer. "After closing the S&D acquisition, we will have a leading position in the coffee and tea foodservice industry in North America, which is an excellent complement to our leading HOD water, office coffee and filtration business," continued Mr. Fowden.
"S&D was started in 1927 with a vision to produce quality coffee for the local area and has grown over the last 89 years to become a leading premier, national provider of quality coffee, tea and extracts for multiple channels," said Ron Hinson, S&D's Chief Executive Officer. "In order to take the next step in our journey we wanted to find the right partner to support our future growth. In sharing our values and desire to further expand our category leadership in coffee, tea and liquid extracts, we found Cott to be the ideal partner for our business," continued Mr. Hinson.
S&D is a growing business with over $550 million in estimated 2016 revenues. The acquisition broadens the distribution platform of Cott's existing DS Services coffee business in the United States by adding a leading scale platform with in-house roasting, grinding and blending capabilities alongside a national distribution system. Consistent with Cott's strategy, the acquisition is expected to be accretive to cash flow from operations and adjusted free cash flow (excluding acquisition, integration and transaction costs) in its first full year and provide a cash-on-cash IRR above its cost of equity.
2
|
|
|
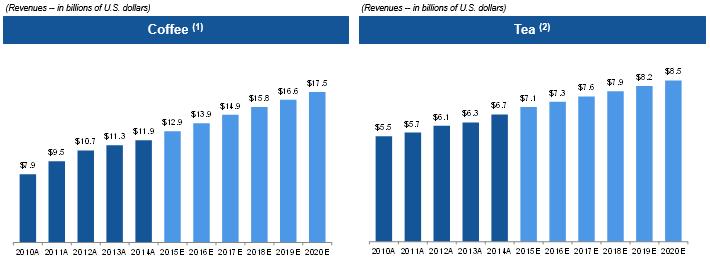
S&D Operates in Growing Markets within the United States
|
___________________________
Source: Mintel Group Ltd.
(1) Includes roasted, single-cup, instant, ready-to-drink and cold-brew, and refrigerated cold-brew / concentrate U.S. coffee retail sales at current prices; projections exclude refrigerated cold-brew / concentrate coffee retail sales. Excludes wholesale revenue.
(2) Includes canned / bottled, refrigerated, bagged / loose leaf, and single-cup U.S. tea sales at current prices. Excludes wholesale revenue.
|
Compelling Strategic Rationale
The acquisition of S&D is in line with Cott's strategy of focusing on acquiring cash accretive businesses with higher growth while continuing Cott's beverage diversification outside of carbonated soft drinks, shelf stable juices and large format retail. The acquisition is expected to:
| · | Provide a growing, leading position in coffee, tea and liquid extracts in the United States; |
| · | Continue Cott's shift to higher growth categories; |
| · | Provide approximately $12 million of run-rate procurement cost, distribution and other synergies achieved over a four year period; |
| · | Serve as a platform for smaller accretive acquisitions; |
| · | Improve Cott's channel mix outside of large format retail and supermarket stores; |
| · | Offer cross selling and vertical integration opportunities to leverage DS Services' and Cott's products; and |
| · | Reduce customer concentration. |
Tom Harrington, Chief Executive Officer of DS Services, commented, "We are very excited about expanding our coffee and tea platform in the United States with the addition of a growing, leading coffee and tea business with its own custom roasting capabilities. We believe the acquisition of S&D will provide meaningful benefits from our combined procurement efficiencies, vertical integration and distribution networks, as well as increased management expertise to create a stronger, cash generating, growth oriented service platform throughout North America."
3
|
|
|
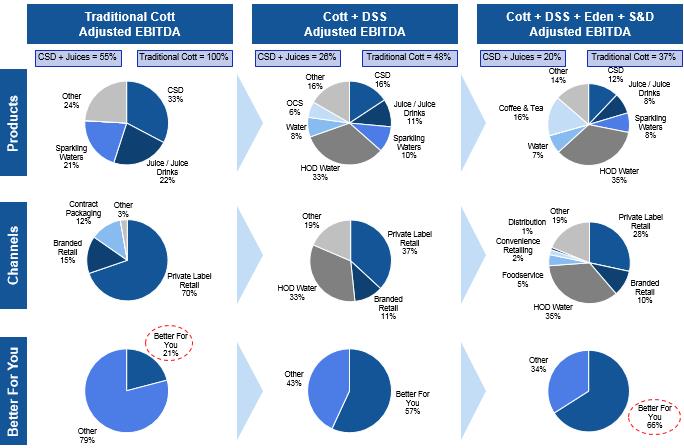
S&D Improves Cott's Product and Channel Mix (1)

|
___________________________
Note: Financials based on FY 2015.
Terms: Home and Office Delivery ("HOD"), Office Coffee Services ("OCS") and Carbonated Soft Drinks ("CSD").
Other product category includes concentrates, Eden Springs's filtration services and other. Sparkling waters includes mixers
Other channels include contract packaging, OCS and other
Better For You platform includes HOD Water, Water, Coffee & Tea and Sparkling Waters / Mixers
Source: Company information, Management estimates
|
4
|
|
|
|
___________________________
Note: Financials based on FY 2015
Terms: Home and Office Delivery ("HOD"), Office Coffee Services ("OCS") and Carbonated Soft Drinks ("CSD").
Other product category includes concentrates, Eden Springs's filtration services and other. Sparkling waters includes mixers
Other channels include contract packaging, OCS and other
Better For You platform includes HOD Water, Water, Coffee & Tea and Sparkling Waters / Mixers
Source: Company information, Management estimates
(1) 2015 Adjusted EBITDA allocated based upon pro-rata revenues by product category and channel between DS Services (HOD Water, OCS, Water and Other), Traditional Cott (CSD, Juice/Juice Drinks, Sparkling Waters and Other), Eden (HOD Water, OCS, Water and Other) and S&D (Coffee & Tea).
|
Transaction Highlights
The combination is expected to be accretive to cash flow from operations and in turn to adjusted free cash flow (excluding acquisition, integration and transaction costs) in the first full year. The transaction will be funded through a combination of incremental borrowings under Cott's ABL facility and cash on hand. The acquisition, which is expected to close in August 2016, is subject to certain customary closing conditions and purchase price adjustments. SunTrust Robinson Humphrey, Inc. acted as financial advisor to Cott. Additional financial information and a modeling call will be presented on August 17, 2016 which will incorporate modeling information on both S&D and Eden Springs. Further details are set forth below.
5
|
|
|
SECOND QUARTER 2016 GLOBAL PERFORMANCE
| - | Net cash provided by operating activities of $87 million less $33 million of capital expenditures resulted in free cash flow of $54 million, representing an $8 million, or 19%, improvement over the prior year comparable period. |
| - | Revenue of $765 million was lower by 2% (broadly flat on a foreign exchange neutral basis) as a result of the mix shift from private label to contract manufacturing and the competitive landscape in our traditional business, offset by the growth of DS Services and the addition of the Aquaterra business. |
|
Revenue Bridge
|
||||
|
2015 Q2 Revenue
|
$
|
779.8
|
||
|
Aquaterra
|
16.8
|
|||
|
Growth/Volume
|
3.9
|
|||
|
Energy surcharge
|
(1.6
|
)
|
||
|
Foreign exchange impact
|
(12.6
|
)
|
||
|
Price/Mix
|
(21.3
|
)
|
||
|
2016 Q2 Revenue
|
$
|
765.0
|
||
| - | Gross profit increased 5% to $253 million, with gross margin of 33.0% compared to 30.9%, driven primarily by the ongoing operational leverage at DS Services, the addition of the Aquaterra business, and cost and efficiency initiatives within our traditional business, offset in part by the negative impact of foreign exchange rates, increased operational costs and reduced U.K. volumes. |
| - | Reported net income and net income per diluted share were $7 million and $0.06, respectively, compared to reported net income and net income per diluted share of $2 million and $0.02, respectively. Adjusted net income and adjusted net income per diluted share were $19 million and $0.15, respectively, compared to adjusted net income of $18 million and adjusted net income per diluted share of $0.18. |
| - | Adjusted EBITDA of $105 million was lower by 3% (after investing $4 million behind home and office customer programs and $4 million of adverse foreign exchange impact) compared to $108 million. Reported EBITDA was $87 million compared to $103 million in the prior year driven primarily by financing and acquisition related costs associated with the acquisition of Eden Springs. |
SECOND QUARTER 2016 REPORTING SEGMENT PERFORMANCE
| - | DS Services achieved a 36% increase in organic new customer additions in the United States. Revenue increased 7% to $276 million due primarily to the addition of the Aquaterra business. Revenue on an energy surcharge neutral basis increased 8% (1% excluding Aquaterra as growth in home and office delivery water, single cup coffee delivery and retail sales was offset by reduced sales in traditional brew basket coffee). DS Services gross profit increased by 9% to $171 million while gross profit as a percentage of revenue increased to 62.0% from 60.7%. DS Services operating income increased to $18 million from $13 million. DS Services adjusted EBITDA increased to $50 million compared to $49 million, as DS Services growth and synergies were largely offset by $4 million of investment behind home and office customer programs. |
6
|
|
|
|
DS Services Revenue Bridge
|
||||
|
2015 Q2 Revenue
|
$
|
257.0
|
||
|
Aquaterra
|
16.8
|
|||
|
Growth
|
3.5
|
|||
|
Energy surcharge
|
(1.6
|
)
|
||
|
2016 Q2 Revenue
|
$
|
275.7
|
||
7
|
|
|
| - | Cott North America volume increased 4% in actual cases due primarily to 10% growth in the sparkling water and mixer category and 15% growth in contract manufacturing, offset in part by declines in carbonated soft drinks and shelf stable juices. Servings decreased by 1% with 5% growth in the sparkling water and mixer category and 10% growth in contract manufacturing, offset by declines in private label carbonated soft drinks and shelf stable juices. Revenue was lower by 3% (lower by 2% on a foreign exchange neutral basis) at $349 million due primarily to an overall product mix shift into contract manufacturing. Gross profit as a percentage of revenue increased to 15.1% compared to 14.8% due primarily to operational leverage associated with increased volumes offset in part by the negative impact of foreign exchange rates and increased manufacturing costs. |
|
Cott North America Revenue Bridge
|
||||
|
2015 Q2 Revenue
|
$
|
359.0
|
||
|
Growth/Volume
|
12.3
|
|||
|
Foreign exchange impact
|
(2.5
|
)
|
||
|
Price/Mix
|
(19.6
|
)
|
||
|
2016 Q2 Revenue
|
$
|
349.2
|
||
| - | U.K. volume decreased 12% in actual cases and 8% in servings. Revenue decreased 14% (8% on a foreign exchange neutral basis) to $132 million due primarily to the competitive landscape and adverse foreign exchange impact. Gross profit as a percentage of revenue increased to 18.2% from 16.6% due primarily to lower inventory levels and tighter cost controls. |
8
|
|
|
2016 FULL YEAR FREE CASH FLOW OUTLOOK
Cott (excluding Eden Springs and S&D) has targeted full year 2016 cash flow from operations of approximately $255 to $265 million and capital expenditures in the range of $120 to $125 million, resulting in adjusted free cash flow of $135 to $145 million. If the post-Brexit adverse foreign exchange rates persist, Cott anticipates that actual adjusted free cash flow would fall within the lower end of the guided range.
DECLARATION OF DIVIDEND
Cott's Board of Directors has declared a dividend of $0.06 per share on common shares, payable in cash on September 7, 2016 to shareowners of record at the close of business on August 25, 2016.
SECOND QUARTER RESULTS CONFERENCE CALL
Cott Corporation will host a conference call today, August 4, 2016, at 10:00 a.m. EDT, to discuss second quarter results, which can be accessed as follows:
North America: (877) 723-9522
International: (719) 325-4768
Passcode: 2383409
A live audio webcast will be available through Cott's website at http://www.cott.com. The earnings conference call will be recorded and archived for playback on the investor relations section of the website for a period of two weeks following the event.
ACQUISITION MODELING CONFERENCE CALL
Cott Corporation will host a conference call to provide financial modeling information regarding the Eden Springs and S&D acquisitions on Wednesday, August 17, 2016 at 10:00 a.m. Eastern Time. The call will end no later than 12:00 p.m. Eastern Time. Participating in the conference call will be Jerry Fowden, Cott Chief Executive Officer, Jay Wells, Cott Chief Financial Officer, and Tom Harrington, DS Services Chief Executive Officer.
Financial Modeling Conference Call
North America: (888) 461-2011
International: (719) 325-2237
International: (719) 325-2237
Passcode: 4121440
This is a live, listen-only dial-in telephone line.
Webcast
A live audio webcast will be available through the Company's website at http://www.cott.com. The webcast will be recorded and archived for playback on the investor relations section of the website for two weeks following the event. A copy of the slide presentation that will be used on the call will be available through Cott's website prior to the call on August 17, 2016.
A live audio webcast will be available through the Company's website at http://www.cott.com. The webcast will be recorded and archived for playback on the investor relations section of the website for two weeks following the event. A copy of the slide presentation that will be used on the call will be available through Cott's website prior to the call on August 17, 2016.
9
|
|
|
ABOUT COTT CORPORATION
With the acquisitions of DS Services of America, Inc. and Eden Springs, Cott has combined leading providers in the direct-to-consumer beverage services industry with its traditional business, one of the world's largest producers of beverages on behalf of retailers, brand owners and distributors. Cott now has the largest volume-based national presence in the North American and European home and office delivery industry for bottled water and one of the five largest national market share positions in the U.S. and European office coffee services and filtration services industries. Cott reaches over 2.3 million customers through routes located across North America and Europe supported by strategically located sales and distribution facilities, and fleet. Cott's broad portfolio allows it to offer, on a direct-to-consumer basis, a variety of bottled water, coffee, brewed tea, water dispensers, coffee and tea brewers and filtration equipment. Cott believes it has the broadest distribution network in the direct-to-consumer beverage services industry in North America and Europe, which enables it to efficiently service residences and small and medium size businesses, as well as large corporations, universities and government agencies.
Non-GAAP Measures
To supplement its reporting of financial measures determined in accordance with GAAP, Cott utilizes certain non-GAAP financial measures. Cott excludes from GAAP revenue the impact of foreign exchange and the impact of energy surcharges to separate the impact of currency exchange rate changes and energy surcharges from Cott's results of operations. Cott utilizes adjusted pre-tax income (loss), adjusted net income (loss), adjusted earnings (loss) per diluted share, and EBITDA and adjusted EBITDA (on a global, and in some cases, business unit, basis) to separate the impact of certain items from the underlying business. Because Cott uses these adjusted financial results in the management of its business, management believes this supplemental information is useful to investors for their independent evaluation and understanding of Cott's underlying business performance and the performance of its management. Additionally, Cott supplements its reporting of net cash provided by (used in) operating activities determined in accordance with GAAP by excluding capital expenditures to present free cash flow, and by excluding cash collateral deposits to present adjusted free cash flow, which management believes provides useful information to investors about the amount of cash generated by the business that, after the acquisition of property and equipment as well as after bond redemption costs, can be used for strategic opportunities, including investing in our business, making strategic acquisitions, paying dividends, and strengthening the balance sheet. With respect to our expectations of performance of S&D as it is being integrated, reconciliations of first year free cash flow accretion and adjusted free cash flow accretion are not available, as we are unable to quantify certain amounts that would be required to be included in the relevant GAAP measures without unreasonable effort. We expect that the unavailable reconciling items, which primarily include transaction and integration costs, phasing of capital expenditures and date of closing, could significantly affect our financial results. These items depend on highly variable factors and any such reconciliations would imply a degree of precision that would be confusing or misleading to investors. We expect the variability of these factors to have a significant, and potentially unpredictable, impact on our future GAAP financial results. The non-GAAP financial measures described above are in addition to, and not meant to be considered superior to, or a substitute for, Cott's financial statements prepared in accordance with GAAP. In addition, the non-GAAP financial measures included in this earnings announcement reflect management's judgment of particular items, and may be different from, and therefore may not be comparable to, similarly titled measures reported by other companies.
10
|
|
|
Safe Harbor Statements
This press release contains forward-looking statements within the meaning of Section 27A of the Securities Act of 1933 and Section 21E of the Securities Exchange Act of 1934 conveying management's expectations as to the future based on plans, estimates and projections at the time Cott makes the statements. Forward-looking statements involve inherent risks and uncertainties and Cott cautions you that a number of important factors could cause actual results to differ materially from those contained in any such forward-looking statement. The forward-looking statements contained in this press release include, but are not limited to, statements related to the completion of the S&D transaction on the terms proposed, the anticipated financing of the S&D transaction on the terms proposed and on the anticipated timeline, expected synergies and contribution to Cott's performance, the execution of our strategic priorities, future financial and operating trends and results (including guidance related to 2016 and 2019 adjusted free cash flow) and related matters. The forward-looking statements are based on assumptions regarding management's current plans and estimates. Management believes these assumptions to be reasonable but there is no assurance that they will prove to be accurate.
11
|
|
|
Factors that could cause actual results to differ materially from those described in this press release include, among others: our ability to compete successfully in the markets in which we operate; changes in consumer tastes and preferences for existing products and our ability to develop and timely launch new products that appeal to such changing consumer tastes and preferences; a loss of or a reduction in business in our traditional business with key customers, particularly Walmart; consolidation of retail customers; fluctuations in commodity prices and our ability to pass on increased costs to our customers, and the impact of those increased prices on our volumes; our ability to manage our operations successfully; our ability to fully realize the potential benefit of acquisitions or other strategic opportunities that we pursue; our ability to realize the expected benefits of the acquisition of DS Services, the Eden Springs acquisition and the S&D acquisition, because of integration difficulties and other challenges; the limited nature of our indemnification rights under the DS Services, Eden Springs and S&D acquisition agreements; the incurrence of substantial indebtedness to finance the DS Services, Eden Springs and S&D acquisitions; our exposure to intangible asset risk; currency fluctuations that adversely affect the exchange between the U.S. dollar and the British pound sterling, the Euro, the Canadian dollar, the Mexican peso and other currencies; our ability to maintain favorable arrangements and relationships with our suppliers; our substantial indebtedness and our ability to meet our obligations under our debt agreements, and risks of further increases to our indebtedness; our ability to maintain compliance with the covenants and conditions under our debt agreements; fluctuations in interest rates, which could increase our borrowing costs; credit rating changes; the impact of global financial events on our financial results; our ability to fully realize the expected cost savings and/or operating efficiencies from our restructuring activities; any disruption to production at our beverage concentrates or other manufacturing facilities; our ability to maintain access to our water sources; our ability to adequately address the challenges and risks associated with our international operations and acquisition strategy and address difficulties in complying with laws and regulations including the U.S. Foreign Corrupt Practices Act and the U.K. Bribery Act of 2010; our ability to protect our intellectual property; compliance with product health and safety standards; liability for injury or illness caused by the consumption of contaminated products; liability and damage to our reputation as a result of litigation or legal proceedings; changes in the legal and regulatory environment in which we operate; the impact of proposed taxes on soda and other sugary drinks; enforcement of compliance with the Ontario Environmental Protection Act; the seasonal nature of our business and the effect of adverse weather conditions; the impact of national, regional and global events, including those of a political, economic, business and competitive nature; our ability to recruit, retain, and integrate new management; our ability to renew our collective bargaining agreements on satisfactory terms; disruptions in our information systems; our ability to securely maintain our customers' confidential or credit card information, or other private data relating to our employees or our company; our ability to use net operating losses to offset future taxable income; or our ability to maintain our quarterly dividend.
The foregoing list of factors is not exhaustive. Readers are cautioned not to place undue reliance on any forward-looking statements, which speak only as of the date hereof. Readers are urged to carefully review and consider the various disclosures, including but not limited to risk factors contained in Cott's Annual Report on Form 10-K and its quarterly reports on Form 10-Q, as well as other filings with the securities commissions. Cott does not undertake to update or revise any of these statements in light of new information or future events, except as expressly required by applicable law.
Website: www.cott.com
12
|
|
|
|
COTT CORPORATION
|
EXHIBIT 1
|
|||||||||||||||
|
CONSOLIDATED STATEMENTS OF OPERATIONS
|
||||||||||||||||
|
(in millions of U.S. dollars, except share and per share amounts, U.S. GAAP)
|
||||||||||||||||
|
Unaudited
|
||||||||||||||||
|
For the Three Months Ended
|
For the Six Months Ended
|
|||||||||||||||
|
July 2, 2016
|
July 4, 2015
|
July 2, 2016
|
July 4, 2015
|
|||||||||||||
|
Revenue, net
|
$
|
765.0
|
$
|
779.8
|
$
|
1,463.4
|
$
|
1,489.6
|
||||||||
|
Cost of sales
|
512.4
|
539.2
|
996.8
|
1,047.7
|
||||||||||||
|
Gross profit
|
252.6
|
240.6
|
466.6
|
441.9
|
||||||||||||
|
Selling, general and administrative expenses
|
202.1
|
190.2
|
399.1
|
378.7
|
||||||||||||
|
Loss on disposal of property, plant & equipment, net
|
2.2
|
0.2
|
3.1
|
1.6
|
||||||||||||
|
Acquisition and integration expenses
|
11.7
|
4.1
|
13.1
|
8.8
|
||||||||||||
|
Operating income
|
36.6
|
46.1
|
51.3
|
52.8
|
||||||||||||
|
Other expense (income), net
|
3.0
|
1.0
|
0.8
|
(9.4
|
)
|
|||||||||||
|
Interest expense, net
|
27.0
|
27.9
|
54.8
|
55.6
|
||||||||||||
|
Income (loss) before income taxes
|
6.6
|
17.2
|
(4.3
|
)
|
6.6
|
|||||||||||
|
Income tax benefit
|
2.3
|
1.1
|
11.3
|
10.5
|
||||||||||||
|
Net income
|
$
|
8.9
|
$
|
18.3
|
$
|
7.0
|
$
|
17.1
|
||||||||
|
Less: Net income attributable to non-controlling interests
|
1.5
|
1.7
|
2.9
|
3.0
|
||||||||||||
|
Less: Accumulated dividends on convertible preferred shares
|
-
|
1.8
|
-
|
4.5
|
||||||||||||
|
Less: Accumulated dividends on non-convertible preferred shares
|
-
|
0.6
|
-
|
1.4
|
||||||||||||
|
Less: Foreign exchange impact on redemption of preferred shares
|
-
|
12.0
|
-
|
12.0
|
||||||||||||
|
Net income (loss) attributed to Cott Corporation
|
$
|
7.4
|
$
|
2.2
|
$
|
4.1
|
$
|
(3.8
|
)
|
|||||||
|
Net income (loss) per common share attributed to Cott Corporation
|
||||||||||||||||
|
Basic
|
$
|
0.06
|
$
|
0.02
|
$
|
0.03
|
$
|
(0.04
|
)
|
|||||||
|
Diluted
|
$
|
0.06
|
$
|
0.02
|
$
|
0.03
|
$
|
(0.04
|
)
|
|||||||
|
Weighted average common shares outstanding (in millions)
|
||||||||||||||||
|
Basic
|
123.2
|
99.6
|
118.3
|
96.4
|
||||||||||||
|
Diluted
|
124.2
|
100.2
|
119.0
|
96.4
|
||||||||||||
|
Dividends declared per common share
|
$
|
0.06
|
$
|
0.06
|
$
|
0.12
|
$
|
0.12
|
||||||||
13
|
|
|
|
COTT CORPORATION
|
EXHIBIT 2
|
|||||||
|
CONSOLIDATED BALANCE SHEETS
|
||||||||
|
(in millions of U.S. dollars, except share amounts, U.S. GAAP)
|
||||||||
|
Unaudited
|
||||||||
|
July 2, 2016
|
January 2, 2016
|
|||||||
|
ASSETS
|
||||||||
|
Current assets
|
||||||||
|
Cash & cash equivalents
|
$
|
249.5
|
$
|
77.1
|
||||
|
Restricted cash
|
503.1
|
-
|
||||||
|
Accounts receivable, net of allowance
|
339.5
|
293.3
|
||||||
|
Income taxes recoverable
|
0.9
|
1.6
|
||||||
|
Inventories
|
247.1
|
249.4
|
||||||
|
Prepaid expenses and other current assets
|
24.1
|
17.2
|
||||||
|
Total current assets
|
1,364.2
|
638.6
|
||||||
|
Property, plant & equipment, net
|
770.2
|
769.8
|
||||||
|
Goodwill
|
777.4
|
759.6
|
||||||
|
Intangibles and other assets, net
|
690.4
|
711.7
|
||||||
|
Deferred tax assets
|
12.8
|
7.6
|
||||||
|
Total assets
|
$
|
3,615.0
|
$
|
2,887.3
|
||||
|
LIABILITIES AND EQUITY
|
||||||||
|
Current liabilities
|
||||||||
|
Short-term borrowings
|
$
|
-
|
$
|
122.0
|
||||
|
Current maturities of long-term debt
|
3.6
|
3.4
|
||||||
|
Accounts payable and accrued liabilities
|
468.0
|
437.6
|
||||||
|
Total current liabilities
|
471.6
|
563.0
|
||||||
|
Long-term debt
|
2,013.3
|
1,525.4
|
||||||
|
Deferred tax liabilities
|
63.7
|
76.5
|
||||||
|
Other long-term liabilities
|
72.5
|
76.5
|
||||||
|
Total liabilities
|
2,621.1
|
2,241.4
|
||||||
|
Equity
|
||||||||
|
Common shares, no par - 137,860,725 shares issued (January 2, 2016 - 109,695,435 shares issued)
|
904.9
|
534.7
|
||||||
|
Additional paid-in-capital
|
54.6
|
51.2
|
||||||
|
Retained earnings
|
119.0
|
129.6
|
||||||
|
Accumulated other comprehensive loss
|
(90.8
|
)
|
(76.2
|
)
|
||||
|
Total Cott Corporation equity
|
987.7
|
639.3
|
||||||
|
Non-controlling interests
|
6.2
|
6.6
|
||||||
|
Total equity
|
993.9
|
645.9
|
||||||
|
Total liabilities and equity
|
$
|
3,615.0
|
$
|
2,887.3
|
||||
14
|
|
|
|
COTT CORPORATION
|
EXHIBIT 3
|
|||||||||||||||
|
CONSOLIDATED STATEMENTS OF CASH FLOWS
|
||||||||||||||||
|
(in millions of U.S. dollars)
|
||||||||||||||||
|
Unaudited
|
||||||||||||||||
|
For the Three Months Ended
|
For the Six Months Ended
|
|||||||||||||||
|
July 2, 2016
|
July 4, 2015
|
July 2, 2016
|
July 4, 2015
|
|||||||||||||
|
Operating Activities
|
||||||||||||||||
|
Net income
|
$
|
8.9
|
$
|
18.3
|
$
|
7.0
|
$
|
17.1
|
||||||||
|
Depreciation & amortization
|
53.5
|
58.2
|
106.0
|
115.6
|
||||||||||||
|
Amortization of financing fees
|
1.3
|
1.1
|
2.5
|
2.4
|
||||||||||||
|
Amortization of senior notes premium
|
(1.5
|
)
|
(1.4
|
)
|
(2.9
|
)
|
(2.9
|
)
|
||||||||
|
Share-based compensation expense
|
3.8
|
3.7
|
6.2
|
6.1
|
||||||||||||
|
Benefit for deferred income taxes
|
(2.1
|
)
|
(5.2
|
)
|
(12.9
|
)
|
(16.9
|
)
|
||||||||
|
Loss on disposal of property, plant & equipment, net
|
2.2
|
0.2
|
3.1
|
1.6
|
||||||||||||
|
Other non-cash items
|
2.6
|
(6.3
|
)
|
0.9
|
(16.5
|
)
|
||||||||||
|
Change in operating assets and liabilities, net of acquisitions:
|
||||||||||||||||
|
Accounts receivable
|
(25.7
|
)
|
(19.4
|
)
|
(47.4
|
)
|
(60.7
|
)
|
||||||||
|
Inventories
|
4.6
|
6.1
|
1.3
|
(4.9
|
)
|
|||||||||||
|
Prepaid expenses and other current assets
|
(3.4
|
)
|
(4.5
|
)
|
(7.8
|
)
|
25.8
|
|||||||||
|
Other assets
|
(1.2
|
)
|
(1.3
|
)
|
1.2
|
(3.7
|
)
|
|||||||||
|
Accounts payable and accrued liabilities, and other liabilities
|
44.6
|
25.2
|
14.6
|
10.0
|
||||||||||||
|
Income taxes recoverable
|
-
|
1.0
|
(2.9
|
)
|
1.6
|
|||||||||||
|
Net cash provided by operating activities
|
87.6
|
75.7
|
68.9
|
74.6
|
||||||||||||
|
Investing Activities
|
||||||||||||||||
|
Acquisitions, net of cash received
|
(1.8
|
)
|
(0.5
|
)
|
(46.2
|
)
|
(0.5
|
)
|
||||||||
|
Additions to property, plant & equipment
|
(33.2
|
)
|
(29.9
|
)
|
(62.7
|
)
|
(57.2
|
)
|
||||||||
|
Additions to intangibles and other assets
|
(1.0
|
)
|
(0.1
|
)
|
(3.3
|
)
|
(2.2
|
)
|
||||||||
|
Proceeds from sale of property, plant & equipment and sale-leaseback
|
0.2
|
40.1
|
2.9
|
40.5
|
||||||||||||
|
Increase in restricted cash
|
(2.8
|
)
|
-
|
(2.8
|
)
|
-
|
||||||||||
|
Net cash (used in) provided by investing activities
|
(38.6
|
)
|
9.6
|
(112.1
|
)
|
(19.4
|
)
|
|||||||||
|
Financing Activities
|
||||||||||||||||
|
Payments of long-term debt
|
(0.4
|
)
|
(1.1
|
)
|
(1.5
|
)
|
(1.9
|
)
|
||||||||
|
Borrowings under ABL
|
123.9
|
654.1
|
621.1
|
748.9
|
||||||||||||
|
Payments under ABL
|
(187.7
|
)
|
(674.4
|
)
|
(746.0
|
)
|
(777.2
|
)
|
||||||||
|
Distributions to non-controlling interests
|
(1.0
|
)
|
(1.6
|
)
|
(3.3
|
)
|
(3.6
|
)
|
||||||||
|
Issuance of common shares
|
220.1
|
142.5
|
364.2
|
142.6
|
||||||||||||
|
Financing fees
|
-
|
(0.2
|
)
|
-
|
(0.2
|
)
|
||||||||||
|
Preferred shares repurchased and cancelled
|
-
|
(148.8
|
)
|
-
|
(148.8
|
)
|
||||||||||
|
Common shares repurchased and cancelled
|
-
|
-
|
(1.1
|
)
|
(0.7
|
)
|
||||||||||
|
Dividends to common and preferred shareholders
|
(7.4
|
)
|
(9.0
|
)
|
(14.7
|
)
|
(18.0
|
)
|
||||||||
|
Payment of deferred consideration for acquisitions
|
-
|
(2.5
|
)
|
-
|
(2.5
|
)
|
||||||||||
|
Net cash provided by (used in) financing activities
|
147.5
|
(41.0
|
)
|
218.7
|
(61.4
|
)
|
||||||||||
|
Effect of exchange rate changes on cash
|
(2.1
|
)
|
0.2
|
(3.1
|
)
|
(1.0
|
)
|
|||||||||
|
Net increase (decrease) in cash & cash equivalents
|
194.4
|
44.5
|
172.4
|
(7.2
|
)
|
|||||||||||
|
Cash & cash equivalents, beginning of period
|
55.1
|
34.5
|
77.1
|
86.2
|
||||||||||||
|
Cash & cash equivalents, end of period
|
$
|
249.5
|
$
|
79.0
|
$
|
249.5
|
$
|
79.0
|
||||||||
15
|
|
|
|
COTT CORPORATION
|
EXHIBIT 4
|
|||||||||||||||||||||||||||
|
SEGMENT INFORMATION
|
||||||||||||||||||||||||||||
|
(in millions of U.S. dollars)
|
||||||||||||||||||||||||||||
|
Unaudited
|
||||||||||||||||||||||||||||
|
For the Three Months Ended July 2, 2016
|
||||||||||||||||||||||||||||
|
Cott North
|
Cott
|
|||||||||||||||||||||||||||
|
(in millions of U.S. dollars)
|
DSS
|
America
|
U.K.
|
All Other
|
Corporate
|
Eliminations
|
Total
|
|||||||||||||||||||||
|
Revenue, net
|
||||||||||||||||||||||||||||
|
Private label retail
|
$
|
20.7
|
$
|
280.9
|
$
|
55.0
|
$
|
1.1
|
$
|
-
|
$
|
(0.3
|
)
|
$
|
357.4
|
|||||||||||||
|
Branded retail
|
22.9
|
24.8
|
41.7
|
1.0
|
-
|
(0.4
|
)
|
90.0
|
||||||||||||||||||||
|
Contract packaging
|
-
|
35.7
|
31.0
|
5.0
|
-
|
(2.5
|
)
|
69.2
|
||||||||||||||||||||
|
Home and office bottled water delivery
|
177.2
|
-
|
-
|
-
|
-
|
-
|
177.2
|
|||||||||||||||||||||
|
Office coffee services
|
30.0
|
-
|
-
|
-
|
-
|
-
|
30.0
|
|||||||||||||||||||||
|
Concentrate and other
|
24.9
|
7.8
|
4.6
|
7.7
|
-
|
(3.8
|
)
|
41.2
|
||||||||||||||||||||
|
Total
|
$
|
275.7
|
$
|
349.2
|
$
|
132.3
|
$
|
14.8
|
$
|
-
|
$
|
(7.0
|
)
|
$
|
765.0
|
|||||||||||||
|
Gross Profit 1
|
$
|
170.8
|
$
|
51.8
|
$
|
24.1
|
$
|
5.9
|
$
|
-
|
$
|
-
|
$
|
252.6
|
||||||||||||||
|
Gross Margin % 2
|
62.0
|
%
|
15.1
|
%
|
18.2
|
%
|
39.9
|
%
|
-
|
-
|
33.0
|
%
|
||||||||||||||||
|
Operating income (loss)
|
$
|
17.8
|
$
|
18.4
|
$
|
11.7
|
$
|
3.4
|
$
|
(14.7
|
)
|
$
|
-
|
$
|
36.6
|
|||||||||||||
|
For the Three Months Ended July 4, 2015
|
||||||||||||||||||||||||||||
|
Cott North
|
Cott
|
|||||||||||||||||||||||||||
|
(in millions of U.S. dollars)
|
DSS
|
America
|
U.K.
|
All Other
|
Corporate
|
Eliminations
|
Total
|
|||||||||||||||||||||
|
Revenue, net
|
||||||||||||||||||||||||||||
|
Private label retail
|
$
|
17.2
|
$
|
289.7
|
$
|
71.8
|
$
|
1.7
|
$
|
-
|
$
|
(0.7
|
)
|
$
|
379.7
|
|||||||||||||
|
Branded retail
|
20.6
|
30.8
|
48.5
|
1.3
|
-
|
(0.5
|
)
|
100.7
|
||||||||||||||||||||
|
Contract packaging
|
-
|
31.3
|
30.9
|
6.8
|
-
|
(1.6
|
)
|
67.4
|
||||||||||||||||||||
|
Home and office bottled water delivery
|
164.8
|
-
|
-
|
-
|
-
|
-
|
164.8
|
|||||||||||||||||||||
|
Office coffee services
|
29.7
|
-
|
-
|
-
|
-
|
-
|
29.7
|
|||||||||||||||||||||
|
Concentrate and other
|
24.7
|
7.2
|
2.6
|
6.6
|
-
|
(3.6
|
)
|
37.5
|
||||||||||||||||||||
|
Total
|
$
|
257.0
|
$
|
359.0
|
$
|
153.8
|
$
|
16.4
|
$
|
-
|
$
|
(6.4
|
)
|
$
|
779.8
|
|||||||||||||
|
Gross Profit 1
|
$
|
156.1
|
$
|
52.2
|
$
|
25.6
|
$
|
6.7
|
$
|
-
|
$
|
-
|
$
|
240.6
|
||||||||||||||
|
Gross Margin % 2
|
60.7
|
%
|
14.8
|
%
|
16.6
|
%
|
40.9
|
%
|
-
|
-
|
30.9
|
%
|
||||||||||||||||
|
Operating income (loss)
|
$
|
13.2
|
$
|
18.3
|
$
|
14.6
|
$
|
3.7
|
$
|
(3.7
|
)
|
$
|
-
|
$
|
46.1
|
|||||||||||||
|
For the Six Months Ended July 2, 2016
|
||||||||||||||||||||||||||||
|
Cott North
|
Cott
|
|||||||||||||||||||||||||||
|
(in millions of U.S. dollars)
|
DSS
|
America
|
U.K.
|
All Other
|
Corporate
|
Eliminations
|
Total
|
|||||||||||||||||||||
|
Revenue, net
|
||||||||||||||||||||||||||||
|
Private label retail
|
$
|
37.6
|
$
|
529.4
|
$
|
106.0
|
$
|
1.6
|
$
|
-
|
$
|
(0.7
|
)
|
$
|
673.9
|
|||||||||||||
|
Branded retail
|
47.2
|
51.6
|
78.3
|
1.8
|
-
|
(0.7
|
)
|
178.2
|
||||||||||||||||||||
|
Contract packaging
|
-
|
67.1
|
59.3
|
9.7
|
-
|
(4.6
|
)
|
131.5
|
||||||||||||||||||||
|
Home and office bottled water delivery
|
339.2
|
-
|
-
|
-
|
-
|
-
|
339.2
|
|||||||||||||||||||||
|
Office coffee services
|
61.5
|
-
|
-
|
-
|
-
|
-
|
61.5
|
|||||||||||||||||||||
|
Concentrate and other
|
47.5
|
14.4
|
9.3
|
15.3
|
-
|
(7.4
|
)
|
79.1
|
||||||||||||||||||||
|
Total
|
$
|
533.0
|
$
|
662.5
|
$
|
252.9
|
$
|
28.4
|
$
|
-
|
$
|
(13.4
|
)
|
$
|
1,463.4
|
|||||||||||||
|
Gross Profit 1
|
$
|
325.2
|
$
|
86.7
|
$
|
43.8
|
$
|
10.9
|
$
|
-
|
$
|
-
|
$
|
466.6
|
||||||||||||||
|
Gross Margin % 2
|
61.0
|
%
|
13.4
|
%
|
17.3
|
%
|
38.4
|
%
|
-
|
-
|
31.9
|
%
|
||||||||||||||||
|
Operating income (loss)
|
$
|
23.5
|
$
|
19.0
|
$
|
21.6
|
$
|
5.9
|
$
|
(18.7
|
)
|
$
|
-
|
$
|
51.3
|
|||||||||||||
|
For the Six Months Ended July 4, 2015
|
||||||||||||||||||||||||||||
|
Cott North
|
Cott
|
|||||||||||||||||||||||||||
|
(in millions of U.S. dollars)
|
DSS
|
America
|
U.K.
|
All Other
|
Corporate
|
Eliminations
|
Total
|
|||||||||||||||||||||
|
Revenue, net
|
||||||||||||||||||||||||||||
|
Private label retail
|
$
|
32.7
|
$
|
557.4
|
$
|
132.7
|
$
|
2.8
|
$
|
-
|
$
|
(1.2
|
)
|
$
|
724.4
|
|||||||||||||
|
Branded retail
|
40.3
|
57.9
|
89.3
|
2.4
|
-
|
(0.9
|
)
|
189.0
|
||||||||||||||||||||
|
Contract packaging
|
-
|
56.9
|
59.3
|
10.7
|
-
|
(1.6
|
)
|
125.3
|
||||||||||||||||||||
|
Home and office bottled water delivery
|
314.4
|
-
|
-
|
-
|
-
|
-
|
314.4
|
|||||||||||||||||||||
|
Office coffee services
|
61.7
|
-
|
-
|
-
|
-
|
-
|
61.7
|
|||||||||||||||||||||
|
Concentrate and other
|
48.2
|
15.5
|
4.7
|
13.5
|
-
|
(7.1
|
)
|
74.8
|
||||||||||||||||||||
|
Total
|
$
|
497.3
|
$
|
687.7
|
$
|
286.0
|
$
|
29.4
|
$
|
-
|
$
|
(10.8
|
)
|
$
|
1,489.6
|
|||||||||||||
|
Gross Profit 1
|
$
|
296.0
|
$
|
93.7
|
$
|
41.2
|
$
|
11.0
|
$
|
-
|
$
|
-
|
$
|
441.9
|
||||||||||||||
|
Gross Margin % 2
|
59.5
|
%
|
13.8
|
%
|
14.4
|
%
|
37.4
|
%
|
-
|
-
|
29.7
|
%
|
||||||||||||||||
|
Operating income (loss)
|
$
|
11.7
|
$
|
25.5
|
$
|
18.5
|
$
|
5.3
|
$
|
(8.2
|
)
|
$
|
-
|
$
|
52.8
|
|||||||||||||
|
1 Gross profit from external revenues.
|
|||||
|
2 Cott North America gross margin relative to external revenues.
|
16
|
|
|
|
COTT CORPORATION
|
EXHIBIT 5
|
|||||||||||||||||||||||
|
SUPPLEMENTARY INFORMATION - NON-GAAP - Analysis of Revenue by Reporting Segment
|
||||||||||||||||||||||||
|
Unaudited
|
||||||||||||||||||||||||
|
For the Three Months Ended
|
||||||||||||||||||||||||
|
(in millions of U.S. dollars, except percentage amounts)
|
July 2, 2016
|
|||||||||||||||||||||||
|
Cott North
|
||||||||||||||||||||||||
|
DSS
|
America
|
Cott U.K.
|
All Other
|
Elimination
|
Cott 1
|
|||||||||||||||||||
|
Change in revenue
|
$
|
18.7
|
$
|
(9.8
|
)
|
$
|
(21.5
|
)
|
$
|
(1.6
|
)
|
$
|
(0.6
|
)
|
$
|
(14.8
|
)
|
|||||||
|
Impact of foreign exchange 2
|
-
|
2.5
|
9.1
|
1.0
|
-
|
12.6
|
||||||||||||||||||
|
Change excluding foreign exchange
|
$
|
18.7
|
$
|
(7.3
|
)
|
$
|
(12.4
|
)
|
$
|
(0.6
|
)
|
$
|
(0.6
|
)
|
$
|
(2.2
|
)
|
|||||||
|
Percentage change in revenue
|
7.3
|
%
|
-2.7
|
%
|
-14.0
|
%
|
-9.8
|
%
|
9.4
|
%
|
-1.9
|
%
|
||||||||||||
|
Percentage change in revenue excluding foreign exchange
|
7.3
|
%
|
-2.0
|
%
|
-8.1
|
%
|
-3.7
|
%
|
9.4
|
%
|
-0.3
|
%
|
||||||||||||
|
For the Six Months Ended
|
||||||||||||||||||||||||
|
(in millions of U.S. dollars, except percentage amounts)
|
July 2, 2016
|
|||||||||||||||||||||||
|
Cott North
|
||||||||||||||||||||||||
|
DSS
|
America
|
Cott U.K.
|
All Other
|
Elimination
|
Cott 1
|
|||||||||||||||||||
|
Change in revenue
|
$
|
35.7
|
$
|
(25.2
|
)
|
$
|
(33.1
|
)
|
$
|
(1.0
|
)
|
$
|
(2.6
|
)
|
$
|
(26.2
|
)
|
|||||||
|
Impact of foreign exchange 2
|
-
|
5.8
|
16.0
|
2.0
|
-
|
23.8
|
||||||||||||||||||
|
Change excluding foreign exchange
|
$
|
35.7
|
$
|
(19.4
|
)
|
$
|
(17.1
|
)
|
$
|
1.0
|
$
|
(2.6
|
)
|
$
|
(2.4
|
)
|
||||||||
|
Percentage change in revenue
|
7.2
|
%
|
-3.7
|
%
|
-11.6
|
%
|
-3.4
|
%
|
24.1
|
%
|
-1.8
|
%
|
||||||||||||
|
Percentage change in revenue excluding foreign exchange
|
7.2
|
%
|
-2.8
|
%
|
-6.0
|
%
|
3.4
|
%
|
24.1
|
%
|
-0.2
|
%
|
||||||||||||
|
1 Cott includes the following reporting segments: DSS, Cott North America, Cott U.K. and All Other.
|
|||||
|
2 Impact of foreign exchange is the difference between the current period revenue translated utilizing the current period average foreign exchange rates less the current period revenue translated utilizing the prior period average foreign exchange rates.
|
17
|
|
|
|
COTT CORPORATION
|
EXHIBIT 6
|
|||||||||||||||
|
SUPPLEMENTARY INFORMATION - NON-GAAP - EARNINGS BEFORE INTEREST, TAXES, DEPRECIATION & AMORTIZATION
|
||||||||||||||||
|
(EBITDA)
|
||||||||||||||||
|
(in millions of U.S. dollars)
|
||||||||||||||||
|
Unaudited
|
||||||||||||||||
|
For the Three Months Ended
|
For the Six Months Ended
|
|||||||||||||||
|
July 2, 2016
|
July 4, 2015
|
July 2, 2016
|
July 4, 2015
|
|||||||||||||
|
Net income (loss) attributed to Cott Corporation
|
$
|
7.4
|
$
|
2.2
|
$
|
4.1
|
$
|
(3.8
|
)
|
|||||||
|
Interest expense, net
|
27.0
|
27.9
|
54.8
|
55.6
|
||||||||||||
|
Income tax benefit
|
2.3
|
1.1
|
11.3
|
10.5
|
||||||||||||
|
Depreciation & amortization
|
53.5
|
58.2
|
106.0
|
115.6
|
||||||||||||
|
Net income attributable to non-controlling interests
|
1.5
|
1.7
|
2.9
|
3.0
|
||||||||||||
|
Accumulated dividends on preferred shares
|
-
|
2.4
|
-
|
5.9
|
||||||||||||
|
Foreign exchange impact on redemption of preferred shares
|
-
|
12.0
|
-
|
12.0
|
||||||||||||
|
EBITDA
|
$
|
87.1
|
$
|
103.3
|
$
|
156.5
|
$
|
177.8
|
||||||||
|
Acquisition and integration costs
|
11.7
|
4.1
|
13.1
|
8.8
|
||||||||||||
|
Purchase accounting adjustments
|
-
|
-
|
0.5
|
4.2
|
||||||||||||
|
Unrealized commodity hedging loss (gain), net
|
0.1
|
(0.9
|
)
|
0.1
|
(1.2
|
)
|
||||||||||
|
Unrealized foreign exchange and other losses (gains), net
|
2.2
|
0.4
|
(0.4
|
)
|
(10.5
|
)
|
||||||||||
|
Loss on disposal of property, plant & equipment, net
|
2.2
|
0.2
|
3.1
|
1.7
|
||||||||||||
|
Other adjustments
|
1.6
|
1.2
|
2.9
|
1.2
|
||||||||||||
|
Adjusted EBITDA
|
$
|
104.9
|
$
|
108.3
|
$
|
175.8
|
$
|
182.0
|
||||||||
18
|
|
|
|
COTT CORPORATION
|
EXHIBIT 7
|
|||||||
|
SUPPLEMENTARY INFORMATION - NON-GAAP - FREE CASH FLOW AND ADJUSTED FREE CASH FLOW
|
||||||||
|
(in millions of U.S. dollars)
|
||||||||
|
Unaudited
|
||||||||
|
For the Three Months Ended
|
||||||||
|
July 2, 2016
|
July 4, 2015
|
|||||||
|
Net cash provided by operating activities
|
$
|
87.6
|
$
|
75.7
|
||||
|
Less: Additions to property, plant & equipment
|
(33.2
|
)
|
(29.9
|
)
|
||||
|
Free Cash Flow
|
$
|
54.4
|
$
|
45.8
|
||||
|
Adjusted Free Cash Flow
|
$
|
54.4
|
$
|
45.8
|
||||
|
For the Six Months Ended
|
||||||||
|
July 2, 2016
|
July 4, 2015
|
|||||||
|
Net cash provided by operating activities
|
$
|
68.9
|
$
|
74.6
|
||||
|
Less: Additions to property, plant & equipment
|
(62.7
|
)
|
(57.2
|
)
|
||||
|
Free Cash Flow
|
$
|
6.2
|
$
|
17.4
|
||||
|
Less:
|
||||||||
|
Cash collateral 1
|
-
|
(29.4
|
)
|
|||||
|
Adjusted Free Cash Flow
|
$
|
6.2
|
$
|
(12.0
|
)
|
|||
|
1 In connection with the DSS Acquisition, $29.4 million of cash was required to collateralize certain DSS self-insurance programs. The $29.4 million was funded with borrowings under our ABL facility, and the cash collateral was included within prepaid and other current assets on our consolidated balance sheet at January 3, 2015. After January 3, 2015, additional letters of credit were issued from our available ABL facility capacity, and the cash collateral was returned to the Company and used to repay a portion of our outstanding ABL facility.
|
19
|
|
|
|
COTT CORPORATION
|
EXHIBIT 8
|
|||||||||||||||
|
SUPPLEMENTARY INFORMATION - NON-GAAP - ADJUSTED NET INCOME
|
||||||||||||||||
|
(in millions of U.S. dollars, except share and per share amounts)
|
||||||||||||||||
|
Unaudited
|
||||||||||||||||
|
For the Three Months Ended
|
For the Six Months Ended
|
|||||||||||||||
|
July 2, 2016
|
July 4, 2015
|
July 2, 2016
|
July 4, 2015
|
|||||||||||||
|
Net income (loss) attributed to Cott Corporation
|
$
|
7.4
|
$
|
2.2
|
$
|
4.1
|
$
|
(3.8
|
)
|
|||||||
|
Acquisition and integration costs
|
11.7
|
4.1
|
13.1
|
8.8
|
||||||||||||
|
Purchase accounting adjustments
|
-
|
-
|
0.5
|
4.2
|
||||||||||||
|
Unrealized commodity hedging loss (gain), net
|
0.1
|
(0.9
|
)
|
0.1
|
(1.2
|
)
|
||||||||||
|
Unrealized foreign exchange and other losses (gains), net
|
2.2
|
0.4
|
(0.4
|
)
|
(10.5
|
)
|
||||||||||
|
Foreign exchange impact on redemption of preferred shares
|
-
|
12.0
|
-
|
12.0
|
||||||||||||
|
Loss on disposal of property, plant & equipment, net
|
2.2
|
0.2
|
3.1
|
1.7
|
||||||||||||
|
Other adjustments
|
1.6
|
1.2
|
2.9
|
1.2
|
||||||||||||
|
Adjustments for tax effect 1
|
(6.4
|
)
|
(1.6
|
)
|
(7.1
|
)
|
(2.5
|
)
|
||||||||
|
Adjusted net income attributed to Cott Corporation
|
$
|
18.8
|
$
|
17.6
|
$
|
16.3
|
$
|
9.9
|
||||||||
|
Adjusted net income per common share attributed to Cott Corporation
|
||||||||||||||||
|
Basic
|
$
|
0.15
|
$
|
0.18
|
$
|
0.14
|
$
|
0.10
|
||||||||
|
Diluted
|
$
|
0.15
|
$
|
0.18
|
$
|
0.14
|
$
|
0.10
|
||||||||
|
Weighted average common shares outstanding (in millions)
|
||||||||||||||||
|
Basic
|
123.2
|
99.6
|
118.3
|
96.4
|
||||||||||||
|
Diluted
|
124.2
|
100.2
|
119.0
|
96.9
|
||||||||||||
|
1 Reflects tax effect of adjustments at the statutory tax rate within the applicable tax jurisdiction.
|
20
|
|
|
|
DS SERVICES REPORTING SEGMENT
|
EXHIBIT 9
|
|||||||
|
SUPPLEMENTARY INFORMATION - NON-GAAP - ADJUSTED REVENUES
|
||||||||
|
(in millions of U.S. dollars)
|
||||||||
|
Unaudited
|
||||||||
|
July 2, 2016
|
July 4, 2015
|
|||||||
|
Revenue, net
|
$
|
275.7
|
$
|
257.0
|
||||
|
Energy surcharge adjustment 1
|
1.6
|
|||||||
|
Less: Aquaterra revenue, net
|
(16.8
|
)
|
||||||
|
Adjusted Revenue excluding Aquaterra, net
|
$
|
260.5
|
$
|
257.0
|
||||
|
Net growth percentage
|
1.4
|
%
|
||||||
|
1 Represents the impact of the energy surcharge on current period operations assuming prior period average rate.
|
21
|
|
|
|
DS SERVICES REPORTING SEGMENT
|
EXHIBIT 10
|
|||||||||||||||
|
SUPPLEMENTARY INFORMATION - NON-GAAP - EARNINGS BEFORE INTEREST, TAXES, DEPRECIATION & AMORTIZATION
|
||||||||||||||||
|
(EBITDA)
|
||||||||||||||||
|
(in millions of U.S. dollars)
|
||||||||||||||||
|
Unaudited
|
||||||||||||||||
|
For the Three Months Ended
|
For the Six Months Ended
|
|||||||||||||||
|
July 2, 2016
|
July 4, 2015
|
July 2, 2016
|
July 4, 2015
|
|||||||||||||
|
Operating income (loss)
|
$
|
17.8
|
$
|
13.2
|
$
|
23.5
|
$
|
11.7
|
||||||||
|
Other income
|
(0.3
|
)
|
(0.2
|
)
|
(1.3
|
)
|
(0.4
|
)
|
||||||||
|
EBIT - DS SERVICES
|
$
|
18.1
|
$
|
13.4
|
$
|
24.8
|
$
|
12.1
|
||||||||
|
Depreciation & amortization
|
29.3
|
31.8
|
57.7
|
62.0
|
||||||||||||
|
EBITDA - DS SERVICES
|
$
|
47.4
|
$
|
45.2
|
$
|
82.5
|
$
|
74.1
|
||||||||
|
Acquisition and integration costs, net
|
1.0
|
3.1
|
2.1
|
6.1
|
||||||||||||
|
Purchase accounting adjustments, net
|
-
|
-
|
0.5
|
4.2
|
||||||||||||
|
Unrealized other gains, net
|
(0.3
|
)
|
(0.2
|
)
|
(1.3
|
)
|
(0.4
|
)
|
||||||||
|
Loss on disposal of property, plant & equipment
|
1.4
|
0.9
|
3.2
|
2.0
|
||||||||||||
|
Other adjustments
|
0.2
|
-
|
(0.9
|
)
|
-
|
|||||||||||
|
Adjusted EBITDA - DS SERVICES
|
$
|
49.7
|
$
|
49.0
|
$
|
86.1
|
$
|
86.0
|
||||||||
22
|
|
|
|
S&D COFFEE, INC.
|
EXHIBIT 11 | |||
|
SUPPLEMENTARY INFORMATION - NON-GAAP - EARNINGS BEFORE INTEREST, TAXES, DEPRECIATION & AMORTIZATION
|
||||
|
(EBITDA)
|
||||
|
(in millions of U.S. dollars)
|
||||
|
Unaudited
|
||||
|
Full Year Pro Forma
2016E
|
||||
|
Operating income
|
$
|
16.3
|
||
|
Depreciation & amortization
|
16.8
|
|||
|
EBITDA
|
$
|
33.1
|
||
|
Shareholder expenses
|
4.7
|
|||
|
Acquisition, integration and restructuring costs
|
0.4
|
|||
|
Donations
|
0.5
|
|||
|
Adjusted EBITDA - S&D COFFEE, INC.
|
$
|
38.7
|
||
|
Pro forma adjustments 1
|
1.4
|
|||
|
Pro forma adjusted EBITDA - S&D COFFEE, INC.
|
$
|
40.1
|
||
|
Expected synergies
|
$
|
12.0
|
||
|
Pro forma adjusted EBITDA
|
40.1
|
|||
|
Synergized pro forma adjusted EBITDA
|
$
|
52.1
|
||
|
Approximate purchase price
|
355.0
|
|||
|
Synergized pro forma adjusted EBITDA run rate multiple
|
~6.8x
|
|||
23