Attached files
| file | filename |
|---|---|
| EX-99.1 - EX-99.1 - NEWFIELD EXPLORATION CO /DE/ | a16-16002_1ex99d1.htm |
| 8-K - 8-K - NEWFIELD EXPLORATION CO /DE/ | a16-16002_18k.htm |
Exhibit 99.2
@NFX – 2Q16 August 2, 2016 @NFX is periodically published to keep stockholders aware of current operating activities at Newfield. It may include estimates of expected production volumes, costs and expenses, recent changes to hedging positions and commodity pricing.

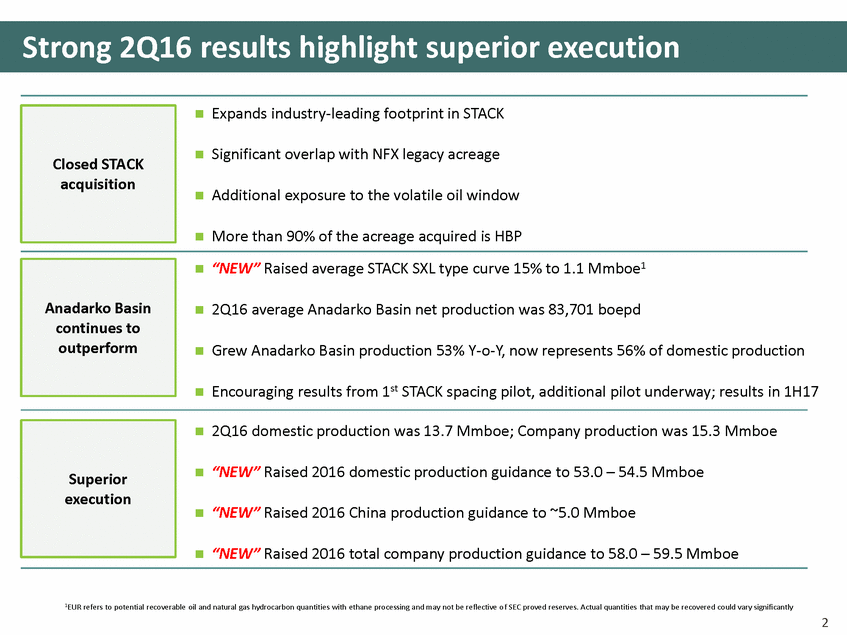
Strong 2Q16 results highlight superior execution Expands industry-leading footprint in STACK Significant overlap with NFX legacy acreage Additional exposure to the volatile oil window More than 90% of the acreage acquired is HBP “NEW” Raised average STACK SXL type curve 15% to 1.1 Mmboe1 2Q16 average Anadarko Basin net production was 83,701 boepd Grew Anadarko Basin production 53% Y-o-Y, now represents 56% of domestic production Encouraging results from 1st STACK spacing pilot, additional pilot underway; results in 1H17 2Q16 domestic production was 13.7 Mmboe; Company production was 15.3 Mmboe “NEW” Raised 2016 domestic production guidance to 53.0 – 54.5 Mmboe “NEW” Raised 2016 China production guidance to ~5.0 Mmboe “NEW” Raised 2016 total company production guidance to 58.0 – 59.5 Mmboe 1EUR refers to potential recoverable oil and natural gas hydrocarbon quantities with ethane processing and may not be reflective o f SEC proved reserves. Actual quantities that may be recovered could vary significantly 2 Superior execution Anadarko Basin continues to outperform Closed STACK acquisition
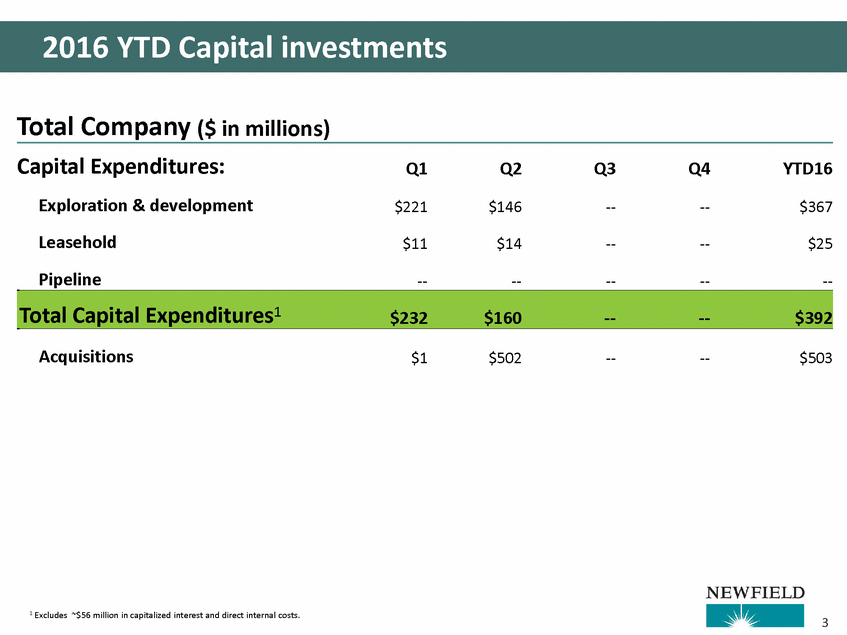
2016 YTD Capital investments Total Company ($ in millions) Capital Expenditures: Exploration & development Leasehold Pipeline Q1 Q2 Q3 Q4 YTD16 $221 $146 ---- $367 $11 $14 ---- $25 ---- ---- --Acquisitions $1 $502 ---- $503 1 Excludes ~$56 million in capitalized interest and direct internal costs. 3 Total Capital Expenditures1 $232$160----$392
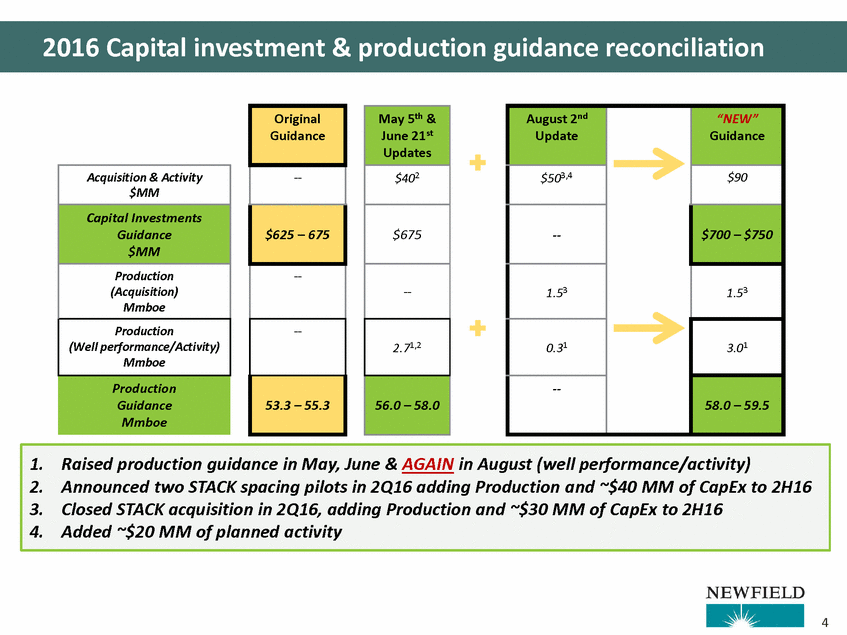
2016 Capital investment & production guidance reconciliation 4 1.Raised production guidance in May, June & AGAIN in August (well performance/activity) 2.Announced two STACK spacing pilots in 2Q16 adding Production and ~$40 MM of CapEx to 2H16 3.Closed STACK acquisition in 2Q16, adding Production and ~$30 MM of CapEx to 2H16 4.Added ~$20 MM of planned activity Acquisition & Activity $MM Capital Investments Guidance $MM Production (Acquisition) Mmboe Production (Well performance/Activity) Mmboe Production Guidance Mmboe August 2nd Update “NEW” Guidance $503,4 $90 --$700 – $750 1.53 1.53 0.31 3.01 --58.0 – 59.5 May 5th & June 21st Updates $402 $675 --2.71,2 56.0 – 58.0 Original Guidance --$625 – 675 ---- 53.3 – 55.3
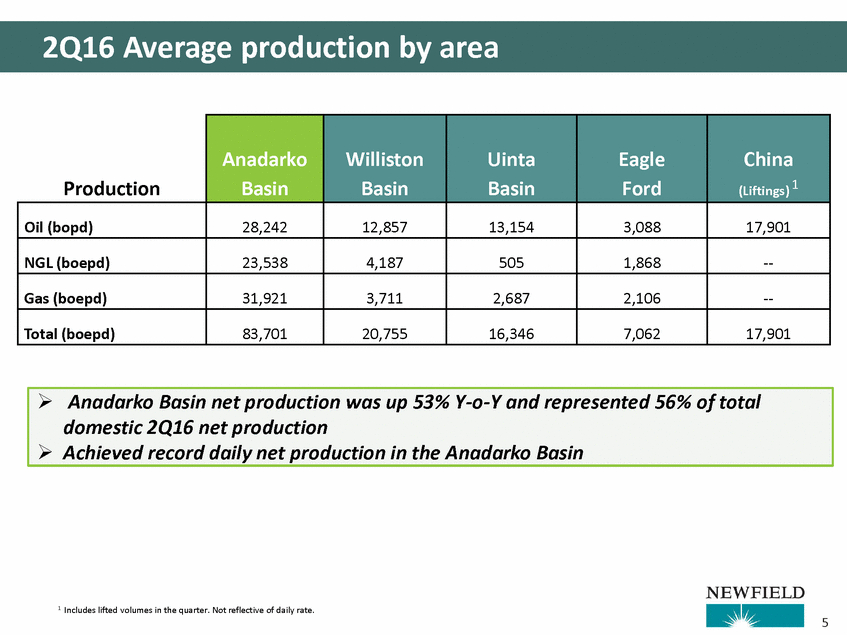
2Q16 Average production by area 1 Includes lifted volumes in the quarter. Not reflective of daily rate. 5 Anadarko Basin net production was up 53% Y-o-Y and represented 56% of total domestic 2Q16 net production Achieved record daily net production in the Anadarko Basin Production Anadarko Basin Williston Basin Uinta Basin Eagle Ford China (Liftings) 1 Oil (bopd) 28,242 12,857 13,154 3,088 17,901 NGL (boepd) 23,538 4,187 505 1,868 --Gas (boepd) 31,921 3,711 2,687 2,106 --Total (boepd) 83,701 20,755 16,346 7,062 17,901
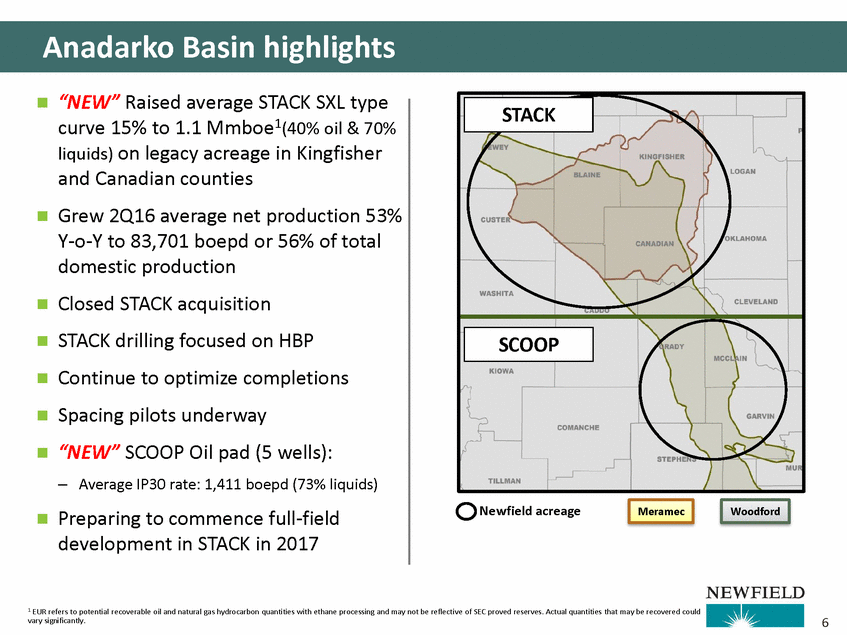
Anadarko Basin highlights “NEW” Raised average STACK SXL type curve 15% to 1.1 Mmboe1(40% oil & 70% liquids) on legacy acreage in Kingfisher and Canadian counties Grew 2Q16 average net production 53% Y-o-Y to 83,701 boepd or 56% of total domestic production Closed STACK acquisition STACK drilling focused on HBP Continue to optimize completions Spacing pilots underway “NEW” SCOOP Oil pad (5 wells): – Average IP30 rate: 1,411 boepd (73% liquids) Preparing to commence full-field development in STACK in 2017 Newfield acreage 1 EUR refers to potential recoverable oil and natural gas hydrocarbon quantities with ethane processing and may not be reflective of SEC proved reserves. Actual quantities that may be recovered could vary significantly. 6 Woodford Meramec SCOOP STACK
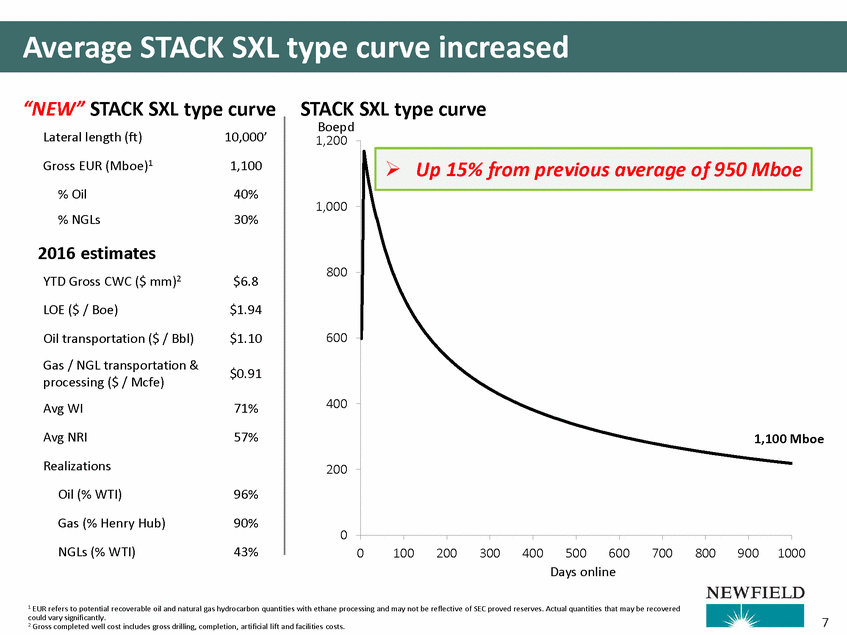
Average STACK SXL type curve increased “NEW” STACK SXL type curve STACK SXL type curve Boepd 1,200 Lateral length (ft) Gross EUR (Mboe)1 % Oil % NGLs 10,000’ 1,100 40% 30% 1,000 2016 estimates YTD Gross CWC ($ mm)2 LOE ($ / Boe) 800 $6.8 $1.94 600 Oil transportation ($ / Bbl) Gas / NGL transportation & processing ($ / Mcfe) Avg WI Avg NRI $1.10 $0.91 400 71% 57% Mboe Realizations Oil (% WTI) 200 96% Gas (% Henry Hub) NGLs (% WTI) 90% 43% 0 0 100 200 300 400500 600 700 800 900 1000 Days online 1 EUR refers to potential recoverable oil and natural gas hydrocarbon quantities with ethane processing and may not be reflective of SEC proved reserves. Actual quantities that may be recovered could vary significantly. 2 Gross completed well cost includes gross drilling, completion, artificial lift and facilities costs. 7 e Up 15% from previous average of 950 Mbo 1,100
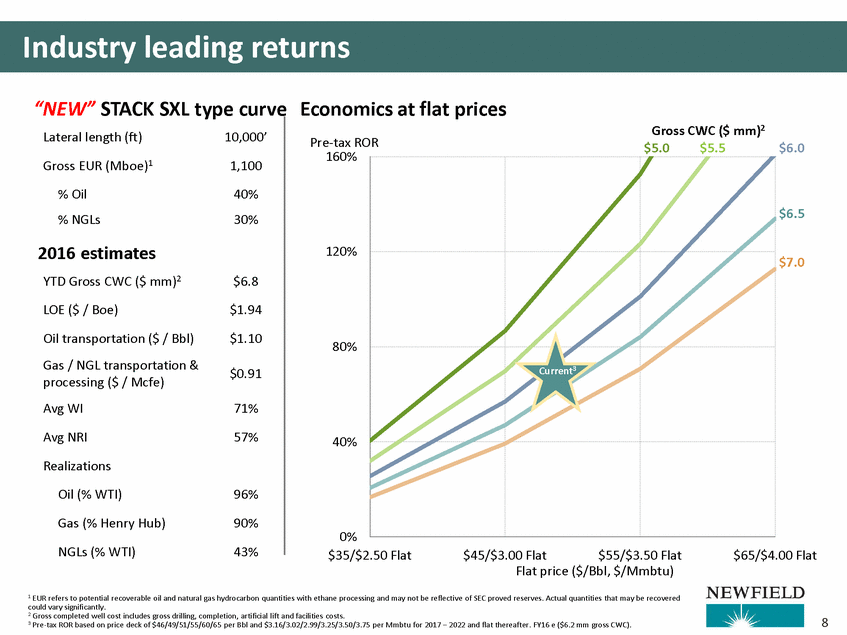
Industry leading returns “NEW” STACK SXL type curve Economics at flat prices Pre-tax ROR Gross CWC ($ mm)2 Lateral length (ft) Gross EUR (Mboe)1 % Oil % NGLs 10,000’ $5.0 $5.5 $6.0 160% 1,100 40% 30% $6.5 2016 estimates YTD Gross CWC ($ mm)2 LOE ($ / Boe) 120% $7.0 $6.8 $1.94 Oil transportation ($ / Bbl) Gas / NGL transportation & processing ($ / Mcfe) Avg WI Avg NRI $1.10 80% Current $0.91 71% 57% 40% Realizations Oil (% WTI) 96% Gas (% Henry Hub) NGLs (% WTI) 90% 43% 0% $35/$2.50 Flat $45/$3.00 Flat $55/$3.50 Flat $65/$4.00 Flat Flat price ($/Bbl, $/Mmbtu) 1 EUR refers to potential recoverable oil and natural gas hydrocarbon quantities with ethane processing and may not be reflective of SEC proved reserves. Actual quantities that may be recovered could vary significantly. 2 Gross completed well cost includes gross drilling, completion, artificial lift and facilities costs. 3 Pre-tax ROR based on price deck of $46/49/51/55/60/65 per Bbl and $3.16/3.02/2.99/3.25/3.50/3.75 per Mmbtu for 2017 – 2022 and flat thereafter. FY16 e ($6.2 mm gross CWC). 8 3
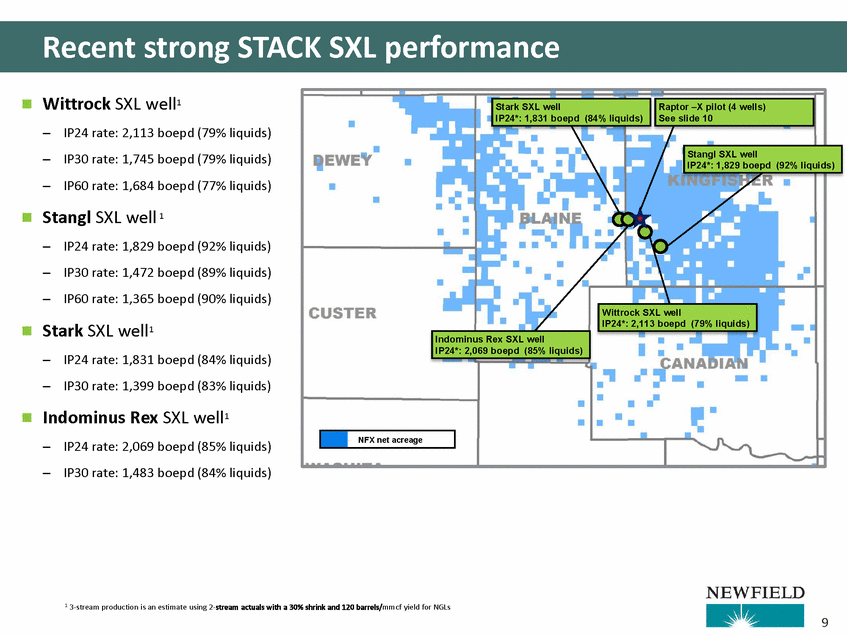
Recent strong STACK SXL performance Wittrock SXL well1 – – – IP24 rate: 2,113 boepd (79% liquids) IP30 rate: 1,745 boepd (79% liquids) IP60 rate: 1,684 boepd (77% liquids) s) Stangl SXL well 1 – – – IP24 rate: 1,829 boepd (92% liquids) IP30 rate: 1,472 boepd (89% liquids) IP60 rate: 1,365 boepd (90% liquids) Stark SXL well1 –IP24 rate: 1,831 boepd (84% liquids) –IP30 rate: 1,399 boepd (83% liquids) Indominus Rex SXL well1 –IP24 rate: 2,069 boepd (85% liquids) –IP30 rate: 1,483 boepd (84% liquids) 1 3-stream production is an estimate using 2-stream actuals with a 30% shrink and 120 barrels/mmcf yield for NGLs 9 Stark SXL wellRaptor –X pilot (4 wells) IP24*: 1,831 boepd (84% liquids)See slide 10 Stangl SXL well IP24*: 1,829 boepd (92% liquid Wittrock SXL well IP24*: 2,113 boepd (79% liquids) Indominus Rex SXL well IP24*: 2,069 boepd (85% liquids) NFX net acreage
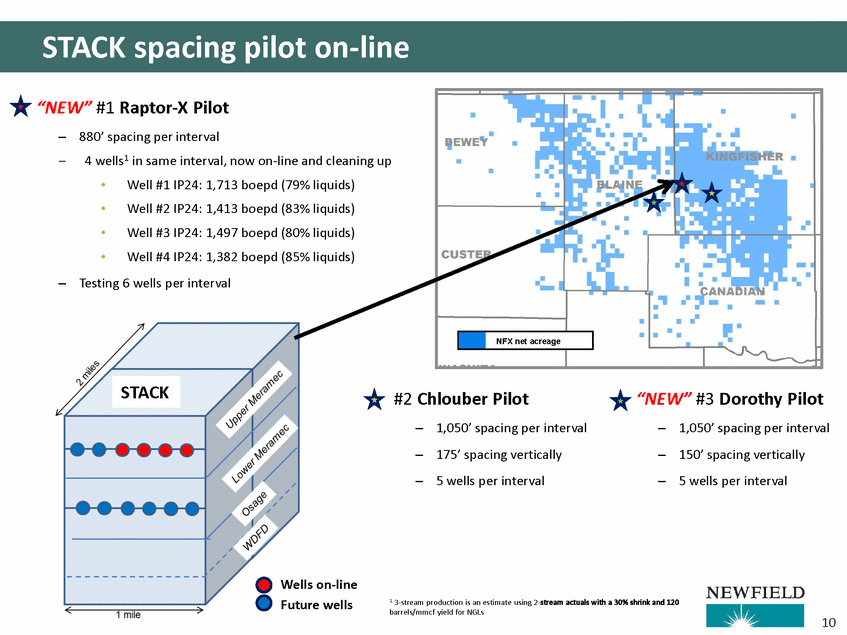
STACK spacing pilot on-line “NEW” #1 Raptor-X Pilot – 880’ spacing per interval 4 wells1 in same interval, now on-line and cleaning up • • • • Well #1 IP24: 1,713 boepd (79% liquids) Well #2 IP24: 1,413 boepd (83% liquids) Well #3 IP24: 1,497 boepd (80% liquids) Well #4 IP24: 1,382 boepd (85% liquids) – Testing 6 wells per interval STACK #2 Chlouber Pilot “NEW” #3 Dorothy Pilot – – – – – – 1,050’ spacing per interval 175’ spacing vertically 5 wells per interval 1,050’ spacing per interval 150’ spacing vertically 5 wells per interval Wells on-line Future wells 1 3-stream production is an estimate using 2-stream actuals with a 30% shrink and 120 barrels/mmcf yield for NGLs 10 NFX net acreage
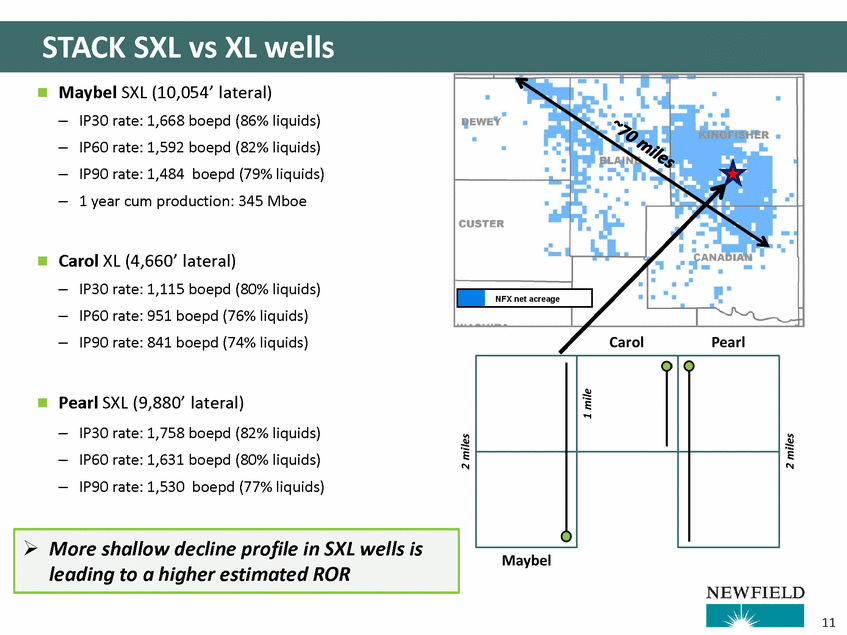
STACK SXL vs XL wells Maybel SXL (10,054’ lateral) – – – – IP30 rate: 1,668 boepd (86% liquids) IP60 rate: 1,592 boepd (82% liquids) IP90 rate: 1,484 boepd (79% liquids) 1 year cum production: 345 Mboe Carol XL (4,660’ lateral) – – – IP30 rate: 1,115 boepd (80% liquids) IP60 rate: 951 boepd (76% liquids) IP90 rate: 841 boepd (74% liquids) Pearl SXL (9,880’ lateral) – – – IP30 rate: 1,758 boepd (82% liquids) IP60 rate: 1,631 boepd (80% liquids) IP90 rate: 1,530 boepd (77% liquids) 11 More shallow decline profile in SXL wells is leading to a higher estimated ROR NFX net acreage
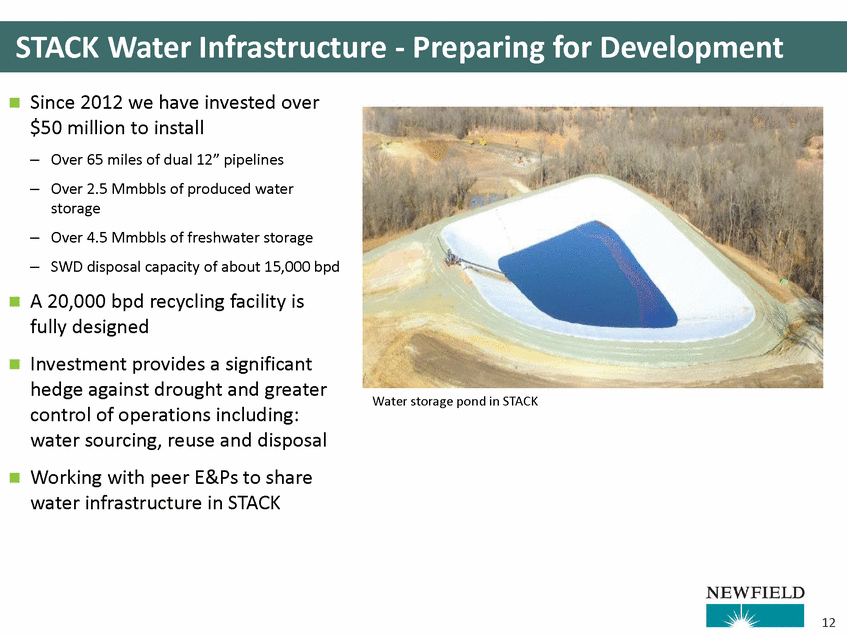
STACK Water Infrastructure - Preparing for Development Since 2012 we have invested over $50 million to install – – Over 65 miles of dual 12” pipelines Over 2.5 Mmbbls of produced water storage Over 4.5 Mmbbls of freshwater storage SWD disposal capacity of about 15,000 bpd – – A 20,000 bpd recycling facility is fully designed Investment provides a significant hedge against drought and greater control of operations including: water sourcing, reuse and disposal Working with peer E&Ps to share water infrastructure in STACK Water storage pond in STACK 12
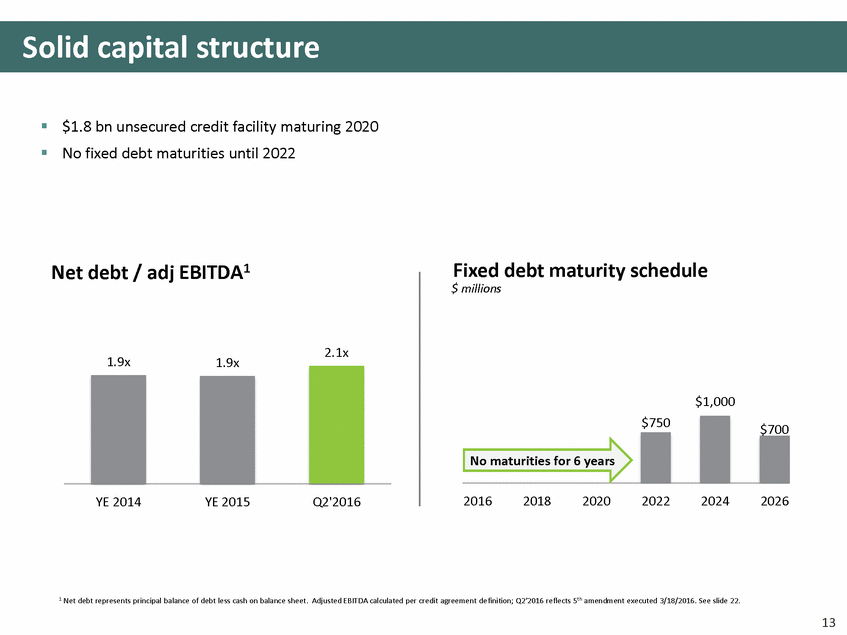
Solid capital structure $1.8 bn unsecured credit facility maturing 2020 No fixed debt maturities until 2022 Fixed debt maturity schedule $ millions Net debt / adj EBITDA1 2.1x 1.9x 1.9x $1,000 2016 2018 2020 2022 2024 2026 YE 2014 YE 2015 Q2'2016 1 Net debt represents principal balance of debt less cash on balance sheet. Adjusted EBITDA calculated per credit agreement de finition; Q2’2016 reflects 5th amendment executed 3/18/2016. See slide 22. 13 $750 $700 No maturities for 6 years
Appendix
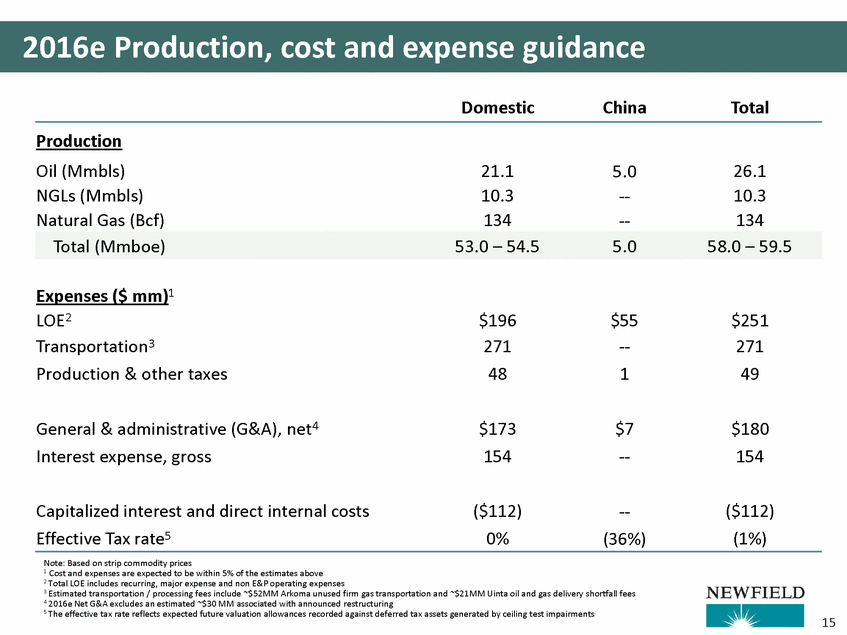
2016e Production, cost and expense guidance Domestic China Total Production Oil (Mmbls) NGLs (Mmbls) Natural Gas (Bcf) 21.1 10.3 134 5.0 ---- 26.1 10.3 134 Expenses ($ mm)1 LOE2 Transportation3 Production & other taxes $196 271 48 $251 271 49 $55 --1 General & administrative (G&A), net4 Interest expense, gross $173 154 $7 --$180 154 Capitalized interest and direct internal costs Effective Tax rate5 ($112) 0% --(36%) ($112) (1%) Note: Based on strip commodity prices 1 Cost and expenses are expected to be within 5% of the estimates above 2 Total LOE includes recurring, major expense and non E&P operating expenses 3 Estimated transportation / processing fees include ~$52MM Arkoma unused firm gas transportation and ~$21MM Uinta oil and gas delivery shortfall fees 4 2016e Net G&A excludes an estimated ~$30 MM associated with announced restructuring 5 The effective tax rate reflects expected future valuation allowances recorded against deferred tax assets generated by ceiling test impairments 15 Total (Mmboe)53.0 – 54.55.058.0 – 59.5
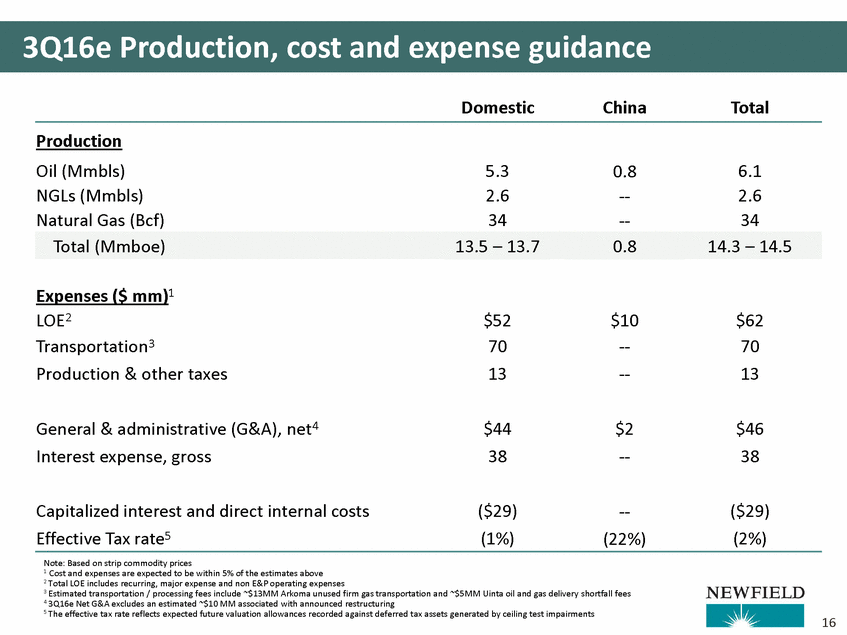
3Q16e Production, cost and expense guidance Domestic China Total Production Oil (Mmbls) NGLs (Mmbls) Natural Gas (Bcf) 5.3 2.6 34 0.8 ---- 6.1 2.6 34 Expenses ($ mm)1 LOE2 Transportation3 Production & other taxes $52 70 13 $62 70 13 $10 ---- General & administrative (G&A), net4 Interest expense, gross $44 38 $2 --$46 38 Capitalized interest and direct internal costs Effective Tax rate5 ($29) (1%) --(22%) ($29) (2%) Note: Based on strip commodity prices 1 Cost and expenses are expected to be within 5% of the estimates above 2 Total LOE includes recurring, major expense and non E&P operating expenses 3 Estimated transportation / processing fees include ~$13MM Arkoma unused firm gas transportation and ~$5MM Uinta oil and gas delivery shortfall fees 4 3Q16e Net G&A excludes an estimated ~$10 MM associated with announced restructuring 5 The effective tax rate reflects expected future valuation allowances recorded against deferred tax assets generated by ceiling test impairments 16 Total (Mmboe)13.5 – 13.70.814.3 – 14.5
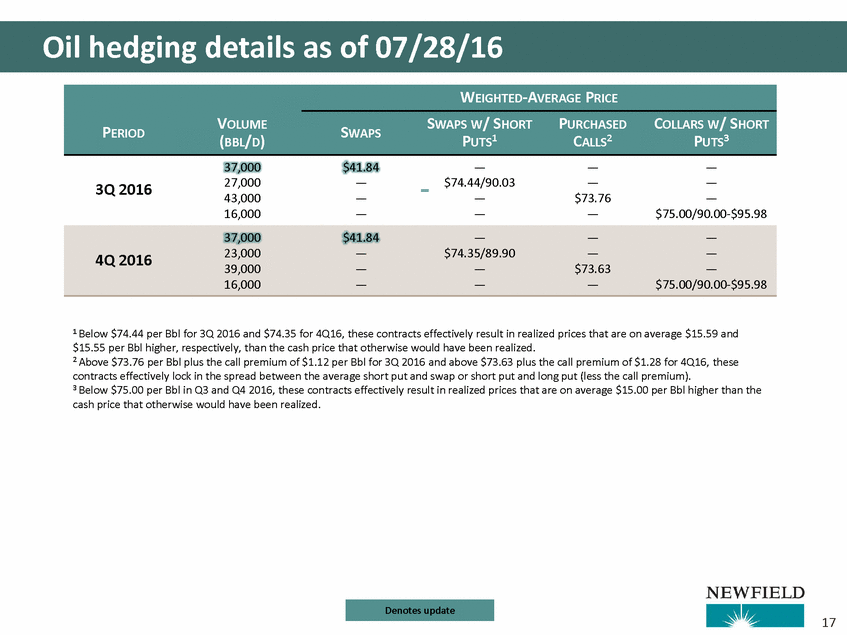
Oil hedging details as of 07/28/16 SWAPS PUTS1 CALLS2 PUTS3 37,000 27,000 43,000 16,000 $41.84 — — — — $74.44/90.03 — — — — $73.76 — — — — $75.00/90.00-$95.98 3Q 2016 39,000 — — $73.63 — 1 Below $74.44 per Bbl for 3Q 2016 and $74.35 for 4Q16, these contracts effectively result in realized prices that are on average $15.59 and $15.55 per Bbl higher, respectively, than the cash price that otherwise would have been realized. 2 Above $73.76 per Bbl plus the call premium of $1.12 per Bbl for 3Q 2016 and above $73.63 plus the call premium of $1.28 for 4Q16, these contracts effectively lock in the spread between the average short put and swap or short put and long put (less the call premium). 3 Below $75.00 per Bbl in Q3 and Q4 2016, these contracts effectively result in realized prices that are on average $15.00 per Bbl higher than the cash price that otherwise would have been realized. 17 Denotes update 37,000$41.84——— 4Q 201623,000—$74.35/89.90—— 16,000———$75.00/90.00-$95.98 PERIOD VOLUME (BBL/D) WEIGHTED-AVERAGE PRICE SWAPS W/ SHORT PURCHASED COLLARS W/ SHORT
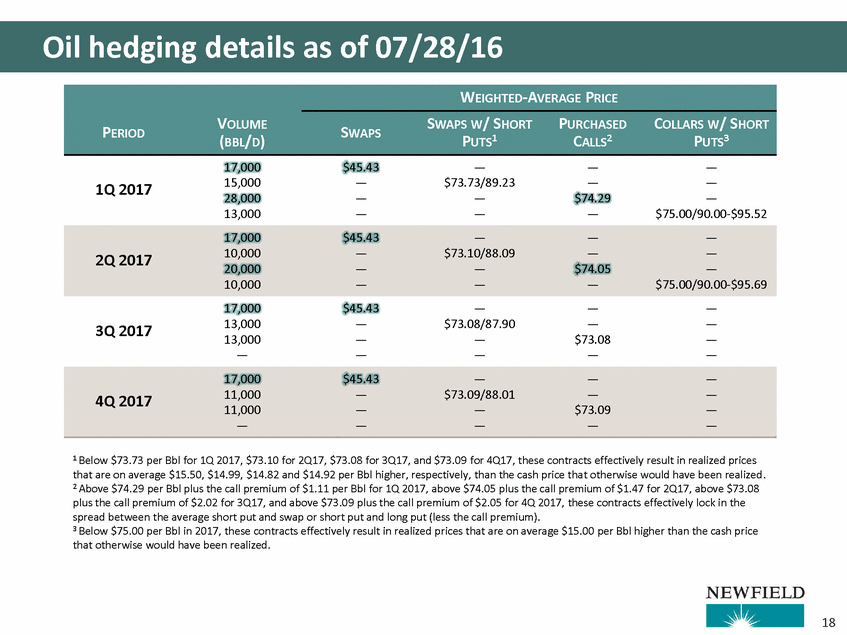
Oil hedging details as of 07/28/16 SWAPS PUTS1 CALLS2 PUTS3 17,000 15,000 28,000 13,000 $45.43 — — — — $73.73/89.23 — — — — $74.29 — — — — $75.00/90.00-$95.52 1Q 2017 20,000 — — $74.05 — 17,000 13,000 13,000 — $45.43 — — — — $73.08/87.90 — — — — $73.08 — — — — — 3Q 2017 11,000 — — $73.09 — 1 Below $73.73 per Bbl for 1Q 2017, $73.10 for 2Q17, $73.08 for 3Q17, and $73.09 for 4Q17, these contracts effectively result in realized prices that are on average $15.50, $14.99, $14.82 and $14.92 per Bbl higher, respectively, than the cash price that otherwise would have been realized. 2 Above $74.29 per Bbl plus the call premium of $1.11 per Bbl for 1Q 2017, above $74.05 plus the call premium of $1.47 for 2Q17, above $73.08 plus the call premium of $2.02 for 3Q17, and above $73.09 plus the call premium of $2.05 for 4Q 2017, these contracts effectively lock in the spread between the average short put and swap or short put and long put (less the call premium). 3 Below $75.00 per Bbl in 2017, these contracts effectively result in realized prices that are on average $15.00 per Bbl higher than the cash price that otherwise would have been realized. 18 17,000$45.43——— 4Q 201711,000—$73.09/88.01—— ————— 17,000$45.43——— 2Q 201710,000—$73.10/88.09—— 10,000———$75.00/90.00-$95.69 PERIOD VOLUME (BBL/D) WEIGHTED-AVERAGE PRICE SWAPS W/ SHORT PURCHASED COLLARS W/ SHORT
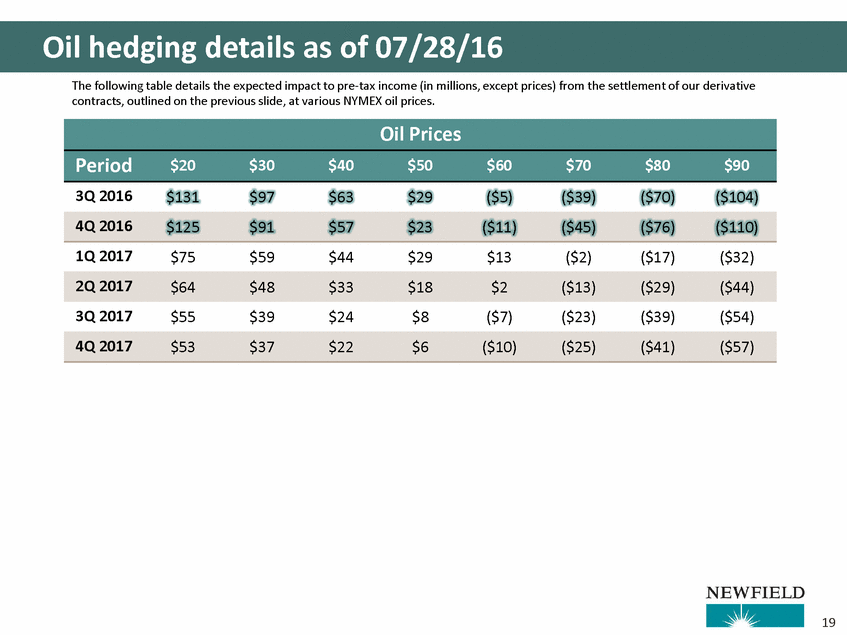
Oil hedging details as of 07/28/16 The following table details the expected impact to pre-tax income (in millions, except prices) from the settlement of our derivative contracts, outlined on the previous slide, at various NYMEX oil prices. 3Q 2016 $131 $97 $63 $29 ($5) ($39) ($70) ($104) 1Q 2017 $75 $59 $44 $29 $13 ($2) ($17) ($32) 3Q 2017 $55 $39 $24 $8 ($7) ($23) ($39) ($54) 19 4Q 2017$53$37$22$6($10)($25)($41)($57) 2Q 2017$64$48$33$18$2($13)($29)($44) 4Q 2016$125$91$57$23($11)($45)($76)($110) Oil Prices Period$20$30$40$50$60$70$80$90
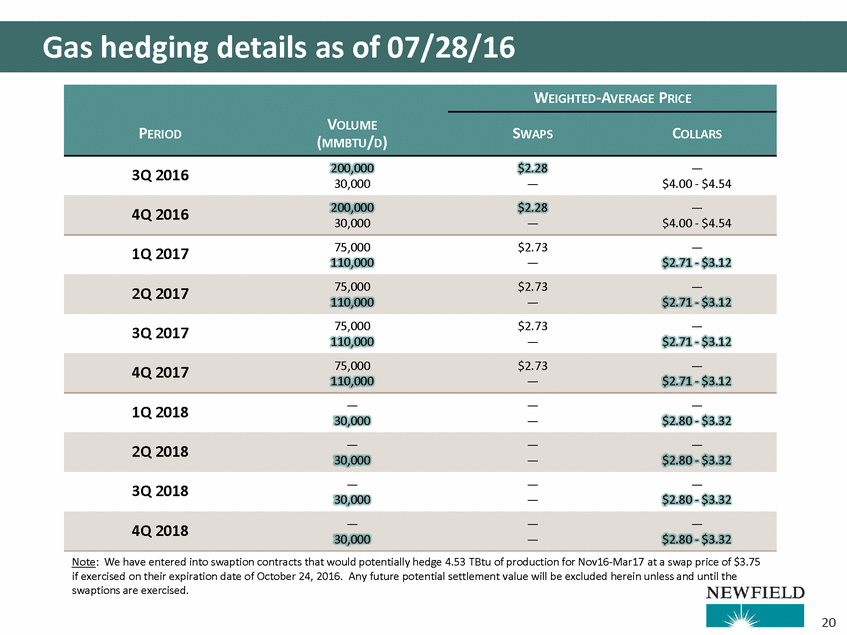
Gas hedging details as of 07/28/16 200,000 30,000 $2.28 — — $4.00 - $4.54 3Q 2016 30,000 — $4.00 - $4.54 75,000 110,000 $2.73 — — $2.71 - $3.12 1Q 2017 110,000 — $2.71 - $3.12 75,000 110,000 $2.73 — — $2.71 - $3.12 3Q 2017 110,000 — $2.71 - $3.12 — 30,000 — — — $2.80 - $3.32 1Q 2018 30,000 — $2.80 - $3.32 — 30,000 — — — $2.80 - $3.32 3Q 2018 30,000 — $2.80 - $3.32 Note: We have entered into swaption contracts that would potentially hedge 4.53 TBtu of production for Nov16-Mar17 at a swap price of $3.75 if exercised on their expiration date of October 24, 2016. Any future potential settlement value will be excluded herein unless and until the swaptions are exercised. 20 4Q 2018——— 2Q 2018——— 4Q 201775,000$2.73— 2Q 201775,000$2.73— 4Q 2016200,000$2.28— PERIOD VOLUME (MMBTU/D) WEIGHTED-AVERAGE PRICE SWAPS COLLARS
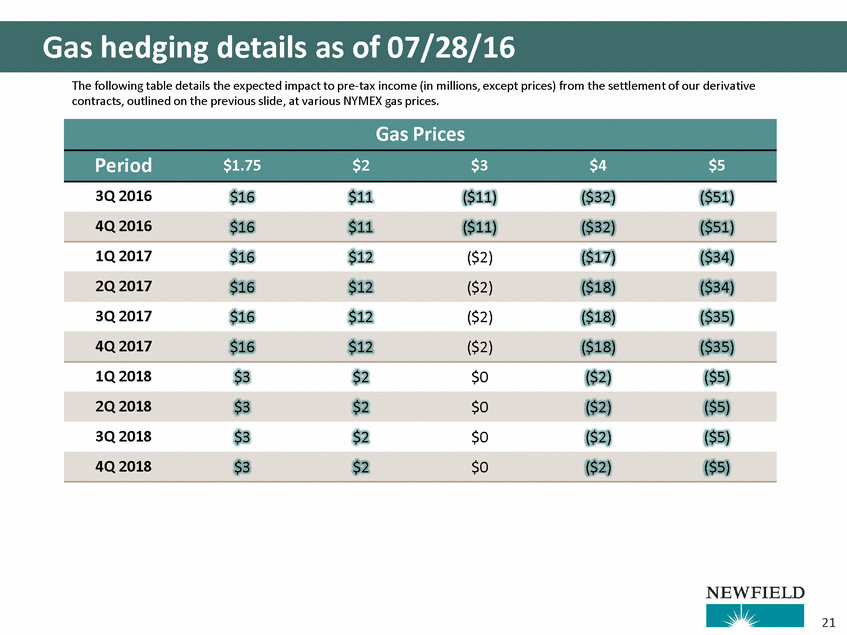
Gas hedging details as of 07/28/16 The following table details the expected impact to pre-tax income (in millions, except prices) from the settlement of our derivative contracts, outlined on the previous slide, at various NYMEX gas prices. 3Q 2016 $16 $11 ($11) ($32) ($51) 1Q 2017 $16 $12 ($2) ($17) ($34) 3Q 2017 $16 $12 ($2) ($18) ($35) 1Q 2018 $3 $2 $0 ($2) ($5) 3Q 2018 $3 $2 $0 ($2) ($5) 21 4Q 2018$3$2$0($2)($5) 2Q 2018$3$2$0($2)($5) 4Q 2017$16$12($2)($18)($35) 2Q 2017$16$12($2)($18)($34) 4Q 2016$16$11($11)($32)($51) Gas Prices Period$1.75$2$3$4$5
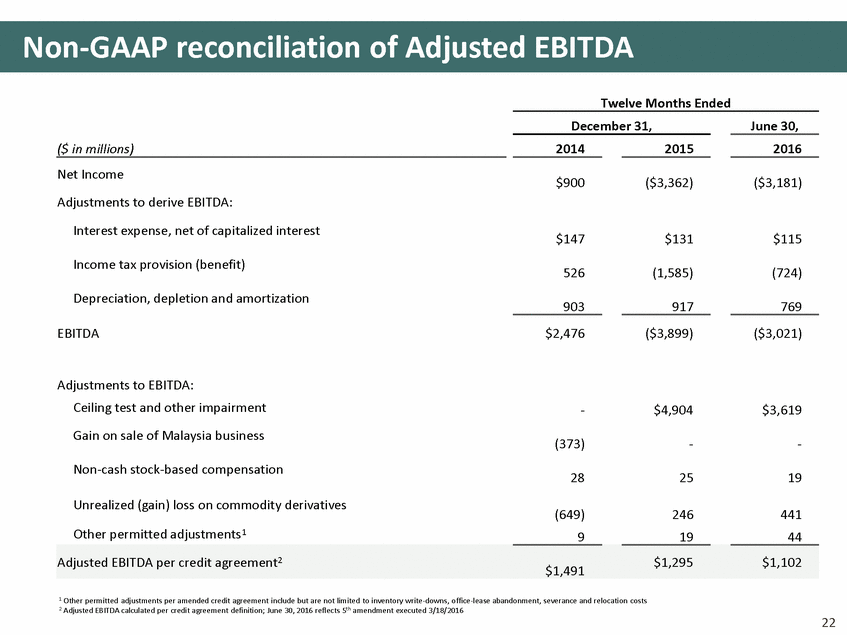
Non-GAAP reconciliation of Adjusted EBITDA Twelve Months Ended December 31, June 30, ($ in millions) 2014 2015 2016 Net Income Adjustments to derive EBITDA: Interest expense, net of capitalized interest $900 ($3,362) ($3,181) $147 $131 $115 Income tax provision (benefit) 526 (1,585) (724) Depreciation, depletion and amortization 903 917 769 EBITDA $2,476 ($3,899) ($3,021) Adjustments to EBITDA: Ceiling test and other impairment Gain on sale of Malaysia business - $4,904 $3,619 (373) - - Non-cash stock-based compensation 28 25 19 Unrealized (gain) loss on commodity derivatives (649) 9 246 19 441 44 Other permitted adjustments1 1 Other permitted adjustments per amended credit agreement include but are not limited to inventory write-downs, office-lease abandonment, severance and relocation costs 2 Adjusted EBITDA calculated per credit agreement definition; June 30, 2016 reflects 5th amendment executed 3/18/2016 22 Adjusted EBITDA per credit agreement2$1,491$1,295$1,102
Forward looking statements and related matters This presentation contains forward-looking statements within the meaning of Section 27A of the Securities Act of 1933, as amended, and Section 21E of the Securities Exchange Act of 1934, as amended. The words “may,” “believe,” “expect,” “anticipate,” “intend,” “estimate,” “project,” “target,” “goal,” “plan,” “should,” “will,” “predict,” “guidance,” “potential” or other similar expressions are intended to identify forward-looking statements. Other than historical facts included in this presentation, all information and statements, including but not limited to information regarding planned capital expenditures, estimated reserves, estimated production targets, drilling and development plans, the timing of production, planned capital expenditures, and other plans and objectives for future operations, are forward-looking statements. Although, as of the date of this presentation, Newfield believes that these expectations are reasonable, this information is based upon assumptions and anticipated results that are subject to numerous uncertainties and risks. Actual results may vary significantly from those anticipated due to many factors, including but not limited to commodity prices, drilling results, our liquidity and the availability of capital resources, operating risks, industry conditions, China and U.S. governmental regulations, financial counterparty risks, the prices of goods and services, the availability of drilling rigs and other support services, our ability to monetize assets and repay or refinance our existing indebtedness, labor conditions, severe weather conditions, and other operating risks. Please see Newfield’s 2015 Annual Report on Form 10-K and subsequent public filings, all filed with the U.S. Securities and Exchange Commission (SEC), for a discussion of other factors that may cause actual results to vary. Unpredictable or unknown factors not discussed herein or in Newfield’s SEC filings could also have material adverse effects on actual results. Readers are cautioned not to place undue reliance on forward-looking statements, which speak only as of the date of this presentation. Unless legally required, Newfield undertakes no obligation to publicly update or revise any forward-looking statements, whether as a result of new information, future events or otherwise. This presentation has been prepared by Newfield and includes market data and other statistical information from sources believed by Newfield to be reliable, including independent industry publications, government publications or other published independent sources. Some data are also based on Newfield’s good faith estimates, which are derived from its review of internal sources as well as the independent sources described above. Although Newfield believes these sources are reliable, it has not independently verified the information and cannot guarantee its accuracy and completeness. Actual quantities that may be ultimately recovered from Newfield’s interests may differ substantially from the estimates in this presentation. Factors affecting ultimate recovery include the scope of Newfield’s ongoing drilling program, which will be directly affected by commodity prices, the availability of capital, drilling and production costs, availability of drilling services and equipment, drilling results, lease expirations, transportation constraints, regulatory approvals and other factors, and actual drilling results, including geological and mechanical factors affecting recovery rates. Newfield may use terms in this presentation, such as “EURs”, “upside potential”, “net unrisked resource”, “gross EURs”, and similar terms that the SEC’s guidelines strictly prohibit in SEC filings. These terms include reserves with substantially less certainty than proved reserves, and no discount or other adjustment is included in the presentation of such reserve numbers. Investors are urged to consider closely the oil and gas disclosures in Newfield’s 2015 Annual Report on Form 10-K and subsequent public filings, available at www.newfield.com, www.sec.gov or by writing Newfield at 4 Waterway Square Place, Suite 100, The Woodlands, Texas 77380 Attn: Investor Relations. In addition, this presentation contains non-GAAP financial measures, which include, but are not limited to, Adjusted EBITDA. Newfield defines EBITDA as net (loss) income before income tax (benefit) expense, interest expense and depreciation, depletion and amortization. Adjusted EBITDA, as presented herein, is EBITDA before ceiling test impairments, gains on asset sales, non-cash compensation expense and net unrealized (gains) / losses on commodity derivatives. Adjusted EBITDA is not a recognized term under GAAP and does not represent net income as defined under GAAP, and should not be considered an alternatives to net income as an indicator of operating performance or to cash flows as a measure of liquidity. Adjusted EBITDA is a supplemental financial measure used by Newfield’s management and by securities analysts, lenders, ratings agencies and others who follow the industry as an indicator of Newfield’s ability to internally fund exploration and development activities. 23