Attached files
| file | filename |
|---|---|
| 8-K - FORM 8-K - CIVISTA BANCSHARES, INC. | d164301d8k.htm |
 Investor Presentation
Second Quarter 2016
James O. Miller - Chairman, President & Chief Executive Officer Dennis G. Shaffer - Executive Vice President & President of Civista Bank Richard J. Dutton - Senior Vice President, Chief Operating Officer 1 Exhibit 99.1 |
 Forward-Looking Statements
Comments made in this presentation include “forward-looking statements” within the meaning of the Private Securities Litigation Reform Act of 1995. Forward-looking statements are subject to numerous assumptions, risks and uncertainties. Although management believes that the expectations reflected in the forward-looking statements are reasonable, actual results or future events could differ, possibly materially, from those anticipated in these forward-looking statements. For factors that could cause actual results to differ from our forward-looking statements, please refer to “Risk Factors” in the Company’s Form 10-K filed with the SEC on March 15, 2016. The forward-looking statements speak only as of the date of this presentation, and Civista Bancshares, Inc. assumes no duty to update any forward-looking statements to reflect events or circumstances after the date of this presentation, except to the extent required by law. 2 |
 Contact Information
Civista Bancshares, Inc.’s common shares are traded on the NASDAQ Capital
Market under the symbol “CIVB.” The Company’s
depository shares, each representing
1/40 th ownership interest in a Series B Preferred Share, are traded on the NASDAQ Capital Market under the symbol “CIVBP.” Additional information can be found at: www.civb.com James O. Miller Chairman, President & Chief Executive Officer jomiller@civb.com Telephone: 888.645.4121 3 |
 Corporate Overview
8 th Largest Publicly Traded Commercial Bank in Ohio Community Banking Focused Operations in 12 Ohio Counties – 27 Branches & 1 Loan Production Office Operations in 4 of the top 5 Ohio MSAs Acquisitive Franchise Poised for Future Growth Corporate Overview Full-Service Banking Organization with Diversified Revenue Streams – Commercial Banking – Retail Banking – Wealth Management – Mortgage Banking Key Facts 4 Corporate Rebranding NASDAQ: CIVB ¹ Market data as of July 22, 2016. As of June 30, 2016, ($ in millions) Assets $1,359.9 Gross Loans $1,028.9 Deposits $1,115.0 Market Cap. ¹ $114.0 |
 5 Financial Highlights - Diluted EPS calculated as if all preferred shares have converted to common
- ROATCE equals annualized net income, adjusted for amortization of intangibles, divided by average common equity minus average intangible assets Financial Highlights ($s in thousands, except per share data) June 30, 2016 June 30, 2015 % Change Balance Sheet Assets $1,359,911 $1,317,272 3.24% Gross Loans 1,028,922 1,002,917 2.59% Deposits 1,115,007 1,075,806 3.64% Performance Analysis Net Income Available to Common $9,124 $5,497 65.98% ROAA 1.21% 0.82% 48.53% ROAE 14.16% 9.38% 50.84% ROATCE 23.77% 16.80% 41.48% Market Data Market Capitalization $103,349 $84,711 Price / Tangible Book Value 122.0% 124.3% Price/LTM diluted EPS 8.8x 10.8x |
 6 Investment Highlights Experienced management team with strong track record Leading Ohio community bank franchise focused on rural and targeted urban markets
– Gather attractive low-cost rural deposits and lend in select urban markets
Demonstrated organic growth and proven acquirer
– Opened Loan Production Office on east side of Cleveland (Mayfield Heights) in Q1 2015
– Completed TCNB Financial Corp. acquisition and successful operational integration in Q1 2015
Successful unification into Civista brand in Q2 2015
Stable credit quality
– Decline in NPAs to Assets of 70% from 3.39% in 2011 to 1.02% in 2016 1 Defined as nonaccrual loans and leases, renegotiated loans and leases and other real estate owned
1 |
 7 Investment Highlights Demonstrated earnings growth – YTD FTE Net Interest Margin 3.81% - We have maintained this level over the last twelve months in this low-rate, flatter yield curve environment. – Strong noninterest income growth enhanced by unique tax refund processing platform
– Y-o-Y net income available to common shareholders growth of ~66%
– ROATCE of 23.77% for 2016 Improving operating leverage – 29% growth in gain on sale of loans, primarily mortgage loans, through Q2 2016 over Q2 2015
– Continued focus on costs – YTD noninterest expense up 2.0% over YTD 2015 – Achieved cost synergy targets in TCNB acquisition within first year while maintaining revenue and loan growth goals
Capital – $50 million shelf registration statement went effective with SEC in August 2015
– Shareholders recently approved proposals to eliminate preemptive rights and cumulative voting
• Approved by greater than 88% of CIVB shareholders • Ability to grow capital organically (TCE increased from 4.93% in 2011 to 6.38% Q2 2016)
- ROATCE equals annualized net income, adjusted for amortization of intangibles, divided by average common equity minus average intangible assets |
 8 Experienced Management Team Chairman, President & CEO 42 years of banking experience Joined in 1986 James O. Miller SVP & Chief Operating Officer 30 years of banking experience Joined in 2007 Richard J. Dutton SVP & Chief Lending Officer 28 years of banking
experience
Joined in 2016 Charles A. Parcher SVP & General Counsel 14 years of banking experience Joined in 2002 James E. McGookey SVP & Controller 28 years of banking experience Joined in 1988 Todd A. Michel SVP & Chief Risk Officer 20 years of banking experience Joined in 2013 John A. Betts SVP & Chief Credit Officer 31 years of banking experience Joined in 2010 Paul J. Stark Dennis G. Shaffer EVP President, Civista Bank 30 years of banking
experience
Joined in 2009 |
 9 Branch Footprint Note: Market share information as of June 30, 2015. Sandusky / Akron / Cleveland, Ohio $612 million in loans $656 million in deposits 11 branch locations #1 deposit market share in Sandusky, Ohio with ~ 43% market share North Central Ohio $86 million in loans $176 million in deposits 7 branch locations ~40% deposit share in our markets $253 million in loans $201 million in deposits 7 branch locations 23% deposit market share in the rural markets West Central Ohio Greater Dayton, Ohio $78 million in loans $82 million in deposits 3 branch locations ~1.47% deposit share in our markets |
 10 10 Attractive Target Markets North Central Ohio Sandusky / Akron / Cleveland West Central Ohio Greater Dayton Ohio |
 11 Proven Acquirer & Attractive Organic Growth Expanded commercial loan growth in Columbus, Cleveland, Akron and Dayton markets
– Since year-end 2011, loan portfolios in these markets have increased from $163
million to $415 million through Q2 2016
Maintain a low cost, locally generated deposit base
Expanded residential mortgage lending by hiring of experienced lending team in
the Columbus / Dublin, Cleveland and Dayton Ohio
markets Total Assets
$ in millions
Total Gross Loans
$ in millions
Total Deposits
$ in millions
$1,113 $1,137 $1,168 $1,213 $1,315 $1,360 2011 2012 2013 2014 2015 2016 Q2 $785 $816 $861 $915 $1,002 $1,029 2011 2012 2013 2014 2015 2016 Q2 $901 $926 $942 $969 $1,052 $1,115 2011 2012 2013 2014 2015 2016 Q2 |
 12 2016 Peer data as of June 30, 2016, or the latest available date. Source: SNL Financial. Comparable peers represents banks located in OH, IN, IL, MI, WI, WV and PA with total assets between $1.0 billion
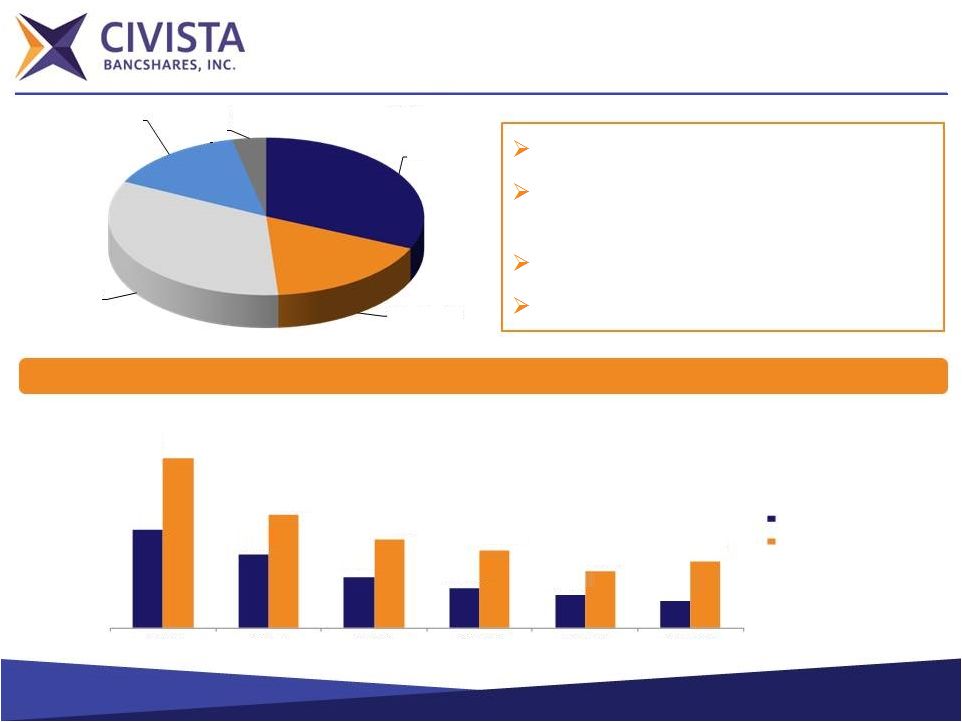
and $2.0 billion. Deposit Mix
2016 Total Cost of Deposits: 0.15%
31.7% Noninterest Bearing Demand
Deposits Total Deposits: $1.1 billion 2016 Loan/Deposit Ratio: 92.3% Total Cost of Deposits (%) Non-Interest Bearing Demand 32% Interest Bearing Demand 17% Savings 34% Certificates of Deposit 14% Brokered Deposits 3% 0.56% 0.42% 0.29% 0.22% 0.19% 0.15% 0.96% 0.64% 0.50% 0.44% 0.32% 0.38% 2011Y 2012Y 2013Y 2014Y 2015Y Q2 2016 CIVB Peer Median |
 13 2016 Peer data as of June 30, 2016, or the latest available date. Source: SNL Financial. Comparable peers represents banks located in OH, IN, IL, MI, WI, WV and PA with total assets between $1.0 billion
and $2.0 billion. Loan Mix
2016 Loan Yield: 4.69%
Total Gross Loans: $1.0 billion
Yield on Loans (%)
CRE Non-Owner
Occupied 29% CRE Owner Occupied 16% Single Family 24% C&I 11% Multi-family 7% Farmland & Agriculture 5% C&D & Land 6% Consumer & Other 2% 5.45% 5.13% 4.74% 4.58% 4.57% 4.69% 5.57% 5.30% 4.78% 4.52% 4.44% 4.35% 2011Y 2012Y 2013Y 2014Y 2015Y Q2 2016 CIVB Peer Median |
 14 Improving Asset Quality Reserves / NPLs NCOs / Average Loans Loan Loss Reserves / Gross Loans NPAs & 90+PD / Assets Loan Loss Reserves / Gross Loans NPAs & 90+PD / Assets 3.51% 3.32% 2.22% 1.57% 1.01% 1.02% 2011 2012 2013 2014 2015 Q2 2016 2.70% 2.42% 1.92% 1.56% 1.43% 1.41% 2011 2012 2013 2014 2015 Q2 2016 58.02% 53.05% 64.17% 77.18% 108.93% 106.02% 2011 2012 2013 2014 2015 Q2 2016 1.35% 1.01% 0.53% 0.43% 0.11% 0.07% 2011 2012 2013 2014 2015 Q2 2016 |
 15 Effectively Managing Assets & Liabilities Asset duration of less than two years Sell fixed-rate mortgages Encourage variable-rate commercial lending or swap into variable, if appropriate Limit fixed-rate terms to five years Liability duration greater than three years
Focus on low-cost “sticky” demand deposits
Don’t overprice or overextend time deposits
Investment Portfolio Snapshot
3.54 3.38 1.46 1.64 Q2 2016 Q2 2015 Asset Duration Liability Duration Treasuries Agency Debt Fixed MBS MBS ARMs Agency CMO Agency Multifamily SBA Corporates Municipals Student Loans Book % of Gain / Book Yield Effective Duration Value Total (Loss) $ Flat +300bps Treasuries (1) 1.0 0.5% 0.0 0.5 0.5 Agency Debt (15) 33.9 17.8% 0.2 1.7 2.0 Fixed MBS (50) 23.2 12.2% 0.7 2.3 3.7 MBS ARMs (10) 1.7 0.9% 0.1 1.7 2.2 Agency CMO (18) 9.0 4.7% 0.1 1.7 3.2 Agency Multifamily (19) 28.1 14.7% 0.3 2.0 2.5 SBA (7) 6.4 3.4% 0.1 0.6 0.5 Municipals (171) 82.8 43.4% 6.7 3.1 4.2 Other (9) 4.5 2.4% 0.5 - - TOTAL (300) 190.7 100.0% 8.8 2.4 3.3 SECTOR BREAKDOWN 3m Speed 0.50% 1.23% 2.35% 3.23% 2.50% 1.49% 1.92% 4.99% - 3.20% |
 16 Peer Leading FTE Net Interest Margin 2016 Peer data as of June 30, 2016, or the latest available date. Source: SNL Financial. Comparable peers represents banks located in OH, IN, IL, MI, WI, WV and PA with total assets between $1.0 billion
and $2.0 billion. 4.00%
3.98% 3.79% 3.79% 3.96% 3.81% 3.72% 3.56% 3.56% 3.54% 3.49% 3.37% 2011Y 2012Y 2013Y 2014Y 2015Y Q2 2016 CIVB Peer Median |
 17 Non-Interest Metrics & Initiatives ¹ From American Banker Magazine, September 2015 © 2015 SourceMedia, Inc. All rights reserved. Used by permission
and protected by the Copyright Laws of the United States.
The printing, copying, redistribution, or retransmission of this Content without expressed written permission is prohibited. Efficiency Ratio Non-Interest Income / Average Assets Growing fee income platform – Service charges on deposit accounts were $2.5 million and $2.2 million YTD 2016 and 2015, respectively Mortgage Banking – Gain on sale of loans, primarily mortgage loans, was $800 thousand and $619 thousand YTD 2016 and 2015, respectively Wealth management – ~$413 million in Assets Under Management as of June 30, 2016 Income tax refund processing program – Specialized refund processing earned $2.8 and $2.0 million YTD 2016 and 2015, respectively Continuing focus on improving efficiency and operating leverage Investment in people ¹ Continuing evaluation of branch network and opportunities 0.89% 0.98% 1.00% 1.11% 1.07% 1.24% 2011 2012 2013 2014 2015 Q2 2016 67.34% 70.57% 80.44% 71.77% 66.99% 61.40% 2011 2012 2013 2014 2015 Q2 2016 |
 18 Profitability & Returns Analysis 1 LTM basis Diluted Earnings per Share ROATCE ROAA Net Income Available to Common Shareholders $2,782 $4,386 $5,020 $7,655 $11,168 $14,794 2011 2012 2013 2014 2015 2016 Q2¹ 0.35% 0.49% 0.53% 0.77% 0.95% 1.21% 2011 2012 2013 2014 2015 2016 Q2 $0.36 $0.57 $0.64 $0.85 $1.17 $1.49 2011 2012 2013 2014 2015 2016 Q2¹ 7.00% 9.06% 9.93% 12.45% 16.33% 23.77% 2011 2012 2013 2014 2015 2016 Q2 |
 19 Capital Position ($s in thousands, except per share data) As 2011 2012 2013 2014 2015 2016 Q2 Converted Total Equity $102,528 $103,980 $128,376 $115,909 $125,173 $136,203 $136,203 Preferred Equity $23,151 $23,184 $46,316 $23,132 $22,273 $22,124 $0 Common Equity $79,377 $80,796 $82,060 $92,777 $102,900 $114,079 $136,203 TCE / TA 4.93% 5.03% 5.08% 5.80% 5.71% 6.38% 7.23% CET1 Risk-based Capital Ratio 6.77% 6.87% 6.81% 7.57% 7.55% 7.93% 10.00% Tier 1 Leverage Ratio 9.30% 9.34% 11.64% 10.70% 9.96% 9.85% 9.85% Tier 1 Risk-based Capital Ratio 13.80% 13.25% 15.82% 13.44% 12.70% 12.76% 12.76% Total Risk-based Capital Ratio 15.10% 14.84% 17.08% 14.70% 13.96% 14.01% 14.01% For the Years Ended December 31, |
 20 Increasing Shareholder Value Source: SNL Financial. Market Data as of June 30, 2016, or the latest available date.
¹ Comparable peers represents banks located in OH, IN, IL, MI, WI, WV and
PA with total assets between $1.0 billion and $2.0 billion. Stock
Price Price / Tangible Book Value of 122% as
compared to peer median of 141% ¹
Price / LTM EPS of 8.8x as compared to
peer median of 14.9x ¹
Stock Price Performance vs. Peers
$4.03 $5.25 $6.52 $10.28 $12.83 $13.10 2011 2012 2013 2014 2015 2016 (25%) 25% 75% 125% 175% 225% 275% 6/30/2011 6/30/2012 6/30/2013 6/30/2014 6/30/2015 6/30/2016 CIVB CIVB Peers NASDAQ Bank 245.6% 74.7% 55.5% |
 21 Commitment to Shareholders Long-term Shareholder Value through Growth and Profitability |
 22 Strategic Focus & Growth Strategy Organic growth – Capitalize on commercial and consumer lending opportunities – Grow core deposit base in rural and targeted urban markets – Identify and evaluate loan production opportunities in select metro markets
Acquisition opportunities
– Rural – Urban Asset quality Efficiency and operating leverage Capital |
    23 Operating Results ($s in thousands, except per share data) LTM Q2 2011 2012 2013 2014 2015 2016 Net Interest Income $41,361 $40,578 $39,974 $41,866 $47,392 $49,738 Provision for Loan Losses 9,800 6,400 1,100 1,500 1,200 (900) Noninterest Income 9,971 11,200 12,062 13,874 14,278 15,557 Noninterest Expense 36,727 38,074 43,384 41,550 42,944 43,364 Net Income/(Loss) 3,958 5,579 6,179 9,528 12,745 16,358 Net Income Available to Common Shareholders $2,782 $4,386 $5,020 $7,655 $11,168 $14,794 Diluted Earnings/(Loss) per Common Share $0.36 $0.57 $0.64 $0.85 $1.17 $1.49 Return on Average Assets (ROAA) 0.35% 0.49% 0.53% 0.77% 0.95% 1.16% Return on Average Equity (ROAE) 3.96 5.36 5.97 8.34 10.59 12.97% For the Years Ended December 31, |
 24 The Civista Story Attractively Valued Versus Peers Strong and Seasoned Management Team Leading Ohio Community Banking Franchise Platform to Support Future Growth Proven and Disciplined Acquirer |
 25 Compelling Investment Opportunity Trading at a discount to peers on a Price/Tangible Book Value basis and a substantial discount on a
Price/LTM EPS basis. Superior asset quality Proven acquirer Peer leading NIM – Low cost deposits –
23 BPs lower than peers
– High quality loan portfolio – 34 BPs higher than peers Experienced Ohio based management team with an of average 28 years in banking Strategically positioned in high quality Ohio lending markets as well as low cost deposit markets
– Seasoned lending teams in all markets incentivized to underwrite high-quality loans
Superior profitability improvement from 2011 to Q2 2016
– Net Income CAGR: 45.0% – ROAA CAGR: 31.7% – EPS CAGR: 37.1% – ROATCE CAGR: 31.2% Peer data as of June 30, 2016, or the latest available date. |
 26 Thank You |