Attached files
| file | filename |
|---|---|
| EX-99.1 - EX-99.1 - CAPITAL SENIOR LIVING CORP | d193864dex991.htm |
| 8-K - FORM 8-K - CAPITAL SENIOR LIVING CORP | d193864d8k.htm |
Capital Senior Living Executing a Clear, Differentiated Strategy to Drive Superior Shareholder Value Exhibit 99.2
Forward-Looking Statements The forward-looking statements in this presentation are subject to certain risks and uncertainties that could cause results to differ materially, including, but not without limitation to, the Company’s ability to complete the refinancing of certain of our wholly owned communities, realize the anticipated savings related to such financing, find suitable acquisition properties at favorable terms, financing, licensing, business conditions, risks of downturns in economic conditions generally, satisfaction of closing conditions such as those pertaining to licensures, availability of insurance at commercially reasonable rates and changes in accounting principles and interpretations among others, and other risks and factors identified from time to time in our reports filed with the Securities and Exchange Commission The Company assumes no obligation to update or supplement forward-looking statements in this presentation that become untrue because of new information, subsequent events or otherwise.
Non-GAAP Financial Measures Adjusted EBITDAR, Adjusted EBITDAR Margin, Adjusted Net Income and Adjusted CFFO are financial measures of operating performance that are not calculated in accordance with U.S. generally accepted accounting principles (“GAAP”). Non-GAAP financial measures of operating performance may have material limitations in that they do not reflect all of the amounts associated with our results of operations as determined in accordance with GAAP. As a result, these non-GAAP financial measures of operating performance should not be considered a substitute for, nor superior to, financial results and measures determined or calculated in accordance with GAAP. The Company believes that these non-GAAP performance measures are useful as they are performance measures used by management in identifying trends in day-to-day performance because they exclude the costs associated with acquisitions and conversions and items that do not reflect the ordinary performance of our operations and provide indicators to management of progress in achieving both consolidated and business unit operating performance. In addition, these measures are used by many research analysts and investors to evaluate the performance and the value of companies in the senior living industry. The Company strongly urges you to review on the last page of the Company’s earnings releases the reconciliation of income from operations to Adjusted EBITDAR and Adjusted EBITDAR Margin and the reconciliation of net loss to Adjusted Net Income and Adjusted CFFO, along with the Company’s consolidated balance sheets, statements of operations, and statements of cash flows.
Table of Contents Executive Summary Key Investment Highlights Attractive Positioning in the Senior Living Market Compelling Strategy to Drive Shareholder Value Accomplished Leadership Team Focused on Execution Track Record of Strong Growth and Uniquely Positioned for Continued Success Conclusion
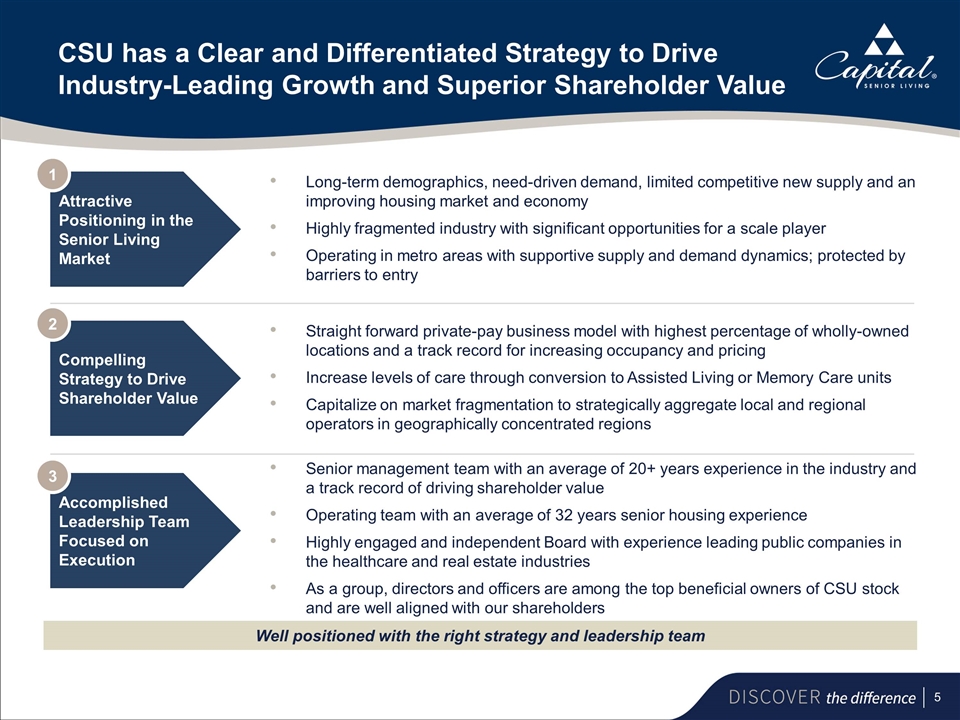
Long-term demographics, need-driven demand, limited competitive new supply and an improving housing market and economy Highly fragmented industry with significant opportunities for a scale player Operating in metro areas with supportive supply and demand dynamics; protected by barriers to entry Straight forward private-pay business model with highest percentage of wholly-owned locations and a track record for increasing occupancy and pricing Increase levels of care through conversion to Assisted Living or Memory Care units Capitalize on market fragmentation to strategically aggregate local and regional operators in geographically concentrated regions Senior management team with an average of 20+ years experience in the industry and a track record of driving shareholder value Operating team with an average of 32 years senior housing experience Highly engaged and independent Board with experience leading public companies in the healthcare and real estate industries As a group, directors and officers are among the top beneficial owners of CSU stock and are well aligned with our shareholders Attractive Positioning in the Senior Living Market 1 Compelling Strategy to Drive Shareholder Value 2 Accomplished Leadership Team Focused on Execution 3 Well positioned with the right strategy and leadership team CSU has a Clear and Differentiated Strategy to Drive Industry-Leading Growth and Superior Shareholder Value

Attractive Positioning in the Senior Living Market 1
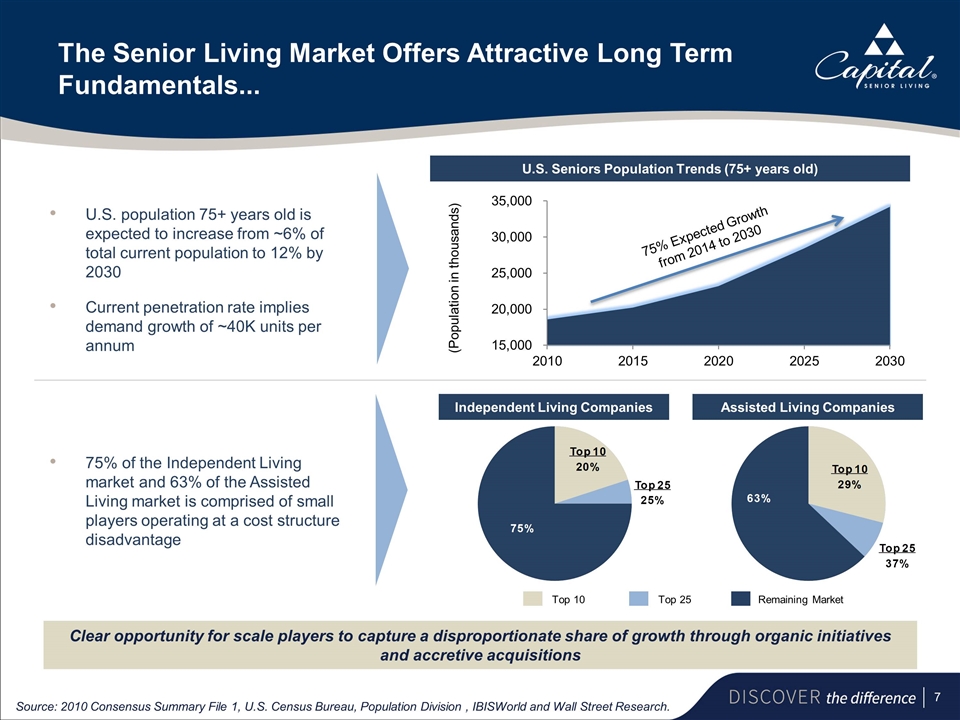
The Senior Living Market Offers Attractive Long Term Fundamentals... U.S. population 75+ years old is expected to increase from ~6% of total current population to 12% by 2030 Current penetration rate implies demand growth of ~40K units per annum 75% of the Independent Living market and 63% of the Assisted Living market is comprised of small players operating at a cost structure disadvantage (Population in thousands) 75% Expected Growth from 2014 to 2030 Top 10 Remaining Market Top 25 Clear opportunity for scale players to capture a disproportionate share of growth through organic initiatives and accretive acquisitions Source: 2010 Consensus Summary File 1, U.S. Census Bureau, Population Division , IBISWorld and Wall Street Research. U.S. Seniors Population Trends (75+ years old) Independent Living Companies Assisted Living Companies
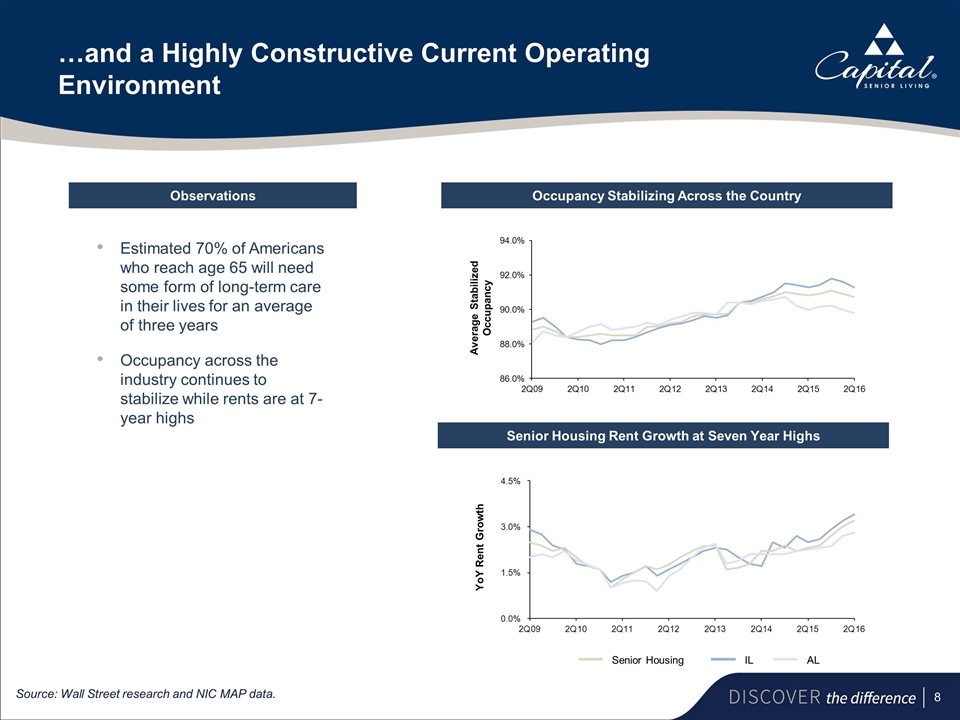
Observations …and a Highly Constructive Current Operating Environment Estimated 70% of Americans who reach age 65 will need some form of long-term care in their lives for an average of three years Occupancy across the industry continues to stabilize while rents are at 7-year highs Source: Wall Street research and NIC MAP data. Occupancy Stabilizing Across the Country Senior Housing Rent Growth at Seven Year Highs Senior Housing IL AL Average Stabilized Occupancy YoY Rent Growth
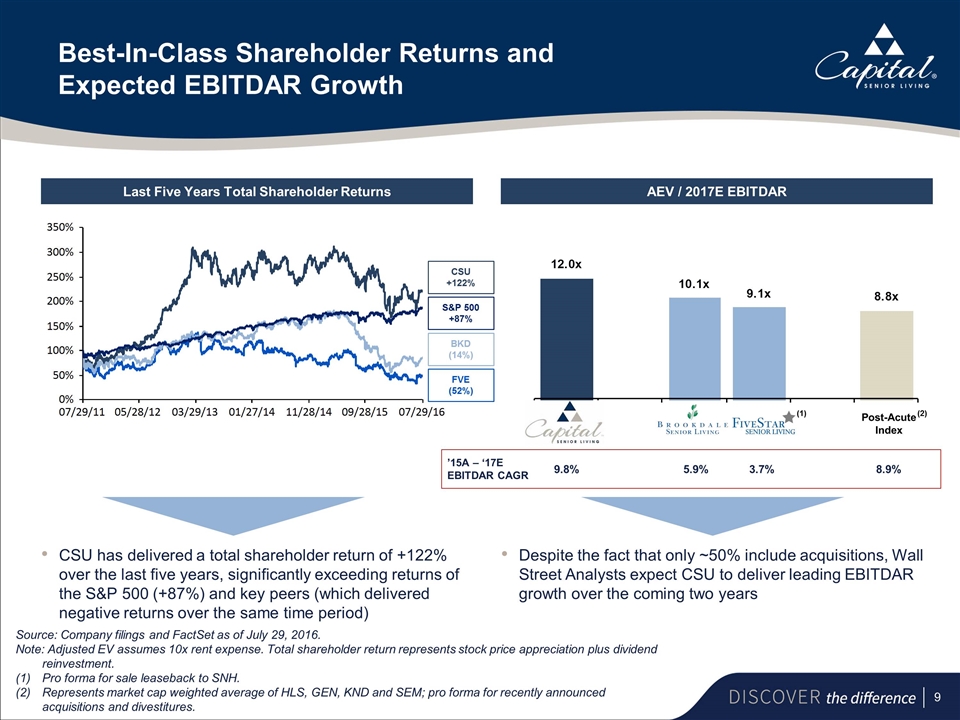
Best-In-Class Shareholder Returns and Expected EBITDAR Growth Last Five Years Total Shareholder Returns AEV / 2017E EBITDAR CSU has delivered a total shareholder return of +122% over the last five years, significantly exceeding returns of the S&P 500 (+87%) and key peers (which delivered negative returns over the same time period) Despite the fact that only ~50% include acquisitions, Wall Street Analysts expect CSU to deliver leading EBITDAR growth over the coming two years CSU +122% S&P 500 +87% BKD (14%) FVE (52%) Post-Acute Index 9.8% 5.9% 3.7% 8.9% ’15A – ‘17E EBITDAR CAGR Source: Company filings and FactSet as of July 29, 2016. Note: Adjusted EV assumes 10x rent expense. Total shareholder return represents stock price appreciation plus dividend reinvestment. (1)Pro forma for sale leaseback to SNH. (2)Represents market cap weighted average of HLS, GEN, KND and SEM; pro forma for recently announced acquisitions and divestitures. (2) (1)
Compelling Strategy to Drive Shareholder Value 2
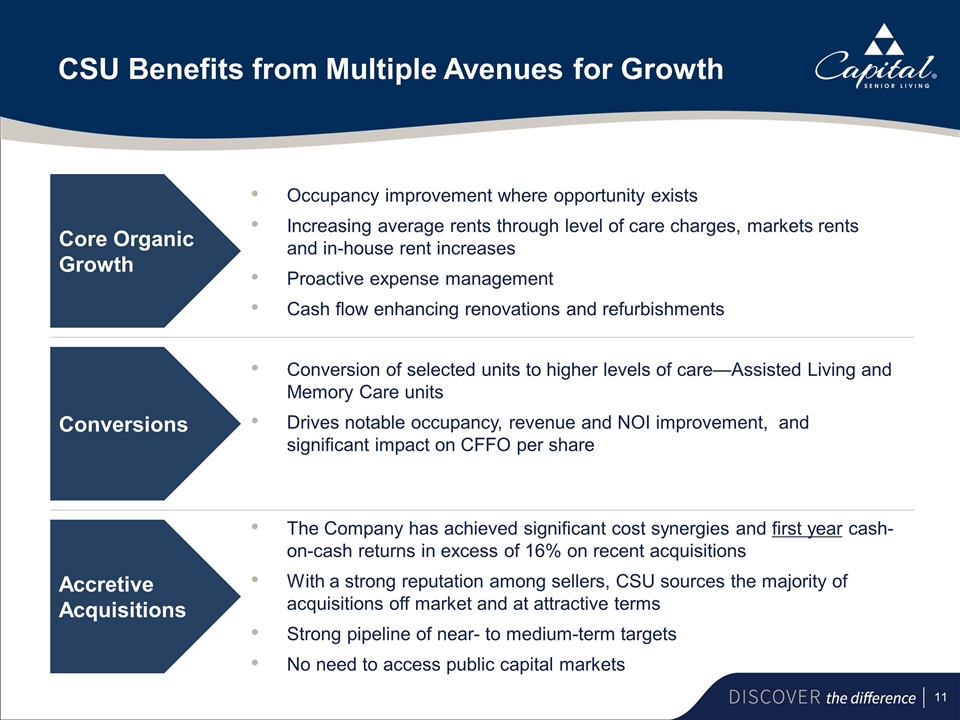
CSU Benefits from Multiple Avenues for Growth Core Organic Growth Conversions Accretive Acquisitions Occupancy improvement where opportunity exists Increasing average rents through level of care charges, markets rents and in-house rent increases Proactive expense management Cash flow enhancing renovations and refurbishments Conversion of selected units to higher levels of care—Assisted Living and Memory Care units Drives notable occupancy, revenue and NOI improvement, and significant impact on CFFO per share The Company has achieved significant cost synergies and first year cash-on-cash returns in excess of 16% on recent acquisitions With a strong reputation among sellers, CSU sources the majority of acquisitions off market and at attractive terms Strong pipeline of near- to medium-term targets No need to access public capital markets
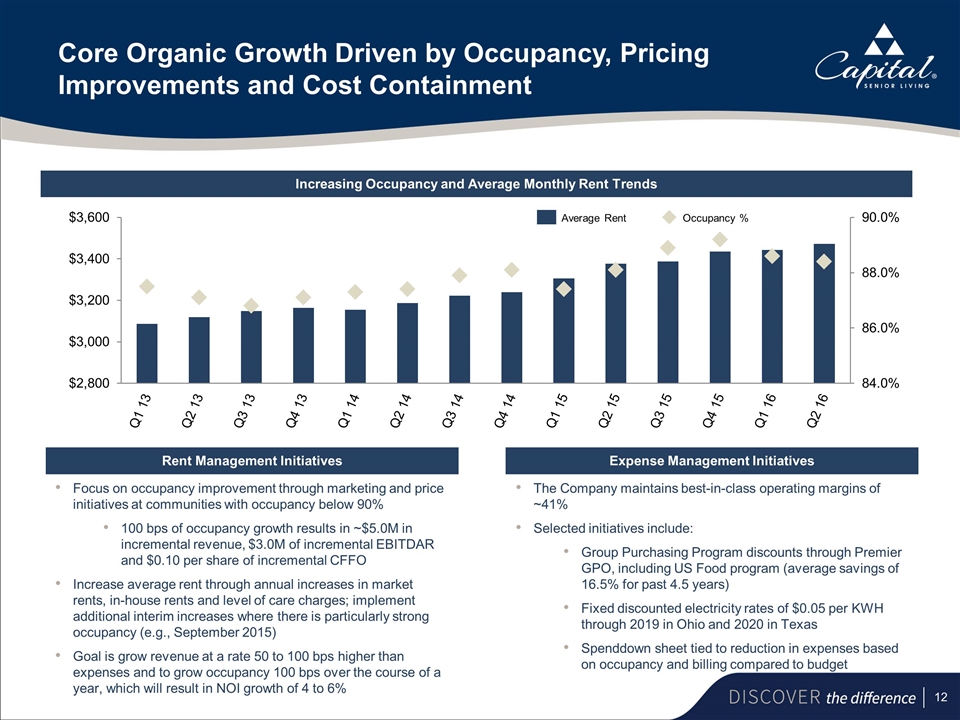
Core Organic Growth Driven by Occupancy, Pricing Improvements and Cost Containment Increasing Occupancy and Average Monthly Rent Trends Rent Management Initiatives Expense Management Initiatives Focus on occupancy improvement through marketing and price initiatives at communities with occupancy below 90% 100 bps of occupancy growth results in ~$5.0M in incremental revenue, $3.0M of incremental EBITDAR and $0.10 per share of incremental CFFO Increase average rent through annual increases in market rents, in-house rents and level of care charges; implement additional interim increases where there is particularly strong occupancy (e.g., September 2015) Goal is grow revenue at a rate 50 to 100 bps higher than expenses and to grow occupancy 100 bps over the course of a year, which will result in NOI growth of 4 to 6% The Company maintains best-in-class operating margins of ~41% Selected initiatives include: Group Purchasing Program discounts through Premier GPO, including US Food program (average savings of 16.5% for past 4.5 years) Fixed discounted electricity rates of $0.05 per KWH through 2019 in Ohio and 2020 in Texas Spenddown sheet tied to reduction in expenses based on occupancy and billing compared to budget Average Rent Occupancy %
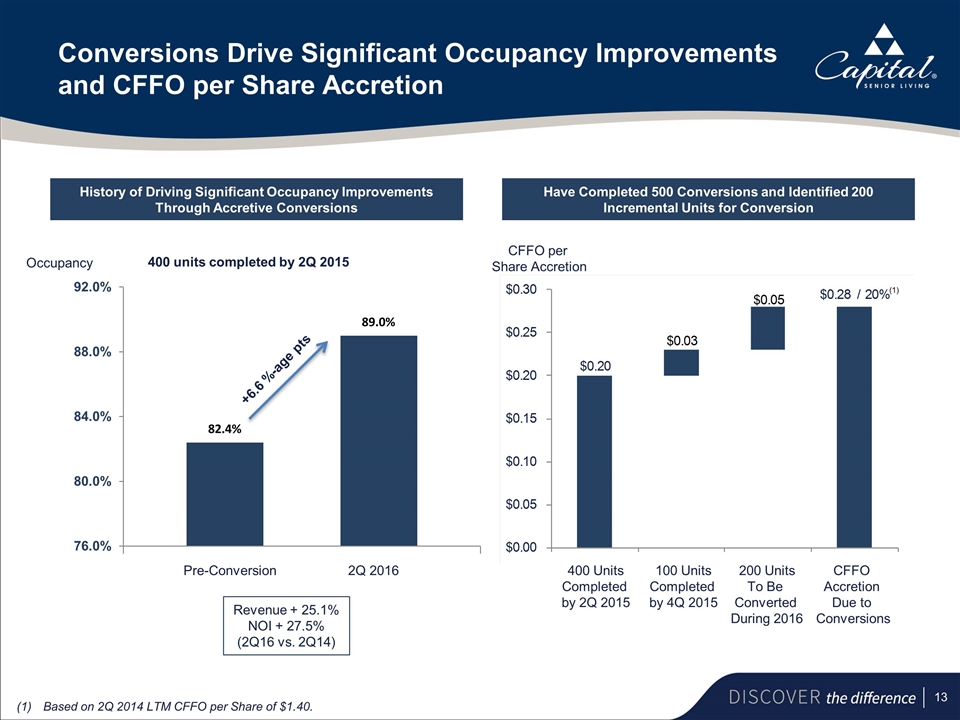
Conversions Drive Significant Occupancy Improvements and CFFO per Share Accretion History of Driving Significant Occupancy Improvements Through Accretive Conversions Have Completed 500 Conversions and Identified 200 Incremental Units for Conversion Occupancy CFFO per Share Accretion Pre-Conversion 2Q 2016 400 Units Completed by 2Q 2015 100 Units Completed by 4Q 2015 200 Units To Be Converted During 2016 400 units completed by 2Q 2015 CFFO Accretion Due to Conversions (1)Based on 2Q 2014 LTM CFFO per Share of $1.40. (1) Revenue + 25.1% NOI + 27.5% (2Q16 vs. 2Q14) +6.6 %-age pts
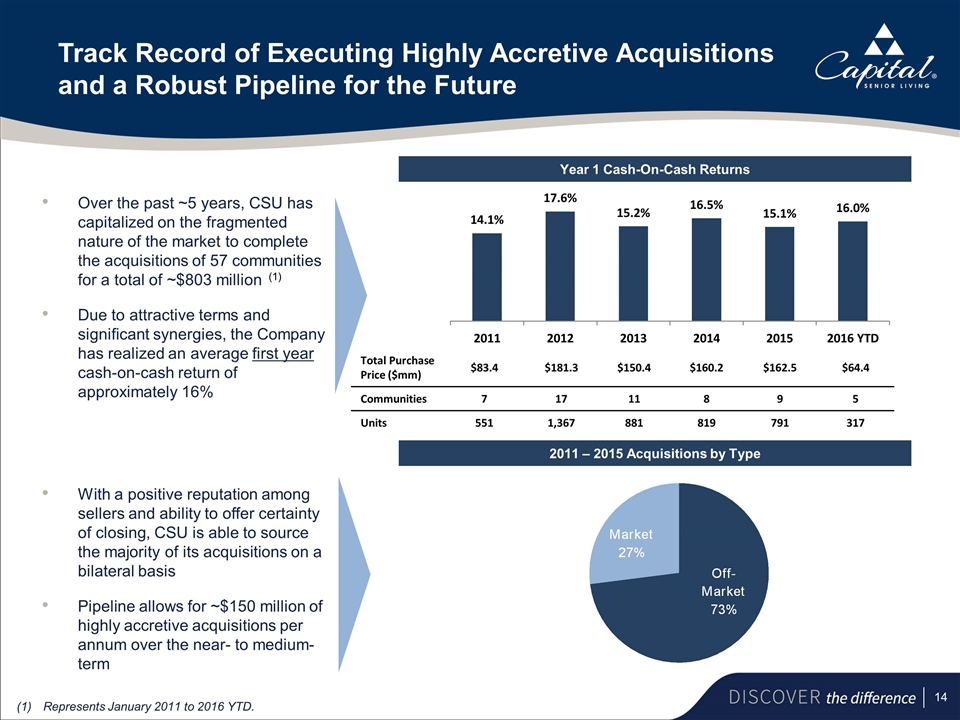
Track Record of Executing Highly Accretive Acquisitions and a Robust Pipeline for the Future Year 1 Cash-On-Cash Returns With a positive reputation among sellers and ability to offer certainty of closing, CSU is able to source the majority of its acquisitions on a bilateral basis Pipeline allows for ~$150 million of highly accretive acquisitions per annum over the near- to medium-term Over the past ~5 years, CSU has capitalized on the fragmented nature of the market to complete the acquisitions of 57 communities for a total of ~$803 million Due to attractive terms and significant synergies, the Company has realized an average first year cash-on-cash return of approximately 16% 2011 – 2015 Acquisitions by Type (1)Represents January 2011 to 2016 YTD. (1) Total Purchase Price ($mm) $83.4 $181.3 $150.4 $160.2 $162.5 $64.4 Communities 7 17 11 8 9 5 Units 551 1,367 881 819 791 317
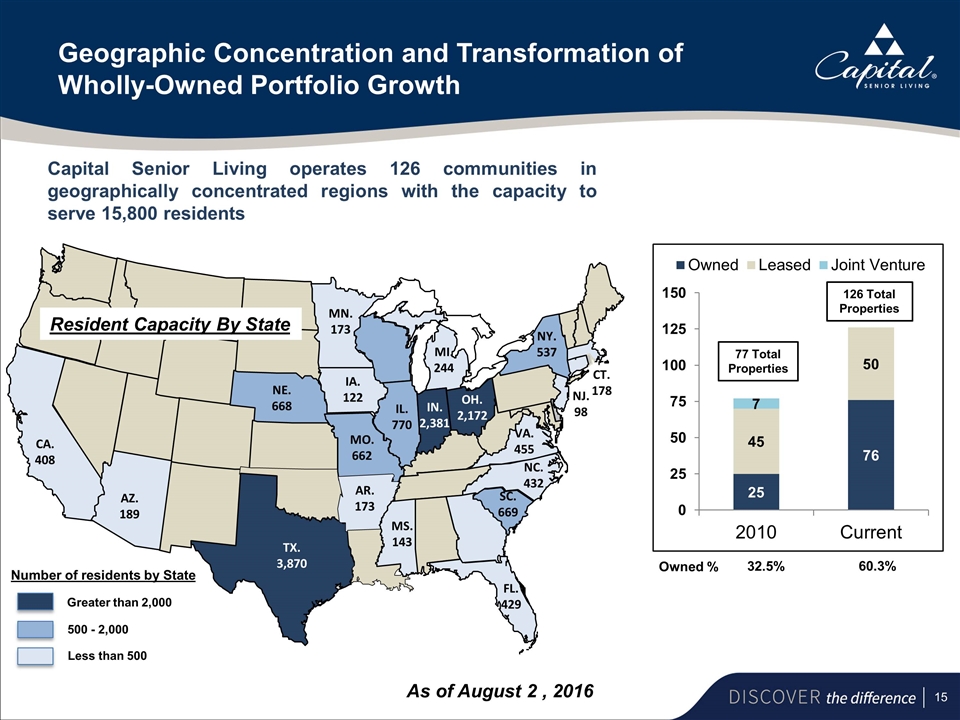
Geographic Concentration and Transformation of Wholly-Owned Portfolio Growth Owned % 32.5% 60.3% 77 Total Properties 126 Total Properties As of August 2 , 2016 AR. 173 AZ. 189 CT. 178 FL. 429 IA. 122 IL. 770 IN. 2,381 MI. 244 MN. 173 MO. 662 MS. 143 NC. 432 SC. 669 NE. 668 NJ. 98 NY. 537 OH. 2,172 TX. 3,870 VA. 455 CA. 408 CA. 408 AZ. 189 Number of residents by State Greater than 2,000 500 - 2,000 Less than 500 Resident Capacity By State Capital Senior Living operates 126 communities in geographically concentrated regions with the capacity to serve 15,800 residents
Accomplished Leadership Team Focused on Execution 3
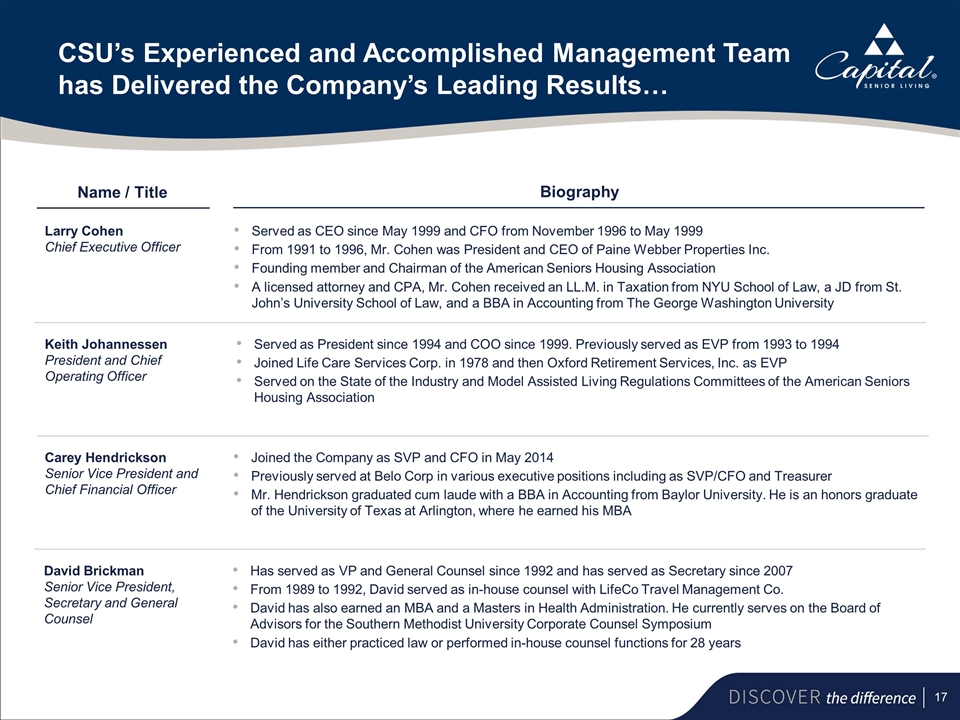
CSU’s Experienced and Accomplished Management Team has Delivered the Company’s Leading Results… Larry Cohen Chief Executive Officer Served as CEO since May 1999 and CFO from November 1996 to May 1999 From 1991 to 1996, Mr. Cohen was President and CEO of Paine Webber Properties Inc. Founding member and Chairman of the American Seniors Housing Association A licensed attorney and CPA, Mr. Cohen received an LL.M. in Taxation from NYU School of Law, a JD from St. John’s University School of Law, and a BBA in Accounting from The George Washington University Name / Title Biography Keith Johannessen President and Chief Operating Officer Served as President since 1994 and COO since 1999. Previously served as EVP from 1993 to 1994 Joined Life Care Services Corp. in 1978 and then Oxford Retirement Services, Inc. as EVP Served on the State of the Industry and Model Assisted Living Regulations Committees of the American Seniors Housing Association Carey Hendrickson Senior Vice President and Chief Financial Officer Joined the Company as SVP and CFO in May 2014 Previously served at Belo Corp in various executive positions including as SVP/CFO and Treasurer Mr. Hendrickson graduated cum laude with a BBA in Accounting from Baylor University. He is an honors graduate of the University of Texas at Arlington, where he earned his MBA David Brickman Senior Vice President, Secretary and General Counsel Has served as VP and General Counsel since 1992 and has served as Secretary since 2007 From 1989 to 1992, David served as in-house counsel with LifeCo Travel Management Co. David has also earned an MBA and a Masters in Health Administration. He currently serves on the Board of Advisors for the Southern Methodist University Corporate Counsel Symposium David has either practiced law or performed in-house counsel functions for 28 years
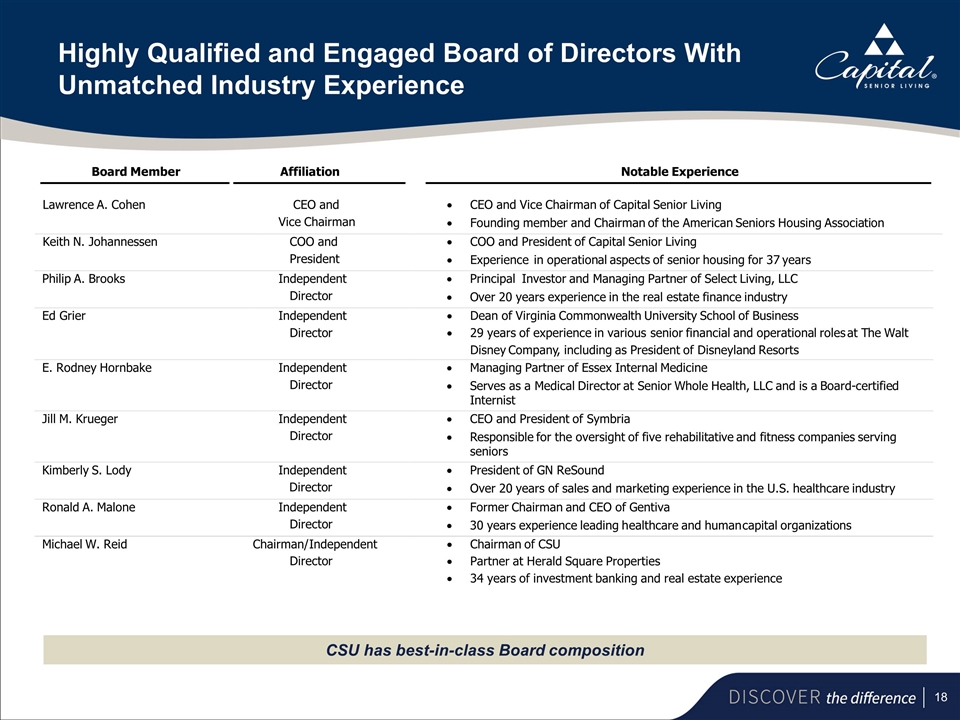
Highly Qualified and Engaged Board of Directors With Unmatched Industry Experience CSU has best-in-class Board composition Board Member Affiliation Notable Experience Lawrence A. Cohen CEO and Vice Chairman · CEO and Vice Chairman of Capital Senior Living · Founding member and Chairman of the American Seniors Housing Association Keith N. Johannessen COO and President · COO and President of Capital Senior Living · Experience in operational aspects of senior housing for 37 years Philip A. Brooks Independent Director · Principal Investor and Managing Partner of Select Living, LLC · O ver 20 years experience in the real estate finance industry Ed Grier Independent Director · Dean of Virginia Commonwealth University School of Business · 29 years of experience in various senior financial and operational roles at T he Walt Disney Company , including as President of Disneyland Resorts E. Rodney Hornbake Independent Director · Managing Partner of Essex Internal Medicine · S erves as a Medical Director at Senior Whole Health, LLC and is a Board - certified Internist Jill M. Krueger Independent Director · CEO and President of Symbria · R esponsible for the oversight of five rehabilitative and fitness companies serving seniors Kimberly S. Lody Independent Director · President of GN ReSound · Over 20 years of sales and marketing experience in the U.S. healthcare industry Ronald A. Malone Independent Director · Former Chairman and CEO of Gentiva · 30 years experience leading h ealthcare and human capital organizations Michael W. Reid Chairman/ Independent Director · Chairman of CSU · Partner at Herald Square Properties · 34 years of investment banking and real estate experience
Track Record of Strong Growth and Uniquely Positioned for Continued Success
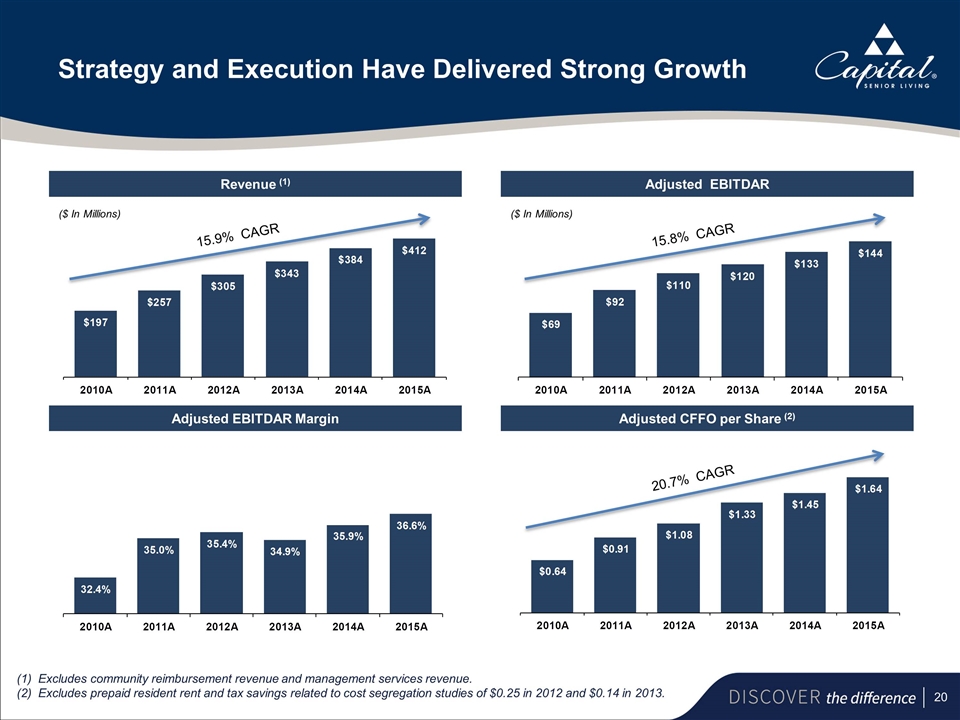
Strategy and Execution Have Delivered Strong Growth Revenue (1) Adjusted EBITDAR ($ In Millions) ($ In Millions) Adjusted EBITDAR Margin Adjusted CFFO per Share (2) 20.7% CAGR 15.8% CAGR 15.9% CAGR Excludes community reimbursement revenue and management services revenue. (2)Excludes prepaid resident rent and tax savings related to cost segregation studies of $0.25 in 2012 and $0.14 in 2013.
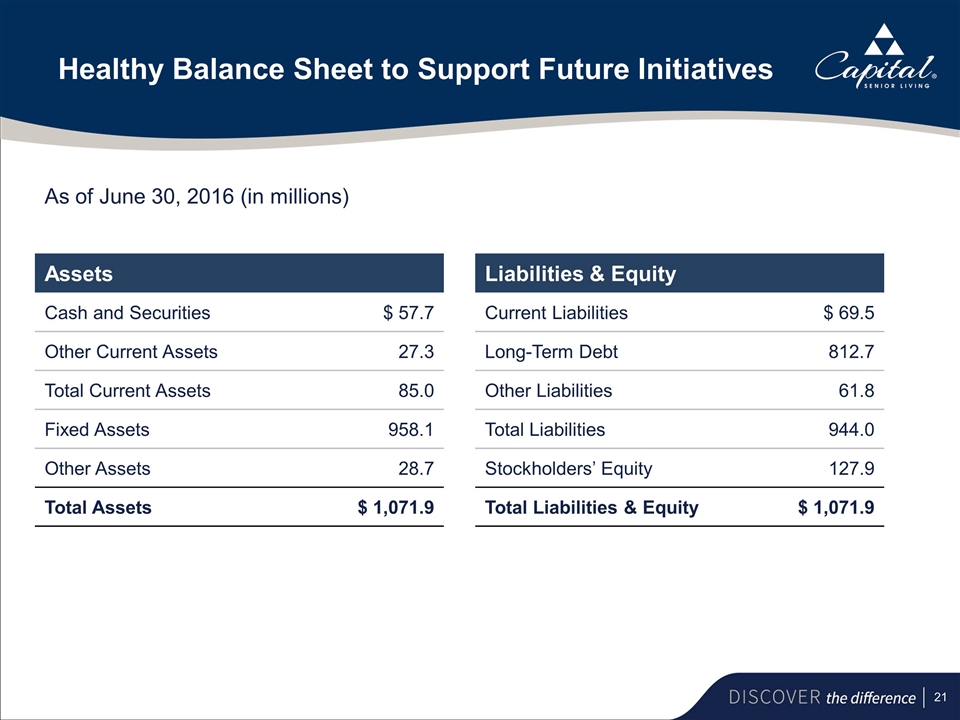
Healthy Balance Sheet to Support Future Initiatives Assets Cash and Securities $ 57.7 Other Current Assets 27.3 Total Current Assets 85.0 Fixed Assets 958.1 Other Assets 28.7 Total Assets $ 1,071.9 Liabilities & Equity Current Liabilities $ 69.5 Long-Term Debt 812.7 Other Liabilities 61.8 Total Liabilities 944.0 Stockholders’ Equity 127.9 Total Liabilities & Equity $ 1,071.9 As of June 30, 2016 (in millions)
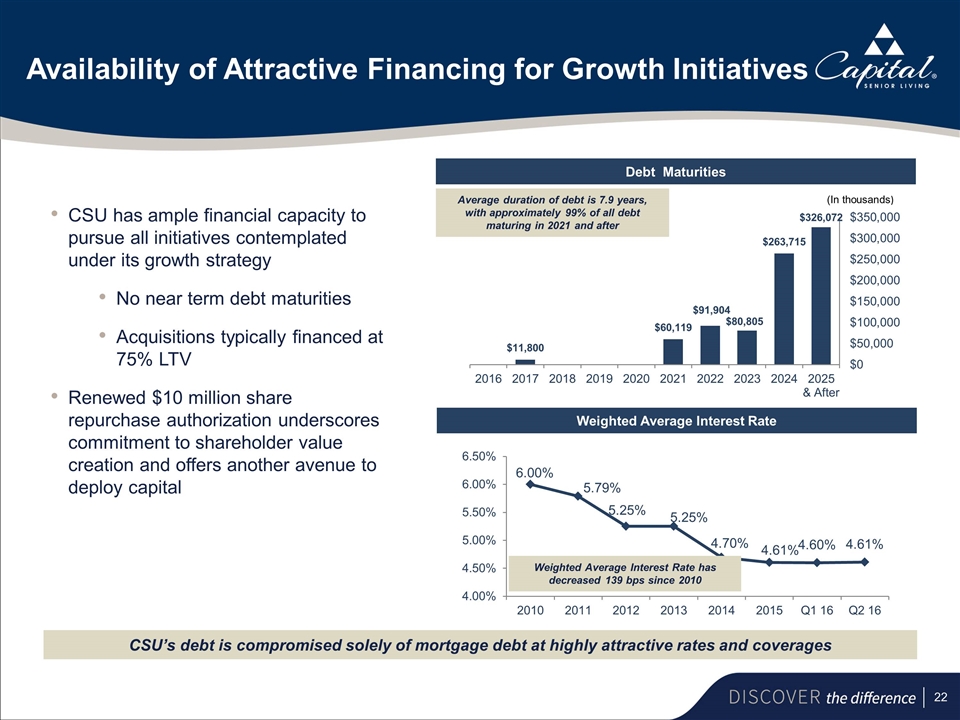
Debt Maturities Weighted Average Interest Rate CSU has ample financial capacity to pursue all initiatives contemplated under its growth strategy No near term debt maturities Acquisitions typically financed at 75% LTV Renewed $10 million share repurchase authorization underscores commitment to shareholder value creation and offers another avenue to deploy capital Average duration of debt is 7.9 years, with approximately 99% of all debt maturing in 2021 and after (In thousands) Weighted Average Interest Rate has decreased 139 bps since 2010 CSU’s debt is compromised solely of mortgage debt at highly attractive rates and coverages Availability of Attractive Financing for Growth Initiatives
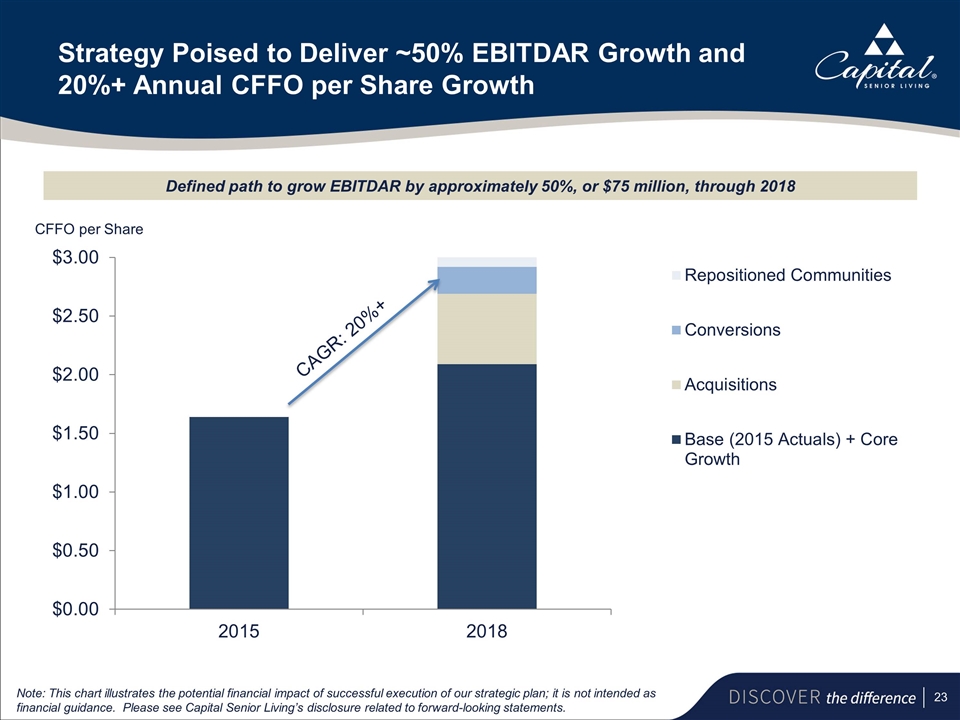
Strategy Poised to Deliver ~50% EBITDAR Growth and 20%+ Annual CFFO per Share Growth CAGR: 20%+ Note: This chart illustrates the potential financial impact of successful execution of our strategic plan; it is not intended as financial guidance. Please see Capital Senior Living’s disclosure related to forward-looking statements. Defined path to grow EBITDAR by approximately 50%, or $75 million, through 2018 CFFO per Share

Conclusion
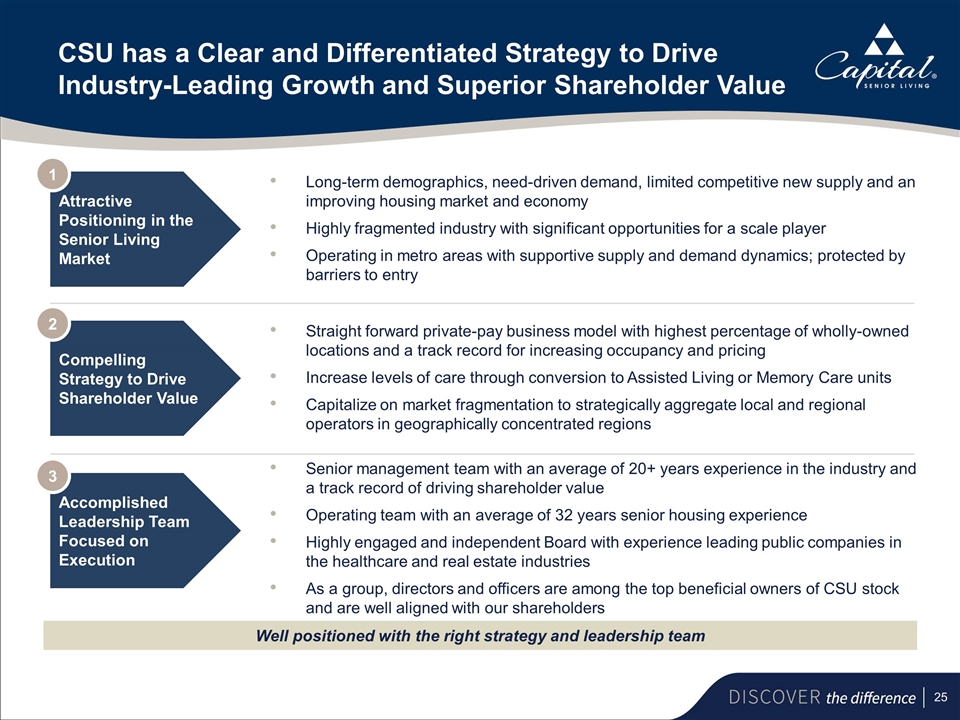
CSU has a Clear and Differentiated Strategy to Drive Industry-Leading Growth and Superior Shareholder Value Long-term demographics, need-driven demand, limited competitive new supply and an improving housing market and economy Highly fragmented industry with significant opportunities for a scale player Operating in metro areas with supportive supply and demand dynamics; protected by barriers to entry Straight forward private-pay business model with highest percentage of wholly-owned locations and a track record for increasing occupancy and pricing Increase levels of care through conversion to Assisted Living or Memory Care units Capitalize on market fragmentation to strategically aggregate local and regional operators in geographically concentrated regions Senior management team with an average of 20+ years experience in the industry and a track record of driving shareholder value Operating team with an average of 32 years senior housing experience Highly engaged and independent Board with experience leading public companies in the healthcare and real estate industries As a group, directors and officers are among the top beneficial owners of CSU stock and are well aligned with our shareholders Attractive Positioning in the Senior Living Market 1 Compelling Strategy to Drive Shareholder Value 2 Accomplished Leadership Team Focused on Execution 3 Well positioned with the right strategy and leadership team
