Attached files
| file | filename |
|---|---|
| 8-K - 8-K - LAKELAND BANCORP INC | d228494d8k.htm |
Exhibit 99.1
|
|
Second Quarter INVESTOR PRESENTATION
|
|
Statement Regarding Forward-Looking Information
The information disclosed in this document includes various forward-looking statements (with respect to corporate objectives, trends, and other financial and business matters) that are made in reliance upon the safe harbor provisions of the Private Securities Litigation Reform
Act of 1995. The words “anticipates”, “projects”, “intends”, “estimates”, “expects”, “believes”, “plans”, “may”, “will”, “should”, “could”, and other similar expressions are intended to identify such forward-looking statements. Statements regarding pro forma information with respect to Harmony Bank which Lakeland Bancorp acquired on July 1, 2016, and the growth opportunities applicable to the combined institution, are also forward-looking statements. Lakeland cautions that these forward-looking statements are necessarily speculative and speak only as of the date made, and are subject to numerous assumptions, risks and uncertainties, all of which may change over time. Actual results could differ materially from such forward-looking statements. The following factors, among others, could cause actual results to differ materially and adversely from such forward-looking statements: changes in the financial services industry and the U.S. and global capital markets, changes in economic conditions nationally, regionally and in the Company’s markets, the nature and timing of actions of the Federal Reserve Board and other regulators, the nature and timing of legislation affecting the financial services industry, government intervention in the U.S. financial system, changes in levels of market interest rates, pricing pressures on loan and deposit products, credit risks of the Company’s lending and leasing activities, customers’ acceptance of the Company’s products and services, competition, failure to successfully integrate and realize anticipated efficiencies and synergies after the Pascack Bancorp, Inc. and Harmony Bank mergers. Any statements made by Lakeland that are not historical facts should be considered to be forward-looking statements. Lakeland is not obligated to update and does not undertake to update any of its forward-looking statements made herein.
|
|
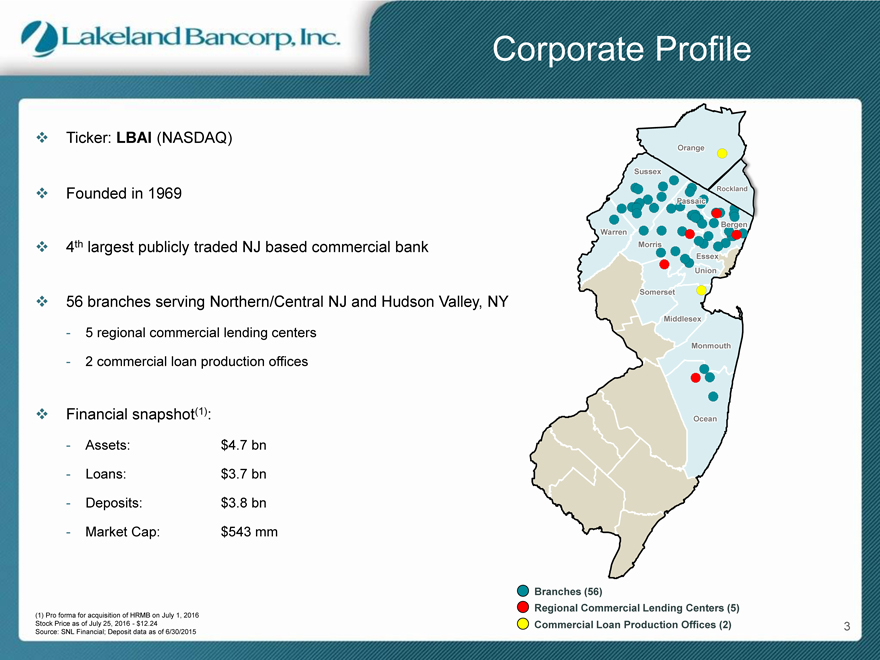
Corporate Profile
v Ticker: LBAI (NASDAQ)
v Founded in 1969
v 4th largest publicly traded NJ based commercial bank
v 56 branches serving Northern/Central NJ and Hudson Valley, NY
- 5 regional commercial lending centers
- 2 commercial loan production offices
v Financial snapshot(1):
- Assets: $4.7 bn
- Loans: $3.7 bn
- Deposits: $3.8 bn
- Market Cap: $543 mm
Orange
Sussex
Rockland
Passaic
Warren
Morris
Essex Union
Somersett
Middlesex
Monmouth
Ocean
(1) Pro forma for acquisition of HRMB on July 1, 2016 Stock Price as of July 25, 2016—$12.24 Source: SNL Financial; Deposit data as of 6/30/2015
Branches (56)
Regional Commercial Lending Centers (5)
Commercial Loan Production Offices (2) 3
|
|
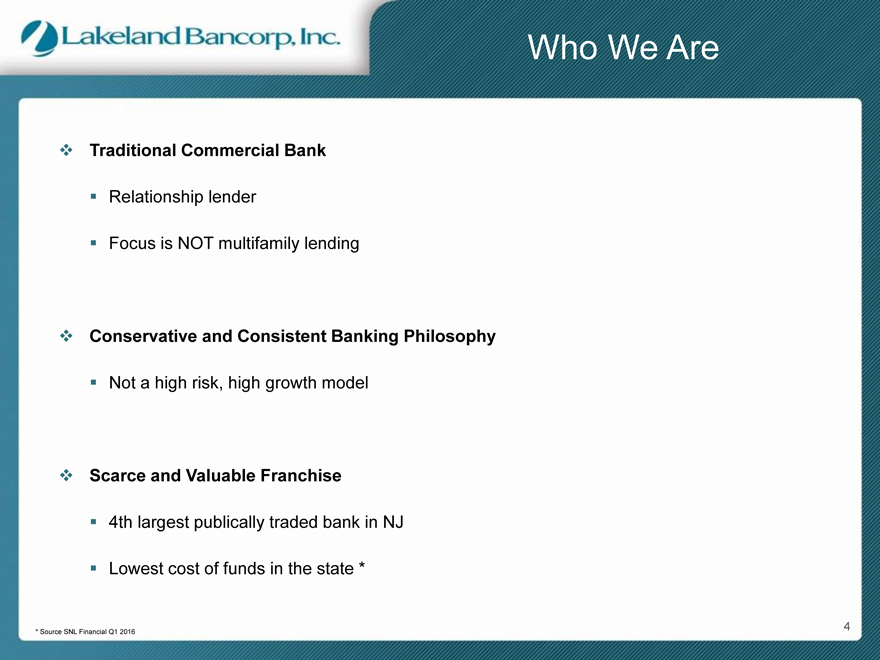
Who We Are
v Traditional Commercial Bank
n Relationship lender
n Focus is NOT multifamily lending
v Conservative and Consistent Banking Philosophy
n Not a high risk, high growth model
v Scarce and Valuable Franchise
n 4th largest publically traded bank in NJ
n Lowest cost of funds in the state *
4
* Source SNL Financial Q1 2016
|
|
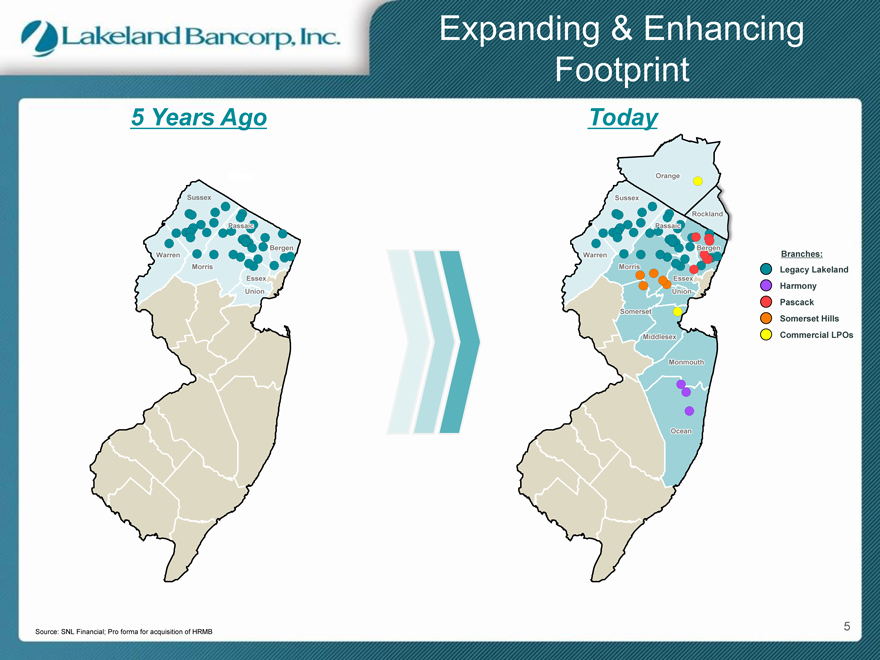
Expanding & Enhancing Footprint
5 Years Ago
Orange
Sussex
Passaic ii
Bergen Warren Morris Essex Union
Expanding & Enhancing Footprint
5 Years Ago
Orange
Sussex
Passaic ii
Bergen Warren Morris Essex Union
Today
Orange
Sussex
Rockland Passaic i
Bergen Warren Morris Essex Union
Somersett
Middlesex i
Monmouth
Ocean
Expanding & Enhancing Footprint
5 Years Ago
Orange
Sussex
Passaic ii
Bergen Warren Morris Essex Union
Today
Orange
Sussex
Rockland Passaic i
Bergen Warren Morris Essex Union
Somersett
Middlesex i
Monmouth
Ocean
Branches: Legacy Lakeland Harmony Pascack Somerset Hills Commercial LPOs
Expanding & Enhancing Footprint
5 Years Ago
Orange
Sussex
Passaic ii
Bergen Warren Morris Essex Union
Today
Orange
Sussex
Rockland Passaic i
Bergen Warren Morris Essex Union
Somersett
Middlesex i
Monmouth
Ocean
Branches: Legacy Lakeland Harmony Pascack Somerset Hills Commercial LPOs
5
Source: SNL Financial; Pro forma for acquisition of HRMB
|
|
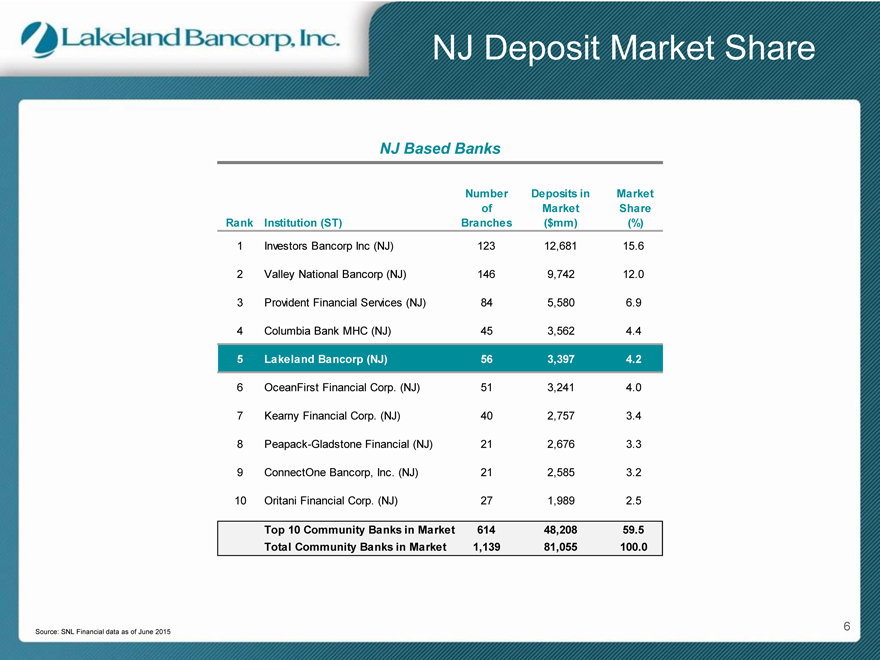
NJ Deposit Market Share
NJ Based Banks
Number Deposits in Market
of Market Share
Rank Institution (ST) Branches($mm)(%)
1 Investors Bancorp Inc (NJ) 123 12,681 15.6
2 Valley National Bancorp (NJ) 146 9,742 12.0
3 Provident Financial Services (NJ) 84 5,580 6.9
4 Columbia Bank MHC (NJ) 45 3,562 4.4
5 Lakeland Bancorp (NJ) 56 3,397 4.2
6 OceanFirst Financial Corp. (NJ) 51 3,241 4.0
7 Kearny Financial Corp. (NJ) 40 2,757 3.4
8 Peapack-Gladstone Financial (NJ) 21 2,676 3.3
9 ConnectOne Bancorp, Inc. (NJ) 21 2,585 3.2
10 Oritani Financial Corp. (NJ) 27 1,989 2.5
Top 10 Community Banks in Market 614 48,208 59.5
Total Community Banks in Market 1,139 81,055 100.0
6
Source: SNL Financial data as of June 2015
|
|
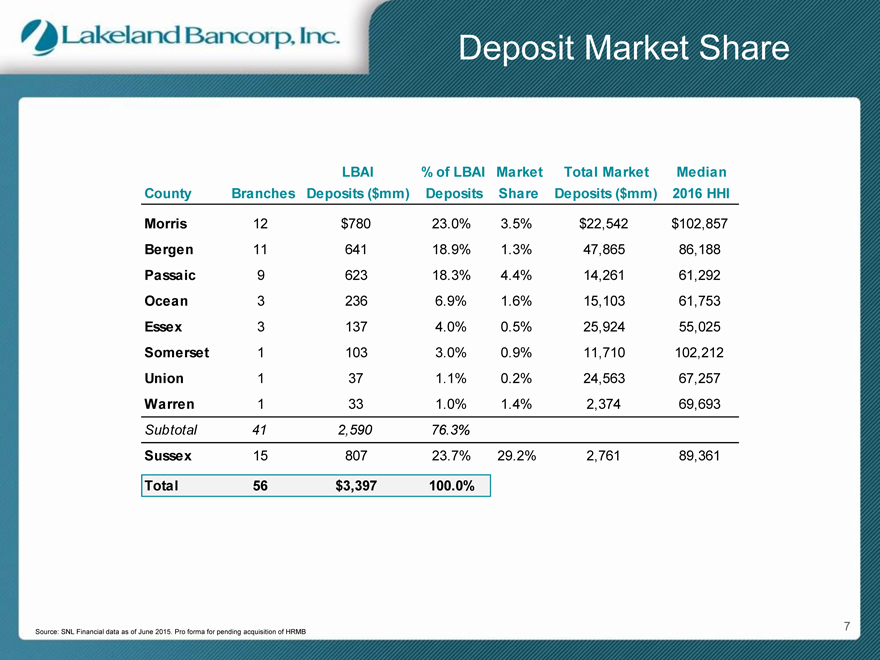
Deposit Market Share
LBAI% of LBAI Market Total Market Median
County Branches Deposits ($mm) Deposits Share Deposits ($mm) 2016 HHI
Morris 12 $780 23.0% 3.5% $22,542 $102,857
Bergen 11 641 18.9% 1.3% 47,865 86,188
Passaic 9 623 18.3% 4.4% 14,261 61,292
Ocean 3 236 6.9% 1.6% 15,103 61,753
Essex 3 137 4.0% 0.5% 25,924 55,025
Somerset 1 103 3.0% 0.9% 11,710 102,212
Union 1 37 1.1% 0.2% 24,563 67,257
Warren 1 33 1.0% 1.4% 2,374 69,693
Subtotal 41 2,590 76.3%
Sussex 15 807 23.7% 29.2% 2,761 89,361
Total 56 $3,397 100.0%
7
Source: SNL Financial data as of June 2015. Pro forma for pending acquisition of HRMB
|
|
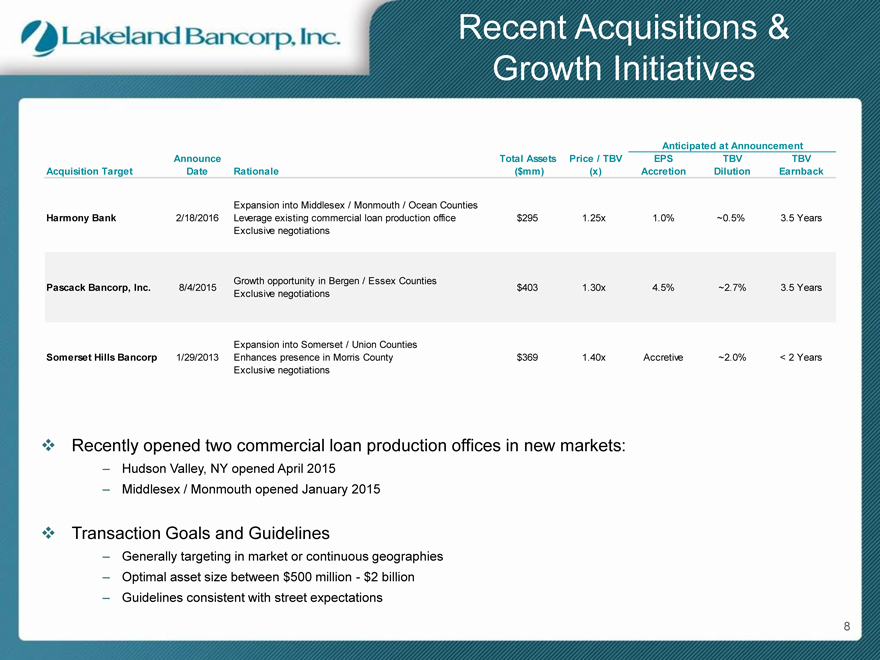
Recent Acquisitions & Growth Initiatives
Anticipated at Announcement
Announce Total Assets Price / TBV EPS TBV TBV
Acquisition Target Date Rationale($mm)(x) Accretion Dilution Earnback
Expansion into Middlesex / Monmouth / Ocean Counties
Harmony Bank 2/18/2016 Leverage existing commercial loan production office $295 1.25x 1.0% ~0.5% 3.5 Years
Exclusive negotiations
Growth opportunity in Bergen / Essex Counties
Pascack Bancorp, Inc. 8/4/2015 $403 1.30x 4.5% ~2.7% 3.5 Years
Exclusive negotiations
Expansion into Somerset / Union Counties
Somerset Hills Bancorp 1/29/2013 Enhances presence in Morris County $369 1.40x Accretive ~2.0% < 2 Years
Exclusive negotiations
v Recently opened two commercial loan production offices in new markets:
- Hudson Valley, NY opened April 2015
- Middlesex / Monmouth opened January 2015
v Transaction Goals and Guidelines
- Generally targeting in market or continuous geographies
- Optimal asset size between $500 million—$2 billion
- Guidelines consistent with street expectations
8
|
|
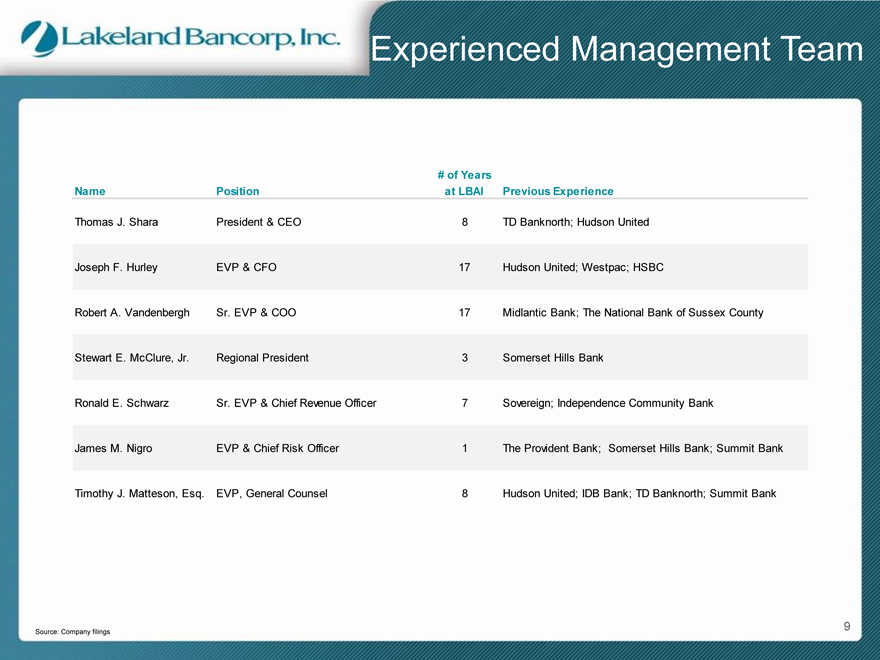
Experienced Management Team
# of Years
Name Position at LBAI Previous Experience
Thomas J. Shara President & CEO 8 TD Banknorth; Hudson United
Joseph F. Hurley EVP & CFO 17 Hudson United; Westpac; HSBC
Robert A. Vandenbergh Sr. EVP & COO 17 Midlantic Bank; The National Bank of Sussex County
Stewart E. McClure, Jr. Regional President 3 Somerset Hills Bank
Ronald E. Schwarz Sr. EVP & Chief Revenue Officer 7 Sovereign; Independence Community Bank
James M. Nigro EVP & Chief Risk Officer 1 The Provident Bank; Somerset Hills Bank; Summit Bank
Timothy J. Matteson, Esq. EVP, General Counsel 8 Hudson United; IDB Bank; TD Banknorth; Summit Bank
9
Source: Company filings
|
|
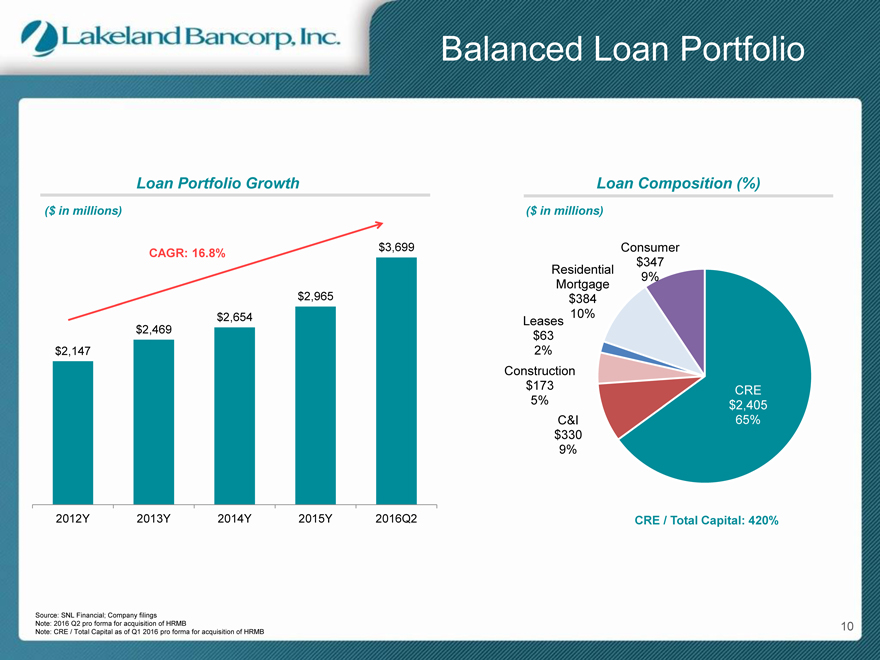
Balanced Loan Portfolio
Loan Portfolio Growth
($ in millions)
$3,699
CAGR: 16.8%
$2,965 $2,654 $2,469 $2,147
2012Y 2013Y 2014Y 2015Y 2016Q2
Loan Composition (%)
($ in millions)
Consumer $347 Residential 9% Mortgage $384
10%
Leases $63 2% Construction $173 CRE
5% $2,405 C&I 65% $330 9%
CRE / Total Capital: 420%
Source: SNL Financial; Company filings
Note: 2016 Q2 pro forma for acquisition of HRMB 10 Note: CRE / Total Capital as of Q1 2016 pro forma for acquisition of HRMB
|
|

Commercial Loan Growth
Commercial Portfolio Growth
($ in millions)
$2,909
CAGR: 23.6%
$2,187
$1,832 $1,657
$1,388
2012 2013 2014 2015 2016Q2 CRE C&I Construction
Commercial Loan Composition (%)
Owner Occupied 27% Retail 19% Multifamily 13% Industrial 12% Office 11% Mixed 6% Other 5% Commercial Constr. 4% Residential Constr. 3%
11
Source: SNL Financial and Company Documents; Commercial portfolio growth Q2 2016 data pro forma for acquisition of HRMB
|
|
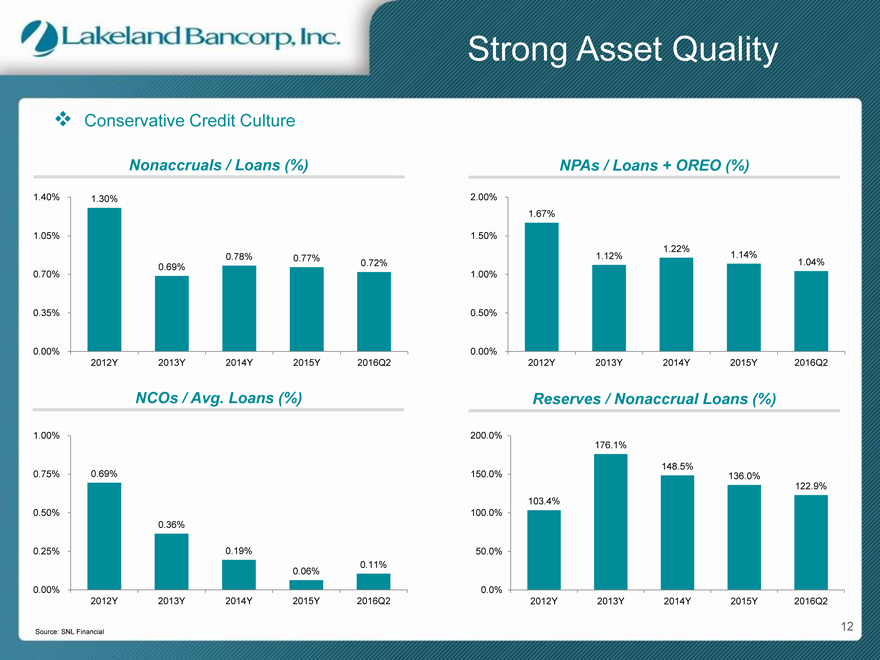
Strong Asset Quality
v Conservative Credit Culture
Nonaccruals / Loans (%)
1.40% 1.30%
1.05%
0.78% 0.77%
0.69% 0.72%
0.70%
0.35%
0.00%
2012Y 2013Y 2014Y 2015Y 2016Q2
NCOs / Avg. Loans (%)
NPAs / Loans + OREO (%)
2.00%
1.67%
1.50%
1.22%
1.12% 1.14%
1.04%
1.00%
0.50%
0.00%
2012Y 2013Y 2014Y 2015Y 2016Q2
Reserves / Nonaccrual Loans (%)
1.00%
0.75% 0.69%
0.50%
0.36%
0.25% 0.19%
0.11%
0.06%
0.00%
2012Y 2013Y 2014Y 2015Y 2016Q2
200.0%
176.1%
148.5%
150.0% 136.0%
122.9% 103.4% 100.0%
50.0%
0.0%
2012Y 2013Y 2014Y 2015Y 2016Q2
12
Source: SNL Financial
|
|
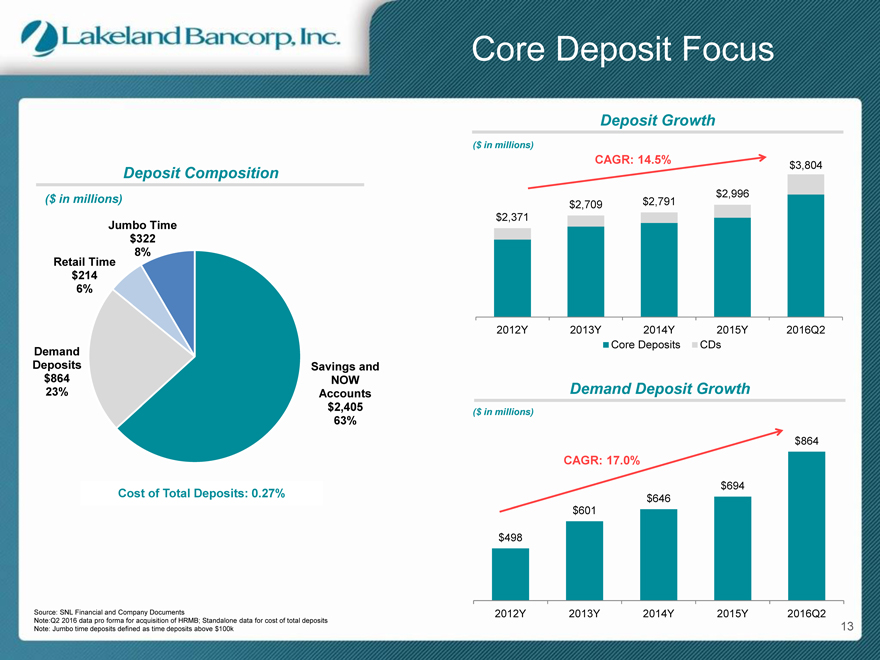
Core Deposit Focus
Deposit Composition
($ in millions)
Jumbo Time $322 Retail Time 8% $214
6%
Demand
Deposits Savings and $864 NOW
23% Accounts $2,405 63%
Cost of Total Deposits: 0.27%
($ in millions)
CAGR: 14.5% $3,804
$2,996 $2,709 $2,791 $2,371
2012Y 2013Y 2014Y 2015Y 2016Q2 Core Deposits CDs
Demand Deposit Growth
($ in millions)
$864
CAGR: 17.0%
$694 $646 $601
$498
2012Y 2013Y 2014Y 2015Y 2016Q2
Source: SNL Financial and Company Documents
Note:Q2 2016 data pro forma for acquisition of HRMB; Standalone data for cost of total deposits Note: Jumbo time deposits defined as time deposits above $100k
13
|
|
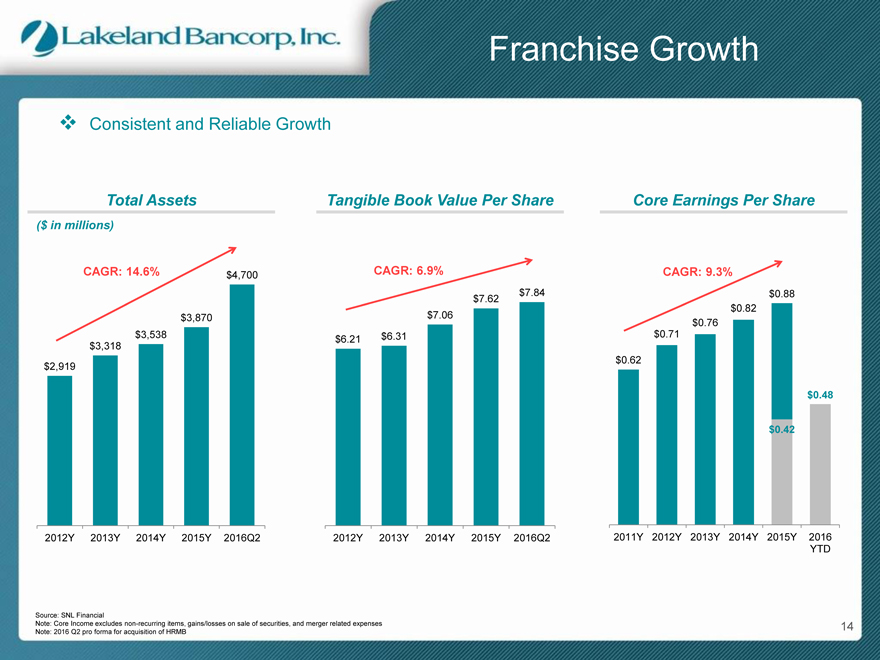
Franchise Growth
v Consistent and Reliable Growth
Total Assets
($ in millions)
CAGR: 14.6% $4,700
$3,870 $3,538 $3,318
$2,919
2012Y 2013Y 2014Y 2015Y 2016Q2
Tangible Book Value Per Share
CAGR: 6.9%
$7.84
$7.62
$7.06
$6.21 $6.31
2012Y 2013Y 2014Y 2015Y 2016Q2
Core Earnings Per Share
CAGR: 9.3%
$0.88
$0.82
$0.76
$0.71
$0.62
$0.48
$0.42
2011Y 2012Y 2013Y 2014Y 2015Y 2016 YTD
Source: SNL Financial
Note: Core Income excludes non-recurring items, gains/losses on sale of securities, and merger related expenses 14 Note: 2016 Q2 pro forma for acquisition of HRMB
|
|
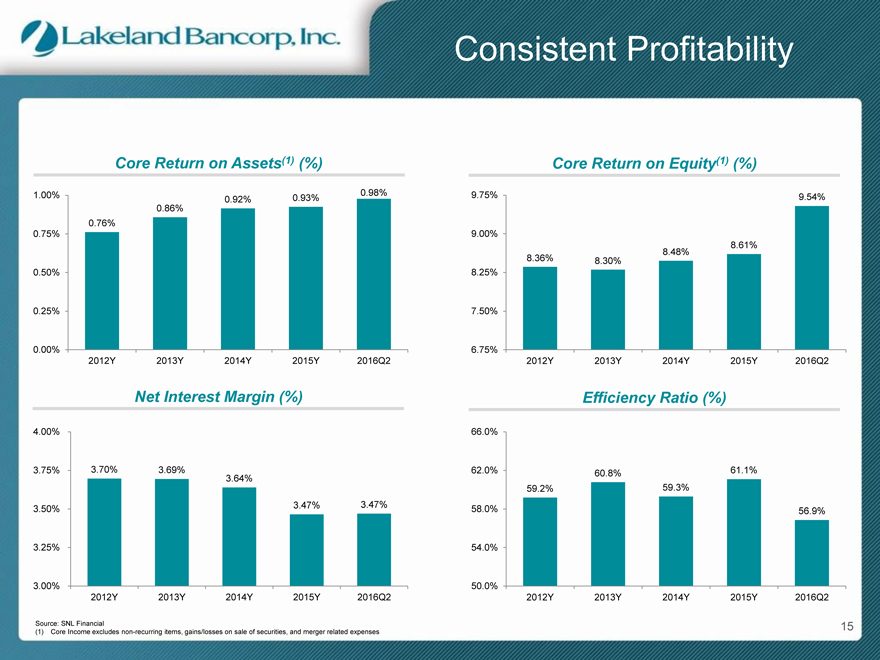
Consistent Profitability
Consistent Profitability
Core Return on Assets(1) (%)
1.00% 0.98%
0.92% 0.93%
0.86%
0.76%
0.75%
0.50%
0.25%
0.00%
2012Y 2013Y 2014Y 2015Y 2016Q2
Core Return on Equity(1) (%)
9.75% 9.54%
9.00%
8.61%
8.48%
8.36% 8.30%
8.25%
7.50%
6.75%
2012Y 2013Y 2014Y 2015Y 2016Q2
Net Interest Margin (%)
4.00%
3.75% 3.70% 3.69%
3.64%
3.47% 3.47%
3.50%
3.25%
3.00%
2012Y 2013Y 2014Y 2015Y 2016Q2
Efficiency Ratio (%)
66.0%
62.0% 60.8% 61.1% 59.2% 59.3%
58.0% 56.9%
54.0%
50.0%
2012Y 2013Y 2014Y 2015Y 2016Q2
Source: SNL Financial 15 (1) Core Income excludes non-recurring items, gains/losses on sale of securities, and merger related expenses
|
|
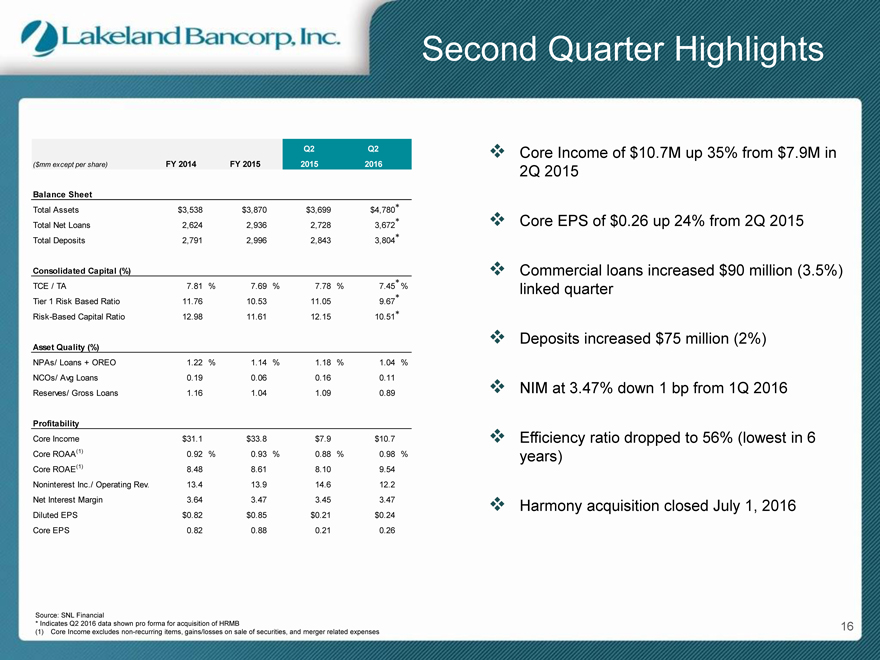
Second Quarter Highlights
Q2 Q2
($mm except per share) FY 2014 FY 2015 2015 2016
Balance Sheet
Total Assets $3,538 $3,870 $3,699 $4,780 *
Total Net Loans 2,624 2,936 2,728 3,672 *
Total Deposits 2,791 2,996 2,843 3,804 *
Consolidated Capital (%)
TCE / TA 7.81% 7.69% 7.78% 7.45 * %
Tier 1 Risk Based Ratio 11.76 10.53 11.05 9.67 *
Risk-Based Capital Ratio 12.98 11.61 12.15 10.51 *
Asset Quality (%)
NPAs/ Loans + OREO 1.22% 1.14% 1.18% 1.04%
NCOs/ Avg Loans 0.19 0.06 0.16 0.11
Reserves/ Gross Loans 1.16 1.04 1.09 0.89
Profitability
Core Income $31.1 $33.8 $7.9 $10.7
Core ROAA(1) 0.92% 0.93% 0.88% 0.98%
Core ROAE(1) 8.48 8.61 8.10 9.54
Noninterest Inc./ Operating Rev. 13.4 13.9 14.6 12.2
Net Interest Margin 3.64 3.47 3.45 3.47
Diluted EPS $0.82 $0.85 $0.21 $0.24
Core EPS 0.82 0.88 0.21 0.26
v Core Income of $10.7M up 35% from $7.9M in
2Q 2015
v Core EPS of $0.26 up 24% from 2Q 2015
v Commercial loans increased $90 million (3.5%) linked quarter
v Deposits increased $75 million (2%)
v NIM at 3.47% down 1 bp from 1Q 2016
v Efficiency ratio dropped to 56% (lowest in 6 years)
v Harmony acquisition closed July 1, 2016
Source: SNL Financial
* Indicates Q2 2016 data shown pro forma for acquisition of HRMB 16 (1) Core Income excludes non-recurring items, gains/losses on sale of securities, and merger related expenses
|
|
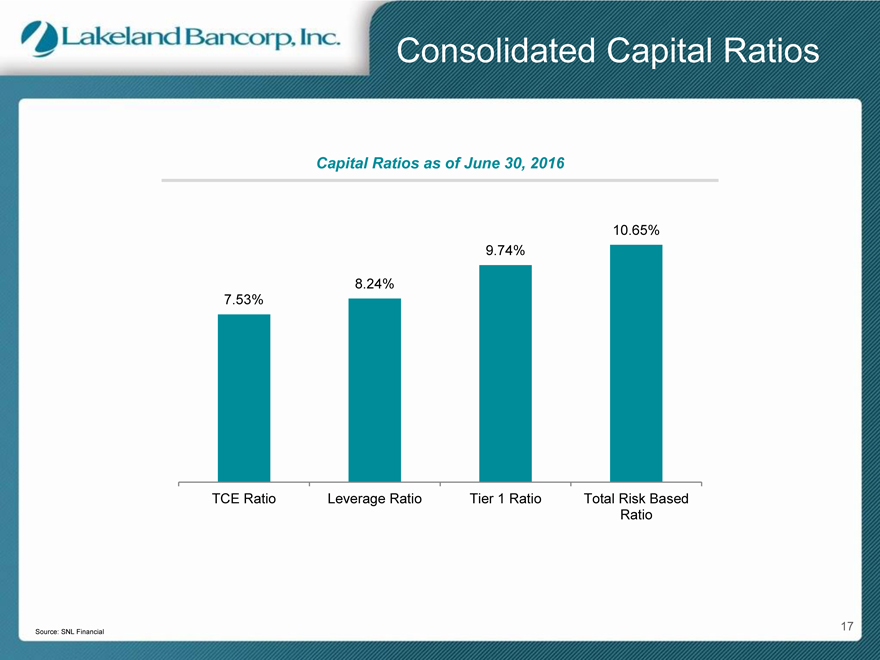
Consolidated Capital Ratios
Capital Ratios as of June 30, 2016
10.65%
9.74%
8.24%
7.53%
TCE Ratio Leverage Ratio Tier 1 Ratio Total Risk Based Ratio
17
Source: SNL Financial
|
|
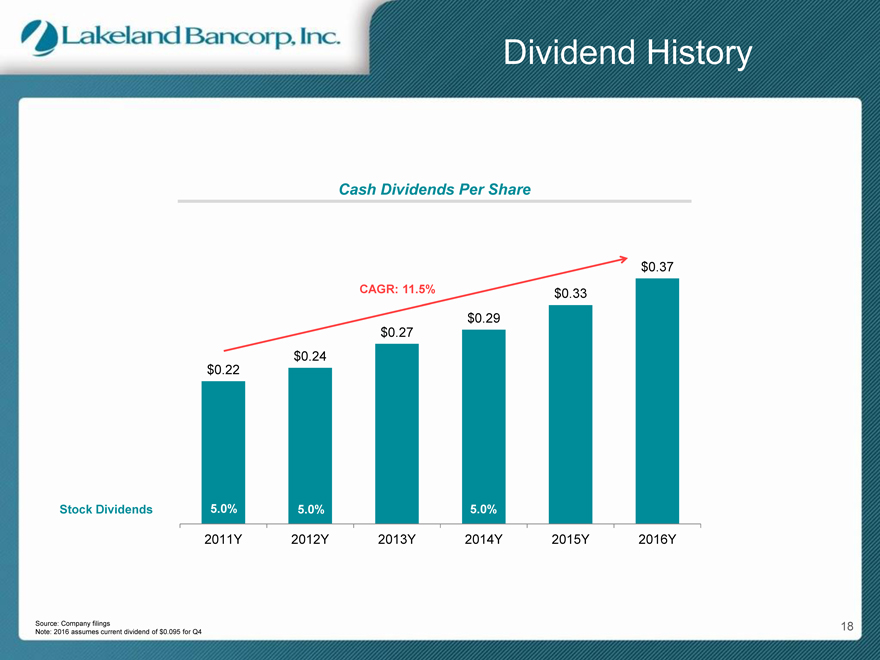
Dividend History
Cash Dividends Per Share
$0.37
CAGR: 11.5% $0.33
$0.29
$0.27
$0.24
$0.22
Stock Dividends 5.0% 5.0% 5.0%
2011Y 2012Y 2013Y 2014Y 2015Y 2016Y
Source: Company filings 18 Note: 2016 assumes current dividend of $0.095 for Q4
|
|
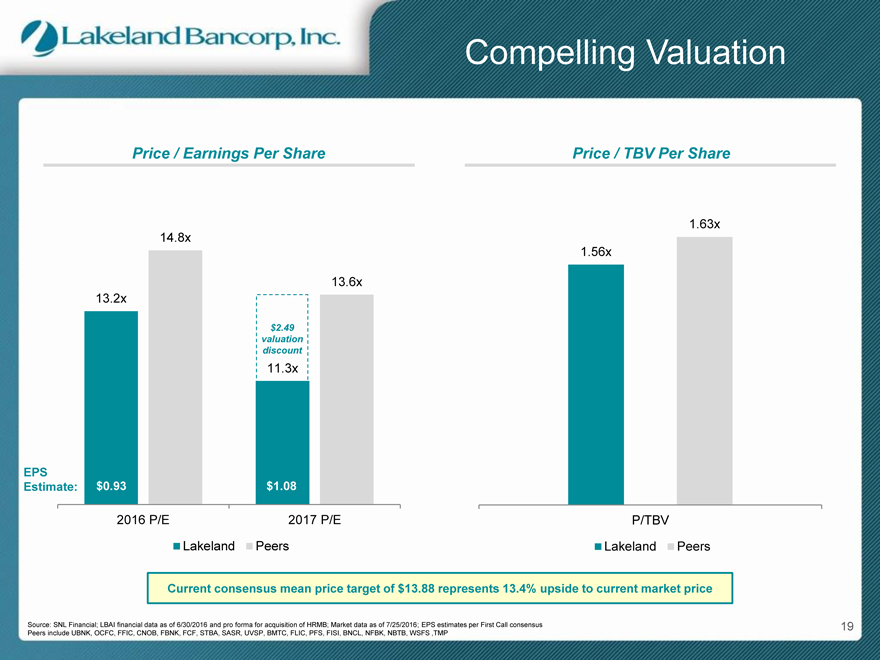
Compelling Valuation
Price / Earnings Per Share
14.8x
13.6x 13.2x
$2.49 valuation discount
11.3x
EPS
Estimate: $0.93 $1.08
2016 P/E 2017 P/E
Lakeland Peers
Price / TBV Per Share
1.63x
1.56x
P/TBV
Lakeland Peers
Current consensus mean price target of $13.88 represents 13.4% upside to current market price
Source: SNL Financial; LBAI financial data as of 6/30/2016 and pro forma for acquisition of HRMB; Market data as of 7/25/2016; EPS estimates per First Call consensus 19 Peers include UBNK, OCFC, FFIC, CNOB, FBNK, FCF, STBA, SASR, UVSP, BMTC, FLIC, PFS, FISI, BNCL, NFBK, NBTB, WSFS ,TMP
|
|
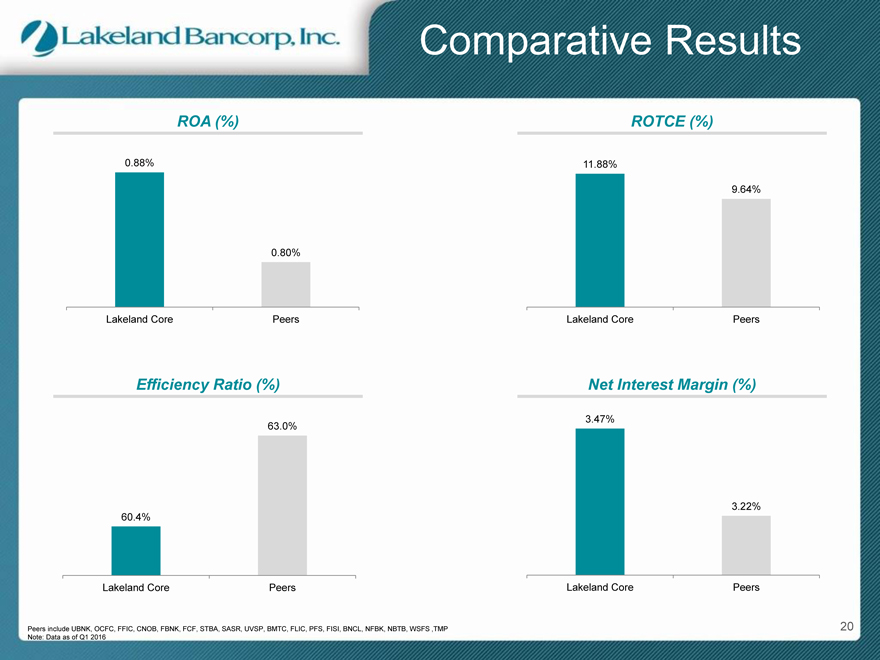
Comparative Results
ROA (%)
0.88%
0.80%
Lakeland Core Peers
ROTCE (%)
11.88%
9.64%
Lakeland Core Peers
Efficiency Ratio (%)
63.0%
60.4%
Lakeland Core Peers
Net Interest Margin (%)
3.47%
3.22%
Lakeland Core Peers
Peers include UBNK, OCFC, FFIC, CNOB, FBNK, FCF, STBA, SASR, UVSP, BMTC, FLIC, PFS, FISI, BNCL, NFBK, NBTB, WSFS ,TMP 20 Note: Data as of Q1 2016
|
|
Investment Considerations
v EXPANDING FOOTPRINT IN ATTRACTIVE MARKETS
v WELL POSITIONED FOR GROWTH
v STRATEGICALLY FOCUSED
- Middle market commercial lending
- Strong asset quality
- Low cost, core deposit funded
v STRONG FINANCIAL PERFORMANCE
v COMPELLING VALUATION
21