Attached files
| file | filename |
|---|---|
| EX-99.1 - EX-99.1 - Arlington Asset Investment Corp. | d200348dex991.htm |
| 8-K - FORM 8-K - Arlington Asset Investment Corp. | d200348d8k.htm |
Exhibit 99.2
|
|

Investor Presentation
Second Quarter 2016
|
|
Information Related to Forward-Looking Statements
This presentation contains “forward-looking statements” within the meaning of the Private Securities Litigation Reform Act of 1995. These include statements regarding future results or expectations about our investments, interest rates, portfolio allocation, dividends, financing agreements, returns on invested capital, investment strategy, taxes, portfolio, earnings, book value, housing market, compensation, growth in capital, agency MBS spreads, prepayments, hedging instruments, duration, credit performance of private-label MBS, cash flow and benefit of deferred tax asset value. Forward-looking statements can be identified by forward-looking language, including words such as “believes,” “anticipates,” “views,” “expects,” “estimates,” “intends,” “may,” “plans,” “projects,” “potential,” “prospective,” “will” and similar expressions, or the negative of these words. Such forward-looking statements are based on facts and conditions as they exist at the time such statements are made. Forward-looking statements are also based on predictions as to future facts and conditions, the accurate prediction of which may be difficult and involve the assessment of events beyond our control. Forward-looking statements are further based on various operating and return assumptions. Caution must be exercised in relying on forward-looking statements. Due to known and unknown risks, actual results may differ materially from expectations or projections.
You should carefully consider these risks when you make a decision concerning an investment in our common stock or senior notes, along with the following factors, among others, that may cause our actual results to differ materially from those described in any forward-looking statements: availability of, and our ability to deploy, capital; growing our business primarily through a strategy focused on acquiring primarily private-label mortgage-backed securities (“MBS”) and agency MBS; yields on MBS; our ability to successfully implement our hedging strategy; our ability to realize reflation on our private-label MBS; the credit performance of our private-label MBS; current conditions and adverse developments in the residential mortgage market and the overall economy; potential risk attributable to our mortgage-related portfolios; impacts of regulatory changes, including actions taken by the SEC, the U.S. Federal Reserve, the Federal Housing Finance Agency and the U.S. Treasury and changes affecting Fannie Mae and Freddie Mac; overall interest rate environment and changes in interest rates, interest rate spreads, the yield curve and prepayment rates; changes in anticipated earnings and returns; the amount and growth in our cash earnings and distributable income; growth in our book value per share; our ability to maintain adequate liquidity; our use of leverage and dependence on repurchase agreements and other short-term borrowings to finance our mortgage-related holdings; the loss of our exclusion from the definition of an “investment company” under the Investment Company Act of 1940; our ability to forecast our tax attributes and protect and use our net operating loss carry-forwards and net capital loss carry-forwards to offset future taxable income and gains; changes in our business, acquisition, leverage, asset allocation, operational, hedging and financing strategies and policies; our ability and willingness to make future dividends; changes in, and our ability to remain in compliance with, law, regulations or governmental policies affecting our business; and the factors described in the sections entitled “Risk Factors” in our Annual Report on Form 10-K for the year ended December 31, 2015, subsequent Quarterly Reports on Form 10-Q and other documents filed by the Company with the SEC from time to time. You should not place undue reliance on these forward-looking statements, which apply only as of
the date of this presentation. We undertake no obligation to update or revise any forward-looking statement, whether written or oral, relating to matters discussed in this presentation, except as may be required by applicable securities laws.
| 1 |
|
|
|
Company Overview
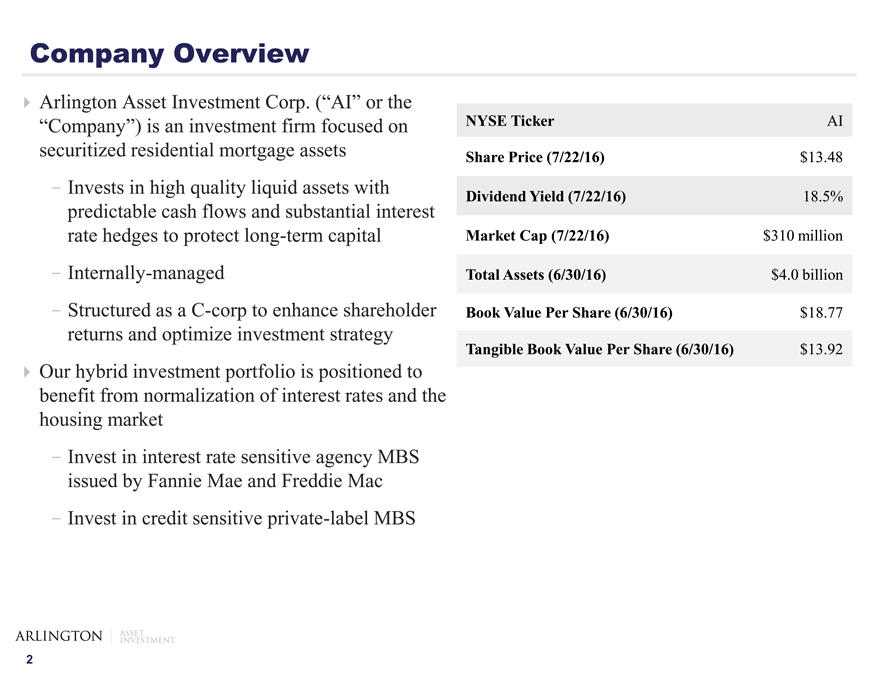
Arlington Asset Investment Corp. (“AI” or the “Company”) is an investment firm focused on securitized residential mortgage assets
Invests in high quality liquid assets with predictable cash flows and substantial interest rate hedges to protect long-term capital
Internally-managed
Structured as a C-corp to enhance shareholder returns and optimize investment strategy
Our hybrid investment portfolio is positioned to benefit from normalization of interest rates and the housing market
Invest in interest rate sensitive agency MBS issued by Fannie Mae and Freddie Mac
Invest in credit sensitive private-label MBS
NYSE Ticker AI
Share Price (7/22/16) $13.48
Dividend Yield (7/22/16) 18.5%
Market Cap (7/22/16) $310 million
Total Assets (6/30/16) $4.0 billion
Book Value Per Share (6/30/16) $18.77
Tangible Book Value Per Share (6/30/16) $13.92
| 2 |
|
|
|
MBS Investment Portfolio Overview
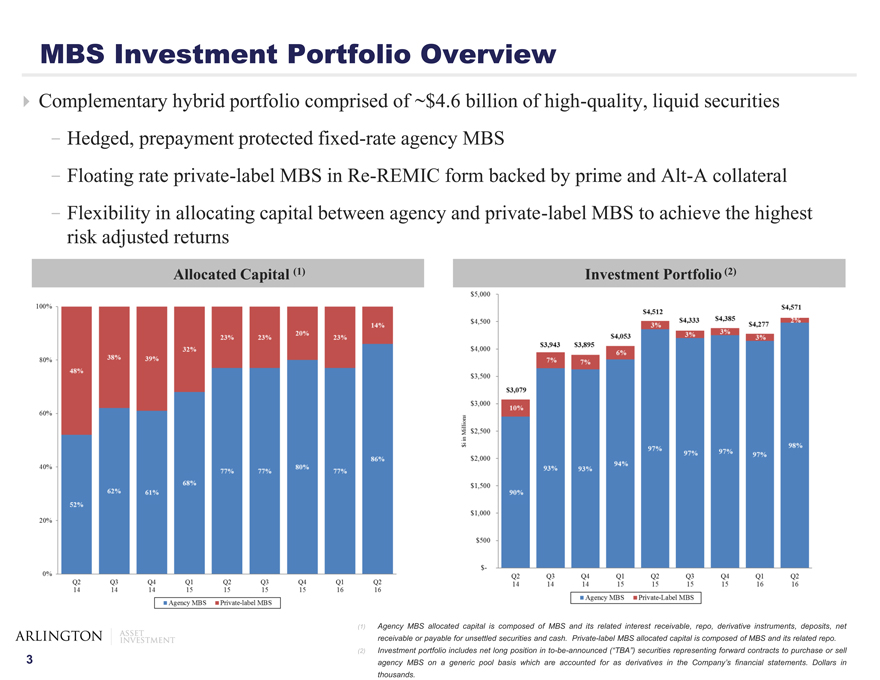
Complementary hybrid portfolio comprised of ~$4.6 billion of high-quality, liquid securities
Hedged, prepayment protected fixed-rate agency MBS
Floating rate private-label MBS in Re-REMIC form backed by prime and Alt-A collateral
Flexibility in allocating capital between agency and private-label MBS to achieve the highest risk adjusted returns
Allocated Capital (1) Investment Portfolio (2)
(1) Agency MBS allocated capital is composed of MBS and its related interest receivable, repo, derivative instruments, deposits, net receivable or payable for unsettled securities and cash. Private-label MBS allocated capital is composed of MBS and its related repo. (2) Investment portfolio includes net long position in to-be-announced (“TBA”) securities representing forward contracts to purchase or sell agency MBS on a generic pool basis which are accounted for as derivatives in the Company’s financial statements. Dollars in thousands.
| 3 |
|
|
|
Agency MBS Investment Portfolio Overview
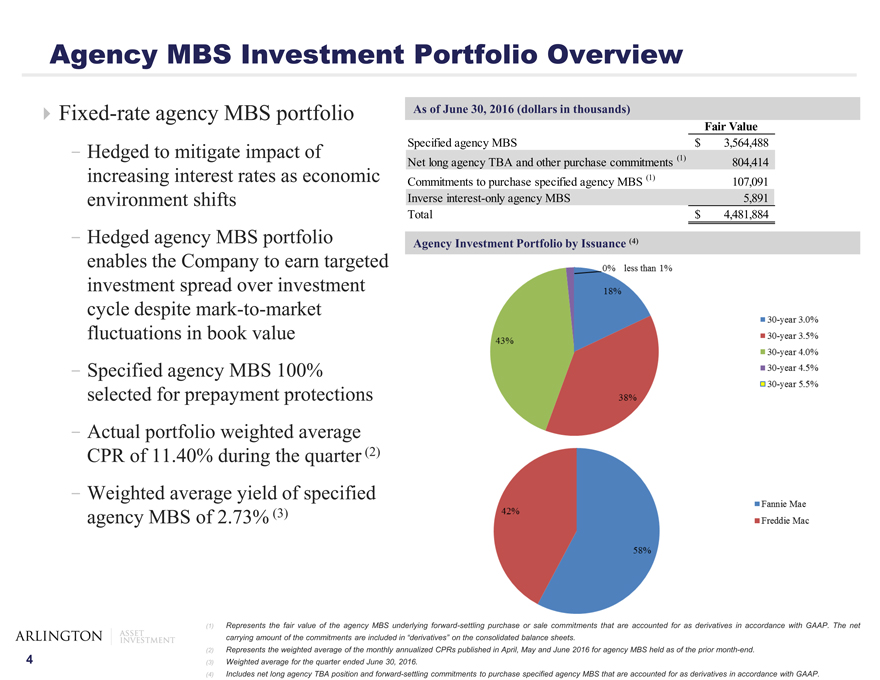
Fixed-rate agency MBS portfolio
Hedged to mitigate impact of increasing interest rates as economic environment shifts
Hedged agency MBS portfolio enables the Company to earn targeted investment spread over investment cycle despite mark-to-market fluctuations in book value
Specified agency MBS 100% selected for prepayment protections
Actual portfolio weighted average CPR of 11.40% during the quarter (2)
Weighted average yield of specified agency MBS of 2.73% (3)
As of June 30, 2016 (dollars in thousands)
Fair Value
Specified agency MBS $ 3,564,488
Net long agency TBA and other purchase commitments (1) 804,414
Commitments to purchase specified agency MBS (1) 107,091
Inverse interest-only agency MBS 5,891
Total $ 4,481,884
Agency Investment Portfolio by Issuance (4)
(1) Represents the fair value of the agency MBS underlying forward-settling purchase or sale commitments that are accounted for as derivatives in accordance with GAAP. The net carrying amount of the commitments are included in “derivatives” on the consolidated balance sheets.
(2) Represents the weighted average of the monthly annualized CPRs published in April, May and June 2016 for agency MBS held as of the prior month-end. (3) Weighted average for the quarter ended June 30, 2016.
(4) Includes net long agency TBA position and forward-settling commitments to purchase specified agency MBS that are accounted for as derivatives in accordance with GAAP.
| 4 |
|
|
|
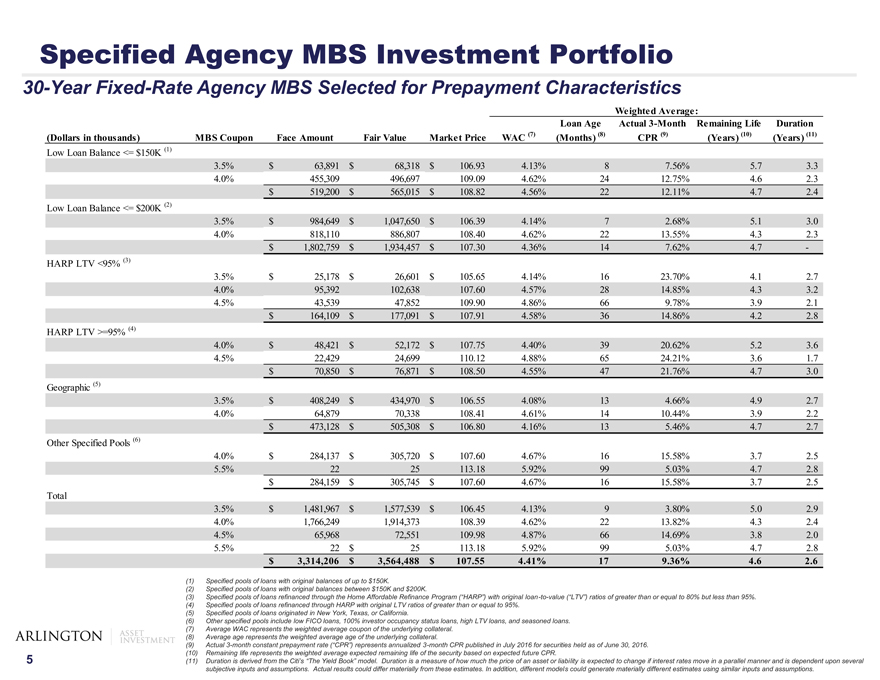
Specified Agency MBS Investment Portfolio
30-Year Fixed-Rate Agency MBS Selected for Prepayment Characteristics
Weighted Average:
Loan Age Actual 3-Month Remaining Life Duration
(Dollars in thousands) MBS Coupon Face Amount Fair Value Market Price WAC (7)(Months) (8) CPR (9)(Years) (10)(Years) (11)
Low Loan Balance <= $150K (1)
| 3.5% |
|
$ 63,891 $ 68,318 $ 106.93 4.13% 8 7.56% 5.7 3.3 |
| 4.0% |
|
455,309 496,697 109.09 4.62% 24 12.75% 4.6 2.3 |
$ 519,200 $ 565,015 $ 108.82 4.56% 22 12.11% 4.7 2.4
Low Loan Balance <= $200K (2)
| 3.5% |
|
$ 984,649 $ 1,047,650 $ 106.39 4.14% 7 2.68% 5.1 3.0 |
| 4.0% |
|
818,110 886,807 108.40 4.62% 22 13.55% 4.3 2.3 |
$ 1,802,759 $ 1,934,457 $ 107.30 4.36% 14 7.62% 4.7 -
HARP LTV <95% (3)
| 3.5% |
|
$ 25,178 $ 26,601 $ 105.65 4.14% 16 23.70% 4.1 2.7 |
| 4.0% |
|
95,392 102,638 107.60 4.57% 28 14.85% 4.3 3.2 |
| 4.5% |
|
43,539 47,852 109.90 4.86% 66 9.78% 3.9 2.1 |
HARP LTV >=95% (4)
| 4.0% |
|
$ 48,421 $ 52,172 $ 107.75 4.40% 39 20.62% 5.2 3.6 |
| 4.5% |
|
22,429 24,699 110.12 4.88% 65 24.21% 3.6 1.7 |
$ 70,850 $ 76,871 $ 108.50 4.55% 47 21.76% 4.7 3.0
Geographic (5)
| 3.5% |
|
$ 408,249 $ 434,970 $ 106.55 4.08% 13 4.66% 4.9 2.7 |
| 4.0% |
|
64,879 70,338 108.41 4.61% 14 10.44% 3.9 2.2 |
$ 473,128 $ 505,308 $ 106.80 4.16% 13 5.46% 4.7 2.7
Other Specified Pools (6)
| 4.0% |
|
$ 284,137 $ 305,720 $ 107.60 4.67% 16 15.58% 3.7 2.5 |
| 5.5% |
|
22 25 113.18 5.92% 99 5.03% 4.7 2.8 |
$ 284,159 $ 305,745 $ 107.60 4.67% 16 15.58% 3.7 2.5
Total
| 3.5% |
|
$ 1,481,967 $ 1,577,539 $ 106.45 4.13% 9 3.80% 5.0 2.9 |
| 4.0% |
|
1,766,249 1,914,373 108.39 4.62% 22 13.82% 4.3 2.4 |
| 4.5% |
|
65,968 72,551 109.98 4.87% 66 14.69% 3.8 2.0 |
| 5.5% |
|
22 $ 25 113.18 5.92% 99 5.03% 4.7 2.8 |
$ 3,314,206 $ 3,564,488 $ 107.55 4.41% 17 9.36% 4.6 2.6
| (1) |
|
Specified pools of loans with original balances of up to $150K. |
| (2) |
|
Specified pools of loans with original balances between $150K and $200K. |
(3) Specified pools of loans refinanced through the Home Affordable Refinance Program (“HARP”) with original loan-to-value (“LTV”) ratios of greater than or equal to 80% but less than 95%.
(4) Specified pools of loans refinanced through HARP with original LTV ratios of greater than or equal to 95%. (5) Specified pools of loans originated in New York, Texas, or California.
(6) Other specified pools include low FICO loans, 100% investor occupancy status loans, high LTV loans, and seasoned loans. (7) Average WAC represents the weighted average coupon of the underlying collateral.
(8) Average age represents the weighted average age of the underlying collateral.
(9) Actual 3-month constant prepayment rate (“CPR”) represents annualized 3-month CPR published in July 2016 for securities held as of June 30, 2016. (10) Remaining life represents the weighted average expected remaining life of the security based on expected future CPR.
(11) Duration is derived from the Citi’s “The Yield Book” model. Duration is a measure of how much the price of an asset or liability is expected to change if interest rates move in a parallel manner and is dependent upon several subjective inputs and assumptions. Actual results could differ materially from these estimates. In addition, different models could generate materially different estimates using similar inputs and assumptions.
| 5 |
|
|
|
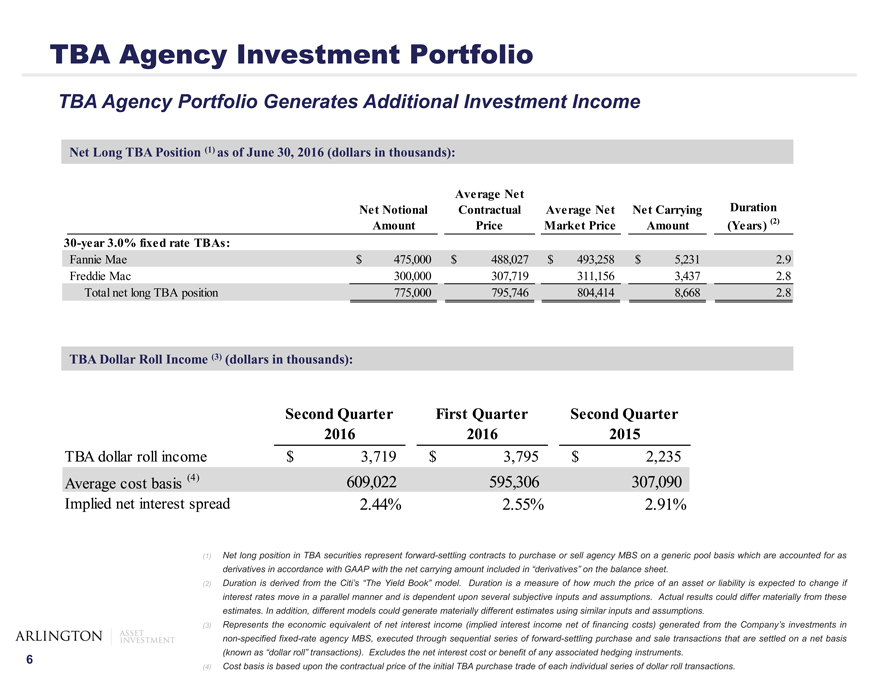
TBA Agency Investment Portfolio
TBA Agency Portfolio Generates Additional Investment Income
Net Long TBA Position (1) as of June 30, 2016 (dollars in thousands):
Average Net
Net Notional Contractual Average Net Net Carrying Duration
Amount Price Market Price Amount(Years) (2)
30-year 3.0% fixed rate TBAs:
Fannie Mae $ 475,000 $ 488,027 $ 493,258 $ 5,231 2.9
Freddie Mac 300,000 307,719 311,156 3,437 2.8
Total net long TBA position 775,000 795,746 804,414 8,668 2.8
TBA Dollar Roll Income (3) (dollars in thousands):
Second Quarter First Quarter Second Quarter
2016 2016 2015
TBA dollar roll income $ 3,719 $ 3,795 $ 2,235
Average cost basis (4) 609,022 595,306 307,090
Implied net interest spread 2.44% 2.55% 2.91%
(1) Net long position in TBA securities represent forward-settling contracts to purchase or sell agency MBS on a generic pool basis which are accounted for as derivatives in accordance with GAAP with the net carrying amount included in “derivatives” on the balance sheet.
(2) Duration is derived from the Citi’s “The Yield Book” model. Duration is a measure of how much the price of an asset or liability is expected to change if interest rates move in a parallel manner and is dependent upon several subjective inputs and assumptions. Actual results could differ materially from these estimates. In addition, different models could generate materially different estimates using similar inputs and assumptions.
(3) Represents the economic equivalent of net interest income (implied interest income net of financing costs) generated from the Company’s investments in non-specified fixed-rate agency MBS, executed through sequential series of forward-settling purchase and sale transactions that are settled on a net basis (known as “dollar roll” transactions). Excludes the net interest cost or benefit of any associated hedging instruments.
(4) Cost basis is based upon the contractual price of the initial TBA purchase trade of each individual series of dollar roll transactions.
| 6 |
|
|
|
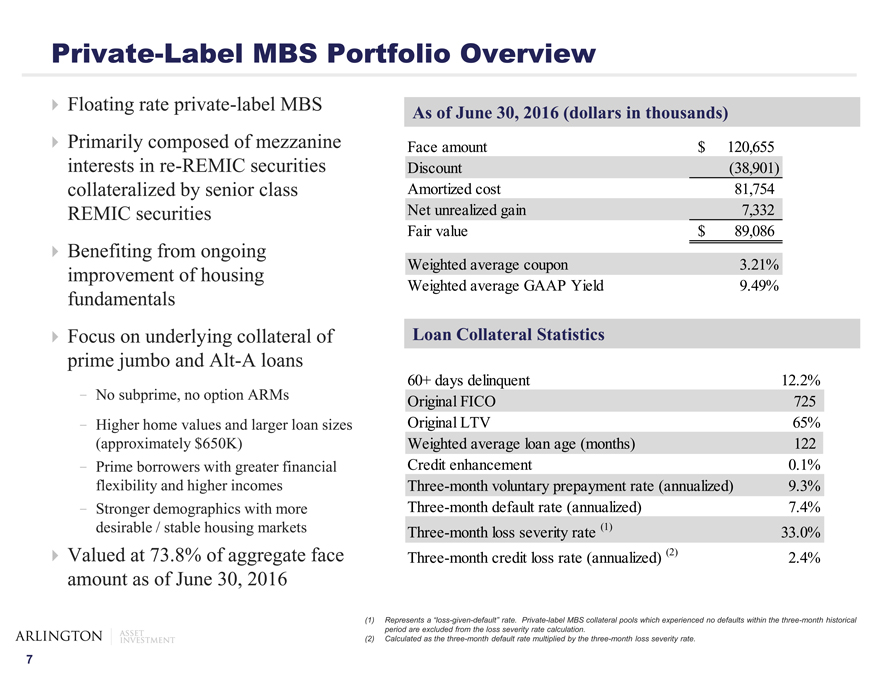
Private-Label MBS Portfolio Overview
Floating rate private-label MBS Primarily composed of mezzanine interests in re-REMIC securities collateralized by senior class REMIC securities Benefiting from ongoing improvement of housing fundamentals Focus on underlying collateral of prime jumbo and Alt-A loans
No subprime, no option ARMs
Higher home values and larger loan sizes (approximately $650K)
Prime borrowers with greater financial flexibility and higher incomes
Stronger demographics with more desirable / stable housing markets
Valued at 73.8% of aggregate face amount as of June 30, 2016
As of June 30, 2016 (dollars in thousands)
Face amount $ 120,655
Discount(38,901)
Amortized cost 81,754
Net unrealized gain 7,332
Fair value $ 89,086
Weighted average coupon 3.21%
Weighted average GAAP Yield 9.49%
Loan Collateral Statistics
60+ days delinquent 12.2%
Original FICO 725
Original LTV 65%
Weighted average loan age (months) 122
Credit enhancement 0.1%
Three-month voluntary prepayment rate (annualized) 9.3%
Three-month default rate (annualized) 7.4%
Three-month loss severity rate (1) 33.0%
Three-month credit loss rate (annualized) (2) 2.4%
(1) Represents a “loss-given-default” rate. Private-label MBS collateral pools which experienced no defaults within the three-month historical period are excluded from the loss severity rate calculation.
(2) Calculated as the three-month default rate multiplied by the three-month loss severity rate.
| 7 |
|
|
|
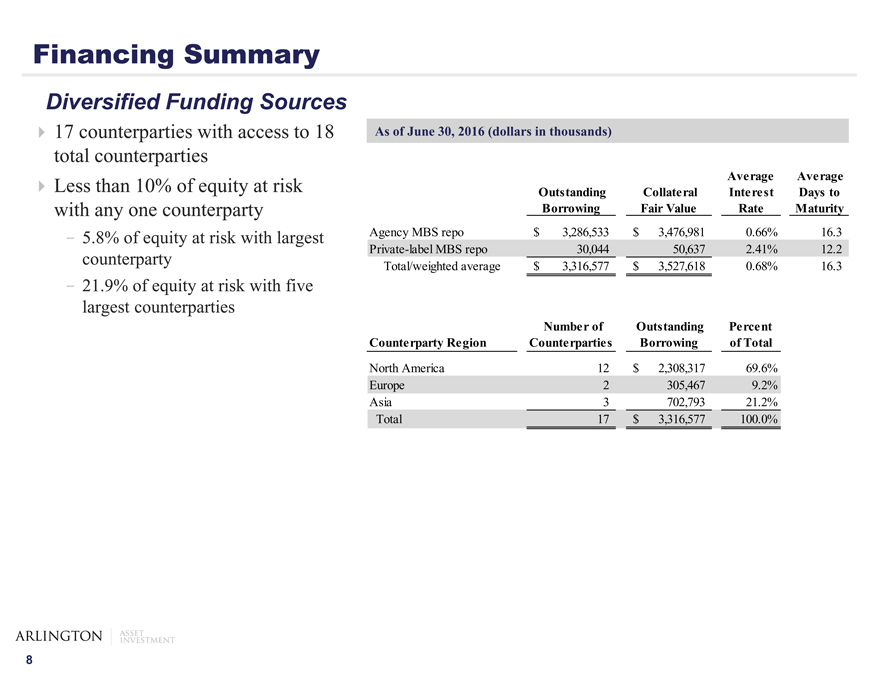
Financing Summary
Diversified Funding Sources
?17 counterparties with access to 18 total counterparties ?Less than 10% of equity at risk with any one counterparty
5.8% of equity at risk with largest counterparty
21.9% of equity at risk with five largest counterparties
As of June 30, 2016 (dollars in thousands)
Average Average
Outstanding Collateral Interest Days to
Borrowing Fair Value Rate Maturity
Agency MBS repo $ 3,286,533 $ 3,476,981 0.66% 16.3
Private-label MBS repo 30,044 50,637 2.41% 12.2
Total/weighted average $ 3,316,577 $ 3,527,618 0.68% 16.3
Number of Outstanding Percent
Counterparty Region Counterparties Borrowing of Total
North America 12 $ 2,308,317 69.6%
Europe 2 305,467 9.2%
Asia 3 702,793 21.2%
Total 17 $ 3,316,577 100.0%
8
|
|
Hedging Summary
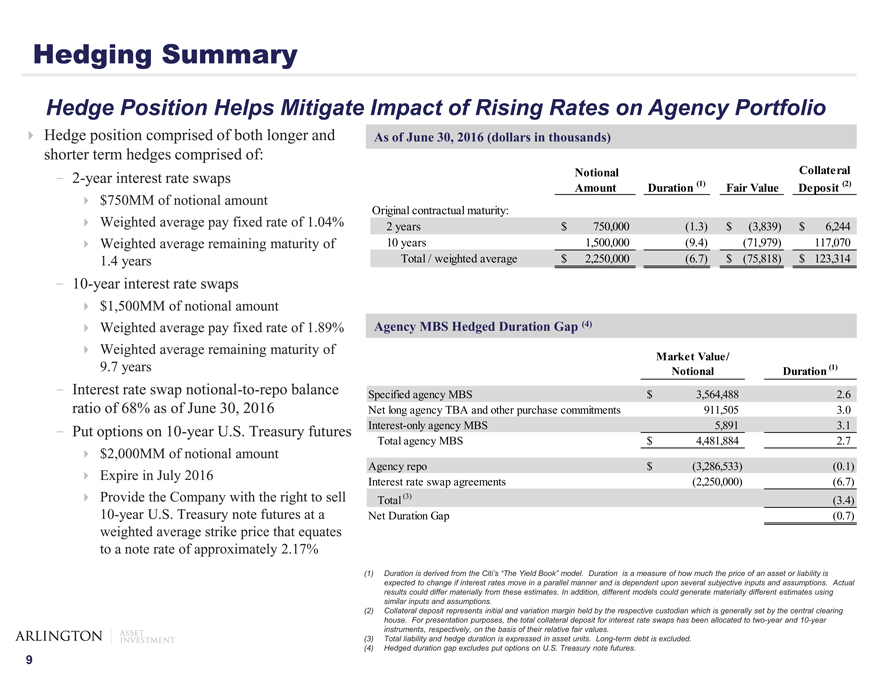
Hedge Position Helps Mitigate Impact of Rising Rates on Agency Portfolio
Hedge position comprised of both longer and
shorter term hedges comprised of:
2-year interest rate swaps
$750MM of notional amount
Weighted average pay fixed rate of 1.04%
Weighted average remaining maturity of
| 1.4 |
|
years |
10-year interest rate swaps
$1,500MM of notional amount
Weighted average pay fixed rate of 1.89%
Weighted average remaining maturity of
9.7 years
Interest rate swap notional-to-repo balance
ratio of 68% as of June 30, 2016
Put options on 10-year U.S. Treasury futures
$2,000MM of notional amount
Expire in July 2016
Provide the Company with the right to sell
10-year U.S. Treasury note futures at a
weighted average strike price that equates
to a note rate of approximately 2.17%
As of June 30, 2016 (dollars in thousands)
Notional Collateral
Amount Duration (1) Fair Value Deposit (2)
Original contractual maturity:
2 years $ 750,000(1.3) $(3,839) $ 6,244
10 years 1,500,000(9.4)(71,979) 117,070
Total / weighted average $ 2,250,000(6.7) $(75,818) $ 123,314
Agency MBS Hedged Duration Gap (4)
Market Value/
Notional Duration (1)
Specified agency MBS $ 3,564,488 2.6
Net long agency TBA and other purchase commitments 911,505 3.0
Interest-only agency MBS 5,891 3.1
Total agency MBS $ 4,481,884 2.7
Agency repo $(3,286,533)(0.1)
Interest rate swap agreements(2,250,000)(6.7)
Total (3)(3.4)
Net Duration Gap(0.7)
(1) Duration is derived from the Citi’s “The Yield Book” model. Duration is a measure of how much the price of an asset or liability is expected to change if interest rates move in a parallel manner and is dependent upon several subjective inputs and assumptions. Actual results could differ materially from these estimates. In addition, different models could generate materially different estimates using similar inputs and assumptions.
(2) Collateral deposit represents initial and variation margin held by the respective custodian which is generally set by the central clearing house. For presentation purposes, the total collateral deposit for interest rate swaps has been allocated to two-year and 10-year instruments, respectively, on the basis of their relative fair values.
(3) Total liability and hedge duration is expressed in asset units. Long-term debt is excluded. (4) Hedged duration gap excludes put options on U.S. Treasury note futures.
9
|
|
MBS Portfolio Economics
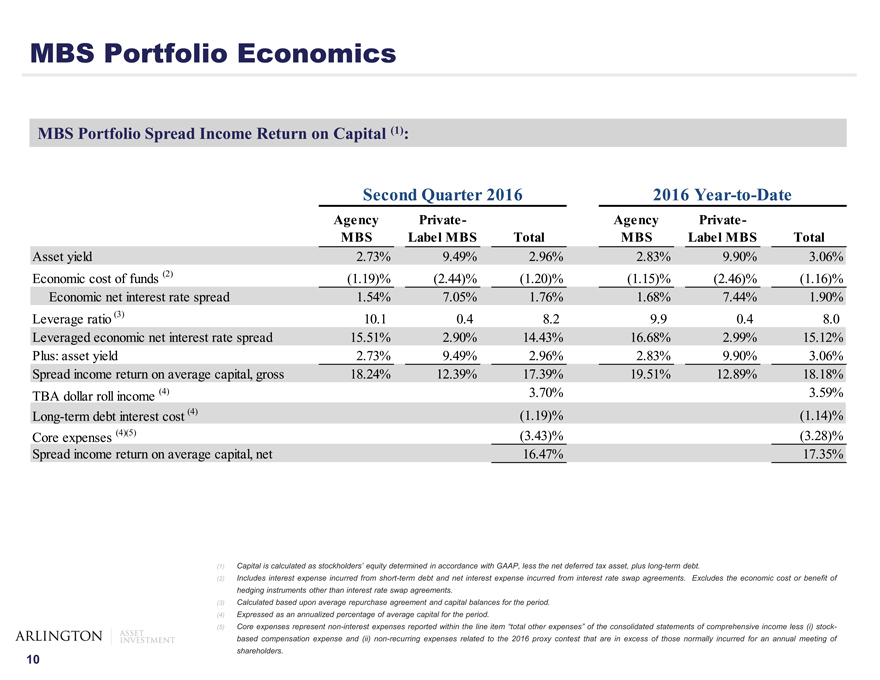
MBS Portfolio Spread Income Return on Capital (1):
Second Quarter 2016 2016 Year-to-Date
Agency Private—Agency Private -
MBS Label MBS Total MBS Label MBS Total
Asset yield 2.73% 9.49% 2.96% 2.83% 9.90% 3.06%
Economic cost of funds (2)(1.19)%(2.44)%(1.20)%(1.15)%(2.46)%(1.16)%
Economic net interest rate spread 1.54% 7.05% 1.76% 1.68% 7.44% 1.90%
Leverage ratio (3) 10.1 0.4 8.2 9.9 0.4 8.0
Leveraged economic net interest rate spread 15.51% 2.90% 14.43% 16.68% 2.99% 15.12%
Plus: asset yield 2.73% 9.49% 2.96% 2.83% 9.90% 3.06%
Spread income return on average capital, gross 18.24% 12.39% 17.39% 19.51% 12.89% 18.18%
TBA dollar roll income (4) 3.70% 3.59%
Long-term debt interest cost (4)(1.19)%(1.14)%
Core expenses (4)(5)(3.43)%(3.28)%
Spread income return on average capital, net 16.47% 17.35%
(1) Capital is calculated as stockholders’ equity determined in accordance with GAAP, less the net deferred tax asset, plus long-term debt.
(2) Includes interest expense incurred from short-term debt and net interest expense incurred from interest rate swap agreements. Excludes the economic cost or benefit of hedging instruments other than interest rate swap agreements.
(3) Calculated based upon average repurchase agreement and capital balances for the period. (4) Expressed as an annualized percentage of average capital for the period.
(5) Core expenses represent non-interest expenses reported within the line item “total other expenses” of the consolidated statements of comprehensive income less (i) stock-based compensation expense and (ii) non-recurring expenses related to the 2016 proxy contest that are in excess of those normally incurred for an annual meeting of shareholders.
10
|
|
Corporate Tax Structure Provides Enhanced Shareholder Returns and Flexibility
Our C-corp structure benefits stockholders by providing a tax-advantaged dividend as we continue to utilize our net operating loss and net capital loss carry-forwards
Net operating loss carry-forward of $98MM as of June 30, 2016
Net capital loss carry-forward of $291MM as of June 30, 2016
18.5% annualized dividend yield (1)
25.0% annualized dividend yield, on a tax adjusted basis (2)
Structure provides flexibility as we are not required to distribute taxable earnings to stockholders
Provides option to reinvest earnings and opportunistically benefit from market dislocation
Allows investment flexibility as we are not bound by any substantial restrictions
(1) Based on the Company’s Class A common stock closing price on the NYSE of $13.48 on 7/22/2016. The annual dividend rate presented is calculated by annualizing the second quarter of 2016 dividend payment of $0.625 per share of Class A common stock. The Company maintains a variable dividend policy and the Board of Directors, in its sole discretion, approves the payment of dividends. Actual dividends in the future may differ materially from historical practice and from the annualized dividend rate presented.
(2) The Company’s distributions to shareholders of current or accumulated earnings and profits (“E&P”) are qualified dividends eligible for the 23.8% federal income tax rate whereas similar distributions to shareholders by a REIT of current or accumulated E&P are nonqualified dividends subject to the higher 43.4% tax rate on ordinary income. Any distributions in excess of current or accumulated E&P would be reported as a return of capital instead of qualified dividends. Distributions that are classified as returns of capital are nontaxable to the extent they do not exceed a shareholder’s adjusted tax basis in the Company’s common stock, or as a capital gain to the extent that the amount of the distribution exceeds a shareholder’s adjusted tax basis in the Company’s common stock. To provide the same after-tax return to a shareholder of distributions of current or accumulated E&P eligible for the 23.8% rate on qualified dividend income and otherwise subject to the maximum marginal rate on ordinary income, a REIT would be required to pay dividends providing a 25.0% yield.
11
|
|
Efficient Internally Managed Structure
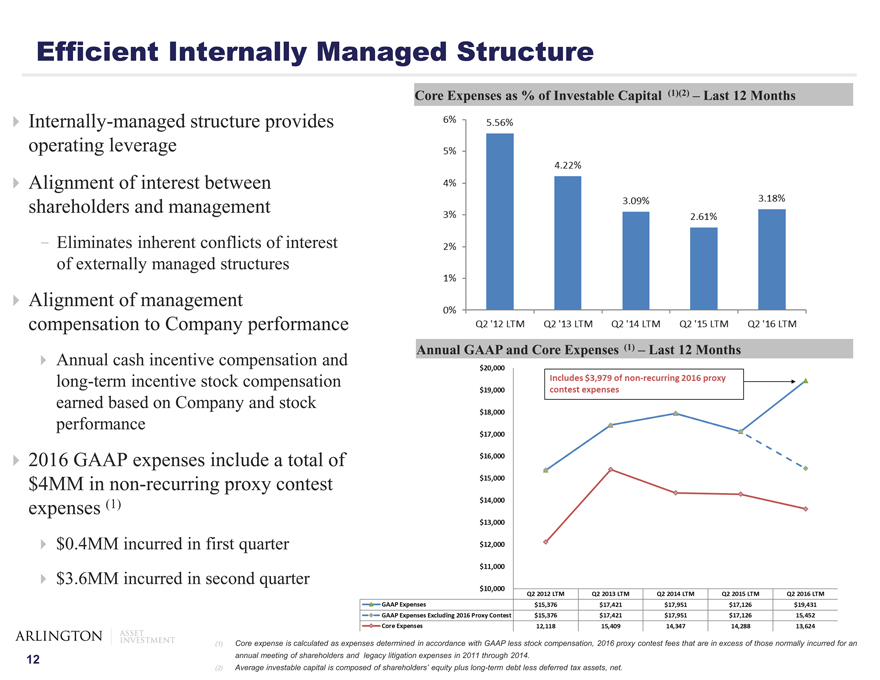
Internally-managed structure provides operating leverage
Alignment of interest between shareholders and management
Eliminates inherent conflicts of interest of externally managed structures
Alignment of management compensation to Company performance
Annual cash incentive compensation and long-term incentive stock compensation earned based on Company and stock performance
2016 GAAP expenses include a total of $4MM in non-recurring proxy contest expenses (1)
$0.4MM incurred in first quarter
$3.6MM incurred in second quarter
Core Expenses as % of Investable Capital (1)(2) – Last 12 Months
Annual GAAP and Core Expenses (1) – Last 12 Months
(1) Core expense is calculated as expenses determined in accordance with GAAP less stock compensation, 2016 proxy contest fees that are in excess of those normally incurred for an annual meeting of shareholders and legacy litigation expenses in 2011 through 2014.
(2) Average investable capital is composed of shareholders’ equity plus long-term debt less deferred tax assets, net.
12
|
|
Appendix
13
|
|
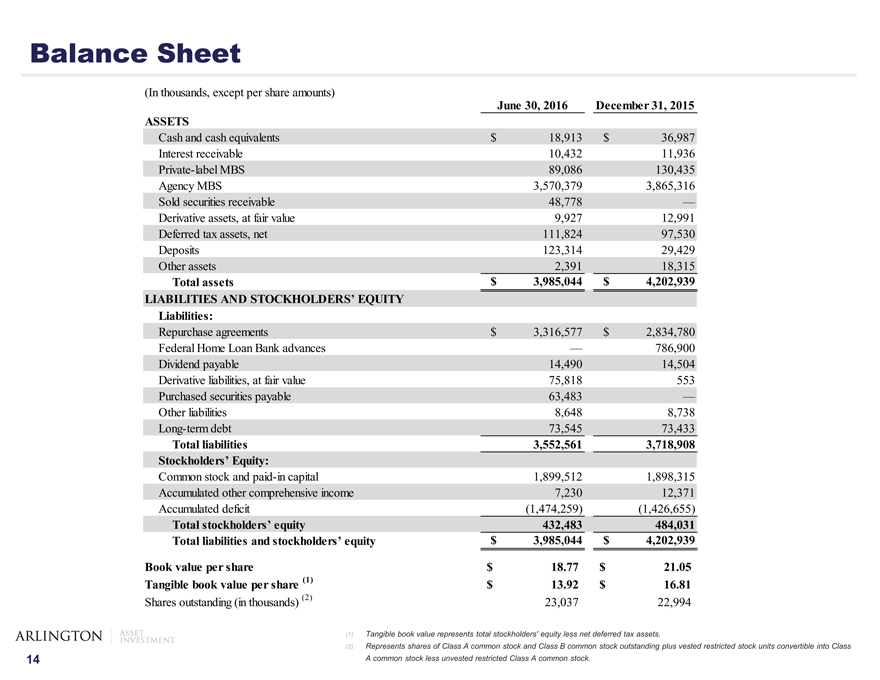
Balance Sheet
(In thousands, except per share amounts)
June 30, 2016 December 31, 2015
ASSETS
Cash and cash equivalents $ 18,913 $ 36,987
Interest receivable 10,432 11,936
Private-label MBS 89,086 130,435
Agency MBS 3,570,379 3,865,316
Sold securities receivable 48,778 —
Derivative assets, at fair value 9,927 12,991
Deferred tax assets, net 111,824 97,530
Deposits 123,314 29,429
Other assets 2,391 18,315
Total assets $ 3,985,044 $ 4,202,939
LIABILITIES AND STOCKHOLDERS’ EQUITY
Liabilities:
Repurchase agreements $ 3,316,577 $ 2,834,780
Federal Home Loan Bank advances — 786,900
Dividend payable 14,490 14,504
Derivative liabilities, at fair value 75,818 553
Purchased securities payable 63,483 —
Other liabilities 8,648 8,738
Long-term debt 73,545 73,433
Total liabilities 3,552,561 3,718,908
Stockholders’ Equity:
Common stock and paid-in capital 1,899,512 1,898,315
Accumulated other comprehensive income 7,230 12,371
Accumulated deficit(1,474,259)(1,426,655)
Total stockholders’ equity 432,483 484,031
Total liabilities and stockholders’ equity $ 3,985,044 $ 4,202,939
Book value per share $ 18.77 $ 21.05
Tangible book value per share (1) $ 13.92 $ 16.81
Shares outstanding (in thousands) (2) 23,037 22,994
(1) Tangible book value represents total stockholders’ equity less net deferred tax assets.
(2) Represents shares of Class A common stock and Class B common stock outstanding plus vested restricted stock units convertible into Class A common stock less unvested restricted Class A common stock.
14
|
|
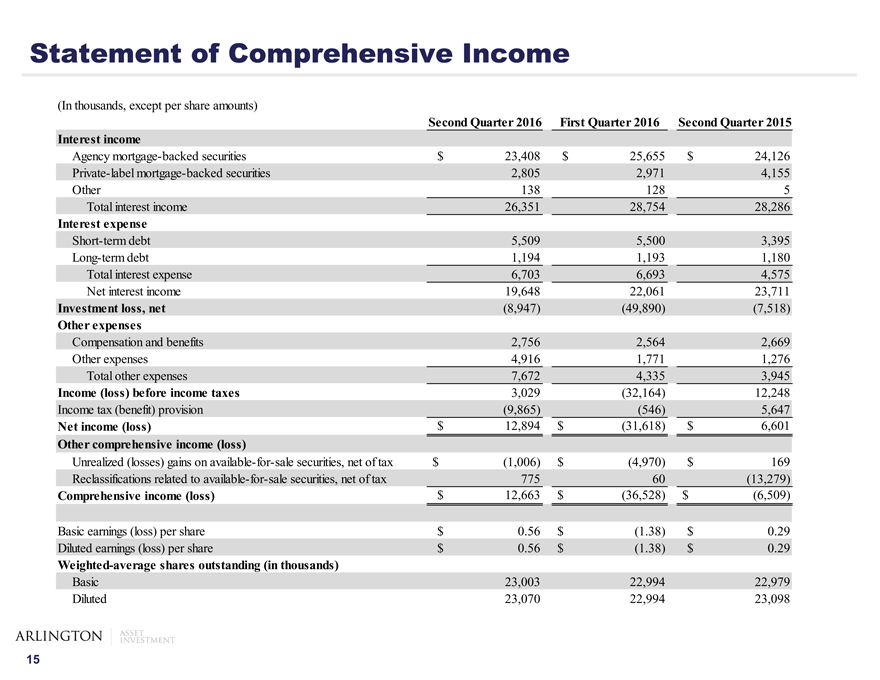
Statement of Comprehensive Income
(In thousands, except per share amounts)
Second Quarter 2016 First Quarter 2016 Second Quarter 2015
Interest income
Agency mortgage-backed securities $ 23,408 $ 25,655 $ 24,126
Private-label mortgage-backed securities 2,805 2,971 4,155
Other 138 128 5
Total interest income 26,351 28,754 28,286
Interest expense
Short-term debt 5,509 5,500 3,395
Long-term debt 1,194 1,193 1,180
Total interest expense 6,703 6,693 4,575
Net interest income 19,648 22,061 23,711
Investment loss, net(8,947)(49,890)(7,518)
Other expenses
Compensation and benefits 2,756 2,564 2,669
Other expenses 4,916 1,771 1,276
Total other expenses 7,672 4,335 3,945
Income (loss) before income taxes 3,029(32,164) 12,248
Income tax (benefit) provision(9,865)(546) 5,647
Net income (loss) $ 12,894 $(31,618) $ 6,601
Other comprehensive income (loss)
Unrealized (losses) gains on available-for-sale securities, net of tax $(1,006) $(4,970) $ 169
Reclassifications related to available-for-sale securities, net of tax 775 60(13,279)
Comprehensive income (loss) $ 12,663 $(36,528) $(6,509)
Basic earnings (loss) per share $ 0.56 $(1.38) $ 0.29
Diluted earnings (loss) per share $ 0.56 $(1.38) $ 0.29
Weighted-average shares outstanding (in thousands)
Basic 23,003 22,994 22,979
Diluted 23,070 22,994 23,098
15
|
|
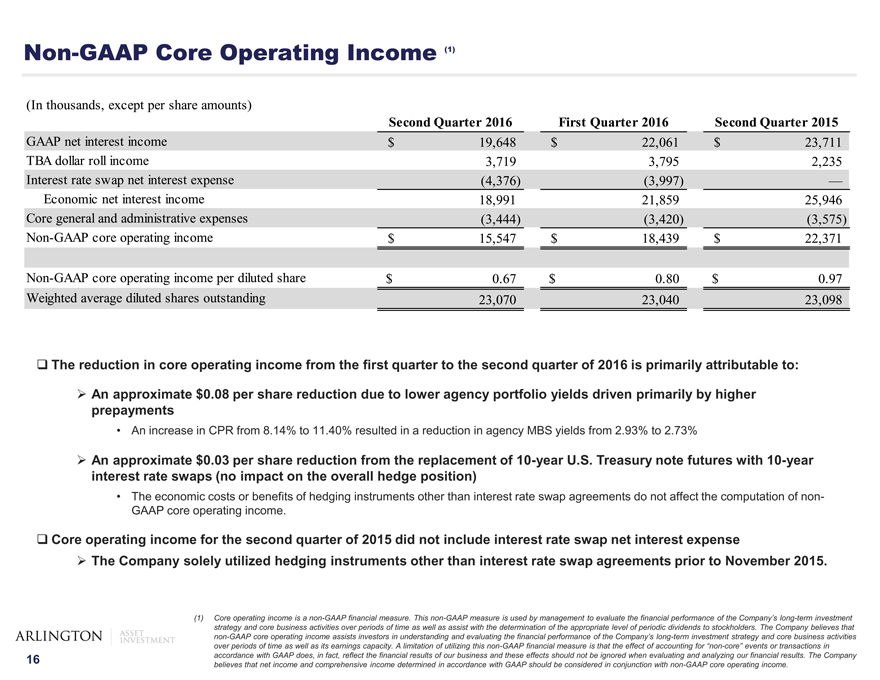
Non-GAAP Core Operating Income (1)
(In thousands, except per share amounts)
Second Quarter 2016 First Quarter 2016 Second Quarter 2015
GAAP net interest income $ 19,648 $ 22,061 $ 23,711
TBA dollar roll income 3,719 3,795 2,235
Interest rate swap net interest expense(4,376)(3,997) —
Economic net interest income 18,991 21,859 25,946
Core general and administrative expenses(3,444)(3,420)(3,575)
Non-GAAP core operating income $ 15,547 $ 18,439 $ 22,371
Non-GAAP core operating income per diluted share $ 0.67 $ 0.80 $ 0.97
Weighted average diluted shares outstanding 23,070 23,040 23,098
The reduction in core operating income from the first quarter to the second quarter of 2016 is primarily attributable to:
An approximate $0.08 per share reduction due to lower agency portfolio yields driven primarily by higher prepayments
An increase in CPR from 8.14% to 11.40% resulted in a reduction in agency MBS yields from 2.93% to 2.73%
An approximate $0.03 per share reduction from the replacement of 10-year U.S. Treasury note futures with 10-year interest rate swaps (no impact on the overall hedge position)
The economic costs or benefits of hedging instruments other than interest rate swap agreements do not affect the computation of non-GAAP core operating income.
Core operating income for the second quarter of 2015 did not include interest rate swap net interest expense
The Company solely utilized hedging instruments other than interest rate swap agreements prior to November 2015.
(1) Core operating income is a non-GAAP financial measure. This non-GAAP measure is used by management to evaluate the financial performance of the Company’s long-term investment strategy and core business activities over periods of time as well as assist with the determination of the appropriate level of periodic dividends to stockholders. The Company believes that non-GAAP core operating income assists investors in understanding and evaluating the financial performance of the Company’s long-term investment strategy and core business activities over periods of time as well as its earnings capacity. A limitation of utilizing this non-GAAP financial measure is that the effect of accounting for “non-core” events or transactions in accordance with GAAP does, in fact, reflect the financial results of our business and these effects should not be ignored when evaluating and analyzing our financial results. The Company believes that net income and comprehensive income determined in accordance with GAAP should be considered in conjunction with non-GAAP core operating income.
16
|
|
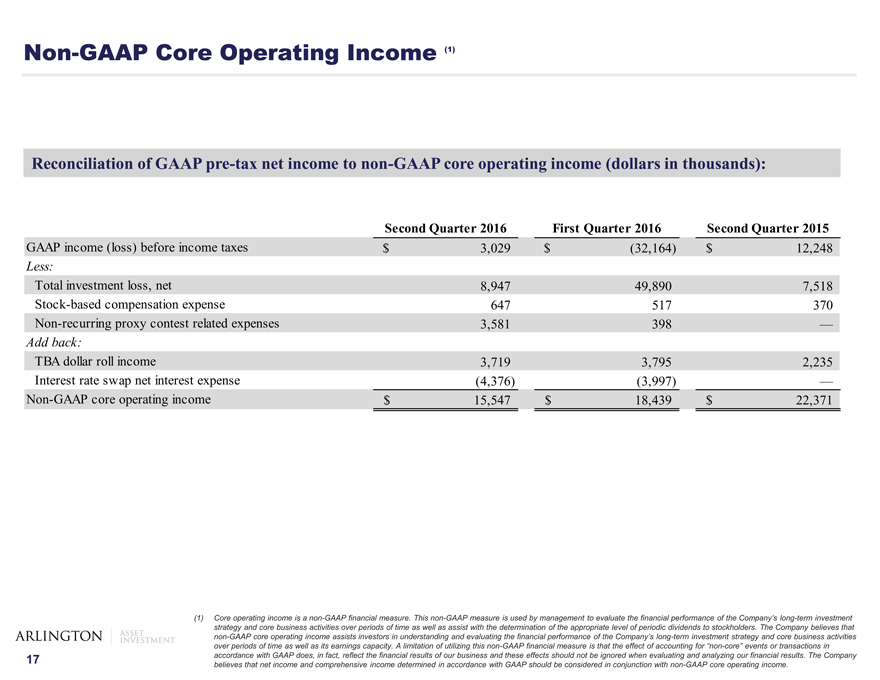
Non-GAAP Core Operating Income (1)
Reconciliation of GAAP pre-tax net income to non-GAAP core operating income (dollars in thousands):
Second Quarter 2016 First Quarter 2016 Second Quarter 2015
GAAP income (loss) before income taxes $ 3,029 $(32,164) $ 12,248
Less:
Total investment loss, net 8,947 49,890 7,518
Stock-based compensation expense 647 517 370
Non-recurring proxy contest related expenses 3,581 398 —
Add back:
TBA dollar roll income 3,719 3,795 2,235
Interest rate swap net interest expense(4,376)(3,997) —
Non-GAAP core operating income $ 15,547 $ 18,439 $ 22,371
(1) Core operating income is a non-GAAP financial measure. This non-GAAP measure is used by management to evaluate the financial performance of the Company’s long-term investment strategy and core business activities over periods of time as well as assist with the determination of the appropriate level of periodic dividends to stockholders. The Company believes that non-GAAP core operating income assists investors in understanding and evaluating the financial performance of the Company’s long-term investment strategy and core business activities over periods of time as well as its earnings capacity. A limitation of utilizing this non-GAAP financial measure is that the effect of accounting for “non-core” events or transactions in accordance with GAAP does, in fact, reflect the financial results of our business and these effects should not be ignored when evaluating and analyzing our financial results. The Company believes that net income and comprehensive income determined in accordance with GAAP should be considered in conjunction with non-GAAP core operating income.
17
|
|
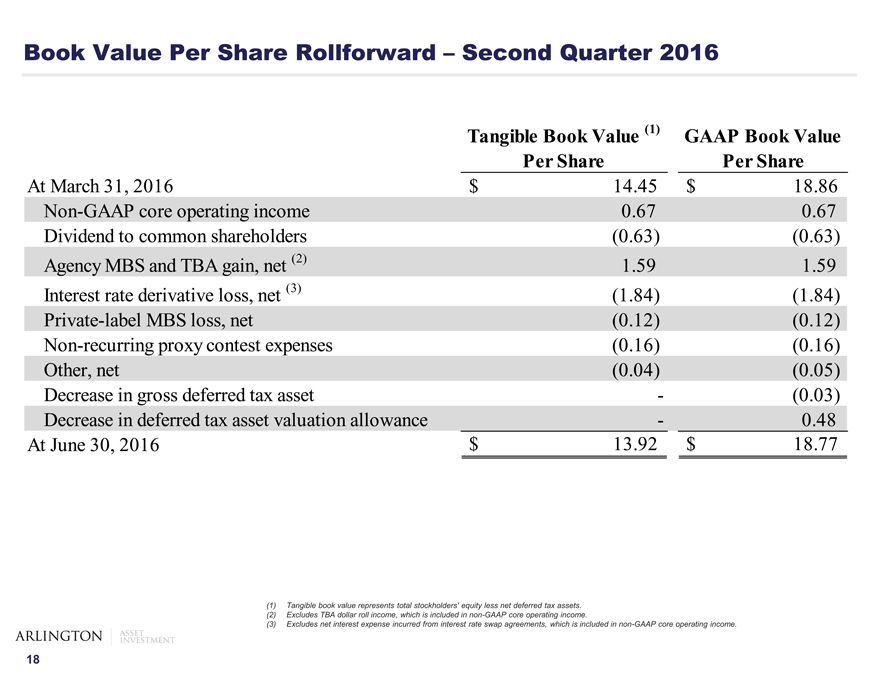
Book Value Per Share Rollforward – Second Quarter 2016
Tangible Book Value (1) GAAP Book Value
Per Share Per Share
At March 31, 2016 $ 14.45 $ 18.86
Non-GAAP core operating income 0.67 0.67
Dividend to common shareholders(0.63)(0.63)
Agency MBS and TBA gain, net (2) 1.59 1.59
Interest rate derivative loss, net (3)(1.84)(1.84)
Private-label MBS loss, net(0.12)(0.12)
Non-recurring proxy contest expenses(0.16)(0.16)
Other, net(0.04)(0.05)
Decrease in gross deferred tax asset -(0.03)
Decrease in deferred tax asset valuation allowance—0.48
At June 30, 2016 $ 13.92 $ 18.77
(1) Tangible book value represents total stockholders’ equity less net deferred tax assets. (2) Excludes TBA dollar roll income, which is included in non-GAAP core operating income.
(3) Excludes net interest expense incurred from interest rate swap agreements, which is included in non-GAAP core operating income.
18
|
|
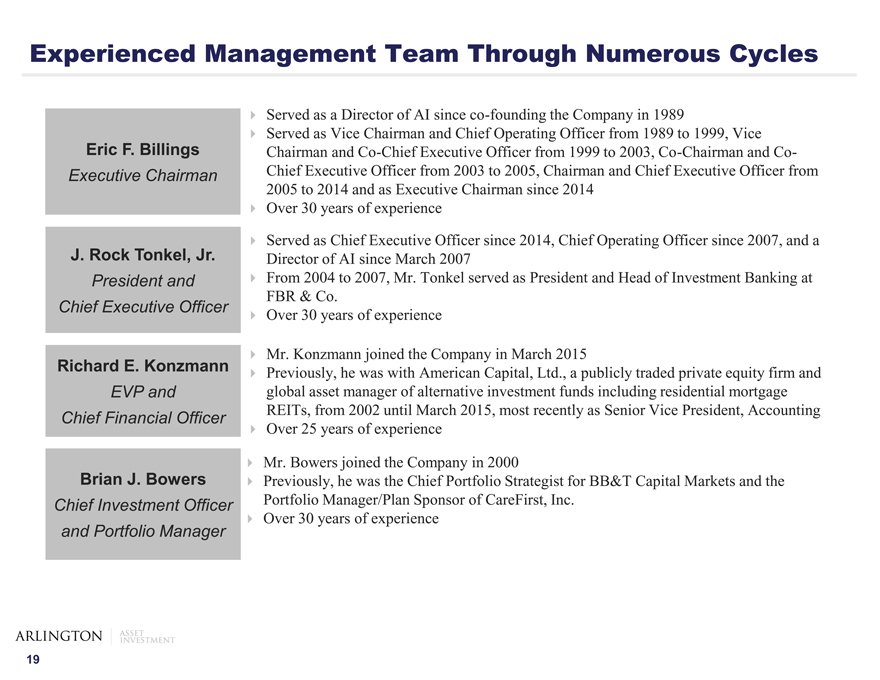
Experienced Management Team Through Numerous Cycles
Eric F. Billings
Executive Chairman
J. Rock Tonkel, Jr.
President and Chief Executive Officer
Richard E. Konzmann
EVP and Chief Financial Officer
Brian J. Bowers
Chief Investment Officer and Portfolio Manager
Served as a Director of AI since co-founding the Company in 1989
Served as Vice Chairman and Chief Operating Officer from 1989 to 1999, Vice Chairman and Co-Chief Executive Officer from 1999 to 2003, Co-Chairman and Co-Chief Executive Officer from 2003 to 2005, Chairman and Chief Executive Officer from 2005 to 2014 and as Executive Chairman since 2014 Over 30 years of experience
Served as Chief Executive Officer since 2014, Chief Operating Officer since 2007, and a Director of AI since March 2007 From 2004 to 2007, Mr. Tonkel served as President and Head of Investment Banking at FBR & Co.
Over 30 years of experience
Mr. Konzmann joined the Company in March 2015
Previously, he was with American Capital, Ltd., a publicly traded private equity firm and global asset manager of alternative investment funds including residential mortgage REITs, from 2002 until March 2015, most recently as Senior Vice President, Accounting Over 25 years of experience
Mr. Bowers joined the Company in 2000
Previously, he was the Chief Portfolio Strategist for BB&T Capital Markets and the Portfolio Manager/Plan Sponsor of CareFirst, Inc.
Over 30 years of experience
19