Attached files
| file | filename |
|---|---|
| EX-31.02 - EXHIBIT 31.02 - Arlington Asset Investment Corp. | v430343_ex31-02.htm |
| EX-12.01 - EXHIBIT 12.01 - Arlington Asset Investment Corp. | v430343_ex12-01.htm |
| EX-21.01 - EXHIBIT 21.01 - Arlington Asset Investment Corp. | v430343_ex21-01.htm |
| EX-23.01 - EXHIBIT 23.01 - Arlington Asset Investment Corp. | v430343_ex23-01.htm |
| EX-32.02 - EXHIBIT 32.02 - Arlington Asset Investment Corp. | v430343_ex32-02.htm |
| EX-31.01 - EXHIBIT 31.01 - Arlington Asset Investment Corp. | v430343_ex31-01.htm |
| EX-32.01 - EXHIBIT 32.01 - Arlington Asset Investment Corp. | v430343_ex32-01.htm |
UNITED STATES
SECURITIES AND EXCHANGE COMMISSION
Washington, D.C. 20549
FORM 10-K
(Mark One)
| x | ANNUAL REPORT PURSUANT TO SECTION 13 OR 15(d) OF THE SECURITIES EXCHANGE ACT OF 1934 |
For the fiscal year ended December 31, 2015
OR
| o | TRANSITION REPORT PURSUANT TO SECTION 13 OR 15(d) OF THE SECURITIES EXCHANGE ACT OF 1934 |
For the transition period from to
Commission File Number: 001-34374
ARLINGTON ASSET INVESTMENT CORP.
(Exact name of registrant as specified in its charter)
| Virginia | 54-1873198 | |
| (State or Other Jurisdiction of Incorporation or Organization) |
(I.R.S. Employer Identification No.) |
1001 Nineteenth Street North,
Arlington, VA 22209
(Address of Principal Executive Offices) (Zip Code)
(703) 373-0200
(Registrant’s telephone number, including area code)
Securities registered pursuant to Section 12(b) of the Act:
| Title of Each Class of Securities | Name of Each Exchange on Which Registered | |
| Class A Common Stock, Par Value $0.01 | New York Stock Exchange | |
|
6.625% Senior Notes due 2023 6.75% Senior Notes due 2025 |
New York Stock Exchange New York Stock Exchange |
Securities registered pursuant to Section 12(g) of the Act: None
Indicate by check mark if the registrant is a well-known seasoned issuer, as defined in Rule 405 of the Securities Act: Yes ¨ No x
Indicate by check mark if the registrant is not required to file reports pursuant to Section 13 or Section 15(d) of the Act: Yes ¨ No x
Indicate by check mark whether the registrant (1) has filed all reports required to be filed by Section 13 or 15(d) of the Securities Exchange Act of 1934 during the preceding 12 months (or for such shorter period that the registrant was required to file such reports), and (2) has been subject to such filing requirements for the past 90 days: Yes x No o
Indicate by check mark whether the registrant has submitted electronically and posted on its corporate Web site, if any, every Interactive Data File required to be submitted and posted pursuant to Rule 405 of Regulation S-T (§232.405 of this chapter) during the preceding 12 months (or for such shorter period that the registrant was required to submit and post such files): Yes x No o
Indicate by check mark if disclosure of delinquent filers pursuant to Item 405 of Regulation S-K is not contained herein, and will not be contained, to the best of registrant’s knowledge, in definitive proxy or information statements incorporated by reference in Part III of this Form 10-K or any amendment to this Form 10-K: x
Indicate by check mark whether the registrant is a large accelerated filer, an accelerated filer, a non-accelerated filer or a smaller reporting company. See definition of “large accelerated filer,” “accelerated filer” and “smaller reporting company” in Rule 12b-2 of the Exchange Act. (Check one):
| Large Accelerated Filer o | Accelerated Filer x | Non-Accelerated Filer o | Smaller Reporting Company o |
Indicate by check mark whether the registrant is a shell company (as defined in Rule 12b-2 of the Exchange Act):Yes o No x
The aggregate market value of the registrant’s Class A and Class B common stock held by non-affiliates computed by reference to the last reported price at which the registrant’s Class A common stock was sold on the New York Stock Exchange on June 30, 2015 was approximately $441 million. There is no public trading market for the registrant’s Class B common stock; however, the Class B common stock is convertible into Class A common stock on a share-for-share basis.
As of January 29, 2016, there were 22,874,819 shares of the registrant’s Class A common stock outstanding and 102,216 shares of the registrant’s Class B common stock outstanding.
Documents incorporated by reference: Portions of the registrant’s Definitive Proxy Statement for the 2016 Annual Meeting of Shareholders (to be filed with the Securities and Exchange Commission no later than 120 days after the end of the registrant’s fiscal year end) are incorporated by reference in this Annual Report on Form 10-K in response to Part II, Item 5 and Part III, Items 10, 11, 12, 13 and 14.
TABLE OF CONTENTS
CAUTIONARY STATEMENT ABOUT FORWARD-LOOKING INFORMATION
When used in this Annual Report on Form 10-K, in future filings with the Securities and Exchange Commission (“SEC”) or in press releases or other written or oral communications, statements which are not historical in nature, including those containing words such as “believe,” “expect,” “anticipate,” “estimate,” “plan,” “continue,” “intend,” “should,” “may” or similar expressions, are intended to identify “forward-looking statements” within the meaning of Section 27A of the Securities Act of 1933, as amended (the “Securities Act”), and Section 21E of the Securities Exchange Act of 1934, as amended (the “Exchange Act”), and, as such, may involve known and unknown risks, uncertainties and assumptions. The forward-looking statements we make in this Annual Report on Form 10-K include, but are not limited to, statements about the following:
| • | the availability and terms of, and our ability to deploy, capital and our ability to grow our business through a strategy focused on acquiring primarily residential mortgage-backed securities (“MBS”) that are either issued by U.S. government agencies or guaranteed as to principal and interest by U.S. government agencies or U.S. government sponsored agencies (“agency MBS”), and MBS issued by private organizations (“private-label MBS”); |
| • | our ability to forecast our tax attributes, which are based upon various facts and assumptions, and our ability to protect and use our net operating losses (“NOLs”), and net capital losses (“NCLs”), to offset future taxable income, including whether our shareholder rights plan (“Rights Plan”) will be effective in preventing an ownership change that would significantly limit our ability to utilize such losses; |
| i |
| • | our business, acquisition, leverage, asset allocation, operational, investment, hedging and financing strategies and the success of these strategies; |
| • | the effect of changes in prepayment rates, interest rates and default rates on our portfolio; |
| • | the effect of governmental regulation and actions; |
| • | our ability to quantify and manage risk; |
| • | our ability to realize any reflation of our assets; |
| • | our ability to roll our repurchase agreements on favorable terms, if at all; |
| • | our liquidity; |
| • | our asset valuation policies; |
| • | our decisions with respect to, and ability to make, future dividends; |
| • | investing in assets other than MBS or pursuing business activities other than investing in MBS; |
| • | our ability to maintain our exclusion from the definition of “investment company” under the Investment Company Act of 1940, as amended (the “1940 Act”); |
| • | our decision to not elect to be taxed as a real estate investment trust (“REIT”) under the Internal Revenue Code; and |
| • | the effect of general economic conditions on our business. |
Forward-looking statements are based on our beliefs, assumptions and expectations of our future performance, taking into account information currently in our possession. These beliefs, assumptions and expectations may change as a result of many possible events or factors, not all of which are known to us or are within our control. If a change occurs, the performance of our portfolio and our business, financial condition, liquidity and results of operations may vary materially from those expressed, anticipated or contemplated in our forward-looking statements. You should carefully consider these risks, along with the following factors that could cause actual results to vary from our forward-looking statements, before making an investment in our securities:
| • | the overall environment for interest rates, changes in interest rates, interest rate spreads, the yield curve and prepayment rates, including the timing of increases in the Federal Funds rate by the Federal Reserve; |
| • | current conditions and further adverse developments in the residential mortgage market and the overall economy; |
| • | potential risk attributable to our mortgage-related portfolios, including changes in fair value; |
| • | our use of leverage and our dependence on repurchase agreements and other short-term borrowings to finance our mortgage-related holdings; |
| • | the availability of certain short-term liquidity sources; |
| • | competition for investment opportunities, including competition from the U.S. Department of Treasury (“U.S. Treasury”) and the U.S. Federal Reserve, for investments in agency MBS, as well as the timing of the termination by the U.S. Federal Reserve of its purchases of agency MBS; |
| ii |
| • | the federal conservatorship of the Federal National Mortgage Association (“Fannie Mae”) and the Federal Home Loan Mortgage Corporation (“Freddie Mac”) and related efforts, along with any changes in laws and regulations affecting the relationship between Fannie Mae and Freddie Mac and the federal government; |
| • | mortgage loan prepayment activity, modification programs and future legislative action; |
| • | changes in, and success of, our acquisition, hedging and leverage strategies, changes in our asset allocation and changes in our operational policies, all of which may be changed by us without shareholder approval; |
| • | failure of sovereign or municipal entities to meet their debt obligations or a downgrade in the credit rating of such debt obligations; |
| • | fluctuations of the value of our hedge instruments; |
| • | fluctuating quarterly operating results; |
| • | changes in laws and regulations and industry practices that may adversely affect our business; |
| • | volatility of the securities markets and activity in the secondary securities markets in the United States and elsewhere; |
| • | our ability to successfully expand our business into areas other than investing in MBS; and |
| • | the other important factors identified in this Annual Report on Form 10-K under the caption “Item 1A — Risk Factors.” |
These and other risks, uncertainties and factors, including those described elsewhere in this Annual Report on Form 10-K, could cause our actual results to differ materially from those projected in any forward-looking statements we make. All forward-looking statements speak only as of the date on which they are made. New risks and uncertainties arise over time and it is not possible to predict those events or how they may affect us. Except as required by law, we are not obligated to, and do not intend to, update or revise any forward-looking statements, whether as a result of new information, future events or otherwise.
| iii |
Unless the context otherwise requires or indicates, all references in this Annual Report on Form 10-K to “Arlington Asset” refer to Arlington Asset Investment Corp., and all references to “we,” “us,” “our,” and the “Company,” refer to Arlington Asset Investment Corp. and its consolidated subsidiaries.
Our Company
We are a principal investment firm that currently acquires and holds a levered portfolio of residential mortgage-backed securities (“MBS”), consisting of agency MBS and private-label MBS. Agency MBS include residential mortgage pass-through certificates for which the principal and interest payments are guaranteed by a U.S. government agency or government sponsored enterprise (“GSE”), such as the Federal National Mortgage Association (“Fannie Mae”) and the Federal Home Loan Mortgage Corporation (“Freddie Mac”). Private-label MBS, or non-agency MBS, include residential MBS that are not guaranteed by a GSE or the U.S. government.
We leverage prudently our investment portfolio so as to increase potential returns to our shareholders. We fund our investments primarily through short-term financing arrangements.
We are a Virginia corporation and taxed as a C corporation for U.S. federal tax purposes. We are an internally managed company and do not have an external investment advisor.
Investment Strategy
We manage our investment portfolio with the goal of obtaining a high risk-adjusted return on capital. We evaluate the rates of return that can be achieved in each asset class and for each individual security within an asset class in which we participate. We then evaluate opportunities against the returns available in each of our investment alternatives and attempt to allocate our assets and capital with an emphasis toward what we believe to be the highest risk-adjusted return available. We expect this strategy will cause us to have different allocations of capital and leverage in different market environments.
Currently, based on market conditions, we believe our residential MBS portfolio has provided us with higher relative risk-adjusted rates of return than most other investment opportunities we have evaluated. Consequently, we have maintained a high allocation of our assets and capital in this sector and have continued to analyze other opportunities and compare risk-adjusted returns to our residential MBS assets. Within our residential MBS investment portfolio, we have continued to gradually increase our investment capital allocation to agency MBS from private-label MBS. As of December 31, 2015, approximately 80% of our investment capital is allocated to agency MBS and 20% is allocated to private-label MBS.
In the future, we may invest in other types of residential mortgage assets such as residential mortgage loans, mortgage servicing rights and GSE credit risk transfer securities, as well as other types of assets, including commercial MBS, asset backed securities, other structured securities, commercial mortgage loans, commercial loans, and other real estate-related loans and securities. In addition, we also may pursue other business activities that would utilize our experience in analyzing investment opportunities and applying similar portfolio management skills. We may change our investment strategy at any time without the consent of our shareholders; accordingly, in the future, we could make investments or enter into hedging transactions that are different from, and possibly riskier than, the investments and associated hedging transactions described in this Annual Report on Form 10-K.
MBS Portfolio
The following table summarizes our MBS investment portfolio at fair value as of December 31, 2015 and 2014 (dollars in thousands):
| December 31, 2015 | December 31, 2014 | |||||||
| Agency MBS | $ | 3,865,316 | $ | 3,414,340 | ||||
| Private-label MBS | 130,435 | 267,437 | ||||||
| Private-label interest-only MBS | 118 | 212 | ||||||
| Net long TBA positions (1) | 389,258 | 213,563 | ||||||
| $ | 4,385,127 | $ | 3,895,552 | |||||
| (1) | Represents the fair value of the underlying agency MBS. Net long TBA positions are reflected on the consolidated balance sheets as a component of “derivative assets, at fair value” and “derivative liabilities, at fair value,” with a liability net carrying value of $553 and an asset net carrying value of $516 as of December 31, 2015 and 2014, respectively. |
| 1 |
Agency MBS
Agency MBS consist of residential pass-through certificates that are securities representing undivided interests in "pools" of mortgage loans secured by residential real property. The monthly payments of both principal and interest of the securities are guaranteed by a U.S. government agency or GSE to holders of the securities, in effect "passing through" the monthly payments made by the individual borrowers on the mortgage loans that underlie the securities plus “guarantee payments” made in the event of any defaults on such mortgage loans, net of fees paid to the issuer/guarantor and servicers of the underlying mortgage loans, to the holders of the securities. In general, mortgage pass-through certificates distribute cash flows from the underlying collateral on a pro rata basis among the holders of the securities. Although the principal and interest payments are guaranteed by a U.S. government agency or GSE to the security holder, the market value of the agency MBS is not guaranteed by a U.S. government agency or GSE.
The agency MBS that we primarily invest in are Fannie Mae and Freddie Mac agency MBS. Fannie Mae and Freddie Mac are stockholder-owned corporations chartered by Congress with a public mission to provide liquidity, stability, and affordability to the U.S. housing market. Fannie Mae and Freddie Mac are currently regulated by the Federal Housing Finance Agency ("FHFA"), the U.S. Department of Housing and Urban Development ("HUD"), the U.S. Securities and Exchange Commission (“SEC”), and the U.S. Department of the Treasury ("U.S. Treasury"), and are currently operating under the conservatorship of the FHFA. The U.S. Treasury has agreed to support the continuing operations of Fannie Mae and Freddie Mac with any necessary capital contributions while in conservatorship. However, the U.S. government does not guarantee the securities, or other obligations, of Fannie Mae or Freddie Mac.
Fannie Mae and Freddie Mac operate in the secondary mortgage market. They provide funds to the mortgage market by purchasing residential mortgages from primary mortgage market institutions, such as commercial banks, savings and loan associations, mortgage banking companies, seller/servicers, securities dealers and other investors. Through the mortgage securitization process, they package mortgage loans into guaranteed MBS for sale to investors, such as us, in the form of pass-through certificates and guarantee the payment of principal and interest on the securities or on the underlying loans held within the securitization trust in exchange for guarantee fees. The underlying loans must meet certain underwriting standards established by Fannie Mae and Freddie Mac (referred to as "conforming loans") and may be fixed or adjustable rate loans with original terms to maturity generally up to 40 years.
Agency MBS differ from other forms of traditional fixed-income securities which normally provide for periodic payments of interest in fixed amounts with principal payments at maturity. Instead, agency MBS provide for a monthly payment that consists of both interest and principal. In addition, outstanding principal on the agency MBS may be prepaid, without penalty, at par at any time due to prepayments on the underlying mortgage loans. These differences can result in significantly greater price and yield volatility than is the case with more traditional fixed-income securities.
Agency MBS are collateralized by pools of either fixed-rate mortgage loans, adjustable-rate mortgage loans ("ARMs") or hybrid ARMs. We generally target agency MBS collateralized by fixed-rate mortgage loans, although we may invest in agency MBS collateralized by ARMs or hybrid ARMs in the future. The original terms to maturity of agency MBS may be up to 40 years. As of December 31, 2015, the Company’s agency MBS portfolio was comprised of securities that have original terms to maturity of 30 years.
| 2 |
We purchase agency MBS either in initial offerings or in the secondary market through broker-dealers or similar entities. We may also utilize to-be-announced ("TBA") forward contracts in order to invest in agency MBS or to hedge our investments. A TBA security is a forward contract for the purchase or the sale of agency securities at a predetermined price, face amount, issuer, coupon and stated maturity on an agreed-upon future date, but the particular agency securities to be delivered are not identified until shortly before the TBA settlement date. We may also choose, prior to settlement, to move the settlement of these securities out to a later date by entering into an offsetting position (referred to as a "pair off"), net settling the paired off positions for cash, and simultaneously entering into a similar TBA contract for a later settlement date, which is commonly collectively referred to as a "dollar roll" transaction.
Private-Label MBS
We also invest in private-label MBS, which are residential MBS that are not issued or guaranteed by a U.S. government agency or a GSE. Private-label MBS are often referred to as non-agency MBS. The private-label MBS in which we invest are generally backed by a pool of single-family residential mortgage loans. These certificates are issued by originators of, investors in, and other owners of residential mortgage loans, including savings and loan associations, savings banks, commercial banks, mortgage banks, investment banks and special purpose “conduit” subsidiaries of these institutions. Private-label MBS can carry a significantly higher level of credit exposure relative to the credit exposure of agency MBS. The private-label MBS that we invest in are generally non-investment grade or not rated by major rating agencies.
While agency MBS are backed by the express obligation or guarantee of a U.S. government agency or GSE as described above, private-label MBS are generally only supported by one or more forms of private (i.e., non-governmental) credit enhancement. These credit enhancements provide an extra layer of loss coverage in the event that losses are incurred upon foreclosure sales or other liquidations of underlying mortgaged properties in amounts that exceed the equity holder’s equity interest in the property. Forms of credit enhancement include limited issuer guarantees, reserve funds, private mortgage guaranty pool insurance, overcollateralization and subordination. Subordination is a form of credit enhancement frequently used and involves the issuance of classes of MBS that are subordinate to senior class MBS and, accordingly, are the first to absorb credit losses realized on the underlying mortgage loans. In addition, private-label agency MBS are generally purchased at a discount to par value, which may provide further protection to credit losses of the underlying residential mortgage loan collateral. As of December 31, 2015, the substantial discount to par value at which our private-label MBS were purchased is the primary source of protection afforded to our capital invested in private-label MBS, in addition to a nominal amount of remaining structural credit enhancement provided by collateral-level subordinate interests.
Private-label MBS are backed by pools of residential mortgages that can be composed of prime or non-prime mortgage loans. Prime mortgage loans are residential mortgage loans that generally conform to the underwriting guidelines of a U.S. government agency or a GSE but that do not carry any credit guarantee from either a U.S. government agency or a GSE. Jumbo prime mortgage loans are prime mortgage loans that conform to such underwriting guidelines except with respect to maximum loan size. Non-prime mortgage loans are residential mortgage loans that do not meet all of the underwriting guidelines of a U.S. government agency or a GSE. Consequently, these loans may carry higher credit risk than prime mortgage loans. Non-prime mortgage loans may have been originated through programs that allow borrowers to qualify for a mortgage loan with reduced or alternative forms of documentation. Non-prime mortgage loans include loans commonly referred to as alternative A-paper ("Alt-A") or as subprime. Alt-A mortgage loans are generally considered riskier than prime mortgage loans and less risky than subprime mortgage loans. Alt-A mortgage loans are typically characterized by borrowers with less than full documentation, lower credit scores and higher loan-to-value ratios and include a higher percentage of investment properties as collateral. Subprime mortgage loans are considered to be of the lowest credit quality. These loans may also include “option-ARM” loans, which contain a feature providing the borrower the option, within certain constraints, to make lesser payments than otherwise required by the stated interest rate for a number of years, leading to negative amortization and increased loan balances. As of December 31, 2015, our private-label MBS are ultimately collateralized by pools of either prime or Alt-A mortgage loans.
| 3 |
The private-label MBS that we primarily invest in are generally issued by a securitization trust referred to as a Real Estate Mortgage Investment Conduit (“REMIC”). The securitization trust will generally issue both senior and subordinated interests. Senior securities are those interests in a securitization that have the first right to cash flows and are last in line to absorb losses, and, therefore, have the least credit risk in a securitization transaction. In general, most, if not all, principal collected from the underlying mortgage loan pool is used to pay down the senior securities until certain performance tests are satisfied. If certain performance tests are satisfied, principal payments are allocated, generally on a pro rata basis, between the senior securities and the subordinated securities. Conversely, the most subordinate securities are those interests in a securitization that have the last right to cash flows and are first in line to absorb losses. Subordinate securities absorb the initial credit losses from a securitization structure, thus protecting the senior securities. Subordinate securities generally receive interest payments even if they do not receive principal payments.
In addition, private-label MBS also may include a re-securitization of MBS which is also referred to as a “re-REMIC” security. For example, a re-REMIC security may consist of re-securitized senior classes of REMIC securities. In turn, the collateral of these senior class REMIC securities consists of the underlying residential mortgage loans. The re-REMIC securitization trust will generally issue both senior and subordinated interests similar to a REMIC securitization trust. A subordinated interest in a re-securitized senior class of REMIC securities may also be referred to as a “mezzanine” interest.
As of December 31, 2015, our private-label MBS portfolio consists almost entirely of re-REMIC securities. Our investments in re-REMIC securities represent mezzanine interests in underlying, re-securitized senior class MBS issued by private-label REMIC securitization trusts. The senior class REMIC securities that serve as collateral to our investments in re-REMIC securities represent beneficial interests in pools of prime or Alt-A residential mortgage loan collateral that hold the first right to cash flows and absorb credit losses only after their respective subordinate REMIC classes have been fully extinguished. The majority of the trusts that issued our investments in re-REMIC securities employ a “sequential” principal repayment structure, while a minority of the issuing trusts employ a “pro-rata” principal repayment structure. Accordingly, the majority of our mezzanine class re-REMIC securities are not entitled to receive principal repayments until the principal balance of the senior interest in the respective collateral group has been reduced to zero. Principal shortfalls are allocated on a “reverse sequential” basis. Accordingly, any principal shortfalls on the underlying senior class REMIC securities are first absorbed by our mezzanine class re-REMIC securities, to the extent of their respective principal balance, prior to being allocated to the senior interest in the respective collateral pool. Periodic interest is accrued on each re-REMIC security’s outstanding principal balance at its contractual coupon rate, even during periods in which the re-REMIC security is not entitled to principal payments.
Financing Strategy
We use leverage to finance a portion of our MBS portfolio and to seek to increase potential returns to our shareholders. To the extent that revenue derived from our MBS portfolio exceeds our interest expense and other costs of the financing, our net income will be greater than if we had not borrowed funds and had not invested in the assets. Conversely, if the revenue from our MBS portfolio does not sufficiently cover the interest expense and other costs of the financing, our net income will be less or our net loss will be greater than if we had not borrowed funds.
Because of the credit and interest rate risks inherent in our strategy, we closely monitor the leverage (debt-to-equity ratio) of our MBS portfolio. Our leverage may vary from time to time depending upon several factors, including changes in the value of the underlying MBS and hedge portfolio, the timing and amount of investment purchases or sales, and our assessment of risk and returns.
We finance our investments in MBS using short-term borrowings, which primarily consist of repurchase agreements. We have also issued, and may issue in the future, long-term notes as an additional source of financing.
When we engage in a repurchase transaction, we initially sell securities to the counterparty under a master repurchase agreement in exchange for cash from the counterparty. The counterparty is obligated to resell the same securities back to us at the end of the term of the repurchase agreement, which typically is 30 to 90 days, but may have maturities as short as one day and as long as one year. Amounts available to be borrowed under our repurchase agreements are dependent upon lender collateral requirements and the lender’s determination of the fair value of the securities pledged as collateral, which fluctuates with changes in interest rates, credit quality and liquidity conditions within the investment banking, mortgage finance and real estate industries. In addition, our counterparties apply a “haircut” to our pledged collateral, which means our collateral is valued, for the purposes of the repurchase transaction, at less than market value. Under our repurchase agreements, we typically pay a floating rate based on the London Interbank Offered Rate (“LIBOR”), plus or minus a fixed spread. These transactions are accounted for as secured financings, and we present the investment securities and related funding on our consolidated balance sheets.
| 4 |
Risk Management Strategy
In conducting our business, we are exposed to market risks, including interest rate, prepayment, extension, credit, liquidity and regulatory risks. We use a variety of strategies to hedge a portion of our exposure to these risks to the extent we believe to be prudent, taking into account our investment strategy and the cost of the hedging transactions. As a result, we may not hedge certain interest rate, prepayment, extension or credit risks if we believe that bearing such risks enhances our return relative to our risk/return profile.
| · | Interest Rate Risk |
We hedge some of our exposure to potential interest rate mismatches between the interest we earn on our longer term investments and the interest we pay on our shorter term borrowings. We enter into various hedging transactions to mitigate the interest rate sensitivity of our cost of borrowing and the value of our MBS portfolio. Because a majority of our funding is in the form of repurchase agreements, our financing costs fluctuate based on short-term interest rate indices, such as LIBOR. Because the vast majority of our investments are assets that have fixed rates of interest and could mature in up to 40 years, the interest we earn on these assets generally does not move in tandem with the interest rates that we pay on our funding repurchase agreements, which generally have a maturity of less than one year. We may experience reduced income, losses, or a significant reduction in our book value due to adverse interest rate movements. In order to attempt to mitigate a portion of such risk, we utilize certain hedging techniques to attempt to lock in a portion of the net spread between the interest we earn on our assets and the interest we pay on our financing costs.
Additionally, because prepayments on residential mortgages generally accelerate when interest rates decrease and slow when interest rates increase, mortgage securities typically have "negative convexity." In other words, certain mortgage securities in which we invest may increase in value to a lesser degree than similar duration bonds, or even fall in value, as interest rates decline. Conversely, certain mortgage securities in which we invest may decrease in value to a greater degree than similar duration bonds as interest rates increase. In order to manage this risk, we monitor, among other things, the "duration gap" between our mortgage assets and our hedge portfolio as well as our convexity exposure. Duration is an estimate of the relative expected percentage change in market value of our mortgage assets or our hedge portfolio that would be caused by a parallel change in short and long-term interest rates. Convexity exposure relates to the way the duration of our mortgage assets or our hedge portfolio changes when the interest rate or prepayment environment changes.
The value of our mortgage assets may also be adversely impacted by fluctuations in the shape of the yield curve or by changes in the market's expectation about the volatility of future interest rates. We analyze our exposure to non-parallel changes in interest rates and to changes in the market's expectation of future interest rate volatility and take actions to attempt to mitigate these risks.
| · | Prepayment Risk |
Because residential borrowers have the option to prepay their mortgage loans at par at any time, we face the risk that we will experience a return of principal on our investments faster than anticipated. Prepayment risk generally increases when interest rates decline. In this scenario, our financial results may be adversely affected as we may have to re-invest that principal at potentially lower yields.
| · | Extension Risk |
Because residential borrowers have the option to make only scheduled payments on their mortgage loans, rather than prepay their mortgage loans, we face the risk that a return of capital on our investment will occur slower than anticipated. Extension risk generally increases when interest rates rise. In this scenario, our financial results may be adversely affected as we may have to finance our investments at potentially higher costs without the ability to reinvest principal into higher yielding securities.
| 5 |
| · | Credit Risk |
We accept mortgage credit exposure at levels we deem prudent within the context of our investment strategy. Therefore, we may retain all or a portion of the credit risk on the loans underlying our private-label MBS. We seek to manage this risk through prudent asset selection, pre-acquisition due diligence, post-acquisition performance monitoring, and the sale of assets for which we identify negative credit trends. Additionally, we vary the percentage mix of our private-label and agency MBS investments in an effort to actively adjust our credit exposure and to improve the risk/return profile of our investment portfolio.
| · | Liquidity Risk |
Liquidity risk is the risk that we may be unable to meet our obligations as they come due because of our inability to liquidate assets or obtain funding. Liquidity risk also includes the risk of having to sell assets at a loss to generate liquid funds.
| · | Regulatory Risk |
Regulatory risk is the risk of loss, including fines, penalties or restrictions in our activities from failing to comply with current or future federal, state or local laws (including federal and state securities laws), and rules and regulations pertaining to financial services activities, including the loss of our exclusion from regulation as an investment company under the 1940 Act.
The principal instruments that we use to hedge a portion of our exposure to interest rate, prepayment and extension risks are interest rate derivative instruments, including interest rate swaps, interest rate swap futures, U.S. Treasury note futures, Eurodollar futures, and certain options on futures. Our hedging instruments are generally not designed to protect our net book value from "spread risk" (also referred to as "basis risk"), which is the risk of an increase of the market spread between the yield on our agency MBS and the benchmark yield on U.S. Treasury securities or interest rate swap rates. The inherent spread risk associated with our agency MBS and the resulting fluctuations in fair value of these securities can occur independent of interest rates and may relate to other factors impacting the mortgage and fixed income markets, such as actual or anticipated monetary policy actions by the U. S. Federal Reserve, liquidity, or changes in market participants’ required rates of return on different assets. Consequently, while we use interest rate derivative instruments to attempt to protect our net book value against moves in interest rates, such instruments typically will not protect our net book value against spread risk and, therefore, the value of our agency MBS and our net book value could decline.
In addition to the hedging instruments discussed above, we also manage our exposure to interest rate, prepayment and extension risk through asset selection. We generally seek to invest in agency MBS that are specifically selected for their relatively lower propensity for prepayment. The pools of residential mortgage loans securing these agency MBS are commonly referred to as “specified pools.” These specified pools may include mortgage loans that (i) are originated in certain states or geographic areas, (ii) are originated through the Home Affordable Refinance Program (“HARP”) or some other government program, (iii) have low loan balances, (iv) have high loan-to-value ratios, (v) are the obligations of borrowers with credit scores that fall toward the lower end of the range of GSEs’ underwriting standards, or (vi) are secured by investor properties. The borrowers of these mortgage loans are believed to have less incentive to refinance. Accordingly, agency MBS collateralized by mortgage loans with these characteristics are believed to be better “protected” from prepayment risk than agency MBS collateralized by more generic pools of mortgage loans. In general, agency MBS backed by specified pools trade at a price premium over generic agency TBA securities. As of December 31, 2015, our agency MBS portfolio is comprised primarily of securities backed by specified pools selected for their lower prepayment characteristics.
The risk management actions we take may lower our earnings and dividends in the short term to further our objective of maintaining attractive levels of earnings and dividends over the long term. In addition, some of our hedges are intended to provide protection against larger rate moves and, as a result, may be relatively ineffective for smaller changes in interest rates. There can be no certainty that our projections of our exposures to interest rate, prepayment, extension, credit or other risks will be accurate or that our hedging activities will be effective and, therefore, actual results could differ materially.
| 6 |
Competition
Our success depends, in large part, on our ability to acquire MBS at favorable spreads over our borrowing costs. In acquiring these assets, we compete with mortgage finance and specialty finance companies, savings and loan associations, banks, mortgage bankers, insurance companies, mutual funds, institutional investors, mortgage real estate investment trusts, investment banking firms, other lenders, the U.S. Treasury, Fannie Mae, Freddie Mac, other governmental bodies, and other entities. In addition, there are numerous entities with similar asset acquisition objectives and others may be organized in the future which may increase competition for the available supply of MBS that meet our investment objectives. Additionally, our investment strategy is dependent on the amount of financing available to us in the repurchase agreement market, which may also be impacted by competing borrowers. Our investment strategy will be adversely impacted if we are not able to secure financing on favorable terms, if at all. In addition, competition is intense for the recruitment and retention of qualified professionals. Our ability to continue to compete effectively in our businesses will depend upon our continued ability to attract new professionals and retain and motivate our existing professionals. For a further discussion of the competitive factors affecting our business, see “Item 1A — Risk Factors” in this Annual Report on Form 10-K.
Our Tax Status
Arlington Asset is subject to taxation as a corporation under Subchapter C of the Internal Revenue Code of 1986, as amended (the “Code”). The Company’s consolidated subsidiary, Rosslyn REIT Trust (“Rosslyn REIT”), operates to qualify as a real estate investment trust (“REIT”) under the Code. Arlington Asset owns all the common shares of Rosslyn REIT Trust and all of the preferred shares are owned by outside investors.
As of December 31, 2015, the Company had net operating loss (“NOL”) carry-forwards of $107 million that can be used to offset future taxable ordinary income. The Company’s NOL carry-forwards begin to expire in 2027. As of December 31, 2015, the Company had net capital loss (“NCL”) carry-forwards of $241 million that can be used to offset future capital gains. The scheduled expirations of the Company’s NCL carry-forwards are $137 million in 2019 and $104 million in 2020. The Company is subject to the federal alternative minimum tax (“AMT”) and state and local taxes on its taxable income and gains that are not offset by its NOL and NCL carry-forwards.
The Company’s ability to use its NOLs, NCLs and built-in losses would be limited if it experienced an “ownership change” under Section 382 of the Code. In general, an “ownership change” would occur if there is a cumulative change in the ownership of the Company’s common stock of more than 50% by one or more “5% shareholders” during a three-year period. The Board of Directors adopted and the Company’s shareholders approved a shareholder rights agreement (“Rights Plan”) in an effort to protect against a possible limitation on the Company’s ability to use its NOL carry-forwards, NCL carry-forwards, and built-in losses under Sections 382 and 383 of the Code. The Rights Plan was adopted to dissuade any person or group from acquiring 4.9% or more of the Company’s outstanding Class A common stock without the approval of the Board of Directors and triggering an “ownership change” as defined by Section 382.
Our Exclusion from Regulation as an Investment Company
We intend to operate so as to be excluded from regulation under the 1940 Act. We rely on Section 3(c)(5)(C) of the 1940 Act, which provides an exclusion for entities that are “primarily engaged in purchasing or otherwise acquiring . . . interests in real estate.” Section 3(c)(5)(C) as interpreted by the staff of the SEC provides an exclusion from registration for a company if at least 55% of its assets, on an unconsolidated basis, consist of qualified assets such as whole loans and whole pool agency certificates, and if at least 80% of its assets, on an unconsolidated basis, are real estate related assets. We will need to ensure not only that we qualify for an exclusion or exemption from regulation under the 1940 Act, but also that each of our subsidiaries qualifies for such an exclusion or exemption. We intend to maintain our exclusion by monitoring the value of our interests in our subsidiaries. We may not be successful in this regard.
| 7 |
If we fail to maintain our exclusion or secure a different exclusion or exemption if necessary, we may be required to register as an investment company, or we may be required to acquire or dispose of assets in order to meet our exemption. Any such asset acquisitions or dispositions may include assets that we would not acquire or dispose of in the ordinary course of business, may be at unfavorable prices and result in a decline in the price of our common stock. If we are required to register under the 1940 Act, we would become subject to substantial regulation with respect to our capital structure (including our ability to use leverage), management, operations, transactions with affiliated persons (as defined in the 1940 Act), and portfolio composition, including restrictions with respect to diversification and industry concentration and other matters. Accordingly, registration under the 1940 Act could limit our ability to follow our current investment and financing strategies and result in a decline in the price of our common stock.
Available Information
You may read and copy the definitive proxy materials and any other reports, statements or other information that we file with the SEC at the SEC’s public reference room at 100 F Street, N.E., Washington, DC 20549. You may call the SEC at 1-800-SEC-0330 for further information on the public reference room. Our SEC filings are also available to the public from commercial document retrieval services and at the internet website maintained by the SEC at http://www.sec.gov. These SEC filings may also be inspected at the offices of the New York Stock Exchange (NYSE), which is located at 20 Broad Street, New York, New York 10005.
Our website address is http://www.arlingtonasset.com. We make available free of charge through our website this Annual Report on Form 10-K, quarterly reports on Form 10-Q, current reports on Form 8-K and amendments to those reports filed or furnished pursuant to Section 13(a) or 15(d) of the Exchange Act, as well as the annual report to shareholders and Section 16 reports on Forms 3, 4 and 5 as soon as reasonably practicable after such documents are electronically filed with, or furnished to, the SEC. In addition, our Bylaws, Statement of Business Principles (our code of ethics), Corporate Governance Guidelines, and the charters of our Audit, Compensation, and Nominating and Governance Committees are available on our website and are available in print, without charge, to any shareholder upon written request in writing c/o our Secretary at 1001 Nineteenth Street North, Arlington, Virginia 22209. Information on our website should not be deemed to be a part of this report or incorporated into any other filings we make with the SEC.
Employees
As of December 31, 2015, we had 11 employees. Our employees are not subject to any collective bargaining agreement, and we believe that we have good relations with our employees.
| 8 |
Investing in our company involves various risks, including the risk that you might lose your entire investment. Our results of operations depend upon many factors including our ability to implement our business strategy, the availability of opportunities to acquire assets, the level and volatility of interest rates, the cost and availability of short- and long-term credit, financial market conditions and general economic conditions.
The following discussion concerns the material risks associated with our business. These risks are interrelated, and you should consider them as a whole. Additional risks and uncertainties not presently known to us may also materially and adversely affect the value of our capital stock and our ability to pay dividends to our shareholders. In connection with the forward-looking statements that appear in this Annual Report on Form 10-K, including these risk factors and elsewhere, you should carefully review the section entitled “Cautionary Statement About Forward-Looking Information.”
Risks Related to our Principal Investing Activities
Changes in interest rates and adverse market conditions could negatively affect the value of our MBS investments and increase the cost of our borrowings, which could result in reduced earnings or losses and negatively affect the cash available for distribution to our shareholders.
We acquire indirect interests in mortgage loans by purchasing MBS, and we currently intend to continue this strategy. Under a normal yield curve, an investment in MBS will decline in value if long-term interest rates increase. In addition, net interest income could decrease if the yield curve becomes inverted or flat. Fannie Mae or Freddie Mac guarantees of the agency MBS we own do not protect us from declines in market value caused by changes in interest rates. Declines in market value may ultimately reduce earnings or result in losses to us, which may negatively affect cash available for distribution to our shareholders.
A significant risk associated with our portfolio of mortgage-related assets is the risk that both long-term and short-term interest rates will increase significantly. If long-term rates were to increase significantly, the market value of these MBS would decline and the duration and weighted average life of these MBS would increase. We could realize a loss in the future if the MBS in our portfolio are sold. With respect to the other end of the yield curve, an increase in short-term interest rates would increase the financing costs on the repurchase agreements we enter into in order to finance the purchase of MBS, thereby decreasing net interest margin if all other factors remain constant.
Market values of MBS may decline without any general increase in interest rates for a number of reasons, such as increases in default of the mortgages underlying such MBS, increases in voluntary prepayments of the mortgages underlying such MBS and widening of credit spreads. If the market values of our investments were to decline for any reason, the value of your investment in our securities could also decline.
Hedging against interest rate exposure may not completely insulate us from interest rate risk and may adversely affect our earnings, which could adversely affect cash available for distribution to our shareholders.
We engage in certain hedging transactions to limit our exposure from the adverse effects of changes in interest rates on our short-term financing agreements and our net book value, and therefore may expose our company to the risks associated with such transactions. We have historically entered into and may enter into interest rate swap agreements, Eurodollar futures, interest rate swap futures, U.S. Treasury note futures, put options or pursue other hedging strategies. Our hedging activities are generally designed to limit certain exposures and not to eliminate them. Hedging against a decline in the values of our portfolio positions does not eliminate the possibility of fluctuations in the values of such positions or prevent losses if the values of such positions decline. Such hedging transactions may also limit the opportunity for gain if the values of the portfolio positions should increase. Moreover, it may not be possible to hedge against an interest rate fluctuation that is so generally anticipated that we are not able to enter into a hedging transaction at an acceptable price.
| 9 |
There are no perfect hedging strategies, and interest rate hedging may fail to protect us from loss. The success of our hedging transactions depends on our ability to accurately predict movements of interest rates and credit spreads. In addition, the degree of correlation between price movements of the instruments used in a hedging strategy and price movements in the portfolio positions being hedged may vary. Moreover, for a variety of reasons, we may not seek to establish a perfect correlation between such hedging instruments and the portfolio holdings being hedged. Any such imperfect correlation may prevent us from achieving the intended hedge and expose us to risk of loss. Furthermore, our hedging strategies may adversely affect us because hedging activities involve costs that we incur regardless of the effectiveness of the hedging activity, which may decrease our net interest margin. Our hedging activity will vary in scope based on the level and volatility of interest rates and principal prepayments, the amount of leverage, the type of MBS held, and other changing market conditions.
Interest rate hedging may fail to protect or could adversely affect us because, among other things:
| • | interest rate hedging can be expensive, particularly during periods of rising and volatile interest rates; |
| • | available interest rate hedging may not correspond directly with the interest rate risk for which protection is sought; |
| • | the duration of the hedge may not match the duration of the related asset or liability; |
| • | the credit quality of the party owing money on the hedge may be downgraded to such an extent that it impairs our ability to sell or assign our side of the hedging transaction; and |
| • | the party owing money in the hedging transaction may default on its obligation to pay. |
Our hedging activity may adversely affect our earnings and result in volatile fluctuations in the fair value of our hedges, net income and book value per share, which could adversely affect cash available for distribution to our shareholders and the value of your investment in our securities.
Our hedging strategies are generally not designed to mitigate spread risk.
When the market spread widens between the yield on our assets and benchmark interest rates, our net book value could decline if the value of our assets falls by more than the offsetting fair value increases on our hedging instruments tied to the underlying benchmark interest rates. We refer to this scenario as an example of “spread risk” or “basis risk.” The spread risk associated with our mortgage assets and the resulting fluctuations in fair value of these securities can occur independently of changes in benchmark interest rates and may relate to other factors impacting the mortgage and fixed income markets, such as actual or anticipated monetary policy actions by the Federal Reserve, market liquidity, or changes in required rates of return on different assets. Consequently, while we use interest rate swap agreements, Eurodollar futures, U.S. Treasury note futures, put options and interest rate swap futures and other supplemental hedges to attempt to protect against moves in interest rates, such instruments typically will not protect our net book value against spread risk, which could adversely affect our financial condition and results of operations.
Declines in the market values of our MBS portfolio may adversely affect our financial condition, results of operations, and market price of our Class A common stock or Senior Notes.
Our MBS investments are recorded at fair value with changes in fair value reported in either net income or other comprehensive income. As a result, a decline in the fair value of our investments would reduce our net income and book value per share. Fair values for our MBS investments can be volatile. The fair values can change rapidly and significantly and changes can result from various factors, including changes in interest rates, actual and perceived risk, supply, demand, expected prepayment rates, and actual and projected credit performance. Declines in the market values of our MBS portfolio would adversely affect our financial condition, results of operations, and market price of our Class A common stock or Senior Notes.
| 10 |
Our mortgage investing strategy involves leverage, which could adversely affect our operations and negatively affect cash available for distribution to our shareholders.
We may increase our investment exposure in MBS or other investment opportunities by funding a portion of those acquisitions with repurchase agreements or other borrowing arrangements. To the extent that revenue derived from such levered assets exceeds our interest expense, hedging expense and other costs of the financing, our net income will be greater than if we had not borrowed funds and had not invested in such assets on a leveraged basis. Conversely, if the revenue from our MBS does not sufficiently cover the interest expense, hedging expense and other costs of the financing, our net income will be less or our net loss will be greater than if we had not borrowed funds. Because of the credit and interest rate risks inherent in our strategy, we closely monitor the leverage of our MBS portfolio. From time to time, our leverage ratio may increase or decrease due to several factors, including changes in the value of the underlying portfolio holdings and the timing and amount of acquisitions.
An increase in our borrowing costs relative to the interest we receive on our assets may impair our profitability and thus our cash available for distribution to our shareholders.
As our repurchase agreements and other short-term borrowings mature, we must either enter into new borrowings or liquidate certain of our investments at times when we might not otherwise choose to do so. Lenders may also seek to use a maturity date as an opportune time to demand additional terms or increased collateral requirements that could be adverse to us and harm our operations. Due to the short-term nature of our repurchase agreements used to finance our MBS investments, our borrowing costs are particularly sensitive to changes in short-term interest rates. An increase in short-term interest rates when we seek new borrowings would reduce the spread between our returns on our assets and the cost of our borrowings. This would reduce the returns on our assets, which might reduce earnings and in turn cash available for distribution to our shareholders.
Differences in the stated maturity of our fixed-rate assets and short-term borrowings may adversely affect our profitability.
We rely primarily on short-term, variable rate borrowings to acquire fixed-rate securities with long-term maturities. The relationship between short-term and longer-term interest rates is often referred to as the “yield curve.” Ordinarily, short-term interest rates are lower than longer-term interest rates. If short-term interest rates rise disproportionately relative to longer-term interest rates, resulting in a “flattening” of the yield curve, our borrowing costs may increase more rapidly than the interest income earned on our assets. Because our investments generally bear interest at longer-term rates than we pay on our borrowings under our repurchase agreements, a flattening of the yield curve would tend to decrease our net interest income and the market value of our investment portfolio. Additionally, to the extent cash flows from investments that return scheduled and unscheduled principal are reinvested, the spread between the yields on the new investments and available borrowing rates may decline, which would likely decrease our net income. It is also possible that short-term interest rates may exceed longer-term interest rates (a yield curve “inversion”), in which event our borrowing costs may exceed our interest income, we could incur operating losses, and our ability to make distributions to our shareholders could be hindered.
Our lenders may require us to provide additional collateral, especially when the market values for our investments decline, which may restrict us from leveraging our assets as fully as desired, and reduce our liquidity, earnings and cash available for distribution to our shareholders.
We currently use repurchase agreements to finance our investments in MBS. Our repurchase agreements allow the lenders, to varying degrees, to determine a new market value of the collateral to reflect current market conditions. If the market value of the securities pledged or sold by us to a funding source declines in value, we may be required by the lender to provide additional collateral or pay down a portion of the funds advanced on minimal notice, which is known as a margin call. Posting additional collateral will reduce our liquidity and limit our ability to leverage our assets, which could adversely affect our business. Additionally, in order to satisfy a margin call, we may be required to liquidate assets at a disadvantageous time, which could cause us to incur further losses and adversely affect our results of operations and financial condition, and may impair our ability to make distributions to our shareholders. In the event we do not have sufficient liquidity to satisfy these margin calls, lending institutions can accelerate our indebtedness, increase our borrowing rates, liquidate our collateral and terminate our ability to borrow. Such a situation would likely result in a rapid deterioration of our financial condition and possibly necessitate a filing for protection under the bankruptcy code.
| 11 |
If we fail to maintain adequate financing through repurchase agreements or to renew or replace existing borrowings upon maturity, we will be limited in our ability to implement our principal investing activities, which will adversely affect our results of operations and may, in turn, negatively affect the market value of our Class A common stock or Senior Notes and our ability to make dividends to our shareholders.
We depend upon repurchase agreement financing to purchase our target assets and reach our target leverage ratio. We cannot assure you that sufficient repurchase agreement financing will be available to us in the future on terms that are acceptable to us. Investors and financial institutions that lend in the securities repurchase market have tightened lending standards and some have stopped lending entirely in the repurchase market in response to regulatory capital requirements imposed upon our lenders and the difficulties and changed economic conditions that have materially adversely affected the MBS market. Our lenders also may revise their eligibility requirements for the types of assets they are willing to finance or the terms of such financings based on, among other factors, the regulatory environment and their perceived risk. If we fail to obtain adequate funding or to renew or replace existing funding upon maturity, we will be limited in our ability to implement our business strategy, which will adversely affect our results of operations and may, in turn, negatively affect the market value of our Class A common stock or Senior Notes and our ability to make dividends to our shareholders.
Adoption of the Basel III standards and other proposed supplementary regulatory standards may negatively impact our access to financing or affect the terms of our future financing arrangements.
In response to various financial crises and the volatility of financial markets, the Basel Committee on Banking Supervision adopted the Third Basel Accord (“Basel III”), a global, voluntary framework to strengthen the regulation, supervision, and risk management of the banking sector focusing on bank capital adequacy, stress testing and market liquidity risk. U.S. regulators have elected to implement substantially all of the Basel III standards. Financial institutions will have until 2019 to fully comply with the Basel III standards, which could cause an increase in capital requirements for, and could place constraints on, the financial institutions from which we borrow.
In April 2014, U.S. regulators adopted rules requiring enhanced supplemental leverage ratio standards beginning in January 2018, which would impose capital requirements more stringent than those of the Basel III standards. These supplemental regulatory standards adopted by U.S. regulators may negatively impact our access to financing or affect the terms of our future financing arrangements.
New assets we acquire may not generate yields as attractive as yields on our current assets, resulting in a decline in our earnings over time.
We receive monthly cash flows consisting of principal and interest payments from many of our assets. Principal payments reduce the size of our current portfolio (i.e., reduce the amount of our long-term assets) and generate cash for us. We may also sell assets from time to time as part of our portfolio management and capital reallocation strategies. In order to maintain and grow our portfolio size and our earnings, we must reinvest in new assets a portion of the cash flows we receive from principal and interest payments and asset sales. New investment opportunities may not generate the same investment returns as our current investment portfolio. If the assets we acquire in the future earn lower returns than the assets we currently own, our reported earnings will likely decline over time as the older assets pay down, are called, or are sold.
Clearing facilities or exchanges upon which some of our hedging instruments are traded may increase margin requirements on our hedging instruments in the event of adverse economic developments.
Our hedging agreements typically require that we pledge collateral on such agreements. Our exchange-traded derivatives, such as Eurodollar futures, interest rate swap futures and U.S. Treasury note futures, are, in effect, settled on a daily basis by the exchange of cash variation margin. For our centrally cleared interest rate swaps, the clearing exchange has the sole discretion to determine the value of interest rate swaps and the value of the collateral required to secure such instruments. In the event of a margin call of our centrally cleared interest rate swaps, we must generally pledge additional collateral on the same business day. In response to events having or expected to have adverse economic consequences or which create market uncertainty, clearing facilities or exchanges upon which our hedging instruments are traded may require us to pledge additional collateral against our hedging instruments. In the event that future adverse economic developments or market uncertainty result in increased margin requirements for our hedging instruments, it could materially adversely affect our liquidity position, business, financial condition and results of operations.
| 12 |
The conservatorship of Fannie Mae and Freddie Mac and related efforts, along with any changes in laws and regulations affecting the relationship between Fannie Mae and Freddie Mac and the federal government, may adversely affect our business.
The agency MBS in which we invest depend on a steady stream of payments on the mortgages underlying the MBS. The interest and principal payments we receive on the agency MBS that we acquire are guaranteed by Fannie Mae or Freddie Mac. Fannie Mae and Freddie Mac are GSEs, but their guarantees are not backed by the full faith and credit of the U.S. government.
In response to the general market instability, and more specifically, the financial condition of Fannie Mae and Freddie Mac, the Housing and Economic Recovery Act of 2008 established the FHFA as the new regulator for Fannie Mae and Freddie Mac. In 2008, the FHFA placed Fannie Mae and Freddie Mac into conservatorship, which is a statutory process pursuant to which the FHFA operates Fannie Mae and Freddie Mac in an effort to stabilize the entities. The FHFA, together with the U.S. Treasury and the U.S. Federal Reserve, has also undertaken actions designed to boost investor confidence in Fannie Mae and Freddie Mac, support the availability of mortgage financing and protect taxpayers. As part of these actions, the U.S. Treasury has agreed to support the continuing operations of Fannie Mae and Freddie Mac with any necessary capital contributions while in conservatorship. Although the U.S. Treasury has committed to support the positive net worth of Fannie Mae and Freddie Mac, the two GSEs could default on their guarantee obligations, which would materially and adversely affect the value of our agency MBS.
Shortly after Fannie Mae and Freddie Mac were placed in federal conservatorship, the Secretary of the U.S. Treasury, in announcing the actions, noted that the guarantee structure of Fannie Mae and Freddie Mac required examination and that change in the structures of the entities were necessary to reduce risk to the financial system. The future roles of Fannie Mae and Freddie Mac could be significantly reduced and the nature of their guarantees could be eliminated or considerably limited relative to historical measurements. Any changes to the nature of the guarantees provided by Fannie Mae and Freddie Mac could redefine what constitutes agency MBS, have broad adverse market implications and negatively impact us.
Based on various legislative proposals, significant differences in views appear to exist within Congress regarding housing finance reform. It is unclear which, if any, of these proposals will be enacted, when, if ever, they will be enacted, and, if any are enacted, what the effects would be. It is possible that the 2016 election may result in meaningful housing finance debate and reform to occur, while it is also possible that the status quo will prevail for some time to come.
In September 2015, the FHFA issued a progress report on the initiatives outlined in the Strategic Plan for the Enterprise Conservatorships detailing important progress toward the building of a new secondary mortgage market infrastructure. According to the progress report, Fannie Mae and Freddie Mac have made some progress in developing the common securitization infrastructure (“CSP”). The FHFA has also established an independent corporate entity, Common Securitization Solutions, LLC, that will develop, build, own, and operate the CSP. While some progress has been made in developing the CSP, the project faces considerable challenges that could undermine its prospects for success, including: (i) the difficulties inherent in developing a large-scale information technology system and (ii) the risks involved with preparing Fannie Mae and Freddie Mac to integrate with the CSP, including modifying internal financial and information systems. If such initiatives are achieved, it is unclear what the effects might be.
Legislation has changed the relationship between Fannie Mae and Freddie Mac and the U.S. government and requires Fannie Mae and Freddie Mac to reduce the amount of mortgage loans they own or the amount of agency MBS for which they provide guarantees. The passage of any additional new legislation affecting Fannie Mae and Freddie Mac may create market uncertainty and reduce the actual or perceived credit quality of securities issued or guaranteed by the U.S. government through a new or existing successor entity to Fannie Mae and Freddie Mac. If the charters of Fannie Mae and Freddie Mac were revoked, it is unclear what effect, if any, this would have on the value of the existing Fannie Mae and Freddie Mac agency MBS. It is also possible that the above-referenced proposed legislation, if made law, could adversely impact the market for securities issued or guaranteed by the U.S. government and the spreads at which they trade. The foregoing could materially adversely affect the pricing, supply, liquidity and value of our target assets and otherwise materially adversely affect our business, operations and financial condition.
| 13 |
If Fannie Mae or Freddie Mac were eliminated, or their structures were to change radically, we may not be able to acquire agency MBS from these companies, which could drastically reduce the amount and type of agency MBS available for investment, thereby increasing the price of these assets. Additionally, the current credit support provided by the U.S. Treasury to Fannie Mae and Freddie Mac, and any additional credit support it may provide in the future, could have the effect of lowering the interest rate we receive from agency MBS, thereby tightening the spread between the interest we earn on our portfolio and our financing costs. Additionally, the U.S. government could elect to stop providing credit support of any kind to the mortgage market. If any of these events were to occur, our business, financial condition and results of operations and our ability to pay distributions to our shareholders could be materially adversely affected.
To the extent that we invest in agency MBS that are guaranteed by Fannie Mae and Freddie Mac, we are subject to the risk that these GSEs may not be fully able to satisfy their guarantee obligations or that these guarantee obligations may be repudiated, which would adversely affect the value of our investment portfolio and our ability to sell or finance these securities.
All of the agency MBS in which we invest depend on a steady stream of payments on the mortgages underlying the MBS. The interest and principal payments we receive on agency MBS issued by Fannie Mae or Freddie Mac are guaranteed by these GSEs, but are not guaranteed by the U.S. government. To the extent these GSEs are not able to fully satisfy their guarantee obligations or that these guarantee obligations are repudiated or otherwise defaulted upon, the value of our investment portfolio and our ability to sell or finance these securities would be adversely affected.
Market conditions and actions by governmental authorities may disrupt the historical relationship between interest rate changes and prepayment trends, which would make it more difficult for us to analyze our investment portfolio.
Our success depends on our ability to analyze the relationship of changing interest rates on prepayments of the mortgage loans that underlie our MBS. Changes in interest rates and prepayments affect the market price of MBS that we intend to purchase and any MBS that we hold at a given time. As part of our overall portfolio risk management, we analyze interest rate changes and prepayment trends separately and collectively to assess their effects on our investment portfolio. In conducting our analysis, we depend on certain assumptions based upon historical trends with respect to the relationship between interest rates and prepayments under normal market conditions. If recent or future government actions or other developments change the way that prepayment trends have historically responded to interest rate changes, our ability to (i) assess the market value of our investment portfolio, (ii) implement our hedging strategies and (iii) implement techniques to reduce our prepayment rate volatility would be significantly affected. If we are unable to accurately forecast interest and prepayment rates, our financial position and results of operations could be materially adversely affected.
An increase in prepayment rates could negatively affect the value of our MBS purchased at a premium, which could result in reduced earnings or losses and negatively affect the cash available for distribution to our shareholders.
Our investment portfolio includes securities backed by pools of residential mortgage loans. For securities backed by pools of residential mortgage loans, we receive income, generally, from the payments that are made by the borrowers under underlying mortgage loans. We may purchase securities that have a higher interest rate than the then-prevailing market interest rate. In exchange for this higher interest rate, we may pay a premium to par value to acquire such securities. Homeowners tend to prepay mortgage loans more quickly when interest rates decline. Prepayments are generally reflected as a reduction of the premium over par value, which means that prepayments may result in recognition of loss of asset value for us. Also, when borrowers prepay their mortgage loans at rates that are faster or slower than expected, it results in amortizations that are faster or slower than anticipated on our assets, which may result in overall lower returns on our investments than originally expected.
| 14 |
Although prepayment rates generally increase when interest rates fall and decrease when interest rates rise, changes in prepayment rates are difficult to predict. Prepayments can also occur when borrowers sell the property and use the sale proceeds to prepay the mortgage as part of a physical relocation or when borrowers default on their mortgages and the mortgages are prepaid from the proceeds of a foreclosure sale of the property. Fannie Mae and Freddie Mac will generally, among other conditions, purchase mortgages that are 120 days or more delinquent from holders of such mortgages when the cost of guarantee payments to such holders, including advances of interest at the loan coupon rate, exceeds the cost of holding the nonperforming loans in their portfolios. Consequently, prepayment rates also may be affected by conditions in the housing and financial markets, which may result in increased delinquencies on mortgage loans, the GSEs’ cost of capital, general economic conditions and the relative interest rates on fixed and adjustable rate loans, which could lead to an acceleration of the payment of the related principal. Furthermore, changes in the GSEs’ policies regarding the repurchase of delinquent loans can materially impact prepayment rates. In addition, the introduction of new government programs could increase the availability of mortgage credit to a large number of homeowners in the United States, which could impact the prepayment rates for the entire MBS market, and in particular for agency MBS. Any new programs or changes to existing programs could cause substantial uncertainty around the magnitude of changes in prepayment speeds.
Moreover, if prepayment rates decrease due to a rising interest rate environment, the average life or duration of our fixed-rate assets will generally be extended. This could have a negative impact on our results from operations, as the maturities of our interest rate hedges are fixed and will, therefore, cover a smaller percentage of our funding exposure on our MBS assets to the extent that the average lives of the mortgages underlying such MBS increase due to slower prepayments.
Accordingly, faster or slower than expected payments may affect our ability to maintain targeted amounts of leverage and may adversely affect our profitability and cash available for distribution to our shareholders.
Mortgage loan modification programs, future legislative action and changes in the requirements necessary to qualify for refinancing a mortgage with Fannie Mae, Freddie Mac or Ginnie Mae may adversely affect the value of, and the returns on, the MBS in which we invest.
Over the last few years, the U.S. government, through the Federal Housing Administration (“FHA”), the U.S. Treasury and the Federal Deposit Insurance Corporation (“FDIC”), has implemented a variety of programs designed to provide homeowners with assistance in avoiding residential mortgage loan foreclosures, which allows certain distressed borrowers to refinance their mortgages into FHA-insured loans. In addition, Fannie Mae and Freddie Mac instituted programs designed to assist distressed homeowners avoid foreclosure. These and any future programs may involve, among other things, the modification of mortgage loans to reduce the principal amount of the loans or the rate of interest payable on the loans, or to extend the payment terms of the loans.
It is likely that loan modifications would result in increased prepayments on agency MBS. See “Risks to our Business — An increase in prepayment rates could negatively affect the value of our MBS purchased at a premium, which could result in reduced earnings or losses and negatively affect the cash available for distribution to our shareholders” for information relating to the impact of prepayments on our business. These initiatives, any loan modification programs and future legislative or regulatory actions, including amendments to the bankruptcy laws, that result in the modification of outstanding mortgage loans, as well as changes in the requirements necessary to qualify for refinancing a mortgage with Fannie Mae, Freddie Mac or Ginnie Mae, may adversely affect the value of, and the returns on, our MBS.
| 15 |
Our use of repurchase agreements may give our lenders greater rights in the event that either we or any of our lenders file for bankruptcy, which may make it difficult for us to recover our collateral.
Our borrowings under repurchase agreements may qualify for special treatment under the bankruptcy code, giving our lenders the ability to avoid the automatic stay provisions of the bankruptcy code and take possession of and liquidate our collateral under the repurchase agreements without delay if we file for bankruptcy. Furthermore, the special treatment of repurchase agreements under the bankruptcy code may make it difficult for us to recover our pledged assets in the event that any of our lenders file for bankruptcy. Thus, the use of repurchase agreements exposes our pledged assets to risk in the event of a bankruptcy filing by either our lenders or us. In addition, if the lender is a broker or dealer subject to the Securities Investor Protection Act of 1970 or an insured depository institution subject to the Federal Deposit Insurance Act, our ability to exercise our rights to recover our investment under a repurchase agreement or to be compensated for any damages resulting from the lender’s insolvency may be further limited by those statutes.
If the lending institution under one or more of our repurchase agreements defaults on its obligation to resell the underlying security back to us at the end of the agreement term, we will lose money on our repurchase transactions.
When we engage in a repurchase transaction, we initially sell securities to the transaction counterparty under a master repurchase agreement in exchange for cash from the counterparty. The counterparty is obligated to resell the same securities back to us at the end of the term of the repurchase agreement, which typically is 30 to 90 days, but may have terms from one day to up to three years or more. The cash we receive when we initially sell the collateral is less than the value of the collateral, which is referred to as the “haircut.” If the counterparty in a repurchase transaction defaults on its obligation to resell the securities back to us, we will incur a loss on the transaction equal to the amount of the haircut (assuming no change in the value of the securities). Losses incurred on our repurchase transactions would adversely affect our earnings and our cash available for distribution to our shareholders.
If we default on our obligations under our repurchase agreements, we may be unable to establish a suitable replacement facility on acceptable terms or at all.
If we default on one of our obligations under a repurchase agreement, the counterparty may terminate the agreement and cease entering into any other repurchase agreements with us. In that case, we would likely need to establish a replacement repurchase facility with another financial institution in order to continue to leverage the assets in our investment portfolio and to carry out our investment strategy. We may be unable to establish a suitable replacement repurchase facility on acceptable terms or at all.
Despite current indebtedness levels, we may still be able to incur substantially more debt, which could have important consequences to you.
As of December 31, 2015, we had total unsecured indebtedness (excluding payables, derivative liabilities and recourse liability) of $75.3 million, which includes $25 million in principal amount of our 6.625% Notes, $35.3 million in principal amount of our 6.75% Notes, and $15 million in principal amount of subordinated unsecured long-term debentures due between 2033 and 2035. Our level of indebtedness could have important consequences to you, because:
| • | it could affect our ability to satisfy our financial obligations; |
| • | a substantial portion of our cash flows from operations will have to be dedicated to interest and principal payments and may not be available for operations, expansion, acquisitions or general corporate or other purposes; |
| • | it may impair our ability to obtain additional debt or equity financing in the future; |
| • | it may limit our ability to refinance all or a portion of our indebtedness on or before maturity; |
| • | it may limit our flexibility in planning for, or reacting to, changes in our business and industry; and |
| • | it may make us more vulnerable to downturns in our business, our industry or the economy in general. |
| 16 |
Our operations may not generate sufficient cash to enable us to service our debt. If we fail to make payment on the Senior Notes, we could default on the Senior Notes.
Limitations on our access to capital could impair our liquidity and our ability to conduct our business.
Liquidity, or ready access to funds, is essential to our business. Failures of similar businesses have often been attributable in large part to insufficient liquidity. Liquidity is of particular importance to our business and perceived liquidity issues may affect our counterparties’ willingness to engage in transactions with us. Our liquidity could be impaired due to circumstances that we may be unable to control, such as a general market disruption, the payment of significant legal defense and indemnification costs, expenses, damages or settlement amounts, or an operational problem that affects us or third parties. Further, our ability to sell assets may be impaired if other market participants are seeking to sell similar assets at the same time or the market is experiencing significant volatility. Our inability to maintain adequate liquidity would materially harm our business and operations.
Our investments may include subordinated tranches of private-label MBS, which are subordinate in right of payment to more senior securities.
Our investments may include subordinated tranches of private-label MBS, which are subordinated classes of securities in a structure of securities collateralized by a pool of mortgage loans and, accordingly, are the first or among the first classes of securities in such a structure to bear the loss upon a restructuring or liquidation of the underlying collateral and the last to receive payment of interest and principal. Furthermore, our private-label MBS may also consist of subordinate classes of re-securitized senior class MBS. Estimated fair values of these subordinated interests tend to be more sensitive to changes in economic conditions than more senior securities. As a result, such subordinated interests generally are not actively traded and may not provide holders thereof with liquid investments.
Investments in non-investment grade private-label MBS may be illiquid, may have a higher risk of default and may not produce current returns.
We may invest in private-label MBS that are non-investment grade, which means that major rating agencies rate them below the top four investment-grade rating categories (i.e., “AAA” through “BBB”). Non-investment grade, private-label MBS tend to be less liquid, may have a higher risk of default and may be more difficult to value than investment grade bonds. Recessions or poor economic or pricing conditions in the markets associated with private-label MBS may cause defaults or losses on loans underlying such securities. Non-investment grade securities are considered speculative, and their capacity to pay principal and interest in accordance with the terms of their governing indentures is not certain.
Our investment portfolio may be concentrated in terms of credit risk.
Although as a general policy we seek to acquire and hold a diverse portfolio of investments, we are not required to observe specific diversification criteria, except as may be set forth in any investment guidelines that may be adopted by our Board of Directors from time to time. Therefore, our investment portfolio may at times be concentrated in certain asset types that are subject to higher risk of foreclosure or secured by properties concentrated in a limited number of geographic locations. To the extent that our portfolio is concentrated in any one region or type of asset, downturns relating generally to such region or type of asset may result in defaults on a number of our assets within a short time period, which may reduce our net asset value, our net income, the value of our securities and our ability to pay dividends to our stockholders. Our portfolio may contain other concentrations of risk, and we may fail to identify, detect or hedge against those risks, resulting in large or unexpected losses.
| 17 |
Our due diligence of potential investments may not reveal all of the liabilities associated with those investments and may not reveal aspects of the investments which could lead to investment losses.
Before making certain investments, we may undertake due diligence efforts with respect to various aspects of the acquisition, including investigating the strengths and weaknesses of the originator or issuer of the asset and, in the case of acquisitions of private-label MBS, verifying certain aspects of the underlying assets themselves as well as other factors and characteristics that may be material to the performance of the investment. In making the assessment and otherwise conducting due diligence, we rely on resources available to us and, in some cases, third party information. There can be no assurance that any due diligence process that we conduct will uncover relevant facts that could be determinative of whether or not an investment will be successful.
We may invest in non-prime mortgage loans or investments collateralized by non-prime mortgage loans, which are subject to increased risks.
We may invest in non-prime mortgage loans or investments collateralized by pools of non-prime mortgage loans. In general, non-prime mortgage loans are loans that have been originated using underwriting standards that do not conform to the underwriting guidelines of Fannie Mae or Freddie Mac. Non-prime mortgage loans may allow borrowers to qualify for a mortgage loan with reduced or alternative forms of documentation. They are typically characterized by borrowers with less than full documentation, lower credit scores and higher loan-to-value ratios and include a higher percentage of investment properties.
Non-prime mortgage loans may experience delinquency, foreclosure, bankruptcy and loss rates that are higher, and that may be substantially higher, than those experienced by mortgage loans underwritten in a more traditional manner. Thus, because of the higher delinquency rates and losses associated with non-prime mortgage loans, the performance of non-prime mortgage loans or investments backed by non-prime mortgage loans in which we may invest could be correspondingly adversely affected, which could adversely impact our results of operations, financial condition and business.
The securities and loans we own are likely to lead to variable returns.
We actively manage the risks associated with acquiring, holding and disposing of MBS. No amount of risk management or mitigation, however, can change the variable nature of the cash flows, fair values of, and financial results generated by these loans and securities. Changes in the credit performance or the prepayments on the loans underlying private-label MBS and changes in interest rates impact the cash flows on these securities, and the impact could be significant for our securities with concentrated risks. Changes in cash flows lead to changes in our return and also to potential variability in reported income.
The revenue recognized on our private-label MBS is based on an estimate of the yield over the remaining life of the asset. Thus, changes in our estimates of expected cash flow from an asset will result in changes in our reported earnings on that asset on a prospective basis. We may be forced to recognize adverse changes in expected future cash flows as a reduction of current income, further adding to earnings volatility.
Our investments are recorded at fair value based upon assumptions that are inherently subjective, and our results of operations and financial condition could be adversely affected if our determinations regarding the fair value of our investments are materially higher than the values that we ultimately realize upon their disposal.
We measure the fair value of our investments quarterly, in accordance with guidance set forth in FASB Accounting Standards Codification (“ASC”) Topic 820, Fair Value Measurements and Disclosures. Ultimate realization of the value of an asset depends to a great extent on economic and other conditions that are beyond our control. Further, fair value is only an estimate based on good faith judgment of the price at which an investment can be sold because market prices of investments can only be determined by negotiation between a willing buyer and seller. If we were to liquidate a particular asset, the realized value may be more than or less than the amount at which such asset is valued. Accordingly, the value of our Class A common stock and Senior Notes could be adversely affected by our determinations regarding the fair value of our investments, whether in the applicable period or in the future. Additionally, such valuations may fluctuate over short periods of time.
| 18 |
Our determination of the fair value of our agency MBS is based on price estimates provided by third-party pricing services. In general, pricing services heavily disclaim their valuations. Depending on the complexity and illiquidity of a security, valuations of the same security can vary substantially from one pricing service to another. Our private-label MBS trade infrequently and may be considered illiquid. Our determination of the fair value of our private-label MBS is based on significant unobservable inputs based on various assumptions made by management of the Company. These significant unobservable inputs may include assumptions regarding future interest rates, prepayment rates, discount rates, credit loss rates, and the timing of credit losses. These assumptions are inherently subjective and involve a high degree of management judgment, and our determinations of fair value may differ materially from the values that would have been used if a public market for these securities existed. Therefore, our results of operations for a given period could be adversely affected if our determinations regarding the fair market value of these investments are materially different than the values that we ultimately realize upon their disposal.
Beginning in fiscal year 2016, the Company intends to change its accounting policy for recognizing interest income on investments in agency MBS classified as trading securities. This change may have a material effect on the Company’s historical and future reported periodic net interest income.
Beginning in fiscal year 2016, the Company intends to change its accounting policy for recognizing interest income on its investments in agency MBS classified as trading securities by amortizing purchase premiums (or accreting purchase discounts) as an adjustment to interest income in accordance with the “interest method” permitted by GAAP. The change in accounting policy will be retrospectively applied to all historical periods. Because the Company accounts for investments in trading agency MBS on its consolidated balance sheets at fair value with all periodic changes in fair value reflected in the Company’s net income, this change in accounting policy will not have an effect on the Company’s historical or future consolidated balance sheets nor will it have an effect on the Company’s historical or future reported net income or comprehensive income. The change in accounting policy will, however, result in a reclassification between reported “investment gains (losses), net” and interest income on the Company’s historical and future periodic consolidated statements of comprehensive income. As the Company’s agency MBS have generally been acquired at a premium to par value, historical and future reported periodic interest income will be reduced by periodic premium amortization, while periodic investment gains (losses) reported as a component of “investment gain (loss), net” will be increased (decreased) by an equal and offsetting amount. While this change in financial reporting is not indicative of a change in the underlying economics of the Company’s business or results of operations, a reduction in the Company’s reported periodic net interest income may, nonetheless, adversely affect market participants’ perception of our results of operations and, in turn, adversely affect the market value of our Class A common stock and Senior Notes.
Credit ratings assigned to investment debt securities by the credit rating agencies may not accurately reflect the risks associated with those securities.
We make certain investment decisions after factoring in a series of data, including credit ratings assigned by credit rating agencies. However, a credit rating may not accurately reflect the risks associated with a particular debt security, such as private-label MBS. Rating agencies rate certain debt securities based upon their assessment of the safety of the receipt of principal and interest payments. Rating agencies do not consider the risks of fluctuations in fair value or other factors that may influence the value of debt securities and, therefore, the assigned credit rating may not fully reflect the true risks of an investment. Also, rating agencies may fail to make timely adjustments to credit ratings based on available data or changes in economic outlook or may otherwise fail to make changes in credit ratings in response to subsequent events, such that our investments may be of higher or lower credit risk than the ratings indicate. A downgrade in credit rating can materially adversely affect the fair value of a rated security. Our assessment of the quality of a potential investment that relies, in part, on that security’s credit rating may prove to be inaccurate, and we may incur credit losses in excess of our initial expectations.
Furthermore, credit rating agencies may change their methods of evaluating credit risk and determining ratings on MBS. These changes may occur quickly and often. The market’s ability to understand and absorb these changes, and the impact to the securitization market in general, are difficult to predict. Such changes will have an impact on the amount of investment-grade and non-investment-grade securities that are created or placed on the market in the future. A change in the amount of investment-grade and non-investment-grade securities that are created or placed in the market could materially adversely impact the value of the MBS in our portfolio and potentially limit or increase the value of MBS available for purchase in the future.
| 19 |
Credit ratings may not reflect all risks, are not recommendations to buy or hold the Senior Notes or our other senior unsecured debt that we may issue from time to time, and may be subject to revision, suspension or withdrawal at any time.
One or more independent credit rating agencies may assign and maintain credit ratings to our Senior Notes and other indebtedness that we may offer from time to time. The credit ratings reflect rating agencies’ assessment of our ability to perform our obligations under the Senior Notes, including an assessment of credit risks in determining the likelihood that payments will be made when due under such debt. The ratings may not reflect the potential impact of all risks related to the structure, market, risk and other factors relating to, and that may affect the value of, such securities. A credit rating is not a recommendation to buy, sell or hold securities and may be subject to revision, suspension or withdrawal by the rating agency at any time. Ratings do not reflect market prices or suitability of a security for a particular investor. No assurance can be given that a credit rating will remain constant for any given period of time or that a credit rating will not be lowered or withdrawn entirely by the credit rating agency if, in its judgment, circumstances in the future so warrant. A suspension, reduction or withdrawal at any time of the credit rating assigned to the Senior Notes by one or more of the credit rating agencies may adversely affect the cost and terms and conditions of our financings and could adversely affect the value and trading of the Senior Notes, as well as other of our senior unsecured debt that we may issue from time to time.
We may change our investment strategy, hedging strategy, asset allocation and operational policies without shareholder consent, which may result in riskier investments and adversely affect the market value of our Class A common stock and Senior Notes and our ability to make distributions to our shareholders.
We may change our investment strategy, hedging strategy, asset allocation and operational policies at any time without the consent of our shareholders, which could result in our making investment or hedge decisions that are different from, and possibly riskier than, the investments and hedges described in this Annual Report on Form 10-K. A change in our investment or hedging strategy may increase our exposure to interest rate and real estate market fluctuations. A change in our asset allocation could result in us making investments in securities, assets or business different from those described in this Annual Report on Form 10-K. Our Board of Directors oversees our operational policies, including those with respect to our acquisitions, growth, operations, indebtedness, capitalization and distributions or approves transactions that deviate from these policies without a vote of, or notice to, our shareholders. Operational policy changes could adversely affect the market value of our Class A common stock or Senior Notes and our ability to make distributions to our shareholders. Investing in assets other than MBS or pursuing business activities other than investing in MBS may not be successful and could adversely affect our results of operations and the market value of our Class A common stock or Senior Notes.
Our Board of Directors does not approve each of our investment decisions.
Our Board of Directors oversees our operational policies and periodically reviews our investment guidelines and our investment portfolio. However, our Board of Directors does not review all of our proposed investments. In addition, in conducting periodic reviews, our Board of Directors may rely primarily on information provided to them by our management. Furthermore, transactions entered into or structured for us by our management may be difficult or impossible to unwind by the time they are reviewed by our directors.
We operate in a highly-competitive market for investment opportunities, which could make it difficult for us to purchase or originate investments at attractive yields and thus have an adverse effect on our business, results of operations and financial condition.
We gain access to investment opportunities only to the extent that they become known to us. Gaining access to investment opportunities is highly competitive. Many of our competitors are substantially larger than us and have considerably greater financial, technical and marketing resources, more long-standing relationships, broader product offerings and other advantages. Some of our competitors may have a lower cost of funds and access to funding sources that are not available to us. The Federal Reserve’s continuing reinvestment of principal and interest payments on the MBS held in its portfolio may result in increased competition for attractive opportunities in our target investments. As a result of this competition, we may not be able to purchase or originate our target investments at attractive yields, which could have an adverse effect on our business, results of operations and financial condition.
| 20 |
Risks Related to our Business and Structure
Our Rights Plan could inhibit a change in our control.
We have a Rights Plan designed to protect against a possible limitation on our ability to use our NOLs, NCLs and built-in losses by dissuading investors from aggregating ownership of our Class A common stock and triggering an “ownership change” for purposes of Sections 382 and 383 of the Code. Under the terms of the Rights Plan, in general, if a person or group acquires or commences a tender or exchange offer for beneficial ownership of 4.9% or more of the outstanding shares of our Class A common stock upon a determination by our Board of Directors (an “Acquiring Person”), all of our other Class A and Class B common shareholders will have the right to purchase securities from us at a discount to such securities’ fair market value, thus causing substantial dilution to the Acquiring Person. The Rights Plan may have the effect of inhibiting or impeding a change in control not approved by our Board of Directors and, notwithstanding its purpose, could adversely affect our shareholders’ ability to realize a premium over the then-prevailing market price for our common stock in connection with such a transaction. In addition, because our Board of Directors can prevent the Rights Plan from operating, in the event our Board of Directors approves of an Acquiring Person, the Rights Plan gives our Board of Directors significant discretion over whether a potential acquirer’s efforts to acquire a large interest in us will be successful. Consequently, the Rights Plan could impede transactions that would otherwise benefit our shareholders.
The trading price of our Class A common stock or Senior Notes may be adversely affected by factors outside of our control.
Any negative changes in the public’s perception of the prospects for our business or the types of assets in which we invest could depress our stock price regardless of our results. The following factors, among others, could contribute to the volatility of the price of our Class A common stock or Senior Notes:
| • | actual or unanticipated variations in our quarterly results; |
| • | changes in our financial estimates by securities analysts; |
| • | conditions or trends affecting companies that make investments similar to ours; |
| • | changes in interest rate environments and the mortgage market that cause our borrowing costs to increase, our reported yields on our MBS portfolio to decrease or that cause the value of our MBS portfolio to decrease; |
| • | changes in the market valuations of the securities in our MBS portfolio and other principal investments; |
| • | negative changes in the public’s perception of the prospects of investment or financial services companies; |
| • | changes in the regulatory environment in which our business operates; |
| • | dilution resulting from new equity issuances; |
| • | general economic conditions such as a recession, or interest rate or currency rate fluctuations; and |
| • | additions or departures of our key personnel. |
Many of these factors are beyond our control.
| 21 |
We may experience significant fluctuations in quarterly operating results.
Our revenues and operating results may fluctuate from quarter to quarter and from year to year due to a combination of factors, many of which are beyond our control, including the market value of the MBS we acquire, the performance of our hedging instruments, prepayment rates and changes in interest rates. As a result, we may fail to meet profitability or dividend expectations, which could negatively affect the market price of our Class A common stock and our ability to pay dividends to our shareholders.
We cannot assure you that we will pay dividends in the future.
Pursuant to our variable dividend policy, our Board of Directors evaluates dividends on a quarterly basis and, in its sole discretion, approves the payment of dividends. Our dividend policy differs from many of our competitors who qualify as REITs that must distribute to their shareholders at least 90% of their REIT taxable income each taxable year. There can be no assurances that our Board of Directors will continue to approve the payment of future dividends at the current levels, if any at all.
Litigation involving our company could result in significant legal expenses and have a material adverse effect on our business, financial condition, results of operations and cash flows.
As described under “Item 3 — Legal Proceedings” in this Annual Report on Form 10-K, we may in the future become subject to litigation. Such litigation may result in significant defense costs and potentially significant judgments against us, some of which are not, or cannot be, insured against. We cannot predict the ultimate outcome of any litigation, and cannot estimate the likelihood or potential dollar amount of any adverse results. We may be unable to accurately estimate our exposure to litigation risk when we record balance sheet reserves for probable loss contingencies. As a result, any reserves we establish to cover any settlements or judgments, if any, may not be sufficient to cover our actual financial exposure, which may have a material impact on our results of operations or financial condition. In the event of an adverse judgment in any action or proceeding, we may be required to pay damages or penalties, or other remedies may be imposed upon us, which could have a material adverse impact upon our financial position, results of operations and cash flows and could also cause us significant reputational harm, which in turn could seriously harm our business and prospects.
Indemnification obligations to certain of our current and former directors and officers may increase the costs to us of legal proceedings involving our company.
Our charter contains a provision that limits the liability of our directors and officers to us and our shareholders for money damages, except for liability resulting from willful misconduct or a knowing violation of the criminal law or any federal or state securities law. Our charter also requires us to indemnify our directors and officers in connection with any liability incurred by them in connection with any action or proceeding (including any action by us or in our right) to which they are or may be made a party by reason of their service in those or other capacities if the conduct in question was in our best interests and the person was acting on our behalf or performing services for us, unless the person engaged in willful misconduct or a knowing violation of the criminal law. The Virginia Stock Corporation Act requires a Virginia corporation (unless its charter provides otherwise, which our charter does not) to indemnify a director or officer who has been successful, on the merits or otherwise, in the defense of any proceeding to which he is made a party by reason of his service in that capacity.
In addition, we have entered into indemnification agreements with certain of our current and former directors and officers under which we are generally required to indemnify them against liability incurred by them in connection with any action or proceeding to which they are or may be made a party by reason of their service in those or other capacities, if the conduct in question was in our best interests and the person was conducting themselves in good faith (subject to certain exceptions, including liabilities arising from willful misconduct, a knowing violation of the criminal law or receipt of an improper benefit).
In the future we may be the subject of indemnification assertions under our charter, Virginia law or these indemnification agreements by our current and former directors and officers who are or may become party to any action or proceeding. We maintain directors’ and officers’ insurance policies that may limit our exposure and enable us to recover a portion of any amounts paid with respect to such obligations. However, if our coverage under these policies is reduced, denied, eliminated or otherwise not available to us, our potential financial exposure would be increased. The maximum potential amount of future payments we could be required to make under these indemnification obligations could be significant. Amounts paid pursuant to our indemnification obligations could adversely affect our financial results and the amount of cash available for distribution to our shareholders.
| 22 |
Loss of our exclusion from regulation as an investment company under the 1940 Act would adversely affect us and may reduce the market price of our shares.
We rely on Section 3(c)(5)(C) of the 1940 Act for our exclusion from the registration requirements of the 1940 Act. This provision requires that 55% of our assets, on an unconsolidated basis, consist of qualifying assets, such as agency whole pool certificates, and 80% of our assets, on an unconsolidated basis, consist of qualifying assets or real estate-related assets. We will need to ensure not only that we qualify for an exclusion or exemption from regulation under the 1940 Act, but also that each of our subsidiaries qualifies for such an exclusion or exemption. We intend to maintain our exclusion by monitoring the value of our interests in our subsidiaries. We may not be successful in this regard.
If we fail to maintain our exclusion and another exclusion or exemption is not available, we may be required to register as an investment company, or we may be required to acquire or dispose of assets in order to meet our exemption. Any such asset acquisitions or dispositions may include assets that we would not acquire or dispose of in the ordinary course of business, may be at unfavorable prices and result in a decline in the price of our Class A common stock or Senior Notes. If we are required to register under the 1940 Act, we would become subject to substantial regulation with respect to our capital structure (including our ability to use leverage), management, operations, transactions with affiliated persons (as defined in the 1940 Act), and portfolio composition, including restrictions with respect to diversification and industry concentration and other matters. Accordingly, registration under the 1940 Act could limit our ability to follow our current investment and financing strategies and result in a decline in the price of our Class A common stock or Senior Notes.
Failure to obtain and maintain an exemption from being regulated as a commodity pool operator could subject us to additional regulation and compliance requirements and may result in fines and other penalties which could materially adversely affect our business, financial condition and results of operations.
The Dodd-Frank Act established a comprehensive new regulatory framework for derivative contracts commonly referred to as “swaps.” As a result, any investment fund that trades in swaps or other derivatives may be considered a “commodity pool,” which would cause its operators (in some cases the fund’s directors) to be regulated as “commodity pool operators,” or CPOs. Under rules adopted by the U.S. Commodity Futures Trading Commission (“CFTC”) for which the compliance date generally was December 31, 2012 as to those funds that become commodity pools solely because of their use of swaps, CPOs must by then have filed an application for registration with the National Futures Association (“NFA”) and have commenced and sustained good faith efforts to comply with the Commodity Exchange Act and CFTC’s regulations with respect to capital raising, disclosure, reporting, recordkeeping and other business conduct applicable for their activities as CPOs as if the CPOs were in fact registered in such capacity (which also requires compliance with applicable NFA rules). However, the CFTC’s Division of Swap Dealer and Intermediary Oversight issued a no-action letter saying, although it believes that mortgage REITs are properly considered commodity pools, it would not recommend that the CFTC take enforcement action against the operator of a mortgage REIT who does not register as a CPO if, among other things, the mortgage REIT limits the initial margin and premiums required to establish its swaps, futures and other commodity interest positions to not more than five percent (5%) of its total assets, the mortgage REIT limits the net income derived annually from those commodity interest positions which are not qualifying hedging transactions to less than five percent (5%) of its gross income, and interests in the mortgage REIT are not marketed to the public as or in a commodity pool or otherwise as or in a vehicle for trading in the commodity futures, commodity options or swaps markets.
We use hedging instruments in conjunction with our investment portfolio and related borrowings to reduce or mitigate risks associated with changes in interest rates, yield curve shapes and market volatility. These hedging instruments include interest rate swaps, interest rate swap futures, Eurodollar futures, options, and U.S. Treasury note futures. We do not currently engage in any speculative derivatives activities or other non-hedging transactions using swaps, futures or options on futures. We do not use these instruments for the purpose of trading in commodity interests, and we do not consider our company or its operations to be a commodity pool as to which CPO registration or compliance is required. We have claimed the relief afforded by the above-described no-action letter. Consequently, we will be restricted to operating within the parameters discussed in the no-action letter and will not enter into hedging transactions covered by the no-action letter if they would cause us to exceed the limits set forth in the no-action letter. However, there can be no assurance that the CFTC will agree that we are entitled to the no-action letter relief claimed.
| 23 |
The CFTC has substantial enforcement power with respect to violations of the laws over which it has jurisdiction, including their anti-fraud and anti-manipulation provisions. For example, the CFTC may suspend or revoke the registration of or the no-action relief afforded to a person who fails to comply with commodities laws and regulations, prohibit such a person from trading or doing business with registered entities, impose civil money penalties, require restitution and seek fines or imprisonment for criminal violations. In the event that the CFTC staff does not provide the no action letter relief we requested or asserts that we are not entitled to the mortgage REIT no-action letter relief claimed or if CFTC otherwise determines that CPO registration and compliance is required of us, we may be obligated to furnish additional disclosures and reports, among other things. Further, a private right of action exists against those who violate the laws over which the CFTC has jurisdiction or who willfully aid, abet, counsel, induce or procure a violation of those laws. In the event that we fail to comply with statutory requirements relating to derivatives or with the CFTC’s rules thereunder, including the mortgage REIT no-action letter described above, we may be subject to significant fines, penalties and other civil or governmental actions or proceedings, any of which could have a materially adverse effect on our business, financial condition and results of operations.
We face competition for personnel, which could adversely affect our business and in turn negatively affect the market price of our Class A common stock or Senior Notes and our ability to pay dividends to our shareholders.
We are dependent on the highly-skilled, and often highly-specialized, individuals we employ. Retention of specialists to manage our portfolio is particularly important to our prospects. Competition for the recruiting and retention of employees may increase elements of our compensation costs. We may not be able to recruit and hire new employees with our desired qualifications in a timely manner. Our incentives may be insufficient to recruit and retain our employees. Increased compensation costs could adversely affect the amount of cash available for distribution to shareholders and our failure to recruit and retain qualified employees could materially and adversely affect our future operating results.
We are dependent upon a small number of key senior professionals and the loss of any of these individuals could adversely affect our financial results which may, in turn, negatively affect the market price of our Class A common stock and Senior Notes and our ability to pay dividends to our shareholders.
We currently do not have employment agreements with any of our senior officers and other key professionals. We cannot guarantee that we will continue to have access to members of our senior management team or other key professionals. The loss of any members of our senior management and other key professionals could materially and adversely affect our operating results.
We are highly dependent upon communications and information systems operated by third parties, and systems failures could significantly disrupt our business, which may, in turn, negatively affect the market price of our Class A common stock and Senior Notes and our ability to pay dividends to our shareholders.
Our business is highly dependent upon communications and information systems that allow us to monitor, value, buy, sell, finance and hedge our investments. These systems are primarily operated by third parties and, as a result, we have limited ability to ensure their continued operation. Furthermore, in the event of systems failure or interruption, we will have limited ability to affect the timing and success of systems restoration. Any failure or interruption of our systems or third-party trading or information systems could cause delays or other problems in our securities trading activities, which could have a material adverse effect on our operating results and negatively affect the market price of our Class A common stock and Senior Notes and our ability to pay dividends to our shareholders.
| 24 |
If we issue additional debt securities or other equity securities that rank senior to our common stock, our operations may be restricted and we will be exposed to additional risk and the market price of our Class A common stock and Senior Notes could be adversely affected.
If we decide to issue additional debt securities in the future, it is likely that such securities will be governed by an indenture or other instrument containing covenants restricting our operating flexibility. Additionally, any convertible or exchangeable or other securities registered pursuant to our shelf registration statement that we issue in the future may have rights, preferences and privileges more favorable than those of our Class A common stock. Also shares of preferred stock, if issued, could have a preference on liquidating distributions or a preference on dividend payments that could limit our ability to make a dividend distribution to the holders of our Class A common stock. We, and indirectly our shareholders, will bear the cost of issuing and servicing such securities. Holders of debt securities may be granted specific rights, including but not limited to, the right to hold a perfected security interest in certain of our assets, the right to accelerate payments due under the indenture, rights to restrict dividend payments, and rights to approve the sale of assets. Such additional restrictive covenants, operating restrictions and preferential dividends could have a material adverse effect on our operating results and negatively affect the market price of our Class A common stock and our ability to pay distributions to our shareholders.
Tax Risks of our Business and Structure
We may not be able generate future taxable income to fully utilize our tax benefits.
We recognize the expected future tax benefit from a deferred tax asset when the tax benefit is considered more likely than not to be realized. Otherwise, a valuation allowance is applied against the deferred tax asset. Assuming the recoverability of a deferred tax asset requires management to make significant estimates related to expectations of future taxable income. Estimates of future taxable income are based on forecasted cash flow from operations, the character of expected income or loss as either ordinary or capital and the application of existing tax laws in each jurisdiction. To the extent that future cash flows and the amount or character of taxable income differ significantly from estimates, our ability to realize the deferred tax asset could be impacted. To the extent our estimates of our ability to realize our tax benefits change, we would be required to record changes to our valuation allowance applied against our deferred tax asset. In addition, our NOL carry-forwards begin to expire in 2027 and our NCL carry-forwards begin to expire in 2019. We may not generate sufficient taxable income of the appropriate tax character to fully utilize these carry-forwards prior to their expiration. To the extent that our NOL or NCL carry-forwards expire unutilized, we would be required to write off the corresponding deferred tax asset. If we were to increase our valuation allowances against our deferred tax asset or if we were to write off expired loss carry-forwards, our net income and net book value would be adversely impacted.
Our ability to use our tax benefits could be substantially limited if we experience an “ownership change.”
Our NOL and NCL carry-forwards and certain recognized built-in losses may be limited by Sections 382 and 383 of the Code if we experience an “ownership change.” In general, an “ownership change” occurs if 5% shareholders increase their collective ownership of the aggregate amount of the outstanding shares of our company by more than 50 percentage points looking back over the relevant testing period. If an ownership change occurs, our ability to use our NOLs, NCLs and certain recognized built-in losses to reduce our taxable income in a future year would be limited to a Section 382 limitation equal to the fair market value of our stock immediately prior to the ownership change multiplied by the long-term tax-exempt interest rate in effect for the month of the ownership change. The long-term tax-exempt rate for January 2016 is 2.65%. In the event of an ownership change, NOLs and NCLs that exceed the Section 382 limitation in any year will continue to be allowed as carry-forwards for the remainder of the carry-forward period and such losses can be used to offset taxable income for years within the carry-forward period subject to the Section 382 limitation in each year. However, if the carry-forward period for any NOL or NCL were to expire before that loss had been fully utilized, the unused portion of that loss would be lost. Our use of new NOLs or NCLs arising after the date of an ownership change would not be affected by the Section 382 limitation (unless there were another ownership change after those new losses arose).
We have a Rights Plan designed to protect against the occurrence of an ownership change. The Rights Plan is intended to act as a deterrent to any person or group acquiring 4.9% or more of our outstanding Class A common stock without the approval of our Board of Directors. See “Risks Related to our Business and Structure - Our Rights Plan could inhibit a change in our control” for information on our Rights Plan. The Rights Plan, however, does not protect against all transactions that could cause an ownership change, such as public issuances and repurchases of shares of Class A common stock. The Rights Plan may not be successful in preventing an ownership change within the meaning of Sections 382 and 383 of the Code, and we may lose all or most of the anticipated tax benefits associated with our prior losses.
| 25 |
Based on our knowledge of our stock ownership, we do not believe that an ownership change has occurred since our losses were generated. Accordingly, we believe that at the current time there is no annual limitation imposed on our use of our NOLs and NCLs to reduce future taxable income. The determination of whether an ownership change has occurred or will occur is complicated and depends on changes in percentage stock ownership among shareholders. Other than the Rights Plan, there are currently no restrictions on the transfer of our stock that would discourage or prevent transactions that could cause an ownership change, although we may adopt such restrictions in the future. As discussed above, the Rights Plan is intended to discourage transactions that could cause an ownership change. In addition, we have not obtained, and currently do not plan to obtain, a ruling from the Internal Revenue Service, regarding our conclusion as to whether our losses are subject to any such limitations. Furthermore, we may decide in the future that it is necessary or in our interest to take certain actions that could result in an ownership change. Therefore, no assurance can be provided as to whether an ownership change has occurred or will occur in the future.
Preserving the ability to use our NOLs and NCLs may cause us to forgo otherwise attractive opportunities.
Limitations imposed by Sections 382 and 383 of the Code may discourage us from, among other things, repurchasing our stock or issuing additional stock to raise capital or to acquire businesses or assets. Accordingly, our desire to preserve our NOLs and NCLs may cause us to forgo otherwise attractive opportunities.
If we elect in the future to be treated as a REIT, complying with the REIT requirements may cause us to forego otherwise attractive opportunities, may result in higher income tax rates on dividends you may receive, and could result in a reduction in our net book value.
We revoked our status as a REIT effective January 1, 2009, in part to maximize the use of tax benefits associated with our NOLs and NCLs. In the future, we might make an election again to be taxed as a REIT for various business reasons, including if we no longer have the benefit of NOL carry-forwards. To qualify as a REIT for federal income tax purposes, we would be required to continually satisfy tests concerning, among other things, the sources of our income, the nature and diversification of our assets, the amounts we distribute to our shareholders and the ownership of our stock. In order to meet these tests, we may be required to forego attractive business or investment opportunities. Thus, compliance with the REIT requirements may hinder our ability to operate solely on the basis of maximizing profits. In addition, in order to qualify as a REIT, an entity must distribute to its shareholders, each calendar year, at least 90% of its REIT taxable income, determined without regard to the deduction for dividends paid and excluding net capital gain. As a result, if we elect to be treated as a REIT, we generally will be required to distribute our earnings to our shareholders rather than retaining our earnings for reinvestment in our business.
Currently as a C-corporation, distributions to our shareholders of current or accumulated earnings and profits are qualified dividends eligible for the 23.8% federal income tax rate whereas similar distributions to shareholders of a REIT of current or accumulated earnings and profits are nonqualified dividends subject to the higher 43.4% federal income tax rate on ordinary income (both percentages inclusive of the 3.8% Medicare tax). If we were to elect to be treated as a REIT, future dividends you receive could be subjected to a higher tax rate. If our dividends are subject to a higher tax rate, the market value of our common stock could also be adversely affected.
If we were to elect in the future to be treated as a REIT, any remaining net deferred tax asset would likely need to be written off for GAAP accounting purposes. As a result, our net income and net book value could be adversely affected upon our election to be taxed as a REIT.
The decision to elect REIT status is in the sole discretion of our Board of Directors, and no assurance can be given that we will, or will not, elect such status for 2016 or in the future.
ITEM 1B. UNRESOLVED STAFF COMMENTS
None.
| 26 |
Our executive and administrative office is located at 1001 Nineteenth Street North, Arlington, Virginia 22209.
We sublease office space to Billings Capital Management, LLC (“BCM”) which is an investment management company owned and operated by Eric F. Billings, our Executive Chairman of the Board of Directors, and his sons. The lease term is month-to-month, based on the pro-rata share of the space occupied by BCM. The lease payments to us totaled approximately $90 thousand for the year ended December 31, 2015.
We are from time to time involved in civil lawsuits, legal proceedings and arbitration matters that we consider to be in the ordinary course of our business. There can be no assurance that these matters individually or in the aggregate will not have a material adverse effect on our financial condition or results of operations in a future period. We are also subject to the risk of litigation, including litigation that may be without merit. As we intend to actively defend such litigation, significant legal expenses could be incurred. An adverse resolution of any future litigation against us could materially affect our financial condition, results of operations and liquidity. Furthermore, we operate in highly-regulated markets that currently are under intense regulatory scrutiny, and we have received, and we expect in the future that we may receive, inquiries and requests for documents and information from various federal, state and foreign regulators. In addition, one or more of our subsidiaries have received requests to repurchase loans from various parties in connection with the former securitization business conducted by a subsidiary. We believe that the continued scrutiny of MBS, structured finance, and derivative market participants increases the risk of additional inquiries and requests from regulatory or enforcement agencies and other parties. We cannot provide any assurance that these inquiries and requests will not result in further investigation of or the initiation of a proceeding against us or that, if any such investigation or proceeding were to arise, it would not materially adversely affect our Company.
ITEM 4. MINE SAFETY DISCLOSURES
Not applicable.
| 27 |
ITEM 5. MARKET FOR REGISTRANT’S COMMON EQUITY, RELATED STOCKHOLDER MATTERS AND ISSUER PURCHASES OF EQUITY SECURITIES
Our Class A common stock is listed on the NYSE under the symbol “AI.” As of January 29, 2016, there were approximately 156 record holders of our Class A common stock. However, most of the shares of our Class A common stock are held by brokers and other institutions on behalf of shareholders. The following table shows the high and low sales prices of our Class A common stock during each fiscal quarter during the years ended December 31, 2015 and 2014.
| Price Range of Class A Common Stock | ||||||||
| High | Low | |||||||
| Year Ended December 31, 2015 | ||||||||
| Fourth Quarter | $ | 15.53 | $ | 12.07 | ||||
| Third Quarter | 20.36 | 13.71 | ||||||
| Second Quarter | 24.28 | 19.25 | ||||||
| First Quarter | 27.18 | 24.01 | ||||||
| Year Ended December 31, 2014 | ||||||||
| Fourth Quarter | 28.19 | 24.95 | ||||||
| Third Quarter | 28.66 | 25.41 | ||||||
| Second Quarter | 28.21 | 25.12 | ||||||
| First Quarter | 28.50 | 24.77 | ||||||
There is no established public trading market for our Class B common stock, and as of January 29, 2016, there were approximately 12 record holders of our Class B common stock. If declared, Class B shares receive dividends in the same amounts and on the same dates as Class A shares.
Pursuant to our variable dividend policy, our Board of Directors evaluates dividends on a quarterly basis and, in its sole discretion, approves the payment of dividends. Our dividend payments, if any, may vary significantly from quarter to quarter. The Board of Directors approved and we declared and paid the following dividends for 2015:
| Quarter Ended | Dividend Amount | Declaration Date | Record Date | Pay Date | ||||||
| December 31 | $ | 0.625 | December 17 | December 31 | January 29, 2016 | |||||
| September 30 | 0.625 | September 17 | September 30 | October 30 | ||||||
| June 30 | 0.875 | June 17 | June 30 | July 31 | ||||||
| March 31 | 0.875 | March 10 | March 31 | April 30 | ||||||
The Board of Directors approved and we declared and paid the following dividends for 2014:
| Quarter Ended | Dividend Amount | Declaration Date | Record Date | Pay Date | ||||||
| December 31 | $ | 0.875 | December 18 | December 31 | January 30, 2015 | |||||
| September 30 | 0.875 | September 17 | September 29 | October 31 | ||||||
| June 30 | 0.875 | June 11 | June 30 | July 31 | ||||||
| March 31 | 0.875 | March 13 | March 31 | April 30 | ||||||
Securities Authorized for Issuance Under Equity Compensation Plans
Information about securities authorized for issuance under our equity compensation plans is incorporated by reference from our Definitive Proxy Statement for the 2016 Annual Meeting of Shareholders.
Purchases of Equity Securities by the Issuer
In October 2015, the Board of Directors authorized an increase in the Company’s share repurchase program pursuant to which the Company may repurchase up to 2.0 million shares of its Class A common stock, which included 205,485 shares previously available to be repurchased under the prior share repurchase program authorized by the Board of Directors in July 2010 (collectively, the “Repurchase Program”). The following table provides information for the three months ended December 31, 2015 regarding shares of Class A common stock that the Company repurchased in the open market and were subsequently retired:
| 28 |
| Period | Total Number of Shares Purchased | Average Price Paid Per Share | Total Number of Shares Purchased as Part of Publicly Announced Plans or Programs | Maximum Number of Shares That May Yet Be Purchased Under the Publicly Announced Plans or Programs | ||||||||||||
| October 1 - 31, 2015 | — | N/A | — | 2,000,000 | ||||||||||||
| November 1 - 30, 2015 | — | N/A | — | 2,000,000 | ||||||||||||
| December 1 – 31, 2015 | 48,695 | $ | 12.15 | 48,695 | 1,951,305 | |||||||||||
| Fourth Quarter 2015 | 48,695 | $ | 12.15 | 48,695 | 1,951,305 | |||||||||||
Performance Graph
The following graph compares the cumulative total shareholder return for our Class A common stock from December 31, 2010 to December 31, 2015 with the comparable cumulative return of the Standard & Poor’s (“S&P”) 500 Stock Index and the FTSE NAREIT Mortgage REIT Index. The FTSE NAREIT Mortgage REIT Index is a free-float adjusted, market capitalization-weighted index of U.S. mortgage REITs, which include all tax-qualified REITs with more than 50% of total assets invested in mortgage loans or MBS secured by interests in real property. In the prior year, the Company also included the comparable cumulative return of a peer group index comprised of issuers selected by the Company (“Old Peer Group”). The Company now includes the FTSE NAREIT Mortgage REIT Index as an industry comparative index instead of the Old Peer Group index; however, the Company has included the Old Peer Group index for comparative purposes.
The graph assumes $100 invested on December 31, 2010 in our Class A common stock and $100 invested at the same time in each of the above-mentioned indices, assuming that all dividends are reinvested.
| 29 |
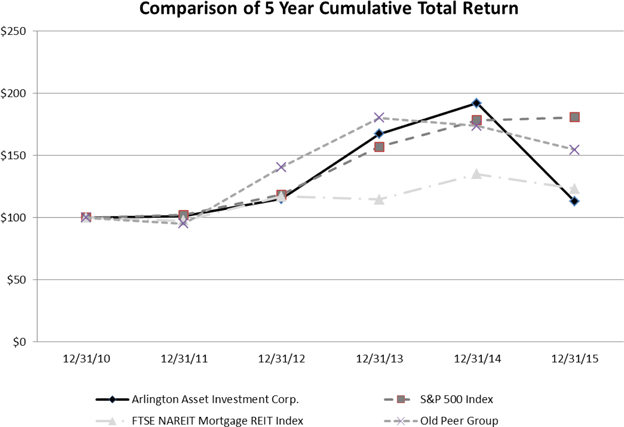
| AI | S&P 500 Index | FTSE NAREIT Mortgage REIT Index | Old Peer Group (1) | |||||||||||||
| December 31, 2010 | $ | 100.00 | $ | 100.00 | $ | 100.00 | $ | 100.00 | ||||||||
| December 31, 2011 | 101.03 | 102.08 | 97.56 | 95.02 | ||||||||||||
| December 31, 2012 | 114.92 | 118.39 | 117.05 | 140.35 | ||||||||||||
| December 31, 2013 | 167.01 | 156.70 | 114.52 | 180.10 | ||||||||||||
| December 31, 2014 | 191.82 | 178.10 | 134.97 | 173.52 | ||||||||||||
| December 31, 2015 | 112.95 | 180.56 | 123.26 | 154.32 | ||||||||||||
| (1) | The Old Peer Group Index includes the following companies: American Capital, Ltd., Arbor Realty Trust, Inc., Capstead Mortgage Corporation, Dynex Capital, Inc., Hercules Technology Growth Capital, Inc., KCAP Financial Inc., Main Street Capital Corporation, MCG Capital Corporation, NewStar Financial, Inc., RAIT Financial Trust, Redwood Trust, Inc., Resource America, Inc. and Triangle Capital Corporation. The Old Peer Group also included NorthStar Realty Finance Corp. in the prior year; however for 2015 NorthStar Realty Finance Corp. was excluded from the Old Peer Group due to corporate reorganizations that occurred in 2015 which preclude meaningful comparison. |
| 30 |
ITEM 6. SELECTED FINANCIAL DATA
SELECTED CONSOLIDATED FINANCIAL INFORMATION
(Dollars in thousands, except per share amounts)
| Year Ended December 31, | ||||||||||||||||||||
| 2015 | 2014 | 2013 | 2012 | 2011 | ||||||||||||||||
| Consolidated Statement of Comprehensive Income Data (audited) (1) | ||||||||||||||||||||
| Interest income | $ | 154,593 | $ | 123,547 | $ | 87,019 | $ | 64,154 | $ | 52,545 | ||||||||||
| Interest expense | 18,889 | 11,391 | 8,529 | 4,965 | 2,508 | |||||||||||||||
| Net interest income | 135,704 | 112,156 | 78,490 | 59,189 | 50,037 | |||||||||||||||
| Investment loss, net | (152,379 | ) | (38,687 | ) | (47,760 | ) | (10,738 | ) | (19,180 | ) | ||||||||||
| Other expenses | 14,167 | 18,069 | 16,591 | 17,446 | 14,189 | |||||||||||||||
| (Loss) income before income taxes | (30,842 | ) | 55,400 | 14,139 | 31,005 | 16,668 | ||||||||||||||
| Income tax provision (benefit) | 38,561 | 47,647 | (38,684 | ) | (157,939 | ) | 1,495 | |||||||||||||
| Net (loss) income | (69,403 | ) | 7,753 | 52,823 | 188,944 | 15,173 | ||||||||||||||
| Other comprehensive (loss) income, net of taxes | (23,501 | ) | (10,397 | ) | 11,743 | (3,841 | ) | (25,128 | ) | |||||||||||
| Comprehensive (loss) income | $ | (92,904 | ) | $ | (2,644 | ) | $ | 64,566 | $ | 185,103 | $ | (9,955 | ) | |||||||
| Basic (loss) earnings per share | $ | (3.02 | ) | $ | 0.39 | $ | 3.30 | $ | 18.51 | $ | 1.97 | |||||||||
| Diluted (loss) earnings per share | $ | (3.02 | ) | $ | 0.38 | $ | 3.26 | $ | 18.45 | $ | 1.96 | |||||||||
| December 31, | ||||||||||||||||||||
| 2015 | 2014 | 2013 | 2012 | 2011 | ||||||||||||||||
| Consolidated Balance Sheet Data (audited) (1) | ||||||||||||||||||||
| Agency MBS, at fair value | $ | 3,865,316 | $ | 3,414,340 | $ | 1,576,499 | $ | 1,566,510 | $ | 637,011 | ||||||||||
| Private-label MBS, at fair value | 130,435 | 267,437 | 341,299 | 199,086 | 179,427 | |||||||||||||||
| Total assets | 4,204,806 | 4,017,731 | 2,196,409 | 2,066,817 | 955,060 | |||||||||||||||
| Short-term debt | 3,621,680 | 3,179,775 | 1,547,630 | 1,497,191 | 647,977 | |||||||||||||||
| Long-term debt | 75,300 | 40,000 | 40,000 | 15,000 | 15,000 | |||||||||||||||
| Total stockholders’ equity | 484,031 | 645,274 | 553,271 | 457,815 | 183,372 | |||||||||||||||
| Other Financial Data (unaudited) | ||||||||||||||||||||
| Book value per share (2) | $ | 21.05 | $ | 28.09 | $ | 33.19 | $ | 34.69 | $ | 23.67 | ||||||||||
| Cash dividends declared per common share | $ | 3.00 | $ | 3.50 | $ | 3.50 | $ | 3.50 | $ | 3.375 | ||||||||||
| (1) | Reflects revisions to correct certain immaterial errors. See Note 15, “Revisions to Previously Reported Financial Statements,” of Notes to Consolidated Financial Statements included in this Report on Form 10-K for further information. |
| (2) | Based on shares of Class A common stock and Class B common stock outstanding plus vested restricted stock units convertible into shares of Class A common stock less unvested restricted shares of Class A common stock. As of the year ended on the indicated date. |
| 31 |
ITEM 7. MANAGEMENT’S DISCUSSION AND ANALYSIS OF FINANCIAL CONDITION AND RESULTS OF OPERATIONS
Overview
Arlington Asset Investment Corp. is a principal investment firm that currently acquires and holds a levered portfolio of residential MBS, consisting of agency MBS and private-label MBS. Agency MBS include residential mortgage pass-through certificates for which the principal and interest payments are guaranteed by a U.S. government agency or GSE, such as Fannie Mae and Freddie Mac. Private-label MBS, or non-agency MBS, include residential MBS that are not guaranteed by a GSE or the U.S. government.
We leverage prudently our investment portfolio so as to increase potential returns to our shareholders. We fund our investments primarily through short-term financing arrangements.
We are a Virginia corporation and taxed as a C corporation for U.S. federal tax purposes. We are internally managed and do not have an external investment advisor.
Factors that Affect our Results of Operations and Financial Condition
Our business is materially affected by a variety of industry and economic factors, including:
| • | conditions in the global financial markets and economic conditions generally; |
| • | changes in interest rates and prepayment rates; |
| • | actions taken by the U.S. government, U.S. Federal Reserve and the U.S. Treasury; |
| • | changes in laws and regulations and industry practices; and |
| • | other market developments. |
Current Market Conditions and Trends
Global interest rate and capital markets volatility persisted throughout the 2015 calendar year. The uncertainty over when the Federal Reserve would begin to raise the target Federal Funds rate finally was resolved on December 16, 2015, when the Federal Reserve announced that it was increasing the target Federal Funds rate by 0.25%. In its announcement, the Federal Reserve cautioned capital markets to anticipate the possibility of one or more additional increases in the Federal Funds rate in 2016, depending on future growth in inflation and other economic indicators. However, foreign central banks have taken an increasingly accommodative stance, and with negative economic data reported to date in 2016, many market participants are increasingly skeptical of the number and amount of any increases in the Federal Funds rate in the foreseeable future. As a result, we have witnessed renewed volatility subsequent to December 31, 2015 accompanied by declines in global growth expectations, risk assets and forward interest rates that have produced additional spread widening to date in 2016.
Home sales and new single-family home construction remain relatively slow due, in part, to mortgage lending rules implemented under the Wall Street Reform and Consumer Protection Act (the “Dodd-Frank Act”) and bank conservatism in efforts to, among other things, prevent future MBS repurchase requests. These factors have created a shortage of mortgage origination, resulting in low agency MBS issuance. The Federal Reserve’s purchases of agency MBS through reinvesting principal and interest payments it receives on its existing agency MBS portfolio have continued to dominate the agency MBS markets, where many participants perceive a lack of liquidity. The Federal Reserve purchases contributed to strong agency MBS demand and limited new investment opportunities in 2015. While the Federal Reserve has not indicated when it will cease or reduce its agency MBS purchases by reinvesting principal and interest payments, private banks have less incentive to purchase MBS issued by Freddie Mac and Fannie Mae, as the Basel III liquidity coverage ratio rules provide lower quality liquid asset credit for such securities on their balance sheet than for cash, U.S. Treasuries and MBS issued by the Government National Mortgage Association (“Ginnie Mae”).
| 32 |
While there are signs that slow and steady economic growth will continue to persist in the United States, uncertainty continues to dominate the market. We believe the general business environment will continue to be challenging for the rest of 2016. Our growth outlook is dependent, in part, on the strength of the financial markets, the impact of fiscal and monetary policy actions by the United States and other countries, and liquidity in the financial system. Depending upon market developments and movements, we may seek to re-align our strategy and our portfolio. We will continue to closely monitor the developments in the market and evaluate the opportunities across the spectrum in the mortgage industry and other types of assets in a continuing effort to seek the highest risk-adjusted returns for our capital.
Recent Government Activity
On January 12, 2016, the FHFA issued RIN 2590-AA39, Members of Federal Home Loan Banks (the “Final Rule”). The Final Rule, among other things, expressly excludes captive insurance companies, such as our wholly-owned captive insurance subsidiary, Key Bridge Insurance, LLC (“Key Bridge”), from being eligible for membership in the Federal Home Loan Bank (“FHLB”) system. Under the Final Rule, there is a one-year transition period from the effective date (which will be the date the Final Rule is published in the Federal Register) within which the FHLBs must wind down their relationships with any captive insurance companies that had been admitted to membership on or after September 12, 2014, including Key Bridge. The Final Rule also precludes the FHLBs from making any new advances or extending existing advances to captive insurance companies. In addition, upon the termination of membership, the FHLBs must liquidate all outstanding advances to captive insurance companies, settle all other business transactions, and repurchase or redeem all FHLB stock held by the terminated captive insurance company in accordance with the Final Rule. Therefore, Key Bridge, along with all other captive insurance companies, must completely wind down all business relationships with the FHLB of Cincinnati (“FHLBC”), including the repayment of all outstanding advances, prior to or simultaneously with the termination of Key Bridge’s membership with the FHLBC. Since the release of the Final Rule, Key Bridge has repaid all of its outstanding FHLB advances.
The adopting release for the Final Rule expressly invited Congress to address the treatment of captive insurance companies with respect to membership in the FHLB. In October 2015, Reps. Blaine Luetkemeyer (R-Mo.), Denny Heck (D-Wash.), Patrick McHenry (R-N.C.) and John Carney (D-Del.) introduced H.R. 3808, a bill that would have preemptively prevented the FHFA from adopting the Final Rule in such a way that would foreclose membership in the FHLB to captive insurance companies. There can be no way of predicting if any subsequent legislation addressing the status of captive insurance companies with respect to the FHLB will be proposed in either house of Congress, the likelihood of passage of any such legislation, and the ultimate effects, if any, on the availability of short-term, low-cost funding provided by the FHLBs to captive insurance companies subsequent to the enactment of any such legislation.
In March 2015, housing and mortgage financial reform legislation, H.R. 1491, was proposed by congressmen John Delaney (D-MD), John Carney (D-DE) and James A. Himes (D-CT), each of whom is a member of the House Financial Services Committee. The bill is called The Partnership to Strengthen Homeownership Act, and is similar to one introduced by the same congressmen in the last Congress (H.R. 5055), which never made it out of committee. Under this proposed legislation, all government guaranteed single-family and multi-family MBS would be supported by a minimum of 5% private sector capital, which would stand in a first loss position. The remaining 95% of the risk would be shared between Ginnie Mae and a private reinsurer on a pari passu basis. Fees paid to Ginnie Mae for providing these securities would be allocated to affordable housing programs. Under the bill, Freddie Mac and Fannie Mae would be wound down over a five-year period, and their multifamily businesses would be spun out as separate entities. Ginnie Mae would be required to create and implement a workable multifamily guarantee that utilizes private sector pricing consistent with the single family model. The GSEs’ current multifamily businesses would continue to function within the new multifamily housing market as purely private organizations with an explicit government guarantee provided by Ginnie Mae and a private sector reinsurer.
| 33 |
On June 25, 2013, Senators Bob Corker (R-TN) and Mark Warner (D-VA) sponsored the Housing Finance Reform and Taxpayer Protection Act of 2013 (the “Corker-Warner Bill”) into the U.S. Senate. While the Corker-Warner Bill appeared to have lost momentum after the introduction of a competing bill in 2014, the Corker-Warner Bill was re-introduced in the U.S. Senate in September 2015 by its original sponsors, joined by Senators Elizabeth Warren (D-MA) and David Vitter (R-LA). As originally drafted, the Corker-Warner Bill has three key provisions:
| • | the establishment of the Federal Mortgage Insurance Corporation (the “FMIC”); |
| • | the creation of a Mortgage Insurance Fund (the “Fund”); and |
| • | the wind-down of Fannie Mae and Freddie Mac. |
The FMIC would be a government guarantor modeled after the Federal Deposit Insurance Corporation in that it would collect insurance premiums and maintain a deposit fund on all outstanding obligations. Every mortgage-backed security issued through the FMIC would have a private investor bearing the first risk of loss and holding at least $0.10 in equity capital for every dollar of risk. This private capital buffer is intended to protect taxpayers from the risk of default on the mortgages underlying securities issued by the FMIC. Thus, the ultimate purpose of the FMIC would be to require credit investors to bear the initial risk of default on MBS.
The FHFA would be abolished after the establishment of the FMIC, and all current responsibilities of the FHFA, as well as its resources, would be transferred to the FMIC. In particular, the Corker-Warner Bill specifies that the FMIC would maintain a database of uniform loan-level information on eligible mortgages, develop standard uniform securitization agreements and oversee the common securitization platform currently being developed by the FHFA. In the event losses due to default on underlying mortgages exceed the first position losses of private credit investors in securities issued by the FMIC, the FMIC would cover such losses out of the Fund. The Corker-Warner Bill specifies that the FMIC would endeavor to attain a reserve balance of 1.25% of the aggregate outstanding principal balance of covered securities within five years of the establishment of the FMIC and 2.50% of such amount within ten years of the establishment of the FMIC. The Fund would be paid with insurance premiums, akin to user fees, paid by private investors with various reporting requirements. The Corker-Warner Bill would revoke the charters of Fannie Mae and Freddie Mac upon the establishment of the FMIC. Fannie Mae and Freddie Mac would wind down as expeditiously as possible while maximizing returns to taxpayers as their assets are sold off.
We expect debate and discussion on residential housing and mortgage reform to continue over the next few years; however, we cannot be certain if or when H.R. 1491, the Corker-Warner Bill or any other housing finance reform bill will emerge from committee or be approved by Congress, and if so, what the effects may be. Historically, significant legislation has been difficult to pass in a presidential election year, and we cannot predict what effect the 2016 election cycle will have on the progress of housing finance reform legislation.
Executive Summary
During the fiscal year 2015, the Company’s financial results were significantly impacted by persistent interest rate volatility and widening of MBS spreads, resulting in the Company’s interest rate derivative instruments underperforming relative to the Company’s agency MBS portfolio and causing a decline in the Company’s net book value per share. While the Company maintains a portfolio of interest rate derivative instruments designed and structured to protect the fair value of its agency MBS portfolio from a rise in interest rates, the Company’s hedging instruments are not generally designed to protect the Company’s net book value from spread risk, which is the risk of an increase of the market spread between the yield on agency MBS and the benchmark yield on U.S. Treasury securities or interest rate swaps.
| 34 |
While the 10-year U.S. Treasury rate increased modestly from 2.17% as of December 31, 2014 to 2.27% as of December 31, 2015, there was significantly volatility throughout fiscal year 2015 with the 10-year U.S. Treasury rate reaching a high of 2.50% and a low of 1.68%. The option-adjusted spread (“OAS”), a common measure of the spread between a fixed income security rate and a risk-free rate that takes into consideration the impact of interest rate volatility and prepayment risk in residential MBS, widened significantly during the year. For example, the Fannie Mae 4.0% 30-year OAS widened approximately 36 basis points during fiscal year 2015. Also, in the latter part of fiscal year 2015, interest rate swap rates decreased comparatively more than U.S. Treasury rates and, in certain tenors, actually moved lower than U.S. Treasury rates, causing many interest rate hedging instruments such as Eurodollar futures, interest rate swaps and interest rate swap futures to underperform relative to agency MBS. For example, the spread between the 10-year U.S. Treasury note rate and 10-year interest rate swap rate widened 20 basis points during fiscal year 2015 with the 10-year swap rate ending eight basis points lower than the U.S. Treasury rate as of December 31, 2015. As a result of these factors, the Company’s agency MBS portfolio did not increase in market value by an amount sufficient to offset the decrease in value of its hedging instruments, resulting in the recognition of losses on the Company’s hedged agency MBS portfolio during the year. The net investment losses on the Company’s hedged agency MBS portfolio was the key driver in the $7.04 per share decline in the Company’s book value from the prior year to $21.05 per share as of December 31, 2015.
As of December 31, 2015, the Company’s agency MBS investment portfolio totaled $4,254 million at fair value consisting of $3,865 million of agency MBS and $389 million of net long TBA agency positions. The Company’s fixed-rate agency MBS were each specifically selected based upon collateral characteristics that demonstrate a lower than average propensity for prepayments. The three-month constant prepayment rate for the Company’s agency MBS was 7.15% as of December 31, 2015.
As of December 31, 2015, the total notional amount of the Company’s interest rate hedges on its agency investment portfolio was $2,835 million comprised of interest rate swaps and 10-year U.S. Treasury note futures. In light of continued expectations for moderate economic growth and more stable interest rates, during fiscal year 2015 the Company reduced its overall hedge position and adjusted the composition of its hedges by increasing its exposure to the longer portion of the interest rate curve and reducing its exposure to the shorter portion of the interest rate curve. However, the Company believes its interest rate hedges continue to be structured to maintain substantial protection to the Company’s agency MBS portfolio against rising interest rates. As of December 31, 2015, the notional amount of the Company’s interest rate hedges was 71% of its outstanding short-term borrowing arrangements and net long TBA positons. During the fourth quarter of 2015, the Company also modified the types of instruments it uses to hedge its agency investment portfolio. The Company closed its Eurodollar and interest rate swap futures contracts and generally replaced them with centrally cleared interest rate swap agreements and U.S. Treasury note futures.
The Company constantly monitors its allocation of its available capital between agency MBS and private-label MBS in an effort to maximize returns to its shareholders. As of December 31, 2015, the Company’s available capital was allocated approximately 80% to agency MBS and 20% to private-label MBS, compared to 61% to agency MBS and 39% to private-label MBS as of December 31, 2014. During 2015, the Company sold private-label MBS for gross sales proceeds of $130 million. In general, the Company believed that returns on the sold private-label MBS had plateaued and that they had reached the Company’s price targets. The Company reinvested the capital from the sold private-label MBS into new agency MBS on a levered basis, which the Company believes will achieve a relatively higher risk-adjusted rate of return. As of December 31, 2015, the Company’s private-label MBS portfolio totaled $130 million at fair value, consisting primarily of re-REMIC securities that represent mezzanine interests in underlying senior class REMIC securities collateralized by prime jumbo and Alt-A residential mortgage loans.
The Company generally expects to maintain its current allocations of investable capital between agency and private-label MBS. By maintaining a meaningful concentration of capital in the private-label MBS sector, the Company should benefit from a flexible pool of credit-oriented investments with acceptable returns, variable rates, low leverage, and flexibility to reallocate to more attractive risk-adjusted return opportunities including new private-label MBS opportunities, agency MBS, or repurchases of the Company’s Class A common stock.
As of December 31, 2015, the closing price of the Company’s Class A common stock was $13.23 per share, which represented 63% of book value per share and 79% of tangible book value per share. Tangible book value is calculated as shareholders’ equity less the Company’s net deferred tax asset. In October 2015, the Company’s board of directors authorized an increase in the Company’s share repurchase program pursuant to which the Company may repurchase up to 2.0 million shares of its Class A common stock. During the fourth quarter, the Company repurchased 48,695 shares at an average price of $12.15 per share for a total purchase price of $0.6 million.
| 35 |
In March 2015, the Company completed a public offering of $35.3 million of 6.75% senior notes due in 2025 and received net proceeds of $34.1 million after payment of underwriting discounts, commissions, and expenses. The Company invested the proceeds primarily in new agency MBS investments on a levered basis.
The Company continues to believe that its internally managed structure provides benefits to shareholders. Operating leverage, elimination of conflicts of interest, and alignment of management compensation to company performance are some examples of the benefits to shareholders of internally managed structures versus alternative structures. These benefits were demonstrated in fiscal year 2015 as management’s cash and stock incentive compensation was meaningfully lower than prior years as the Company’s results were below expectations for our shareholders. These lower compensation costs were the key element in driving the Company’s fiscal year 2015 operating expenses down 22% from the prior year.
The Company continues to utilize its tax benefits afforded to it as a C-corporation that allow it to shield substantially all of its income from taxes. As of December 31, 2015, the Company had NOL carry-forwards of $107 million and NCL carry-forwards of $241 million. From a GAAP accounting perspective, the Company had a net deferred tax asset of $97.5 million, or $4.24 per share, as of December 31, 2015. The Company continues to record a valuation allowance against a portion of its deferred tax asset attributable to NCL carry-forwards that the Company believes will likely expire prior to utilization. During fiscal year 2015, the Company recorded an increase to its valuation allowance of $56.4 million, or $2.45 per diluted share, due largely to an increase in its NCL carryforwards as a result of net capital losses during fiscal year 2015, primarily from losses on certain of its interest rate derivative instruments.
The Company declared dividends of $3.00 per share in fiscal year 2015. The Company continues to maintain a variable dividend policy pursuant to which the Board of Directors evaluates dividends on a quarterly basis and, in its sole discretion, may approve the payment of dividends. The Company considers many factors in determining the amount of its quarterly dividends, including its net income determined in accordance with GAAP, non-GAAP core operating income measures, the economic costs of its interest rate hedges, book value per share, liquidity, and expectations of future performance, among other factors.
Non-GAAP Core Operating Income
In addition to the financial results reported in accordance with GAAP, the Company calculated non-GAAP core operating income for the years ended December 31, 2015 and 2014. In determining core operating income, the Company excludes certain legacy litigation expenses and adjusts net income determined in accordance with GAAP for the following non-cash and other items:
| · | compensation costs associated with stock-based awards; |
| · | non-cash accretion of private-label MBS purchase discounts; |
| · | private-label MBS purchase discount accretion realized upon sale or repayment; |
| · | other-than-temporary impairment charges; |
| · | other-than-temporary impairment charges realized upon sale or repayment; |
| · | both realized and unrealized gains and losses on agency MBS; |
| · | unrealized gains and losses and early termination net settlement payments or receipts on interest rate swap agreements; |
| · | both realized and unrealized gains on losses on all other derivative instruments; and |
| · | non-cash income tax provisions. |
In determining core operating income, the Company includes the periodic interest costs of its interest rate swap agreements, which the Company first began to enter into during the fourth quarter of 2015.
| 36 |
The Company’s investment strategy for its agency MBS portfolio is to generate a net interest margin on the leveraged assets and hedge changes in the market value of the assets attributable to changes in interest rates, expecting that the fluctuations in the market value of the agency MBS and related hedges should largely offset each other over time. As a result, the Company excludes both the realized and unrealized fluctuations in the gains and losses in the assets and hedges, except for the periodic interest costs of interest rate swap agreements, on its hedged agency MBS portfolio when assessing the underlying core operating income of the Company. However, the Company’s investment strategy for its private-label MBS portfolio is to generate a total cash return comprised of both interest income collected and the cash return realized when the private-label MBS are sold that equals the difference between the sale price and the discount to par paid at acquisition. Therefore, the Company excludes non-cash accretion of private-label MBS purchase discounts from non-GAAP core operating income, but includes realized cash gains or losses on its private-label MBS portfolio in core operating income to reflect the total cash return on those securities over their holding period. Since the timing of realized cash gains or losses on private-label MBS may vary significantly between periods, the Company also reports core operating income excluding gains on private-label MBS.
These non-GAAP core operating income measurements are used by management to analyze and assess the Company’s operating results on its portfolio and assist with the determination of the appropriate level of dividends. The Company believes that these non-GAAP measurements assist investors in understanding the impact of these non-core items and non-cash expenses on our performance and provides additional clarity around our earnings capacity and trends. A limitation of utilizing this non-GAAP measure is that the GAAP accounting effects of these events do in fact reflect the underlying financial results of our business and these effects should not be ignored in evaluating and analyzing our financial results. Additional limitations of core operating income are that it does not include economic financing costs on the Company’s hedging instruments (with the exception of periodic net interest costs of interest rate swap agreements) or amortization of premiums or discounts on the Company’s agency MBS whereas those amounts are both reflected in net income determined in accordance with GAAP and changes in book value. Therefore, the Company believes net income on a GAAP basis and these core operating income measures on a non-GAAP basis should be considered together.
The Company’s non-GAAP core operating income increased to $136.5 million, or $5.91 per diluted share, for the year ended December 31, 2015 compared to $100.6 million, or $4.93 per diluted share, for the year ended December 31, 2014. The non-GAAP core operating income for the years ended December 31, 2015 and 2014 benefited from the cash gains from the sales of private-label MBS. The Company’s non-GAAP core operating income excluding sales of private-label MBS was $122.3 million, or $5.30 per diluted share, and $97.0 million, or $4.76 per diluted share, for the years ended December 31, 2015 and 2014, respectively.
The amortization of net purchase premiums on the Company’s investments in agency MBS, and the corresponding change in book value, is reflected in the Company’s GAAP net income as a component of “investment gains (losses), net” and is excluded from non-GAAP core operating income. Beginning in fiscal year 2016, the Company intends to change its accounting policy for recognizing interest income on its investments in agency MBS by amortizing purchase premiums (or accreting purchase discounts) as an adjustment to interest income in accordance with the “interest method” permitted by GAAP.
As the Company’s allocation of capital to agency MBS has continued to grow, the higher net interest income from that portfolio has also contributed to an increase in the Company’s core operating income per share. The economic costs of the Company’s hedge instruments have generally increased proportionately with the growth in the agency MBS portfolio. However, the economic costs of the Company’s hedge instruments are ultimately reflected through net income per share determined in accordance with GAAP and changes in book value per share rather than core operating income per share.
The following is a reconciliation of GAAP net income to non-GAAP core operating income measures for the two years ended December 31, 2015 and 2014 (dollars in thousands, except per share data):
| 37 |
| 2015 | 2014 | |||||||
| GAAP net (loss) income | $ | (69,403 | ) | $ | 7,753 | |||
| Adjustments: | ||||||||
| Legacy litigation expenses(1) | — | 54 | ||||||
| Non-cash income tax provision | 37,515 | 46,354 | ||||||
| Stock compensation | 1,145 | 3,814 | ||||||
| Net realized and unrealized loss on trading MBS and hedge instruments | 168,339 | 55,830 | ||||||
| Realized gain on private-label MBS | (17,725 | ) | (17,257 | ) | ||||
| Other-than-temporary impairment charges | 2,417 | 449 | ||||||
| Non-GAAP core operating income excluding gain on private-label MBS | 122,288 | 96,997 | ||||||
| Realized gain on private-label MBS | 17,725 | 17,257 | ||||||
| Other-than-temporary impairment charges realized upon sale or repayment | (7,303 | ) | (5,180 | ) | ||||
| Purchase discount accretion of private-label MBS realized upon sale or repayment | 12,199 | 4,074 | ||||||
| Non-cash interest income related to purchase discount accretion of private-label MBS | (8,453 | ) | (12,570 | ) | ||||
| Non-GAAP core operating income | $ | 136,456 | $ | 100,578 | ||||
| Non-GAAP core operating income excluding gain on private-label MBS per diluted share | $ | 5.30 | $ | 4.76 | ||||
| Non-GAAP core operating income per diluted share | $ | 5.91 | $ | 4.93 | ||||
| Weighted average diluted shares outstanding | 23,088 | 20,397 | ||||||
| (1) | Legacy litigation expenses relate to legal matters pertaining to events related to business activities the Company completed or exited in or prior to 2009 — primarily debt extinguishment, sub-prime mortgage origination and securitization, and broker/dealer operations. |
Portfolio Overview
The following table summarizes our MBS investment portfolio at fair value as of December 31, 2015 and 2014 (dollars in thousands):
| December 31, 2015 | December 31, 2014 | |||||||
| Agency MBS | $ | 3,865,316 | $ | 3,414,340 | ||||
| Private-label MBS | 130,435 | 267,437 | ||||||
| Private-label interest-only MBS | 118 | 212 | ||||||
| Net long TBA positions (1) | 389,258 | 213,563 | ||||||
| $ | 4,385,127 | $ | 3,895,552 | |||||
| (1) | Net long TBA positions are reflected on the consolidated balance sheets as a component of “derivative assets, at fair value” and “derivative liabilities, at fair value,” with a liability net carrying value of $553 and an asset net carrying value of $516 as of December 31, 2015 and 2014, respectively. |
Agency MBS Investment Portfolio
Our agency MBS consisted of the following as of December 31, 2015 (dollars in thousands):
| 38 |
| Face Amount | Fair Value | Market Price | Coupon | Weighted Average Life | ||||||||||||||||
| 30-year fixed rate: | ||||||||||||||||||||
| 3.5% | $ | 691,622 | $ | 714,925 | $ | 103.37 | 3.50 | % | 7.0 | |||||||||||
| 4.0% | 2,837,244 | 3,016,444 | 106.32 | 4.00 | % | 5.5 | ||||||||||||||
| 4.5% | 123,010 | 133,921 | 108.87 | 4.50 | % | 4.6 | ||||||||||||||
| 5.5% | 23 | 26 | 111.77 | 5.50 | % | 5.0 | ||||||||||||||
| Total/weighted-average | $ | 3,651,899 | $ | 3,865,316 | 105.84 | 3.92 | % | 5.8 | ||||||||||||
| Face Amount | Fair Value | Market Price | Coupon | Weighted Average Life | ||||||||||||||||
| Fannie Mae | $ | 2,007,030 | $ | 2,127,404 | $ | 106.00 | 3.93 | % | 5.8 | |||||||||||
| Freddie Mac | 1,644,869 | 1,737,912 | 105.66 | 3.91 | % | 5.8 | ||||||||||||||
| Total/weighted-average | $ | 3,651,899 | $ | 3,865,316 | 105.84 | 3.92 | % | 5.8 | ||||||||||||
As of December 31, 2015, the Company’s agency MBS was comprised of securities specifically selected for their relatively lower propensity for prepayment including approximately 48% in specified pools of low balance loans, approximately 20% in specified pools of loans refinanced through the U.S. government sponsored Home Affordable Refinance Program (“HARP”), while the remainder includes specified pools of loans originated in certain geographic areas, with low FICO scores or with other characteristics selected for their relatively lower propensity for prepayment. The three-month constant prepayment rate for the Company’s agency MBS was 7.15% as of December 31, 2015.
As of December 31, 2015, we had $2,798 million of outstanding repurchase agreement financing secured by $2,947 million of agency MBS with a weighted-average cost of funding of 0.61% and $786.9 million of outstanding FHLB advances secured by $805.2 million of agency MBS with a weighted-average cost of funding of 0.36%. During the year ended December 31, 2015, we sold agency MBS with a face value of $990.5 million for total proceeds of $1,057.8 million, realizing net losses of $22.1 million from the acquisition price.
Our agency MBS investment portfolio also includes net long TBA positions, which are primarily the result of executing sequential series of “dollar roll” transactions. The Company executes dollar roll transactions as a means of investing in and financing non-specified pools of fixed-rate agency MBS. Such transactions involve effectively delaying (or “rolling”) the settlement of a forward purchase of a TBA agency MBS by entering into an offsetting sale prior to the settlement date, net settling the “paired-off” positions in cash, and contemporaneously entering another forward purchase of a TBA agency MBS of the same characteristics for a later settlement date. TBA securities purchased or sold for a forward settlement month are generally priced at a discount relative to TBA securities purchased for settlement in the current month. This discount, often referred to as the dollar roll “price drop,” reflects compensation for the net interest income (interest income less financing costs) that is foregone as a result of relinquishing beneficial ownership of the MBS for the duration of the dollar roll (also known as “dollar roll income”). By executing a sequential series of dollar roll transactions, the Company is able to create the economic experience of investing in an agency MBS, financed with a repurchase agreement, over a period of time. Forward purchases and sales of TBA securities are accounted for as derivative instruments in the Company’s financial statements. Accordingly, dollar roll income is recognized as a component of “investment gains (losses), net” along with all other periodic changes in the fair value of TBA commitments. Information about the Company’s net long TBA positions as of December 31, 2015 is as follows (dollars in thousands):
| Notional Amount: Net Long (Short) Position (1) | Implied Cost Basis (2) | Implied Fair Value (3) | Net Carrying Amount (4) | |||||||||||||
| 30-year 3.5% coupon | $ | 275,000 | $ | 283,928 | $ | 283,469 | $ | (459 | ) | |||||||
| 30-year 4.0% coupon | 100,000 | 105,883 | 105,789 | (94 | ) | |||||||||||
| Total | $ | 375,000 | $ | 389,811 | $ | 389,258 | $ | (553 | ) | |||||||
| 39 |
| (1) | “Notional amount” represents the unpaid principal balance of the underlying agency MBS. |
| (2) | “Implied cost basis” represents the contractual forward price for the underlying agency MBS. |
| (3) | “Implied fair value” represents the current fair value of the underlying agency MBS. |
| (4) | “Net carrying amount” represents the difference between the implied cost basis and the current fair value of the underlying MBS. This amount is reflected on the Company’s consolidated balance sheets as “derivative liabilities, at fair value.” |
Private-Label MBS Investment Portfolio
Our private-label MBS, excluding our interest-only MBS, consisted of the following as of December 31, 2015 (dollars in thousands):
| Face Amount | Discount | Amortized Cost | Gross Unrealized | Fair Value | Coupon | Yield | ||||||||||||||||||||||||
| Gains | Losses | |||||||||||||||||||||||||||||
| $ | 169,757 | $ | (55,031 | ) | $ | 114,726 | $ | 15,751 | $ | (42 | ) | $ | 130,435 | 3.03 | % | 9.78 | % | |||||||||||||
As of December 31, 2015, the private-label MBS portfolio consists almost entirely of “re-REMIC” securities. Our investments in re-REMIC securities represent “mezzanine” interests in underlying, re-securitized senior class MBS issued by private-label REMIC securitization trusts. The senior class REMIC securities that serve as collateral to our investments in re-REMIC securities represent beneficial interests in pools of prime or Alt-A residential mortgage loan collateral that hold the first right to cash flows and absorb credit losses only after their respective subordinate REMIC classes have been fully extinguished. The majority of the trusts that issued our investments in re-REMIC securities employ a “sequential” principal repayment structure, while a minority of the issuing trusts employ a “pro-rata” principal repayment structure. Accordingly, the majority of our mezzanine class re-REMIC securities are not entitled to receive principal repayments until the principal balance of the senior interest in the respective collateral group has been reduced to zero. Principal shortfalls are allocated on a “reverse sequential” basis. Accordingly, any principal shortfalls on the underlying senior class REMIC securities are first absorbed by our mezzanine class re-REMIC securities, to the extent of their respective principal balance, prior to being allocated to the senior interest in the respective collateral pool. Periodic interest is accrued on each re-REMIC security’s outstanding principal balance at its contractual coupon rate. Our private-label MBS have approximately 0.1% in remaining structural credit enhancement provided by collateral-level subordinate interests, on a weighted-average basis, which, in addition to the substantial discount to par value at which the securities were purchased, provides protection to our invested capital.
As of December 31, 2015, we had $37.2 million of outstanding repurchase agreement financing secured by $70.5 million of private-label MBS with a weighted-average cost of funding of 2.42%. During the year ended December 31, 2015, we received proceeds of $130.1 million from the sale of our private-label MBS, realizing $17.7 million in gains. During the year ended December 31, 2015, we purchased private-label MBS for $2.9 million with a face amount of $5.9 million.
Economic Hedging Instruments
The Company attempts to hedge a portion of its exposure to interest rate fluctuations associated with its agency MBS primarily through the use of interest rate derivatives. Specifically, these interest rate derivatives are intended to economically hedge changes, attributable to changes in benchmark interest rates, in agency MBS fair values and future interest cash flows on the Company’s short-term financing arrangements. As of December 31, 2015, the primary interest rate derivative instruments used by the Company were centrally cleared interest rate swap agreements and exchange-traded 10-year U.S. Treasury note futures.
| 40 |
The Company’s interest rate swap agreements, all of which were executed in the fourth quarter of 2015, represent agreements to make semiannual interest payments based upon a fixed interest rate and receive quarterly variable interest payments based upon the prevailing three-month LIBOR on the date of reset. Information about the Company’s outstanding centrally cleared interest rate swap agreements as of December 31, 2015 is as follows (dollars in thousands):
| December 31, 2015 | ||||||||||||||||
| Notional Amount | Average Fixed Pay Rate | Average Remaining Maturity (Years) | Fair Value | |||||||||||||
| Years to maturity: | ||||||||||||||||
| Less than 2 years | $ | 750,000 | 1.04 | % | 1.9 | $ | 1,166 | |||||||||
| 2 to 10 years | 750,000 | 2.12 | % | 9.9 | 4,987 | |||||||||||
| Total / weighted-average | $ | 1,500,000 | 1.58 | % | 5.9 | $ | 6,153 | |||||||||
The Company’s 10-year U.S. Treasury note futures are short positions that mature on a quarterly basis. Upon the maturity date of these futures contracts in March 2016, the Company has the option to either net settle each contract in cash in an amount equal to the difference between the then current fair value of the underlying 10-year U.S. Treasury note and the contractual sale price inherent to the futures contract, or to physically settle the contract by delivering the underlying 10-year U.S. Treasury note. The Company expects to net settle and “roll-forward” this hedge position on a quarterly basis, with any adjustments to the notional amount based on the changes in the Company’s agency MBS portfolio and related financing as well as the Company’s expectations of market conditions. Information about the Company’s outstanding 10-year U.S. Treasury note futures contracts as of December 31, 2015 is as follows (dollars in thousands):
| Maturity date | Notional Amount | Fair Value | ||||||
| March 2016 | $ | 1,335,000 | $ | 6,813 | ||||
Results of Operations
Net Interest Income
Net interest income consists of interest income on our MBS portfolio less interest expense on our short-term financing arrangements and long-term debt. Interest income for the Company’s agency MBS is based on the contractual coupon. Purchase premiums or discounts, if any, on our agency MBS portfolio are not amortized into interest income, but, instead, are a component of the fair value adjustments to the agency MBS portfolio recorded in “investment gain (loss), net.”
Interest income on the private-label MBS, which are generally purchased at a discount to face value, is recognized based on the security’s expected effective interest rate. At acquisition, the accretable yield is calculated as the difference between the undiscounted expected cash flows and the purchase price, which is expected to be accreted into interest income over the remaining life of the security on a level-yield basis. The difference between the contractually required payments and the undiscounted expected cash flows represents the non-accretable difference. Based on actual payment activities and changes in estimates of undiscounted expected future cash flows, the accretable yield and the non-accretable difference can change over time. Actual cash collections that exceed our prior estimates and/or positive changes in our periodic estimates of expected future cash flows increase the accretable yield and are recognized prospectively, through the use of a revised effective interest rate, as incremental interest income over the remaining life of the security.
The Company’s derivative instruments that are intended to economically hedge agency MBS and related borrowings are not designated as hedging instruments for financial reporting purposes. As a result, all gains and losses on these instruments are included as a component of “investment gain (loss), net” on the statement of comprehensive income, including any implied periodic economic financing costs.
| 41 |
Investment Gain (Loss), Net
“Investment gain (loss), net” primarily consists of periodic changes in the fair value (whether realized or unrealized) of investments in MBS classified as trading securities, periodic changes in the fair value (whether realized or unrealized) of derivative instruments, gains (losses) realized upon the sale of investments in MBS classified as available-for-sale, and OTTI charges for investments in MBS classified as available-for-sale.
Expenses
“Compensation and benefits expense” includes base salaries, annual incentive cash compensation and non-cash stock-based compensation. Salaries, payroll taxes and employee benefits are relatively fixed in nature. Annual incentive cash compensation is based on meeting estimated annual performance measures and discretionary components. Non-cash stock-based compensation includes expenses associated with all stock-based awards granted to employees, including the Company’s performance share units to named executive officers.
“Other expenses” primarily consists of the following:
| • | professional services expenses, including accounting, legal and consulting fees; |
| • | insurance expenses, including liability and property insurance; |
| • | occupancy and equipment expense, including rental costs for our facilities, and depreciation and amortization of equipment and software; |
| • | board of director fees; and |
| • | other operating expenses, including communication expenses, business development costs, printing and copying, business licenses and taxes, office supplies and other miscellaneous expenses. |
Comparison of the years ended December 31, 2015 and 2014
We reported a net loss of $69.4 million, or a loss of $3.02 per diluted share, for the year ended December 31, 2015 compared to net income of $7.8 million, or $0.38 per diluted share, for the year ended December 31, 2014, which included the following results for the periods indicated (dollars in thousands, except per share amounts):
| Year Ended December 31, | ||||||||
| 2015 | 2014 | |||||||
| Interest income | $ | 154,593 | $ | 123,547 | ||||
| Interest expense | 18,889 | 11,391 | ||||||
| Net interest income | 135,704 | 112,156 | ||||||
| Investment loss, net | (152,379 | ) | (38,687 | ) | ||||
| Other expenses | 14,167 | 18,069 | ||||||
| (Loss) income before income taxes | (30,842 | ) | 55,400 | |||||
| Income tax provision | 38,561 | 47,647 | ||||||
| Net (loss) income | (69,403 | ) | 7,753 | |||||
| Other comprehensive loss, net of taxes | (23,501 | ) | (10,397 | ) | ||||
| Comprehensive loss | $ | (92,904 | ) | $ | (2,644 | ) | ||
| Diluted (loss) earnings per share | $ | (3.02 | ) | $ | 0.38 | |||
| Weighted-average diluted shares outstanding | 23,002 | 20,397 | ||||||
| 42 |
Net Interest Income
Net interest income increased $23.5 million, or 21%, from $112.2 million for the year ended December 31, 2014 to $135.7 million for the year ended December 31, 2015. The increase is due primarily to a $29.8 million increase due to a change in volume (average balance) offset by a $4.3 million decrease due to a change in net rate on our principal investing activities as discussed below. The increase in the average balance of our agency MBS is primarily the result of deploying our investable capital generated from the capital raised from our public equity offerings in 2014 and public debt offering in 2015 as well as reinvesting proceeds from the sale of private-label MBS into agency MBS on a levered basis. See additional yield analysis below.
The components of net interest income from our MBS portfolio, excluding interest expense on unsecured long-term debt, are summarized in the following table (dollars in thousands):
| Year Ended December 31, | ||||||||||||||||||||||||
| 2015 | 2014 | |||||||||||||||||||||||
| Average Balance | Income (Expense) | Yield (Cost) | Average Balance | Income (Expense) | Yield (Cost) | |||||||||||||||||||
| Agency MBS | $ | 3,736,876 | $ | 139,244 | 3.73 | % | $ | 2,590,460 | $ | 97,900 | 3.78 | % | ||||||||||||
| Private-label MBS | 159,667 | 15,322 | 9.60 | % | 253,953 | 25,597 | 10.08 | % | ||||||||||||||||
| Other investments | 186 | 19 | 10.43 | % | 258 | 27 | 10.48 | % | ||||||||||||||||
| $ | 3,896,729 | 154,585 | 3.97 | % | $ | 2,844,671 | 123,524 | 4.34 | % | |||||||||||||||
| Other (1) | 8 | 23 | ||||||||||||||||||||||
| 154,593 | 123,547 | |||||||||||||||||||||||
| Repurchase agreements | $ | 3,390,402 | (14,319 | ) | (0.42 | )% | $ | 2,438,479 | (9,181 | ) | (0.37 | )% | ||||||||||||
| FHLB advances | 126,428 | (382 | ) | (0.30 | )% | — | — | — | ||||||||||||||||
| $ | 3,516,830 | (14,701 | ) | (0.42 | )% | $ | 2,438,479 | (9,181 | ) | (0.37 | )% | |||||||||||||
| Net interest income/spread | $ | 139,892 | 3.55 | % | $ | 114,366 | 3.97 | % | ||||||||||||||||
| (1) | Includes interest income on cash and other miscellaneous interest-earning assets. |
The effects of changes in the composition of our investments on our net interest income are summarized below (dollars in thousands):
| Year Ended December 31, 2015 vs. Year Ended December 31, 2014 | ||||||||||||
| Rate (1) | Volume (1) | Total Change | ||||||||||
| MBS: | ||||||||||||
| Agency MBS | $ | (1,392 | ) | $ | 42,736 | $ | 41,344 | |||||
| Private-label MBS | (1,201 | ) | (9,074 | ) | (10,275 | ) | ||||||
| Total MBS | (2,593 | ) | 33,662 | 31,069 | ||||||||
| Other interest | — | (23 | ) | (23 | ) | |||||||
| Repurchase agreements | (1,683 | ) | (3,455 | ) | (5,138 | ) | ||||||
| FHLB advances | — | (382 | ) | (382 | ) | |||||||
| $ | (4,276 | ) | $ | 29,802 | $ | 25,526 | ||||||
| (1) | The change in interest income and interest expense due to both rate and volume has been allocated to rate and volume changes in proportion to the relationship of the absolute dollar amounts of the change in each. |
| 43 |
The increase in net interest income from our MBS portfolio of $25.5 million from $114.4 million for the year ended December 31, 2014 to $139.9 million for the year ended December 31, 2015 is primarily due to the increase in our agency MBS portfolio as discussed above. The decrease in yield in the overall MBS portfolio is primarily related to the decrease in the higher yielding unlevered private-label MBS portfolio from the prior period. Interest income from other investments represents interest on interest-only MBS.
Interest expense on short-term debt, which relates to repurchase agreements and FHLB advances, increased $5.5 million, or 59.8%, to $14.7 million for the year ended December 31, 2015 from $9.2 million for the year ended December 31, 2014 due primarily to the increase in such borrowings. Our short-term debt increased primarily as a result of leveraging the net proceeds raised from our public equity offerings in 2014, public debt offering in 2015 and sales of private-label MBS into purchases of new agency MBS on a levered basis.
Interest expense related to long-term debt was $4.2 million and $2.2 million for the years ended December 31, 2015 and 2014, respectively. The increase in interest expense on long-term debt is attributable to the issuance of $35.3 million of senior notes in March 2015.
Investment Loss, Net
“Total investment loss, net” increased $113.7 million from a loss of $38.7 million for the year ended December 31, 2014 to a loss of $152.4 million for the year ended December 31, 2015. The increase in “total investment loss, net” is primarily the result of greater MBS spread widening within the year ended December 31, 2015 relative to the comparative period from 2014, which resulted in the recognition of net losses on interest rate derivative instruments (intended to economically hedge our interest rate risk) that exceeded the net gains recognized on our agency MBS investments and TBA transactions, as illustrated in the table to follow (dollars in thousands):
| Year Ended December 31, | ||||||||
| 2015 | 2014 | |||||||
| Realized gains on sale of available-for-sale investments, net | $ | 17,725 | $ | 17,257 | ||||
| OTTI charges on available-for-sale securities | (2,417 | ) | (449 | ) | ||||
| (Losses) gains on trading investments, net | (64,388 | ) | 84,152 | |||||
| Gains from commitments to purchase and sell MBS, net | 1,684 | 5,778 | ||||||
| Accrual of periodic settlements, net on interest rate swaps (1) | (1,282 | ) | — | |||||
| Other losses from interest rate derivative instruments, net | (105,751 | ) | (146,131 | ) | ||||
| Other, net | 2,050 | 706 | ||||||
| Investment loss, net | $ | (152,379 | ) | $ | (38,687 | ) | ||
| (1) | Represents the periodic net interest settlement incurred during the period (often referred to as "net interest carry"). |
The Company’s available-for-sale investments substantially consist of the Company’s private-label MBS acquired prior to 2015. The realized gains on sale of available-for-sale investments, net, recognized for the years ended December 31, 2015 and 2014 were primarily the result of $130.1 million and $86.3 million of proceeds received, respectively, from the sales of private-label MBS resulting in a realized gain of $17.7 million and $17.3 million, respectively.
We recorded OTTI charges of $2.4 million and $0.4 million for the years ended December 31, 2015 and 2014, respectively, on available-for-sale, private-label MBS. OTTI charges represent the excess of the amortized cost basis over the net present value of expected future cash flows discounted using the current yield used for interest income recognition.
| 44 |
The Company’s trading investments primarily consist of agency MBS. The $64.4 million of losses on trading investments, net, recognized for the year ended December 31, 2015 were primarily the result of net mark-to-market unrealized loss adjustments as well as net realized losses from sales of trading investments. The key drivers in the net losses for trading investments for the year ended December 31, 2015 were (i) increases in long-term interest rates, (ii) MBS spread widening, and (iii) the implied amortization of net purchase premiums. As long-term interest rates rise, the price of fixed-rate agency MBS generally declines. During the year ended December 31, 2015, the 10-year U.S. Treasury rate increased by 10 basis points. Also, MBS mortgage spreads widened during the year ended December 31, 2015, driving the prices of agency MBS lower. For example, the Fannie Mae 4.0% 30-year OAS widened approximately 36 basis points during the year ended December 31, 2015. Purchase premiums or discounts on our trading agency MBS are not amortized into interest income, but instead are a component of the fair value adjustments included in gains (losses) on trading investments, net.
The $84.2 million of gains on trading investments, net, recognized for the year ended December 31, 2014 were the result of net mark-to-market unrealized gain adjustments as well as net realized gains from sales of trading investments. The key drivers in the net gains for trading investments for the year ended December 31, 2014 were (i) decreases in long-term interest rates and (ii) modest MBS spread narrowing, partially offset by (iii) the implied amortization of net purchase premiums. During the year ended December 31, 2014, the 10-year U.S. Treasury rate decreased by 87 basis points.
Commitments to purchase and sell MBS consist primarily of forward TBA purchases and sales. The Company generally utilizes TBA dollar roll transactions to finance agency MBS purchases and may also, from time to time, enter into TBA contracts as a means of acquiring and disposing of agency MBS. The Company recognized net gains from commitments to purchase and sell MBS of $1.7 million and $5.8 million for the years ended December 31, 2015 and 2014, respectively, which consists of both “dollar roll income” and mark-to-market gains and losses on the TBA transactions.
The Company’s interest rate derivative instruments consist primarily of interest rate swaps, Eurodollar futures, interest rate swap futures and U.S. Treasury note futures. While the Company uses its interest rate derivatives to economically hedge a portion of its interest rate risk, it has not designated such contracts as hedging instruments for financial reporting purposes. As a result, the implied economic financing costs of the Company’s interest rate derivatives are included in the change in value of the instruments recognized in “investment gain (loss), net.” During periods of falling interest rates, the Company will generally experience losses on its interest rate derivative instruments and during periods of rising interest rates, the Company will generally experience gains on its interest rate derivative instruments.
The $107.0 million of losses from interest rate derivative instruments, net, recognized for the year ended December 31, 2015 were the result of net realized and unrealized mark-to-market adjustments. The key drivers in the net losses for interest rate derivatives for the year ended December 31, 2015 were (i) the implied economic financing costs of the interest rate derivatives and (ii) the volatility of interest rates during the year. Although interest rates increased modestly from December 31, 2014 to December 31, 2015, there was significant volatility in interest rates during the year. The $146.1 million of losses from interest rate derivative instruments, net, recognized for the year ended December 31, 2014 were the result of net realized and unrealized mark-to-market adjustments. The key drivers in the net losses for interest rate derivatives for the year ended December 31, 2014 were (i) the implied economic financing costs of the interest rate derivatives and (ii) a decline in interest rates during the year.
The value of our hedging instruments is expected to fluctuate inversely relative to the change in value of the agency MBS portfolio. However, the degree of correlation between price movements of our hedging instruments and price movements of our agency MBS portfolio may vary. While our hedging instruments are designed to protect our agency MBS portfolio from interest rate risk, they are not generally designed to protect our net book value from spread risk, which is the risk of an increase of the market spread between the yield on our agency MBS and the benchmark yield on U.S. Treasury securities or interest rate swaps.
| 45 |
Other Expenses
Other expenses decreased by $3.9 million, or 21.5%, from $18.1 million for the year ended December 31, 2014 to $14.2 million for the year ended December 31, 2015, primarily due to a decrease in annual cash incentive compensation and long-term stock incentive compensation costs. The Company recognized $0.6 million in stock-based compensation expense for the year ended December 31, 2015 as compared $3.4 million in stock-based compensation expense for the year ended December 31, 2014. The decrease in stock-based compensation is primarily due to not achieving the performance measurements for certain of the Company’s performance share units granted to executive officers. As a result of not meeting certain performance measurements, the compensation expense for the year ended December 31, 2015 included a reversal of $1.5 million of expense recognized in prior years due to a reduction in the expected number of performance share units expected to vest.
Income Tax Provision
The Company’s income tax provision was $38.6 million and $47.6 million for the years ended December 31, 2015 and 2014, respectively. The income tax provision for the years ended December 31, 2015 and 2014 includes an increase in the valuation allowance against the deferred tax assets of $56.4 million and $24.2 million, respectively, primarily from net capital losses generated during the period. The net capital losses for the years ended December 31, 2015 and 2014 were attributable primarily to realized and unrealized losses on certain of the Company’s hedging instruments. The Company’s valuation allowance represents the portion of the Company’s net capital loss carryforward that is more-likely-than-not to expire unutilized.
Other Comprehensive Income (Loss)
Other comprehensive income (loss) includes current unrealized gains (losses) for mark-to-market changes in the Company’s available-for-sale MBS portfolio as well as reclassifications related to the reversal of prior period unrealized gains or losses upon realization for either a sale or repayment of available-for-sale MBS or OTTI charge on available sale-for-sale MBS. Other comprehensive loss was $23.5 million and $10.4 million, net of taxes, for the years ended December 31, 2015 and 2014, respectively. For the year ended December 31, 2015, other comprehensive loss included net unrealized mark-to-market losses of $11.3 million on the available-for-sale MBS portfolio, net of a tax benefit of $4.3 million, and a $20.6 million reversal of prior period net unrealized gains upon the sale or OTTI charge of available-for-sale MBS, net of a tax benefit of $4.2 million. For the year ended December 31, 2014, other comprehensive loss included net unrealized mark-to-market gains of $1.6 million on the available-for-sale MBS portfolio, net of a tax provision of $0.6 million, and $16.7 million of reversal of prior period net unrealized gains upon the sale or OTTI charge of available-for-sale MBS, net of a tax benefit of $5.3 million.
Comparison of the years ended December 31, 2014 and 2013
We reported net income of $7.8 million, or $0.38 per diluted share, for the year ended December 31, 2014 compared to net income of $52.8 million, or $3.26 per diluted share, for the year ended December 31, 2013, which included the following results for the periods indicated (dollars in thousands, except per share amounts):
| Year Ended December 31, | ||||||||
| 2014 | 2013 | |||||||
| Interest income | $ | 123,547 | $ | 87,019 | ||||
| Interest expense | 11,391 | 8,529 | ||||||
| Net interest income | 112,156 | 78,490 | ||||||
| Investment loss, net | (38,687 | ) | (47,760 | ) | ||||
| Other expenses | 18,069 | 16,591 | ||||||
| Income before income taxes | 55,400 | 14,139 | ||||||
| Income tax provision (benefit) | 47,647 | (38,684 | ) | |||||
| Net income | 7,753 | 52,823 | ||||||
| Other comprehensive loss (income), net of taxes | (10,397 | ) | 11,743 | |||||
| Comprehensive (loss) income | $ | (2,644 | ) | $ | 64,566 | |||
| Diluted earnings per share | $ | 0.38 | $ | 3.26 | ||||
| Weighted-average diluted shares outstanding | 20,397 | 16,189 | ||||||
| 46 |
Net Interest Income
Net interest income increased $33.7 million, or 42.9%, from $78.5 million for the year ended December 31, 2013 to $112.2 million for the year ended December 31, 2014. The increase is due primarily to a $34.7 million increase due to a change in volume (average balance) offset by a $0.4 million decrease due to a change in net rate on our principal investing activities as discussed below. The increase in the average balance of our agency MBS is primarily the result of deploying our investable capital generated from the capital raised from our public equity offerings in 2014 and 2013 as well as reinvesting proceeds from the sale of private-label MBS into agency MBS on a levered basis. See additional yield analysis below.
The components of net interest income from our MBS portfolio, excluding interest expense on unsecured long-term debt, are summarized in the following table (dollars in thousands):
| Year Ended December 31, | ||||||||||||||||||||||||
| 2014 | 2013 | |||||||||||||||||||||||
| Average Balance | Income (Expense) | Yield (Cost) | Average Balance | Income (Expense) | Yield (Cost) | |||||||||||||||||||
| Agency MBS | $ | 2,590,460 | $ | 97,900 | 3.78 | % | $ | 1,599,589 | $ | 60,386 | 3.78 | % | ||||||||||||
| Private-label MBS | 253,953 | 25,597 | 10.08 | % | 247,315 | 26,586 | 10.75 | % | ||||||||||||||||
| Other investments | 258 | 27 | 10.48 | % | 427 | 44 | 10.37 | % | ||||||||||||||||
| $ | 2,844,671 | 123,524 | 4.34 | % | $ | 1,847,331 | 87,016 | 4.71 | % | |||||||||||||||
| Other (1) | 23 | 3 | ||||||||||||||||||||||
| 123,547 | 87,019 | |||||||||||||||||||||||
| Repurchase agreements | $ | 2,438,479 | (9,181 | ) | (0.37 | )% | $ | 1,515,137 | (6,899 | ) | (0.45 | )% | ||||||||||||
| Net interest income/spread | $ | 114,366 | 3.97 | % | $ | 80,120 | 4.26 | % | ||||||||||||||||
(1) Includes interest income on cash and other miscellaneous interest-earning assets.
The increase in net interest income from our MBS portfolio of $34.3 million from $80.1 million from the year ended December 31, 2013 to $114.4 million for the year ended December 31, 2014 is primarily due to the increase in our agency MBS portfolio as discussed above. The decrease in yield in the overall MBS portfolio is primarily related to the decrease in the higher yielding unlevered private-label MBS portfolio from the prior period. Interest income from other investments represents interest on interest-only MBS.
The effects of changes in the composition of our investments on our net interest income are summarized below (dollars in thousands):
| Year Ended December 31, 2014 vs. Year Ended December 31, 2013 | ||||||||||||
| Rate (1) | Volume (1) | Total Change | ||||||||||
| MBS | ||||||||||||
| Agency MBS | $ | 66 | $ | 37,448 | $ | 37,514 | ||||||
| Private-label MBS | (1,424 | ) | 435 | (989 | ) | |||||||
| Total MBS | (1,358 | ) | 37,883 | 36,525 | ||||||||
| Other interest | — | 3 | 3 | |||||||||
| Repurchase agreements | 930 | (3,212 | ) | (2,282 | ) | |||||||
| $ | (428 | ) | $ | 34,674 | $ | 34,246 | ||||||
| 47 |
| (1) | The change in interest income and interest expense due to both rate and volume has been allocated to rate and volume changes in proportion to the relationship of the absolute dollar amounts of the change in each. |
Interest expense on short-term debt, which relates to repurchase agreements, increased $2.3 million, or 33.3%, to $9.2 million for the year ended December 31, 2014 from $6.9 million for the year ended December 31, 2013 due primarily to the increase in such borrowings. Our short-term debt increased primarily as a result of leveraging the net proceeds raised from our public equity offerings in 2014 and 2013 and sales of private-label MBS into purchases of new agency MBS on a levered basis.
Interest expense related to long-term debt was $2.2 million and $1.6 million for the years ended December 31, 2014 and 2013, respectively. The increase in interest expense on long-term debt is attributable to the issuance of $25.0 million of Senior Notes in May 2013.
Investment Loss, Net
“Total investment loss, net” decreased $9.1 million from a loss of $47.8 million for the year ended December 31, 2013 to a loss of $38.7 million for the year ended December 31, 2014. The decrease in “total investment loss, net” is primarily the result of greater MBS spread widening within the year ended December 31, 2014 relative to the comparative period from 2013, which resulted in the recognition of net losses on interest rate derivative instruments (intended to economically hedge our interest rate risk) that exceeded the net gains recognized on our agency MBS investments and TBA transactions, as illustrated in the table to follow (dollars in thousands):
| Year Ended December 31, | ||||||||
| 2014 | 2013 | |||||||
| Realized gains on sale of available-for-sale investments, net | $ | 17,257 | $ | 17,458 | ||||
| OTTI charges on available-for-sale securities | (449 | ) | (1,354 | ) | ||||
| Gains (losses) on trading investments, net | 84,152 | (122,163 | ) | |||||
| Gains from commitments to purchase and sell MBS, net | 5,778 | 1,730 | ||||||
| (Losses) gains from interest rate derivative instruments, net | (146,131 | ) | 56,273 | |||||
| Other, net | 706 | 296 | ||||||
| Investment loss, net | $ | (38,687 | ) | $ | (47,760 | ) | ||
The Company’s available-for-sale investments substantially consist of the Company’s private-label MBS acquired prior to 2014. The realized gains on sale of available-for-sale investments, net, recognized for the years ended December 31, 2014 and 2013 were primarily the result of $86.3 million and $69.3 million of proceeds received, respectively, from the sales of private-label MBS resulting in a realized gain of $17.3 million and $17.5 million, respectively.
We recorded OTTI charges of $0.4 million and $1.3 million for the years ended December 31, 2014 and 2013, respectively, on available-for-sale, private-label MBS. OTTI charges represent the excess of the amortized cost basis over the net present value of expected future cash flows discounted using the current yield used for interest income recognition.
The Company’s trading investments primarily consist of agency MBS. The $84.2 million of gains on trading investments, net, recognized for the year ended December 31, 2014 were the result of net mark-to-market unrealized gain adjustments as well as net realized gains from sales of trading investments. The key drivers in the net gains for trading investments for the year ended December 31, 2014 were (i) decreases in long-term interest rates and (ii) modest MBS spread narrowing, partially offset by (iii) the implied amortization of net purchase premiums. Purchase premiums or discounts on our trading agency MBS are not amortized into interest income, but instead are a component of the fair value adjustments included in gains (losses) on trading investments, net. The $122.2 million of losses on trading investments, net, recognized for the year ended December 31, 2013 were the result of net mark-to-market unrealized loss adjustments as well as net realized losses from sales of trading investments. The key drivers in the net losses for trading investments for the year ended December 31, 2013 were (i) increases in long-term interest rates, and (ii) the implied amortization of net purchase premiums.
| 48 |
Commitments to purchase and sell MBS consist primarily of forward TBA purchases and sales. The Company generally utilizes TBA dollar roll transactions to finance agency MBS purchases and may also, from time to time, enter into TBA contracts as a means of acquiring or disposing of agency MBS. The Company recognized net gains from commitments to purchase and sell MBS of $5.8 million and $1.7 million for the years ended December 31, 2014 and 2013, respectively, which consists of both “dollar roll income” and mark-to-market gains and losses on the TBA transactions.
The Company’s interest rate derivative instruments consisted primarily of Eurodollar futures, interest rate swap futures and U.S. Treasury note futures. During periods of falling interest rates, the Company will generally experience losses on its interest rate derivative instruments and during periods of rising interest rates, the Company will generally experience gains on its interest rate derivative instruments. The $146.1 million of losses from interest rate derivative instruments, net, recognized for the year ended December 31, 2014 were the result of net realized and unrealized mark-to-market adjustments. The key drivers in the net losses for interest rate derivatives for the year ended December 31, 2014 were (i) a decline in interest rates during the year, and (ii) the implied economic financing costs of the interest rate derivatives. The $56.3 million of gains from interest rate derivative instruments, net, recognized for the year ended December 31, 2013 were the result of net realized and unrealized mark-to-market adjustments. The key drivers in the net gains for interest rate derivatives for the year ended December 31, 2014 were (i) the increase in interest rates during the year, partially offset by (ii) the implied economic financing costs of the interest rate derivatives.
Other Expenses
Other expenses increased by $1.5 million, or 9.0%, from $16.6 million for the year ended December 31, 2013 to $18.1 million for the year ended December 31, 2014, primarily due to increases in expenses for compensation and benefits offset by a decrease in legal expenses.
Income Tax Provision (Benefit)
The Company’s income tax provision (benefit) was $47.6 million and $(38.7) million for the years ended December 31, 2014 and 2013, respectively. The income tax provision for the year ended December 31, 2014 includes an increase in the valuation allowance against the deferred tax assets of $24.2 million primarily from net capital losses generated during the period. The net capital losses for the year ended December 31, 2014 were attributable primarily to realized and unrealized losses on certain of the Company’s hedging instruments. The Company’s valuation allowance represents the portion of the Company’s net capital loss carryforward that is more-likely-than-not to expire unutilized. The income tax benefit for the year ended December 31, 2013 includes the effect of a release of the valuation allowance against the deferred tax assets of $91.2 million as well as a write-off of deferred tax assets of $56.3 million related to expiring capital loss carry-forwards.
Other Comprehensive Income (Loss)
Other comprehensive income includes periodic unrealized holding gains and losses related to the Company’s investments in available-for-sale MBS as well as the reversal and reclassification of prior unrealized holding gains and losses to net income as a component of “investment gain (loss), net” upon the sale or repayment of available-for-sale MBS or the occurrence of an OTTI charge on available-for-sale MBS. Other comprehensive income (loss) was $(10.4) million and $11.7 million for the years ended December 31, 2014 and 2013, respectively. For the year ended December 31, 2014, other comprehensive loss included net unrealized mark-to-market gains of $1.6 million on the available-for-sale MBS portfolio, net of a tax provision of $0.6 million, and $16.7 million of reversal of prior period net unrealized gains upon the sale or OTTI charge of available-for-sale MBS, net of a tax benefit of $5.3 million. For the year ended December 31, 2013, other comprehensive loss included net unrealized mark-to-market gains of $36.7 million on the available-for-sale MBS portfolio, net of a tax provision of $14.3 million, and $13.5 million of reversal of prior period net unrealized gains upon the sale or OTTI charge of available-for-sale MBS, net of a tax benefit of $2.8 million.
| 49 |
Liquidity and Capital Resources
Liquidity is a measurement of our ability to meet potential cash requirements including ongoing commitments to repay borrowings, fund investments, meet margin calls on our short-term borrowings and hedging instruments, and for other general business purposes. Our primary sources of funds for liquidity consist of existing cash balances, short-term borrowings (e.g., repurchase agreements), principal and interest payments on MBS and proceeds from sales of MBS. Other sources of liquidity include proceeds from the offering of common stock, preferred stock, debt securities or other securities registered pursuant to our effective shelf registration statement filed with the SEC.
Liquidity, or ready access to funds, is essential to our business. Perceived liquidity issues may affect our counterparties’ willingness to engage in transactions with us. Our liquidity could be impaired due to circumstances that we may be unable to control, such as a general market disruption or an operational problem that affects us or third parties. Further, our ability to sell assets may be impaired if other market participants are seeking to sell similar assets at the same time. If we cannot obtain funding from third parties or from our subsidiaries, our results of operations could be negatively impacted.
As of December 31, 2015, our debt-to-equity leverage ratio was 7.6 to 1. The Company’s “at risk” leverage ratio, measured as the ratio of the Company’s total debt plus net payable for unsettled securities to the Company’s stockholders’ equity excluding the net deferred tax asset, was 9.6 to 1 as of December 31, 2015.
Sources of Funding
We believe that our existing cash balances, net investments in MBS, cash flows from operations, borrowing capacity and other sources of liquidity will be sufficient to meet our cash requirements for at least the next twelve months. We may, however, seek debt or equity financings, in public or private transactions, to provide capital for corporate purposes and/or strategic business opportunities, including possible acquisitions, joint ventures, alliances or other business arrangements which could require substantial capital outlays. Our policy is to evaluate strategic business opportunities, including acquisitions and divestitures, as they arise. There can be no assurance that we will be able to generate sufficient funds from future operations, or raise sufficient debt or equity on acceptable terms, to take advantage of investment opportunities that become available. Should our needs ever exceed these sources of liquidity, we believe that most of our investments could be sold, in most circumstances, to provide cash. However, we may be required to sell our assets in such instances at depressed prices.
To gain additional flexibility in accessing capital markets for, among other things, the acquisition of MBS and other assets, the repayment of outstanding indebtedness, the pursuit of growth initiatives that may include acquisitions, working capital, and for liquidity needs, we filed a shelf registration statement on Form S-3 (File No. 333-193478) with the SEC (the “2014 Shelf Registration”) that was declared effective by the SEC on February 5, 2014. The 2014 Shelf Registration statement permits us to issue and publicly distribute various types of securities, including Class A common stock, preferred stock, debt securities, warrants and units, or any combination of such securities, from time to time, in one or more offerings, up to an aggregate amount of $750.0 million with a remaining availability of $543.5 million as of December 31, 2015.
As of December 31, 2015, liquid assets consisted primarily of cash and cash equivalents of $37.0 million and net investments in MBS of $374.1 million. The Company’s net investments in MBS is calculated as the sum of the Company’s total MBS investments at fair value and receivable for sold MBS, less the sum of the repurchase agreements and FHLB advances outstanding and payable for purchased MBS. The $374.1 million net investment in MBS includes $59.9 million of unpledged private-label MBS.
| 50 |
Debt Capital
Long-Term Debt
As of December 31, 2015, we had $75.3 million of total long-term debt. Our trust preferred debt with a principal amount of $15.0 million outstanding as of December 31, 2015 accrues and requires payment of interest quarterly at annual rates of three-month LIBOR plus 2.25% to 3.00% and matures between 2033 and 2035. Our 6.625% Senior Notes due 2023 with a principal amount of $25.0 million outstanding as of December 31, 2015 accrue and require payment of interest quarterly at an annual rate of 6.625% and mature on May 1, 2023. Our 6.75% Senior Notes due 2025 with a principal amount of $35.3 million outstanding as of December 31, 2015 accrue and require payment of interest quarterly at an annual rate of 6.75% and mature on March 15, 2025.
Repurchase Agreements
We have short-term financing facilities that are structured as repurchase agreements with various financial institutions to fund our investments in MBS. We have obtained, and believe we will be able to continue to obtain, short-term financing in amounts and at interest rates consistent with our financing objectives. Funding for MBS through repurchase agreements continues to be available to us at rates we consider to be attractive from multiple counterparties.
During 2015, as part of our continuous effort to further expand our funding sources to increase liquidity, flexibility, and profitability, we completed the steps necessary to begin executing repurchase agreements directly with cash lenders rather than through a broker/dealer intermediary. We executed our first direct repurchase agreement borrowing during the fourth quarter of 2015. In addition to expanding our existing pool of funding sources, having the ability to execute repurchase agreements directly with cash lenders provides us with the potential for reduced funding costs and increased profitability by eliminating the “bid/ask spread” generally retained by the broker/dealer intermediary in a traditional repurchase agreement execution.
Our repurchase agreements include provisions contained in the standard master repurchase agreement as published by the Securities Industry and Financial Markets Association and may be amended and supplemented in accordance with industry standards for repurchase facilities. Our repurchase agreements include financial covenants, with which the failure to comply would constitute an event of default under the applicable repurchase agreement. Similarly, each repurchase agreement includes events of insolvency and events of default on other indebtedness as similar financial covenants. As provided in the standard master repurchase agreement as typically amended, upon the occurrence of an event of default or termination event, the applicable counterparty has the option to terminate all repurchase transactions under such counterparty’s repurchase agreement and to demand immediate payment of any amount due from us to the counterparty.
Under our repurchase agreements, we may be required to pledge additional assets to our repurchase agreement counterparties in the event the estimated fair value of the existing pledged collateral under such agreements declines and such lenders demand additional collateral (i.e., a margin call), which may take the form of additional securities or cash. Margin calls on repurchase agreements collateralized by our MBS investments primarily result from events such as declines in the value of the underlying mortgage collateral caused by factors such as rising interest rates or prepayments. Our repurchase agreements generally provide that valuations for MBS securing our repurchase agreements are to be obtained from a generally recognized source agreed to by both parties. However, in certain circumstances and under certain of our repurchase agreements, our lenders have the sole discretion to determine the value of the MBS securing our repurchase agreements. In such instances, our lenders are required to act in good faith in making determinations of value. Our repurchase agreements generally provide that in the event of a margin call, we must provide additional securities or cash on the same business day that a margin call is made if the lender provides us notice prior to the margin notice deadline on such day.
To date, we have not had any margin calls on our repurchase agreements that we were not able to satisfy with either cash or additional pledged MBS collateral. However, should we encounter increases in interest rates or prepayments, margin calls on our repurchase agreements could result in a material adverse change in our liquidity position.
| 51 |
Our repurchase agreements generally mature within 30 to 90 days, but may have maturities as short as one day and as long as one year. In the event that market conditions are such that we are unable to continue to obtain repurchase agreement financing for our investments in MBS in amounts and at interest rates consistent with our financing objectives, we may liquidate such investments and may incur significant losses on any such sales of MBS.
The following table provides information regarding our outstanding repurchase agreement borrowings as of dates and periods indicated (dollars in thousands):
| December 31, 2015 | December 31, 2014 | |||||||
| Pledged with agency MBS: | ||||||||
| Repurchase agreements outstanding | $ | 2,797,561 | $ | 3,137,586 | ||||
| Agency MBS collateral, at fair value | 2,946,684 | 3,300,383 | ||||||
| Net amount (1) | 149,123 | 162,797 | ||||||
| Weighted-average rate | 0.61 | % | 0.38 | % | ||||
| Weighted-average term to maturity | 12.8 days | 14.0 days | ||||||
| Pledged with private-label MBS: | ||||||||
| Repurchase agreements outstanding | $ | 37,219 | $ | 42,189 | ||||
| Private-label MBS collateral, at fair value | 70,511 | 75,642 | ||||||
| Net amount (1) | 33,292 | 33,453 | ||||||
| Weighted-average rate | 2.42 | % | 1.98 | % | ||||
| Weighted-average term to maturity | 16.9 days | 21.8 days | ||||||
| Total MBS: | ||||||||
| Repurchase agreements outstanding | $ | 2,834,780 | $ | 3,179,775 | ||||
| MBS collateral, at fair value | 3,017,195 | 3,376,025 | ||||||
| Net amount (1) | 182,415 | 196,250 | ||||||
| Weighted-average rate | 0.64 | % | 0.40 | % | ||||
| Weighted-average term to maturity | 12.8 days | 14.1 days | ||||||
| Maximum amount outstanding at any month-end during the period | $ | 3,911,987 | $ | 3,183,811 | ||||
| (1) | Net amount represents the value of collateral in excess of corresponding repurchase obligation. The amount of collateral at-risk is limited to the outstanding repurchase obligation and not the entire collateral balance. |
To limit our exposure to counterparty risk, we diversify our repurchase agreement funding across multiple counterparties and by counterparty region. As of December 31, 2015, we had outstanding repurchase agreement balances with 16 counterparties and have master repurchase agreements in place with a total of 18 counterparties located throughout North America, Europe and Asia. As of December 31, 2015, less than 5% of our stockholders’ equity was at risk with any one counterparty, with the top five counterparties representing approximately 18% of our stockholders’ equity. The table below includes a summary of our repurchase agreement funding by number of counterparties and counterparty region as of December 31, 2015 (dollars in thousands):
| Number of Counterparties | Percent of Repurchase Agreement Funding | |||||||
| North America | 11 | 63.7 | % | |||||
| Europe | 2 | 15.8 | % | |||||
| Asia | 3 | 20.5 | % | |||||
| 16 | 100.0 | % | ||||||
| 52 |
Federal Home Loan Bank Advances
In September 2015, our wholly-owned captive insurance subsidiary, Key Bridge, was granted membership to the FHLBC. The FHLBC, like each of the 11 regional FHLBs, is a cooperative that provides its member financial institutions with a number of financial products and services, including short and long-term secured borrowings that are known as “advances.” FHLBC advances may be collateralized by a number of real estate related assets, including agency MBS. As a member of the FHLBC, Key Bridge is required to acquire membership stock as well as activity-based stock (the amount of which based is upon a percentage of the dollar amount of its outstanding advances) in the FHLBC. As of December 31, 2015, Key Bridge had acquired $15.7 million of capital stock in the FHLBC, which is included in “other assets” in the accompanying consolidated balance sheets. Similar to a repurchase agreement borrowing, we pledge agency MBS as collateral to secure the advance to Key Bridge, the amount of which is equal to a specified percentage of the fair value of the pledged collateral. We retain beneficial ownership of the pledged collateral throughout the term of the advance arrangement. The FHLBC may require that we pledge additional collateral to secure borrowings when the value of the collateral declines.
The following table provides information regarding the Company’s outstanding FHLB advances as of December 31, 2015 (dollars in thousands):
| December 31, 2015 | ||||
| Pledged with agency MBS: | ||||
| FHLB advances outstanding | $ | 786,900 | ||
| Agency MBS collateral, at fair value | 805,163 | |||
| Net amount (1) | 18,263 | |||
| Weighted-average rate | 0.36 | % | ||
| Weighted-average term to maturity | 11.6 days | |||
| (1) | Net amount represents the value of collateral in excess of corresponding FHLB advance. The amount of collateral at-risk is limited to the outstanding FHLB advance and not the entire collateral balance. |
On January 12, 2016, the regulator of the FHLB system, the FHFA, released a final rule that amends regulations governing FHLB membership, including an amendment which prevents captive insurance companies from being eligible for FHLB membership. Under the terms of the final rule, Key Bridge is required to terminate its membership and repay its existing advances within one year following the effective date of the final rule. In addition, Key Bridge is prohibited from obtaining new advances or renewing existing advances upon their maturity during the one year transition period. The final rule becomes effective on February 19, 2016. Subsequent to the release of the final rule, Key Bridge has repaid all of its outstanding FHLBC advances, funded primarily through proceeds obtained by the Company from traditional repurchase agreement financing arrangements.
Derivative Instruments
In the normal course of our operations, we are a party to financial instruments that are accounted for as derivative financial instruments including interest rate swaps, Eurodollar futures, interest rate swap futures, U.S. Treasury note futures, put options and forward TBA purchases and sales.
The Company exchanges collateral with the counterparties to its interest rate derivative instruments at least on a daily basis based upon daily changes in fair value (also known as “variation margin”) as measured by the central clearinghouse through which those derivatives are cleared. In addition, the central clearinghouse requires market participants to deposit and maintain an “initial margin” amount which is determined by the clearinghouse and is generally intended to be set at a level sufficient to protect the clearinghouse from the maximum estimated single-day price movement in that market participant’s contracts. The clearing exchanges have the sole discretion to determine the value of these derivative instruments. In the event of a margin call, we must generally provide additional collateral on the same business day. To date, we have not had any margin calls on our derivative agreements that we were not able to satisfy. However, if we encounter significant decreases in long-term interest rates, margin calls on our derivative agreements could result in a material adverse change in our liquidity position.
| 53 |
As of December 31, 2015, we had outstanding centrally cleared interest rate swaps and exchange-traded 10-year U.S. Treasury note futures with the following aggregate notional amount, net fair value and corresponding margin held in collateral deposit with the custodian (in thousands):
| December 31, 2015 | ||||||||||||
| Notional Amount | Net Fair Value | Collateral Deposit | ||||||||||
| Interest rate swaps | $ | 1,500,000 | $ | 6,153 | $ | 17,434 | ||||||
| 10-year U.S. Treasury note futures | 1,335,000 | 6,813 | 11,197 | |||||||||
Equity Capital
Share Repurchase Program
On October 26, 2015, the Board of Directors authorized an increase in the Company’s share repurchase program pursuant to which the Company may repurchase up to 2.0 million shares of its Class A common stock, which includes the 205,485 shares previously available to be repurchased under the prior share repurchase program established in July 2010.
During the year ended December 31, 2015, the Company repurchased 48,695 shares of its Class A common stock at an average price of $12.15 per share for a total cost of $0.6 million. As of December 31, 2015, 1,951,305 shares of Class A common stock remain available for repurchase under the repurchase program.
Equity Distribution Agreements
On May 24, 2013, we entered into separate equity distribution agreements (the “Equity Distribution Agreements”) with each of RBC Capital Markets, LLC, JMP Securities LLC, Ladenburg Thalmann & Co. Inc. and MLV & Co. LLC (the “Equity Sales Agents”), pursuant to which we may offer and sell, from time to time, up to 1,750,000 shares of the Company’s Class A common stock. Pursuant to the Equity Distribution Agreements, shares of our common stock may be offered and sold through the Equity Sales Agents in transactions that are deemed to be “at the market” offerings as defined in Rule 415 under the Securities Act of 1933, including sales made directly on the NYSE or sales made to or through a market maker other than on an exchange or, subject to the terms of a written notice from the Company, in privately negotiated transactions. As of December 31, 2015, we had not issued any shares of the Company’s Class A common stock under the Equity Distribution Agreements.
Dividends
Pursuant to our variable dividend policy, our Board of Directors evaluates on a quarterly basis and, in its sole discretion, approves the payment of dividends on our common stock. Our dividend payments, if any, may vary significantly quarter to quarter.
Cash Flows
As of December 31, 2015, our cash and cash equivalents totaled $37.0 million representing a net increase of $3.2 million from $33.8 million as of December 31, 2014. Cash provided by operating activities of $111.5 million during 2015 was attributable primarily to net interest income less our expenses. Our cash used in investing activities of $509.9 million during 2015 relates primarily to purchases of agency MBS and funding of deposits for margin calls on the Company’s interest rate hedges, partially offset by sales of agency and private-label MBS and the principal payments received on agency MBS. Our cash provided by financing activities of $401.5 million during 2015 relates primarily to net proceeds from repurchase agreements and FHLB advances used to finance a portion of the MBS portfolio and from proceeds from a completed public offering of debt securities, partially offset by dividend payments on common stock.
| 54 |
Contractual Obligations
We have contractual obligations to make future payments in connection with long-term debt and non-cancelable lease agreements and other contractual commitments. The following table sets forth these contractual obligations by fiscal year (in thousands):
| 2016 | 2017 | 2018 | 2019 | 2020 | Thereafter | Total | ||||||||||||||||||||||
| Long-term debt maturities | $ | — | $ | — | $ | — | $ | — | $ | — | $ | 75,300 | $ | 75,300 | ||||||||||||||
| Interest on long-term debt (1) | 4,500 | 4,500 | 4,500 | 4,500 | 4,500 | 20,481 | 42,981 | |||||||||||||||||||||
| Minimum rental commitments | 446 | 458 | 471 | 483 | 497 | — | 2,355 | |||||||||||||||||||||
| $ | 4,946 | $ | 4,958 | $ | 4,971 | $ | 4,983 | $ | 4,997 | $ | 95,781 | $ | 120,636 | |||||||||||||||
| (1) | Includes interest on (i) $25.0 million of Senior Notes due 2023 with a fixed annual interest rate of 6.625% that will mature on May 1, 2023 and (ii) $35.3 million of Senior Notes due 2025 with a fixed annual interest rate of 6.75% that will mature on March 15, 2025. Also includes interest on $15.0 million of trust preferred debt with variable interest rates indexed to three-month LIBOR and reset quarterly. Interest on trust preferred debt is based upon a weighted-average interest rate of 3.07%, which represents the weighted-average contractual interest rate in effect as of December 31, 2015. The trust preferred debt will mature beginning in October 2033 through July 2035. |
Off-Balance Sheet Arrangements and Other Commitments
From time to time in the ordinary course of our business, we may enter into contractual arrangements with third parties that include indemnification obligations of varying scope and terms. In addition, in the past, we have entered into indemnification agreements with certain of our current and former directors and officers under which we are generally required to indemnify them against liability incurred by them in connection with any action or proceeding to which they are or may be made a party by reason of their service in those or other capacities. Our charter and the Virginia Stock Corporation Act also generally require us to indemnify our directors and officers against any liability incurred by them in connection with any action or proceeding to which they are or may be made a party by reason of their service in those or other capacities, subject to certain exceptions. In the future we may be the subject of indemnification assertions under our charter, Virginia law or these indemnification agreements by our current or former directors and officers who are or may become party to any action or proceeding.
We maintain directors’ and officers’ insurance policies that may limit our exposure and enable us to recover a portion of any amounts paid with respect to such obligations. However, it is not possible to determine the maximum potential amount of exposure under these indemnification obligations due to the varying terms of such obligations, the limited history of prior indemnification claims, the unique facts and circumstances involved in connection with each particular contractual arrangement and each potential future claim for indemnification and the contingency of any potential liabilities upon the occurrence of events that are not reasonably determinable. Such indemnification agreements may not be subject to maximum loss clauses and the maximum potential amount of future payments we could be required to make under these indemnification obligations could be significant. See “Item 1A — Risk Factors” in this Annual Report on Form 10-K.
As of December 31, 2015, we did not maintain any relationships with unconsolidated entities or financial partnerships, such as entities often referred to as structured finance, or special purpose or variable interest entities, established for the purpose of facilitating off-balance sheet arrangements or other contractually narrow or limited purposes. Further, as of December 31, 2015, we had not guaranteed any obligations of unconsolidated entities or entered into any commitment or intent to provide funding to any such entities. See Note 14 to our consolidated financial statements under “Item 8 — Financial Statements and Supplementary Data.”
| 55 |
Critical Accounting Estimates
The preparation of financial statements in accordance with accounting principles generally accepted in the United States (“GAAP”) requires the Company to make estimates and assumptions that affect amounts reported in the consolidated financial statements. Although the Company bases these estimates and assumptions on historical experience and all other information available as of the time that the financial statements are prepared, such estimates frequently require management to exercise significant subjective judgment about matters that are inherently uncertain. Actual results may differ from these estimates, which could have a significant and potentially adverse effect on our financial condition, results of operations, and cash flows. A summary of our significant accounting policies is included in “Note 3. Summary of Significant Accounting Policies” in the Notes to Consolidated Financial Statements.
Our most critical accounting estimates, which are those accounting estimates that require the highest degree of management judgment due to the inherent level of estimation uncertainty, relate to the measurement of the fair value of our investments in MBS, the recognition of interest income from our investments in private-label MBS, and income taxes.
Fair Value of Investments in MBS
Investments in agency MBS — Inputs to fair value measurements of the Company’s investments in agency MBS include price estimates obtained from third-party pricing services. In determining fair value, third party pricing sources use various valuation approaches, including market and income approaches. The Company makes inquiries of the third party pricing sources to understand the significant inputs and assumptions used to determine prices. The Company reviews the various third-party fair value estimates and performs procedures to validate their reasonableness, including comparison to recent trading activity for similar securities and an overall review for consistency with market conditions observed as of the measurement date. Changes in the market environment that may occur over the holding period of our agency MBS investments may cause the gains or losses that are ultimately realized to differ from those currently recognized in our consolidated financial statements based upon their current valuations.
Investments in private-label MBS — Private-label MBS trade infrequently and, therefore, the measurement of their fair value requires the use of significant unobservable inputs. In determining fair value, the Company primarily utilizes present value techniques based on estimated cash flows of each instrument taking into consideration various assumptions derived by management based on their observations of assumptions used by market participants. These assumptions are corroborated by evidence such as historical collateral performance data, evaluation of historical collateral performance data for other securities with comparable or similar risk characteristics, and observed completed or pending transactions in similar instruments, when available. The significant inputs to the Company’s valuation process include collateral default, loss severity, prepayment, and discount rates (i.e., the rate of return demanded by market participants as of the measurement date). In general, significant increases (decreases) in default, loss severity, or discount rate assumptions, in isolation, would result in a significantly lower (higher) fair value measurement. However, significant increases (decreases) in prepayment rate assumptions, in isolation, may result in a significantly higher (lower) fair value measurement depending upon the instrument’s specific characteristics and the overall payment structure of the issuing securitization vehicle. It is difficult to generalize the interrelationships between these significant inputs as the actual results could differ considerably on an individual security basis. Therefore, each significant input is closely analyzed to ascertain its reasonableness for the Company’s purposes of fair value measurement.
The following table provides information about the significant unobservable inputs used to measure the fair value of the Company’s private-label MBS as of the dates indicated:
| 56 |
| December 31, 2015 | December 31, 2014 | |||||||||||||||
| Weighted- average (1) | Range | Weighted- average (1) | Range | |||||||||||||
| Discount rate | 5.57 | % | 5.50 – 10.00 | % | 5.55 | % | 5.15 – 10.00 | % | ||||||||
| Default rate | 2.78 | % | 1.45 – 6.20 | % | 3.09 | % | 1.00 – 8.80 | % | ||||||||
| Loss severity rate | 45.84 | % | 35.00 – 65.00 | % | 42.25 | % | 29.23 – 57.50 | % | ||||||||
| Prepayment rate | 11.02 | % | 7.75 – 17.70 | % | 11.23 | % | 7.40 – 17.70 | % | ||||||||
| (1) | Based on face value. |
The assumptions the Company applies are specific to each security. Although the Company relies on its internal calculations to estimate the fair value of these private-label MBS, the Company considers indications of value from actual sales of similar private-label MBS to assist in the valuation process and to calibrate our models.
Interest Income Recognition for Investments in Private-Label MBS
Interest income from our investments in private-label MBS is recognized using a prospective level-yield methodology which is based upon each security’s effective interest rate. The amount of periodic interest income recognized is determined by applying the security’s effective interest rate to its amortized cost basis or reference amount. At the time of acquisition, the security’s effective interest rate is calculated by solving for the single discount rate that equates the present value of our estimate of the amount and timing of the cash flows expected to be collected from the security to its purchase price. The difference between the undiscounted expected cash flows and the purchase price represents an accretable yield that is expected to be recognized as interest income over the remaining life of the security. The difference between the contractually required payments and the undiscounted expected cash flows represents the non-accretable difference. Based on actual payment activities and changes in the estimate of undiscounted expected future cash flows, the accretable yield and the non-accretable difference can change over time. Actual cash collections that exceed our prior estimates and/or positive changes in our periodic estimates of expected future cash flows increase the accretable yield and are recognized prospectively, through the use of a revised effective interest rate, as incremental interest income over the remaining life of the security.
To prepare our quarterly estimate of the amount and timing of remaining cash flows expected to be collected for each private-label MBS, we consider current information and events to develop a number of assumptions about the future performance of the pool of mortgage loans that serve as collateral for our investment, including assumptions about the timing and amount of prepayments and credit losses. These assumptions require a high degree of management judgment as they represent forecasts about future events for which the ultimate outcome is inherently uncertain. If our periodic estimates of future cash flows are higher than those actually received in future periods, we may recognize non-cash interest income over certain portions of the security’s holding period that exceeds the level of effective interest income that will ultimately be realized. In addition, as a result of upward revisions in a security’s effective interest rate, we may be subject to relatively more frequent other-than-temporary impairment charges that are cumulatively higher than actual losses ultimately realized on our investments in private-label MBS classified as available-for-sale.
Income Taxes
Deferred tax assets and liabilities reflect the impact of temporary differences between the carrying amount of assets and liabilities pursuant to the application of GAAP and their respective tax bases and are stated at tax rates expected to be in effect when the taxes are actually paid or recovered. Deferred tax assets are also recorded for net operating loss carry-forwards, net capital loss carry-forwards and any tax credit carry-forwards. We recognize the expected future tax benefit from a deferred tax asset when the tax benefit is considered more likely than not to be realized. Otherwise, a valuation allowance is applied against the deferred tax asset.
Assuming the recoverability of a deferred tax asset requires management to make significant estimates related to expectations of future taxable income. Estimates of future taxable income are based on forecasted cash flow from operations, the character of expected income or loss as either ordinary or capital and the application of existing tax laws in each jurisdiction. To the extent that future cash flows and the amount or character of taxable income differ significantly from our estimates, our ability to realize the deferred tax asset could be impacted. To the extent our estimates of our ability to realize our tax benefits change, we would be required to record changes to our valuation allowance applied against our deferred tax asset. In addition, our NOL carry-forwards begin to expire in 2027 and our NCL carryforwards begin to expire in 2019. If we are not able to generate sufficient taxable income of the appropriate tax character to fully utilize these carry-forwards prior to their expiration, we would be required to write off the corresponding deferred tax asset. If we were to increase our valuation allowances against our deferred tax asset or if we were to write off expired loss carry-forwards for which a valuation allowance had not been previously recognized, our financial position and results of operations would be adversely impacted.
| 57 |
Recently Issued Accounting Pronouncements
Refer to “Note 3. Summary of Significant Accounting Policies” in the Notes to Consolidated Financial Statements for a summary of recently issued accounting pronouncements and their effect on our consolidated financial statements.
ITEM 7A. QUANTITATIVE AND QUALITATIVE DISCLOSURES ABOUT MARKET RISK
Market risk is the exposure to loss resulting from changes in market factors such as interest rates, foreign currency exchange rates, commodity prices, equity prices and other market changes that affect market risk sensitive instruments. The primary market risks that we are exposed to are interest rate risk, prepayment risk, extension risk, credit risk, spread risk, liquidity risk and regulatory risk. See “Item 1 — Business” in this Annual Report on Form 10-K for discussion of our risk management strategies related to these market risks. The following is additional information regarding certain of these market risks.
Credit Risk
Although we do not expect to encounter credit risk in our agency MBS portfolio assuming Fannie Mae and Freddie Mac remain solvent, we are exposed to credit risk in our private-label MBS portfolio. With respect to our private-label MBS, credit support contained in these MBS deal structures provides a level of protection from losses, as do the discounted purchase prices in the event of the return of less than 100% of par. We also evaluate the impact of credit risk on our investments through a comprehensive investment review and selection process, which is predominantly focused on quantifying and pricing credit risk. We review our private-label MBS based on quantitative and qualitative analysis of the risk-adjusted returns on such investments. Through modeling and scenario analysis, we seek to evaluate each investment’s credit risk. Credit risk is also monitored through our ongoing asset surveillance. Despite these measures to manage credit risk, unanticipated credit losses could nevertheless occur, which could adversely impact our operating results.
Our private-label MBS are generally purchased at a discount. We estimate the future expected cash flows based on our observation of current information and events and applying a number of assumptions related to prepayment rates, interest rates, default rates, and the timing and amount of credit losses on each security. These assumptions are difficult to predict as they are subject to uncertainties and contingencies related to future events that may impact our estimates and interest income.
The following table represents certain statistics of the residential mortgage loans that serve as collateral to the underlying REMIC securitization trusts of our private-label MBS portfolio as of and for the year ended December 31, 2015:
| Delinquencies greater than 60 plus days | 11.9 | % | ||
| Credit enhancement | 0.1 | % | ||
| Constant default rate (three months average) | 4.7 | % | ||
| Loss severity rate (three months average) | 32.1 | % | ||
| Constant prepayment rate (three months average) | 10.8 | % |
Key credit and prepayment measures in our private-label MBS portfolio reflected improvement during the year ended December 31, 2015. Total 60 day plus delinquencies in our private-label MBS portfolio decreased to 11.9% at December 31, 2015 from 14.9% at December 31, 2014 and trailing three month average loss severities on liquidated loans decreased to 32.1% at December 31, 2015 from 40.9% at December 31, 2014. We will continue to monitor the performance of each security in our portfolio and assess the impact on the overall performance of the portfolio.
| 58 |
The table that follows shows the expected change in fair value for our current private-label MBS under several hypothetical credit loss scenarios. Our private-label MBS are classified as Level 3 within the fair value hierarchy as they are valued using present value techniques based on estimated cash flows of the security taking into consideration various assumptions derived by management and used by other market participants.
These assumptions include, among others, interest rates, prepayment rates, discount rates, credit default rates, loss severity rates, and the timing of cash flows and credit losses. Credit default and loss severity rates can significantly affect the prices of private-label MBS. While it is impossible to project the exact amount of changes in value, the table below illustrates the impact a 10% increase and a 10% decrease in the credit default and loss severity rates from those used as our valuation assumptions would have on the value of our total assets and our book value per share as of December 31, 2015. The changes in rates are assumed to occur instantaneously. The table below is based on a change in either the credit default rates or loss severity rates in isolation. However, a change in one valuation assumption may be accompanied by a directionally opposite change in another valuation assumption. Actual changes in market conditions are likely to be different from these assumptions (dollars in thousands, except per share amounts).
| December 31, 2015 | ||||||||||||||||||||||||||||||||||||
| Value | Value with 10% Increase in Default Rate | Percent Change | Value with 10% Decrease in Default Rate | Percent Change | Value with 10% Increase in Loss Severity Rate | Percent Change | Value with 10% Decrease in Loss Severity Rate | Percent Change | ||||||||||||||||||||||||||||
| Assets | ||||||||||||||||||||||||||||||||||||
| Private-label MBS | $ | 130,435 | $ | 128,681 | (1.34 | )% | $ | 132,227 | 1.37 | % | $ | 128,193 | (1.72 | )% | $ | 132,678 | 1.72 | % | ||||||||||||||||||
| Agency MBS | 3,865,316 | 3,865,316 | — | 3,865,316 | — | 3,865,316 | — | 3,865,316 | — | |||||||||||||||||||||||||||
| Other | 209,055 | 209,055 | — | 209,055 | — | 209,055 | — | 209,055 | — | |||||||||||||||||||||||||||
| Total assets | $ | 4,204,806 | $ | 4,203,052 | (0.04 | )% | $ | 4,206,598 | 0.04 | % | $ | 4,202,564 | (0.05 | )% | $ | 4,207,049 | 0.05 | % | ||||||||||||||||||
| Liabilities | $ | 3,720,775 | $ | 3,720,775 | — | $ | 3,720,775 | — | $ | 3,720,775 | — | $ | 3,720,775 | — | ||||||||||||||||||||||
| Equity | 484,031 | 482,277 | (0.36 | )% | 485,823 | 0.37 | % | 481,789 | (0.46 | )% | 486,274 | 0.46 | % | |||||||||||||||||||||||
| Total liabilities and equity | $ | 4,204,806 | $ | 4,203,052 | (0.04 | )% | $ | 4,206,598 | 0.04 | % | $ | 4,202,564 | (0.05 | )% | $ | 4,207,049 | 0.05 | % | ||||||||||||||||||
| Book value per share | $ | 21.05 | $ | 20.97 | (0.36 | )% | $ | 21.13 | 0.37 | % | $ | 20.95 | (0.46 | )% | $ | 21.15 | 0.46 | % | ||||||||||||||||||
Interest Rate Risk
We are also subject to interest rate risk in our MBS portfolio. Our MBS positions are financed with short-term borrowing facilities such as repurchase agreements, which are interest rate sensitive financial instruments. We are exposed to interest rate risk that fluctuates based on changes in the level or volatility of interest rates and mortgage prepayments and in the shape and slope of the yield curve. We attempt to hedge a portion of our exposure to interest rate fluctuations primarily through the use of interest rate derivative instruments, including interest rate swaps, Eurodollar futures, U.S. Treasury note futures and interest rate swap futures.
Our primary risk is related to changes in both short- and long-term interest rates, which affect us in several ways. As interest rates increase, the market value of fixed-rate agency MBS may be expected to decline, prepayment rates may be expected to go down, and duration may be expected to extend. However, an increase in interest rates is beneficial to the market value of our interest rate derivative instruments. For example, for interest rate swaps, the cash flows from receiving the floating rate portion increase and the fixed-rate paid remains the same under this scenario. Conversely, if interest rates decline, the market value of fixed-rate agency MBS is expected to increase and the value of our interest rate derivatives is expected to decline.
The table that follows shows the expected change in fair value for our current MBS and derivatives under several hypothetical interest rate scenarios. Interest rates are defined by the U.S. Treasury yield curve. The changes in rates are assumed to occur instantaneously. It is further assumed that the changes in rates occur uniformly across the yield curve and that the level of LIBOR changes by the same amount as the yield curve. Actual changes in market conditions are likely to be different from these assumptions.
Changes in fair value are measured as percentage changes from their respective fair values presented in the column labeled “Value.” Management’s estimate of change in the value of MBS is based on the same assumptions it uses to manage the impact of interest rates on the portfolio. Actual results could differ significantly from these estimates. The effective durations are based on observed market value changes, as well as management’s own estimate of the effect of interest rate changes on the fair value of the investments including assumptions regarding prepayments based, in part, on age of and interest rate on the mortgages underlying the MBS, prior exposure to refinancing opportunities, and an overall analysis of historical prepayment patterns under a variety of past interest rate conditions.
| 59 |
The interest rate sensitivity analysis illustrated by the table that follows has certain limitations, most notably the following:
| • | The 100 basis point upward and downward shocks to interest rates that are applied in the analysis represent parallel shocks to the forward yield curve. The analysis does not consider the sensitivity of stockholders’ equity to changes in the shape or slope of the forward yield curve. |
| • | The analysis assumes that spreads remain constant and, therefore, does not reflect an estimate of the impact that changes in spreads would have on the value of our MBS investments or our LIBOR and U.S. Treasury rate based derivative instruments. |
| • | The analysis assumes a static portfolio and does not reflect activities and strategic actions that management may take in the future to manage interest rate risk in response to significant changes in interest rates or other market conditions. |
| • | The yield curve that results from applying an instantaneous parallel 100 basis point decrease in interest rates reflects an interest rate of less than 0% in certain earlier portions of the curve. The results of the analysis included in the table to follow reflect the effect of these negative interest rates. |
This analysis is not intended to provide a precise forecast. Actual results could differ materially from these estimates (dollars in thousands, except per share amounts).
| December 31, 2015 | ||||||||||||||||||||
| Value | Value with 100 Basis Point Increase in Interest Rates | Percent Change | Value with 100 Basis Point Decrease in Interest Rates | Percent Change | ||||||||||||||||
| Assets | ||||||||||||||||||||
| MBS | $ | 3,995,751 | $ | 3,786,551 | (5.24 | )% | $ | 4,112,873 | 2.93 | % | ||||||||||
| Derivative asset | 12,991 | 210,093 | 1,517.22 | % | (177,536 | ) | (1,466.61 | )% | ||||||||||||
| Other | 196,064 | 196,064 | — | 196,064 | — | |||||||||||||||
| Total assets | $ | 4,204,806 | $ | 4,192,708 | (0.29 | )% | $ | 4,131,401 | (1.75 | )% | ||||||||||
| Liabilities | ||||||||||||||||||||
| Repurchase agreements | $ | 2,834,780 | $ | 2,834,780 | — | $ | 2,834,780 | — | ||||||||||||
| FHLB advances | 786,900 | 786,900 | — | 786,900 | — | |||||||||||||||
| Derivative liability | 553 | 23,064 | 4,070.71 | % | (9,748 | ) | (1,862.75 | )% | ||||||||||||
| Other | 98,542 | 98,542 | — | 98,542 | — | |||||||||||||||
| Total liabilities | 3,720,775 | 3,743,286 | 0.61 | % | 3,710,474 | (0.28 | )% | |||||||||||||
| Equity | 484,031 | 449,422 | (7.15 | )% | 420,927 | (13.04 | )% | |||||||||||||
| Total liabilities and equity | $ | 4,204,806 | $ | 4,192,708 | (0.29 | )% | $ | 4,131,401 | (1.75 | )% | ||||||||||
| Book value per share | $ | 21.05 | $ | 19.55 | (7.15 | )% | $ | 18.31 | (13.04 | )% | ||||||||||
Inflation Risk
Virtually all of our assets and liabilities are interest rate sensitive in nature. As a result, interest rates and other factors influence our performance far more than inflation. Changes in interest rates do not necessarily correlate with inflation rates or changes in inflation rates. Our financial statements are prepared in accordance with GAAP and our distributions are determined by our Board of Directors in its sole discretion pursuant to our variable dividend policy; in each case, our activities and balance sheet are measured with reference to fair value without considering inflation.
| 60 |
ITEM 8. FINANCIAL STATEMENTS AND SUPPLEMENTARY DATA
The information required by this item appears in a subsequent section of this report. See “Index to Consolidated Financial Statements of Arlington Asset Investment Corp.” on page F-1.
ITEM 9. CHANGES IN AND DISAGREEMENTS WITH ACCOUNTANTS ON ACCOUNTING AND FINANCIAL DISCLOSURE
None.
ITEM 9A. CONTROLS AND PROCEDURES
Disclosure Controls and Procedures
Our management, including our Chief Executive Officer (“CEO”) and Chief Financial Officer (“CFO”), evaluated the effectiveness of the design and operation of our disclosure controls and procedures (as defined in Rules 13a-15(e) and 15d-15(e) of the Securities Exchange Act of 1934, as amended) as of the end of the period covered by this report. Based on that evaluation, our CEO and CFO have concluded that as of December 31, 2015, our disclosure controls and procedures, as designed and implemented, (i) were effective in ensuring that information is made known to our management, including our CEO and CFO, by our officers and employees, as appropriate to allow timely decisions regarding required disclosure and (ii) were effective in ensuring that information the Company must disclose in its reports under the Securities Exchange Act of 1934, as amended, is recorded, processed, summarized and reported within the time periods prescribed by the SEC’s rules and forms.
Management’s Report on Internal Control over Financial Reporting
Management of the Company is responsible for establishing and maintaining adequate internal control over financial reporting. Internal control over financial reporting is defined in Rules 13a-15(f) and 15d-15(f) under the Securities Exchange Act of 1934, as amended, as a process designed by, or under the supervision of, the Company’s principal executive and principal financial officers and effected by the Company’s Board of Directors, management and other personnel to provide reasonable assurance regarding the reliability of financial reporting and the preparation of financial statements for external purposes in accordance with generally accepted accounting principles and includes those policies and procedures that:
| • | pertain to the maintenance of records that in reasonable detail accurately and fairly reflect the transactions and dispositions of the assets of the Company; |
| • | provide reasonable assurance that transactions are recorded as necessary to permit preparation of financial statements in accordance with generally accepted accounting principles, and that receipts and expenditures of the Company are being made only in accordance with authorizations of management and directors of the Company; and |
| • | provide reasonable assurance regarding prevention or timely detection of unauthorized acquisition, use or disposition of the Company’s assets that could have a material effect on the financial statements. |
Because of its inherent limitations, internal control over financial reporting may not prevent or detect misstatements. Also, projections of any evaluation of effectiveness to future periods are subject to the risks that controls may become inadequate because of changes in conditions or that the degree of compliance with the policies or procedures may deteriorate.
The Company’s management assessed the effectiveness of the Company’s internal control over financial reporting as of December 31, 2015. In making this assessment, the Company’s management used criteria set forth by the Committee of Sponsoring Organizations of the Treadway Commission (“COSO”) in Internal Control-Integrated Framework (2013 version). Based on management’s assessment, the Company’s management has concluded that the Company’s internal control over financial reporting was effective as of December 31, 2015.
| 61 |
The effectiveness of the Company’s internal control over financial reporting was audited by PricewaterhouseCoopers LLP, an independent registered public accounting firm, as stated in their report which appears on page F-2 of this Annual Report on Form 10-K.
Changes in Internal Control over Financial Reporting
There have been no changes in our internal control over financial reporting that occurred during the quarter ended December 31, 2015 that have materially affected, or are reasonably likely to materially affect, our internal control over financial reporting.
None.
| 62 |
ITEM 10. DIRECTORS, EXECUTIVE OFFICERS AND CORPORATE GOVERNANCE
The information required by Part III, Item 10 of this Annual Report on Form 10-K will be provided in the Definitive Proxy Statement relating to our 2016 Annual Meeting of Shareholders (our 2016 Proxy Statement) and is hereby incorporated by reference.
ITEM 11. EXECUTIVE COMPENSATION
The information required by Part III, Item 11 of this Annual Report on Form 10-K will be provided in our 2016 Proxy Statement and is hereby incorporated by reference.
ITEM 12. SECURITY OWNERSHIP OF CERTAIN BENEFICIAL OWNERS AND MANAGEMENT AND RELATED STOCKHOLDER MATTERS
The information required by Part III, Item 12 of this Annual Report on Form 10-K will be provided in our 2016 Proxy Statement and is hereby incorporated by reference.
ITEM 13. CERTAIN RELATIONSHIPS AND RELATED TRANSACTIONS, AND DIRECTOR INDEPENDENCE
The information required by Part III, Item 13 of this Annual Report on Form 10-K will be provided in our 2016 Proxy Statement and is hereby incorporated by reference.
ITEM 14. PRINCIPAL ACCOUNTANT FEES AND SERVICES
The information required by Part III, Item 14 of this Annual Report on Form 10-K will be provided in our 2016 Proxy Statement and is hereby incorporated by reference.
ITEM 15. EXHIBITS AND FINANCIAL STATEMENT SCHEDULES
(a) (1) Financial Statements. The Arlington Asset Investment Corp. consolidated financial statements for the year ended December 31, 2015, included in “Item 8 — Financial Statements and Supplementary Data”, of this Annual Report on Form 10-K, are incorporated by reference into this Part IV, Item 15:
| • | Report of Independent Registered Public Accounting Firm (page F-2) |
| • | Consolidated Balance Sheets — Years ended 2015 and 2014 (page F-3) |
| • | Consolidated Statements of Comprehensive Income — Years ended 2015, 2014 and 2013 (page F-4) |
| • | Consolidated Statements of Changes in Equity — Years ended 2015, 2014 and 2013 (page F-5) |
| • | Consolidated Statements of Cash Flows — Years ended 2015, 2014 and 2013 (page F-6) |
| • | Notes to Consolidated Financial Statements (page F-7) |
(2) Financial Statement Schedules. All schedules are omitted because they are not required or because the information is shown in the financial statements or notes thereto.
| 63 |
(3) Exhibits
|
Exhibit Number |
Exhibit Title | |
| 3.01 | Amended and Restated Articles of Incorporation, as amended (incorporated by reference to Exhibit 3.1 to the Registrant’s Quarterly Report on Form 10-Q filed on November 9, 2009). | |
| 3.02 | Amended and Restated Bylaws, as amended (incorporated by reference to Exhibit 3.1 to the Registrant’s Current Report on Form 8-K filed on July 28, 2011). | |
| 3.03 | Amendment No. 1 to the Amended and Restated Bylaws (incorporated by reference to Exhibit 3.1 to the Registrant’s Current Report on Form 8-K filed on February 4, 2015). | |
| 4.01 | Indenture dated as of May 1, 2013 between the Company and Wells Fargo Bank, National Association, as trustee (incorporated by reference to Exhibit 4.1 of the Registrant’s Current Report on Form 8-K filed on May 1, 2013). | |
| 4.02 | First Supplemental Indenture dated as of May 1, 2013 between the Company and Wells Fargo Bank, National Association, as trustee (incorporated by reference to Exhibit 4.2 of the Registrant’s Current Report on Form 8-K filed on May 1, 2013). | |
| 4.03 | Form of Subordinated Indenture (incorporated by reference to Exhibit 4.4 of the Registration Statement on Form S-3 (333-107731) filed by Friedman, Billings, Ramsey Group Inc. on August 7, 2003). | |
| 4.04 | Form of Senior Note (incorporated by reference to the Registrant’s Registration Statement on Form S-3 (133-171537). | |
| 4.05 | Form of 6.625% Senior Notes due 2023 (incorporated by reference to Exhibit 4.3 to the Registrant’s Current Report on Form 8-K filed on May 1, 2013). | |
| 4.06 | Form of Certificate for Class A Common Stock (incorporated by reference to Exhibit 4.01 of the Annual Report on Form 10-K filed on February 24, 2010). | |
| 4.07 | Shareholder Rights Agreement, dated June 5, 2009 (incorporated by reference to Exhibit 4.1 of the Registrant’s Current Report on Form 8-K filed on June 5, 2009). | |
| 4.08 | Second Supplemental Indenture, dated as of March 18, 2015, between the Registrant, Wells Fargo Bank, National Association, as Trustee and The Bank of New York Mellon, as Series Trustee (incorporated by reference to Exhibit 4.3 to the Registrant’s Form 8-A filed on March 18, 2015). | |
| 4.09 | Form of 6.750% Notes due 2025 (incorporated by reference to Exhibit 4.3 to the Current Report on Form 8-K filed by the Registrant on March 17, 2015). | |
| 10.01 | Friedman, Billings, Ramsey Group, Inc. 2004 Long-Term Incentive Plan (incorporated by reference to Appendix A to the Registrant’s Definitive Proxy Statement on Schedule 14A filed on April 29, 2004).* | |
| 10.02 | Friedman, Billings, Ramsey Group, Inc. 1997 Stock and Annual Incentive Plan (incorporated by reference to Exhibit 10.06 to Amendment No. 2 to the Registration Statement on Form S-1 (File No. 333-39107) filed by Friedman, Billings, Ramsey Group, Inc. on December 19, 1997).* | |
| 10.03 | Friedman, Billings, Ramsey Group, Inc. Non-Employee Director Stock Compensation Plan (incorporated by reference to Exhibit 10.07 to Amendment No. 2 to the Registration Statement on Form S-1 (File No. 333-39107) filed by Friedman, Billings, Ramsey Group, Inc. on December 19, 1997).* | |
| 10.04 | Friedman, Billings, Ramsey Group, Inc. Amended and Restated Non-Employee Director Stock Compensation Plan (incorporated by reference to Exhibit 10.04 to the Registrant’s Annual Report on Form 10-K filed on February 23, 2012).* | |
| 10.05 | Arlington Asset Investment Corp. 2011 Long-Term Incentive Plan (incorporated by reference to Exhibit 10.1 to the Registrant’s Current Report on Form 8-K filed on June 6, 2011).* | |
| 10.06 | Arlington Asset Investment Corp. 2014 Long-Term Incentive Plan (incorporated by reference to the Registrant’s Registration Statement on Form S-8 filed on July 15, 2014). | |
| 10.07 | Form of Restricted Stock Unit Agreement under Arlington Asset Investment Corp. 2014 Long-Term Incentive Plan (incorporated by reference to the Registrant’s Registration Statement on Form S-8 filed on July 15, 2014). | |
| 10.08 | Form of Restricted Stock Award Agreement under Arlington Asset Investment Corp. 2014 Long-Term Incentive Plan (incorporated by reference to the Registrant’s Registration Statement on Form S-8 filed on July 15, 2014). | |
| 10.09 | Form of Performance Share Unit Award Agreement under Arlington Asset Investment Corp. 2014 Long-Term Incentive Plan (incorporated by reference to the Registrant’s Registration Statement on Form S-8 filed on July 15, 2014). |
| 64 |
|
Exhibit Number |
Exhibit Title | |
| 10.10 | Form of Indemnification Agreement (incorporated by reference to Exhibit 10.08 to the Registrant’s Annual Report on Form 10-K, filed on February 23, 2012).* | |
| 10.11 | Equity Distribution Agreement, dated May 24, 2013, by and between the Company and RBC Capital Markets, LLC (incorporated by reference to Exhibit 1.1 to the Registrant’s Current Report on Form 8-K filed on May 28, 2013). | |
| 10.12 | Equity Distribution Agreement, dated May 24, 2013, by and between the Company and JMP Securities LLC (incorporated by reference to Exhibit 1.2 to the Registrant’s Current Report on Form 8-K filed on May 28, 2013). | |
| 10.13 | Equity Distribution Agreement, dated May 24, 2013, by and between the Company and Ladenburg Thalmann & Co. Inc. (incorporated by reference to Exhibit 1.3 to the Registrant’s Current Report on Form 8-K filed on May 28, 2013). | |
| 10.14 | Equity Distribution Agreement, dated May 24, 2013, by and between the Company and MLV & Co. LLC (incorporated by reference to Exhibit 1.4 to the Registrant’s Current Report on Form 8-K filed on May 28, 2013). | |
| 11.01 | Statement regarding Computation of Per Share Earnings (included in Part II, Item 8, and Note 2 to the Registrant’s Consolidated Financial Statements).† | |
| 12.01 | Computation of Ratio of Earnings to Fixed Charges.† | |
| 21.01 | List of Subsidiaries of the Registrant.† | |
| 23.01 | Consent of PricewaterhouseCoopers LLP.† | |
| 24.01 | Power of Attorney (included on the signature page to this Annual Report on Form 10-K and incorporated by reference herein).† | |
| 31.01 | Certification of Chief Executive Officer pursuant to Rule 13a-14(a)/15d-14(a), as adopted pursuant to Section 302 of the Sarbanes-Oxley Act of 2002.† | |
| 31.02 | Certification of Chief Financial Officer pursuant to Rule 13a-14(a)/15d-14(a), as adopted pursuant to Section 302 of the Sarbanes-Oxley Act of 2002.† | |
| 32.01 | Certification of Chief Executive Officer pursuant to 18 U.S.C. Section 1350, as adopted pursuant to Section 906 of the Sarbanes-Oxley Act of 2002.† | |
| 32.02 | Certification of Chief Financial Officer pursuant to 18 U.S.C. Section 1350, as adopted pursuant to Section 906 of the Sarbanes-Oxley Act of 2002.† | |
| 101.INS | INSTANCE DOCUMENT** | |
| 101.SCH | SCHEMA DOCUMENT** | |
| 101.CAL | CALCULATION LINKBASE DOCUMENT** | |
| 101.LAB | LABELS LINKBASE DOCUMENT** | |
| 101.PRE | PRESENTATION LINKBASE DOCUMENT** | |
| 101.DEF | DEFINITION LINKBASE DOCUMENT** |
| † | Filed herewith. |
| * | Compensatory plan or arrangement. |
| ** | Submitted electronically herewith. Attached as Exhibit 101 are the following materials from the Company’s Annual Report on Form 10-K for the fiscal year ended December 31, 2015, formatted in XBRL (eXtensible Business Reporting Language): (i) Consolidated Balance Sheets at December 31, 2015 and December 31, 2014; (ii) Consolidated Statements of Comprehensive Income for the years ended December 31, 2015, 2014 and 2013; (iii) Consolidated Statements of Changes in Equity for the years ended December 31, 2015, 2014 and 2013; and (iv) Consolidated Statements of Cash Flows for the years ended 2015, 2014 and 2013. |
| 65 |
Pursuant to the requirements of Section 13 or 15(d) of the Securities Exchange Act of 1934, the registrant has duly caused this report to be signed on its behalf by the undersigned, thereunto duly authorized.
| ARLINGTON ASSET INVESTMENT CORP. | ||
| Date: February 16, 2016 | By: | /s/ J. ROCK TONKEL, JR. |
| J. Rock Tonkel, Jr. | ||
| President and Chief Executive Officer | ||
POWER OF ATTORNEY
KNOW ALL MEN BY THESE PRESENTS, that each person whose signature appears below hereby constitutes and appoints J. Rock Tonkel, Jr. and Richard E. Konzmann and each of them as his true and lawful attorney-in-fact and agent, with full power of substitution and resubstitution, for him and in his name, place and stead, in any and all capacities, to sign any and all amendments to this Annual Report on Form 10-K for the fiscal year ended December 31, 2015, and to file the same, with all exhibits thereto, and any other documents in connection therewith, with the Securities and Exchange Commission, granting unto said attorneys-in-fact and agents full power and authority to do and perform each and every act and thing requisite and necessary to be done in and about the premises, as fully to all intents and purposes as he might or could do in person, hereby ratifying and confirming all that said attorneys-in-fact and agents or any of them, or their substitute or substitutes, may lawfully do or cause to be done by virtue hereof.
Pursuant to the requirements of the Securities Exchange Act of 1934, this report has been signed below by the following persons on behalf of the registrant and in the capacities and on the dates indicated.
| Signature | Title | Date | ||
| /s/ J. ROCK TONKEL, JR. | President, Chief Executive Officer and Director | February 16, 2016 | ||
| J. ROCK TONKEL, JR. | (Principal Executive Officer) | |||
| /s/ RICHARD E. KONZMANN | Executive Vice President, Chief Financial Officer and Treasurer | February 16, 2016 | ||
| RICHARD E. KONZMANN | (Principal Financial and Accounting Officer) | |||
| /s/ ERIC F. BILLINGS | Executive Chairman of the Board | February 16, 2016 | ||
| ERIC F. BILLINGS | ||||
| /s/ DANIEL J. ALTOBELLO | Director | February 16, 2016 | ||
| DANIEL J. ALTOBELLO | ||||
| /s/ DANIEL E. BERCE | Director | February 16, 2016 | ||
| DANIEL E. BERCE | ||||
| /s/ DAVID W. FAEDER | Director | February 16, 2016 | ||
| DAVID W. FAEDER | ||||
| /s/ PETER A. GALLAGHER | Director | February 16, 2016 | ||
| PETER A. GALLAGHER | ||||
| /s/ RALPH S. MICHAEL III | Director | February 16, 2016 | ||
| RALPH S. MICHAEL III | ||||
| /s/ ANTHONY P. NADER III | Director | February 16, 2016 | ||
| ANTHONY P. NADER III |
| 66 |
FINANCIAL STATEMENTS OF ARLINGTON ASSET INVESTMENT CORP.
Index to Arlington Asset Investment Corp. Consolidated Financial Statements
| F-1 |
Report of Independent Registered Public Accounting Firm
To The Board of Directors and Shareholders of
Arlington Asset Investment Corp.
In our opinion, the accompanying consolidated balance sheets and the related consolidated statements of comprehensive income, of changes in equity and of cash flows present fairly, in all material respects, the financial position of Arlington Asset Investment Corp. and its subsidiaries at December 31, 2015 and December 31, 2014, and the results of their operations and their cash flows for each of the three years in the period ended December 31, 2015 in conformity with accounting principles generally accepted in the United States of America. Also in our opinion, the Company maintained, in all material respects, effective internal control over financial reporting as of December 31, 2015, based on criteria established in Internal Control - Integrated Framework (2013 framework) issued by the Committee of Sponsoring Organizations of the Treadway Commission (COSO). The Company's management is responsible for these financial statements, for maintaining effective internal control over financial reporting and for its assessment of the effectiveness of internal control over financial reporting, included in Management’s Report on Internal Control over Financial Reporting appearing under Item 9A. Our responsibility is to express opinions on these financial statements and on the Company's internal control over financial reporting based on our integrated audits. We conducted our audits in accordance with the standards of the Public Company Accounting Oversight Board (United States). Those standards require that we plan and perform the audits to obtain reasonable assurance about whether the financial statements are free of material misstatement and whether effective internal control over financial reporting was maintained in all material respects. Our audits of the financial statements included examining, on a test basis, evidence supporting the amounts and disclosures in the financial statements, assessing the accounting principles used and significant estimates made by management, and evaluating the overall financial statement presentation. Our audit of internal control over financial reporting included obtaining an understanding of internal control over financial reporting, assessing the risk that a material weakness exists, and testing and evaluating the design and operating effectiveness of internal control based on the assessed risk. Our audits also included performing such other procedures as we considered necessary in the circumstances. We believe that our audits provide a reasonable basis for our opinions.
A company’s internal control over financial reporting is a process designed to provide reasonable assurance regarding the reliability of financial reporting and the preparation of financial statements for external purposes in accordance with generally accepted accounting principles. A company’s internal control over financial reporting includes those policies and procedures that (i) pertain to the maintenance of records that, in reasonable detail, accurately and fairly reflect the transactions and dispositions of the assets of the company; (ii) provide reasonable assurance that transactions are recorded as necessary to permit preparation of financial statements in accordance with generally accepted accounting principles, and that receipts and expenditures of the company are being made only in accordance with authorizations of management and directors of the company; and (iii) provide reasonable assurance regarding prevention or timely detection of unauthorized acquisition, use, or disposition of the company’s assets that could have a material effect on the financial statements.
Because of its inherent limitations, internal control over financial reporting may not prevent or detect misstatements. Also, projections of any evaluation of effectiveness to future periods are subject to the risk that controls may become inadequate because of changes in conditions, or that the degree of compliance with the policies or procedures may deteriorate.
/s/ PricewaterhouseCoopers LLP
McLean, VA
February 16, 2016
| F-2 |
ARLINGTON ASSET INVESTMENT CORP.
CONSOLIDATED BALANCE SHEETS
(Dollars in thousands, except share amounts)
| December 31, | ||||||||
| 2015 | 2014 | |||||||
| ASSETS | ||||||||
| Cash and cash equivalents | $ | 36,987 | $ | 33,832 | ||||
| Interest receivable | 11,936 | 10,701 | ||||||
| Mortgage-backed securities, at fair value | ||||||||
| Agency | 3,865,316 | 3,414,340 | ||||||
| Private-label | 130,435 | 267,437 | ||||||
| Derivative assets, at fair value | 12,991 | 1,267 | ||||||
| Deferred tax assets, net | 97,530 | 125,607 | ||||||
| Deposits | 29,429 | 160,427 | ||||||
| Other assets | 20,182 | 4,120 | ||||||
| Total assets | $ | 4,204,806 | $ | 4,017,731 | ||||
| LIABILITIES AND STOCKHOLDERS’ EQUITY | ||||||||
| Liabilities: | ||||||||
| Repurchase agreements | $ | 2,834,780 | $ | 3,179,775 | ||||
| Federal Home Loan Bank advances | 786,900 | — | ||||||
| Interest payable | 2,436 | 1,106 | ||||||
| Accrued compensation and benefits | 5,170 | 6,067 | ||||||
| Dividend payable | 14,504 | 20,195 | ||||||
| Derivative liabilities, at fair value | 553 | 124,308 | ||||||
| Other liabilities | 1,132 | 1,006 | ||||||
| Long-term debt | 75,300 | 40,000 | ||||||
| Total liabilities | 3,720,775 | 3,372,457 | ||||||
| Commitments and contingencies (Note 11) | ||||||||
| Stockholders’ Equity: | ||||||||
| Preferred stock, $0.01 par value, 25,000,000 shares authorized, none issued and outstanding | — | — | ||||||
| Class A common stock, $0.01 par value, 450,000,000 shares authorized, 22,874,819 and 22,860,922 shares issued and outstanding, respectively | 229 | 229 | ||||||
| Class B common stock, $0.01 par value, 100,000,000 shares authorized, 102,216 and 105,869 shares issued and outstanding, respectively | 1 | 1 | ||||||
| Additional paid-in capital | 1,898,085 | 1,897,027 | ||||||
| Accumulated other comprehensive income, net of taxes of $3,230 and $11,666, respectively | 12,371 | 35,872 | ||||||
| Accumulated deficit | (1,426,655 | ) | (1,287,855 | ) | ||||
| Total stockholders’ equity | 484,031 | 645,274 | ||||||
| Total liabilities and stockholders’ equity | $ | 4,204,806 | $ | 4,017,731 | ||||
The accompanying notes are an integral part of these consolidated financial statements.
| F-3 |
CONSOLIDATED STATEMENTS OF COMPREHENSIVE INCOME
(Dollars in thousands except per share amounts)
| Year Ended December 31, | ||||||||||||
| 2015 | 2014 | 2013 | ||||||||||
| Interest income | ||||||||||||
| Agency mortgage-backed securities | $ | 139,244 | $ | 97,900 | $ | 60,386 | ||||||
| Private-label mortgage-backed securities | 15,322 | 25,597 | 26,586 | |||||||||
| Other | 27 | 50 | 47 | |||||||||
| Total interest income | 154,593 | 123,547 | 87,019 | |||||||||
| Interest expense | ||||||||||||
| Short-term debt | 14,701 | 9,181 | 6,899 | |||||||||
| Long-term debt | 4,188 | 2,210 | 1,630 | |||||||||
| Total interest expense | 18,889 | 11,391 | 8,529 | |||||||||
| Net interest income | 135,704 | 112,156 | 78,490 | |||||||||
| Investment loss, net | ||||||||||||
| Realized gain on sale of available-for-sale investments, net | 17,725 | 17,257 | 17,458 | |||||||||
| Other-than-temporary impairment charges | (2,417 | ) | (449 | ) | (1,354 | ) | ||||||
| (Loss) gain on trading investments, net | (64,388 | ) | 84,152 | (122,163 | ) | |||||||
| (Loss) gain from derivative instruments, net | (105,349 | ) | (140,353 | ) | 58,003 | |||||||
| Other, net | 2,050 | 706 | 296 | |||||||||
| Total investment loss, net | (152,379 | ) | (38,687 | ) | (47,760 | ) | ||||||
| Other expenses | ||||||||||||
| Compensation and benefits | 9,719 | 13,467 | 11,195 | |||||||||
| Other expenses | 4,448 | 4,602 | 5,396 | |||||||||
| Total other expenses | 14,167 | 18,069 | 16,591 | |||||||||
| (Loss) income before income taxes | (30,842 | ) | 55,400 | 14,139 | ||||||||
| Income tax provision (benefit) | 38,561 | 47,647 | (38,684 | ) | ||||||||
| Net (loss) income | $ | (69,403 | ) | $ | 7,753 | $ | 52,823 | |||||
| Basic (loss) earnings per share | $ | (3.02 | ) | $ | 0.39 | $ | 3.30 | |||||
| Diluted (loss) earnings per share | $ | (3.02 | ) | $ | 0.38 | $ | 3.26 | |||||
| Weighted-average shares outstanding (in thousands) | ||||||||||||
| Basic | 23,002 | 20,043 | 15,990 | |||||||||
| Diluted | 23,002 | 20,397 | 16,189 | |||||||||
| Other comprehensive (loss) income, net of taxes | ||||||||||||
| Unrealized gains (losses) on available-for-sale securities (net of taxes of $(4,281), $633, and $14,268, respectively) | $ | (7,033 | ) | $ | 995 | $ | 22,412 | |||||
| Reclassification | ||||||||||||
| Included in investment loss, net, related to sales of available-for-sale securities (net of taxes of $(5,095), $(5,499), and $(3,325), respectively) | (17,945 | ) | (11,666 | ) | (11,496 | ) | ||||||
| Included in investment loss, net, related to other-than-temporary impairment charges on available-for-sale securities (net of taxes of $940, $175, $527, respectively) | 1,477 | 274 | 827 | |||||||||
| Comprehensive (loss) income | $ | (92,904 | ) | $ | (2,644 | ) | $ | 64,566 | ||||
The accompanying notes are an integral part of these consolidated financial statements.
| F-4 |
CONSOLIDATED STATEMENTS OF CHANGES IN EQUITY
(Dollars in thousands)
| Class A Common Stock (#) | Class A Amount ($) | Class B Common Stock (#) | Class B Amount ($) | Additional Paid-In Capital | Accumulated Other Comprehensive Income | Accumulated Deficit | Total | |||||||||||||||||||||||||
| Balances, December 31, 2012 | 12,560,970 | $ | 126 | 554,055 | $ | 6 | $ | 1,638,061 | $ | 34,526 | $ | (1,214,904 | ) | $ | 457,815 | |||||||||||||||||
| Net income | — | — | — | — | — | — | 52,823 | 52,823 | ||||||||||||||||||||||||
| Issuance of common stock | 3,492,667 | 34 | — | — | 86,930 | — | — | 86,964 | ||||||||||||||||||||||||
| Repurchase of common stock under stock-based compensation plans | (5,672 | ) | — | — | — | (142 | ) | — | — | (142 | ) | |||||||||||||||||||||
| Stock-based compensation | — | — | — | — | 2,549 | — | — | 2,549 | ||||||||||||||||||||||||
| Other comprehensive income | — | — | — | — | — | 11,743 | — | 11,743 | ||||||||||||||||||||||||
| Dividends declared | — | — | — | — | — | — | (58,481 | ) | (58,481 | ) | ||||||||||||||||||||||
| Balances, December 31, 2013 | 16,047,965 | $ | 160 | 554,055 | $ | 6 | $ | 1,727,398 | $ | 46,269 | $ | (1,220,562 | ) | $ | 553,271 | |||||||||||||||||
| Class A Common Stock (#) | Class A Amount ($) | Class B Common Stock (#) | Class B Amount ($) | Additional Paid-In Capital | Accumulated Other Comprehensive Income | Accumulated Deficit | Total | |||||||||||||||||||||||||
| Balances, December 31, 2013 | 16,047,965 | $ | 160 | 554,055 | $ | 6 | $ | 1,727,398 | $ | 46,269 | $ | (1,220,562 | ) | $ | 553,271 | |||||||||||||||||
| Net income | — | — | — | — | — | — | 7,753 | 7,753 | ||||||||||||||||||||||||
| Conversion of Class B common stock to Class A common stock | 448,186 | 5 | (448,186 | ) | (5 | ) | — | — | — | — | ||||||||||||||||||||||
| Issuance of common stock | 6,419,247 | 64 | — | — | 166,819 | — | — | 166,883 | ||||||||||||||||||||||||
| Repurchase of common stock under stock-based compensation plans | (54,476 | ) | — | — | — | (1,478 | ) | — | — | (1,478 | ) | |||||||||||||||||||||
| Stock-based compensation | — | — | — | — | 3,813 | — | — | 3,813 | ||||||||||||||||||||||||
| Income tax benefit from stock-based compensation | — | — | — | — | 475 | — | — | 475 | ||||||||||||||||||||||||
| Other comprehensive loss | — | — | — | — | — | (10,397 | ) | — | (10,397 | ) | ||||||||||||||||||||||
| Dividends declared | — | — | — | — | — | — | (75,046 | ) | (75,046 | ) | ||||||||||||||||||||||
| Balances, December 31, 2014 | 22,860,922 | $ | 229 | 105,869 | $ | 1 | $ | 1,897,027 | $ | 35,872 | $ | (1,287,855 | ) | $ | 645,274 | |||||||||||||||||
| Class A Common Stock (#) | Class A Amount ($) | Class B Common Stock (#) | Class B Amount ($) | Additional Paid-In Capital | Accumulated Other Comprehensive Income | Accumulated Deficit | Total | |||||||||||||||||||||||||
| Balances, December 31, 2014 | 22,860,922 | $ | 229 | 105,869 | $ | 1 | $ | 1,897,027 | $ | 35,872 | $ | (1,287,855 | ) | $ | 645,274 | |||||||||||||||||
| Net loss | — | — | — | — | — | — | (69,403 | ) | (69,403 | ) | ||||||||||||||||||||||
| Conversion of Class B common stock to Class A common stock | 3,653 | — | (3,653 | ) | — | — | — | — | — | |||||||||||||||||||||||
| Issuance of common stock | 97,651 | — | — | — | — | — | — | — | ||||||||||||||||||||||||
| Repurchase of common stock | (48,695 | ) | — | — | — | (593 | ) | — | — | (593 | ) | |||||||||||||||||||||
| Repurchase of common stock under stock-based compensation plans | (38,712 | ) | — | — | — | (572 | ) | — | — | (572 | ) | |||||||||||||||||||||
| Stock-based compensation | — | — | — | — | 1,145 | — | — | 1,145 | ||||||||||||||||||||||||
| Income tax benefit from stock-based compensation | — | — | — | — | 1,078 | — | — | 1,078 | ||||||||||||||||||||||||
| Other comprehensive loss | — | — | — | — | — | (23,501 | ) | — | (23,501 | ) | ||||||||||||||||||||||
| Dividends declared | — | — | — | — | — | — | (69,397 | ) | (69,397 | ) | ||||||||||||||||||||||
| Balances, December 31, 2015 | 22,874,819 | $ | 229 | 102,216 | $ | 1 | $ | 1,898,085 | $ | 12,371 | $ | (1,426,655 | ) | $ | 484,031 | |||||||||||||||||
The accompanying notes are an integral part of these consolidated financial statements.
| F-5 |
CONSOLIDATED STATEMENTS OF CASH FLOWS
(Dollars in thousands)
| Year Ended December 31, | ||||||||||||
| 2015 | 2014 | 2013 | ||||||||||
| Cash flows from operating activities | ||||||||||||
| Net (loss) income | $ | (69,403 | ) | $ | 7,753 | $ | 52,823 | |||||
| Adjustments to reconcile net (loss) income to net cash provided by operating activities | ||||||||||||
| Investment loss, net | 152,379 | 38,687 | 47,760 | |||||||||
| Net discount accretion on mortgage-backed securities | (8,453 | ) | (12,570 | ) | (9,302 | ) | ||||||
| Deferred tax provision | 36,399 | 46,378 | (23,824 | ) | ||||||||
| Reversal of unrecognized tax benefit related to uncertain tax position and related accrued interest | — | — | (16,212 | ) | ||||||||
| Other | 558 | 2,336 | 2,460 | |||||||||
| Changes in operating assets | ||||||||||||
| Interest receivable | (1,235 | ) | (5,528 | ) | (304 | ) | ||||||
| Other assets | 754 | (7,234 | ) | 4,032 | ||||||||
| Changes in operating liabilities | ||||||||||||
| Interest payable and other liabilities | 1,442 | (355 | ) | (107 | ) | |||||||
| Accrued compensation and benefits | (897 | ) | 483 | 4,042 | ||||||||
| Net cash provided by operating activities | 111,544 | 69,950 | 61,368 | |||||||||
| Cash flows from investing activities | ||||||||||||
| Purchases of private-label mortgage-backed securities | (2,870 | ) | — | (167,682 | ) | |||||||
| Purchases of agency mortgage-backed securities | (2,040,883 | ) | (2,030,995 | ) | (1,221,387 | ) | ||||||
| Proceeds from sales of private-label mortgage-backed securities | 130,138 | 86,318 | 69,337 | |||||||||
| Proceeds from sales of agency mortgage-backed securities | 1,057,842 | 65,251 | 914,155 | |||||||||
| Receipt of principal payments on private-label mortgage-backed securities | 2,033 | 2,372 | 5,215 | |||||||||
| Receipt of principal payments on agency mortgage-backed securities | 467,770 | 212,055 | 165,079 | |||||||||
| (Payments for) proceeds from derivatives and deposits, net | (109,831 | ) | (150,446 | ) | 42,210 | |||||||
| Proceeds from sold securities receivable | — | — | 26,773 | |||||||||
| Other | (14,068 | ) | 412 | 132 | ||||||||
| Net cash used in investing activities | (509,869 | ) | (1,815,033 | ) | (166,168 | ) | ||||||
| Cash flows from financing activities | ||||||||||||
| (Repayments for) proceeds from repurchase agreements, net | (344,995 | ) | 1,632,145 | 50,439 | ||||||||
| Proceeds from Federal Home Loan Bank advances, net | 786,900 | — | — | |||||||||
| Proceeds from stock issuance, net | — | 167,148 | 86,964 | |||||||||
| Proceeds from long-term debt issuance, net | 34,063 | — | 24,038 | |||||||||
| Excess tax benefits associated with stock-based awards | 1,192 | 475 | — | |||||||||
| Dividends paid | (75,087 | ) | (69,481 | ) | (43,850 | ) | ||||||
| Repurchase of common stock | (593 | ) | — | — | ||||||||
| Net cash provided by financing activities | 401,480 | 1,730,287 | 117,591 | |||||||||
| Net increase (decrease) in cash and cash equivalents | 3,155 | (14,796 | ) | 12,791 | ||||||||
| Cash and cash equivalents, beginning of year | 33,832 | 48,628 | 35,837 | |||||||||
| Cash and cash equivalents, end of year | $ | 36,987 | $ | 33,832 | $ | 48,628 | ||||||
| Supplemental Cash Flow Information | ||||||||||||
| Cash payments for interest | $ | 17,353 | $ | 10,959 | $ | 8,272 | ||||||
| Cash payments for taxes | $ | 433 | $ | 2,309 | $ | 667 | ||||||
The accompanying notes are an integral part of these consolidated financial statements.
| F-6 |
ARLINGTON ASSET INVESTMENT CORP.
NOTES TO CONSOLIDATED FINANCIAL STATEMENTS
(Dollars in thousands, except per share amounts)
Note 1. Organization and Nature of Operations
Arlington Asset Investment Corp. (“Arlington Asset”) and its consolidated subsidiaries (unless the context otherwise provides, collectively, the “Company”) is an investment firm that acquires and holds residential mortgage-related assets, primarily comprised of residential mortgage-backed securities (“MBS”). The Company’s investments in MBS include (i) residential mortgage pass-through certificates for which the principal and interest payments are guaranteed by a government-sponsored enterprise (“GSE”) such as the Federal National Mortgage Association (“Fannie Mae”) or the Federal Home Loan Mortgage Corporation (“Freddie Mac”), which are collectively referred to as “agency MBS,” and (ii) residential MBS issued by private institutions for which the principal and interest payments are not guaranteed by a GSE, which are referred to as “private-label MBS” or “non-agency MBS.”
Note 2. Basis of Presentation
The consolidated financial statements are prepared in accordance with accounting principles generally accepted in the United States (“GAAP”) and include the accounts of Arlington Asset and all other entities in which the Company has a controlling financial interest. All intercompany accounts and transactions have been eliminated in consolidation.
The preparation of financial statements in conformity with GAAP requires the Company to make estimates and assumptions that affect amounts reported in the consolidated financial statements. Although the Company bases these estimates and assumptions on historical experience and all other reasonably available information that the Company believes to be relevant under the circumstances, such estimates frequently require management to exercise significant subjective judgment about matters that are inherently uncertain. Actual results may differ from these estimates.
Certain amounts in the consolidated financial statements and notes for prior periods have been reclassified to conform to the current year’s presentation. These reclassifications had no impact on the previously reported net income, other comprehensive income, total assets or total liabilities.
Note 3. Summary of Significant Accounting Policies
Cash Equivalents
Cash equivalents include demand deposits with banks, money market accounts and highly liquid investments with original maturities of three months or less. As of December 31, 2015 and 2014, approximately 98% and 99%, respectively, of the Company’s cash equivalents were invested in money market funds that invest primarily in U.S. Treasuries and other securities backed by the U.S. government.
Investment Security Purchases and Sales
Purchases and sales of investment securities are recorded on the settlement date of the transfer unless the trade qualifies as a “regular-way” trade and the associated commitment qualifies for an exemption from the accounting guidance applicable to derivative instruments. A regular-way trade is an investment security purchase or sale transaction that is expected to settle within the period of time following the trade date that is prevalent or traditional for that specific type of security. Any amounts payable or receivable for unsettled security trades are recorded as “sold securities receivable” or “purchased securities payable” in the consolidated balance sheets.
| F-7 |
Interest Income Recognition for Investments in Agency MBS
Substantially all of the Company’s investments in agency MBS are classified as trading securities. Interest income from trading agency MBS is recognized based upon each security’s stated coupon rate. All other periodic changes in the fair value of trading agency MBS are recognized as a component of “investment loss, net” in the accompanying consolidated statements of comprehensive income. Amortization of purchase premiums and discounts on trading agency MBS, if any, are not recognized as an adjustment to periodic interest income but are, rather, reflected as a component of the periodic changes in fair value recognized in “investment loss, net.”
Beginning in fiscal year 2016, the Company intends to change its accounting policy for recognizing interest income on its investments in agency MBS classified as trading securities by amortizing purchase premiums (or accreting purchase discounts) as an adjustment to interest income in accordance with the “interest method” permitted by GAAP. The change in accounting policy will be retrospectively applied to all historical periods. Because the Company accounts for investments in trading agency MBS on its consolidated balance sheets at fair value with all periodic changes in fair value reflected in the Company’s net income, this change in accounting policy will not have an effect on the Company’s historical or future consolidated balance sheets nor will it have an effect on the Company’s historical or future reported net income or comprehensive income. The change in accounting policy will, however, result in a reclassification between reported “investment gains (losses), net” and interest income on the Company’s historical and future periodic consolidated statements of comprehensive income. As the Company’s agency MBS have generally been acquired at a premium to par value, historical and future reported periodic interest income will be reduced by periodic premium amortization, while periodic investment gains (losses) reported as a component of “investment gain (loss), net” will be increased (decreased) by an equal and offsetting amount. The Company has not yet quantified the impact of this change in accounting policy.
Interest Income Recognition for Investments in Private-Label MBS
The Company’s investments in private-label MBS were generally acquired at significant discounts to their par values due in large part to an expectation that the Company will be unable to collect all of the contractual cash flows of the securities. Investments in private-label MBS acquired prior to 2015 are classified as available-for-sale. The Company elected to classify its investments in private-label MBS acquired in 2015 as trading securities. Interest income from investments in private-label MBS is recognized using a prospective level-yield methodology which is based upon each security’s effective interest rate. The amount of periodic interest income recognized is determined by applying the security’s effective interest rate to its amortized cost basis or reference amount. At the time of acquisition, the security’s effective interest rate is calculated by solving for the single discount rate that equates the present value of the Company’s best estimate of the amount and timing of the cash flows expected to be collected from the security to its purchase price. To prepare its best estimate of cash flows expected to be collected, the Company develops a number of assumptions about the future performance of the pool of mortgage loans that serve as collateral for its investment, including assumptions about the timing and amount of prepayments and credit losses.
In each subsequent quarterly reporting period, the amount and timing of cash flows expected to be collected from the security are re-estimated based upon current information and events. The following table provides a description of how periodic changes in the estimate of cash flows expected to be collected affect interest income recognition prospectively for investments in private-label MBS that are classified as available-for-sale and trading securities, respectively:
| F-8 |
| Effect on Interest Income Recognition for Investments in Private-Label MBS Classified as: | ||||
| Scenario: | Available-for-Sale | Trading | ||
|
A positive change in cash flows occurs.
Actual cash flows exceed prior estimates and/or a positive change occurs in the estimate of expected remaining cash flows. |
If the positive change in cash flows is deemed significant, a revised effective interest rate is calculated and applied prospectively such that the positive change is recognized as incremental interest income over the remaining life of the security. This revised effective interest rate is also used in subsequent periods to determine if any declines in the fair value of that security are other-than-temporary. |
A revised effective interest rate is calculated and applied prospectively such that the positive change in cash flows is recognized as incremental interest income over the remaining life of the security.
| ||
|
An adverse change in cash flows occurs.
Actual cash flows fall short of prior estimates and/or an adverse change occurs in the estimate of expected remaining cash flows. |
The security’s effective interest rate is unaffected. If an adverse change in cash flows occurs for a security that is impaired (that is, its fair value is less than its amortized cost basis), the impairment is considered other-than-temporary due to the occurrence of a credit loss. If a credit loss occurs, the Company writes-down the amortized cost basis of the security to an amount equal to the present value of cash flows expected to be collected, discounted at the security’s existing effective interest rate, and recognizes a corresponding other-than-temporary impairment charge in earnings as a component of “investment gain (loss), net.” | The amount of periodic interest income recognized over the remaining life of the security will be reduced accordingly. Specifically, if an adverse change in cash flows occurs for a security that is impaired (that is, its fair value is less than its reference amount), the reference amount to which the security’s existing effective interest rate will be prospectively applied will be reduced to the present value of cash flows expected to be collected, discounted at the security’s existing effective interest rate. If an adverse change in cash flows occurs for a security that is not impaired, the security’s effective interest rate will be reduced accordingly and applied on a prospective basis. | ||
Other Comprehensive Income
Comprehensive income includes net income as currently reported by the Company on the consolidated statements of comprehensive income adjusted for other comprehensive income. Other comprehensive income for the Company represents periodic unrealized holding gains and losses related to the Company’s investments in MBS classified as available-for-sale. Accumulated unrealized holding gains and losses for available-for-sale MBS are reclassified into net income as a component of “investment gain (loss), net” upon (i) sale and realization or (ii) the occurrence of an other-than-temporary impairment.
Earnings Per Share
Basic earnings per share includes no dilution and is computed by dividing net income or loss available to common shareholders by the weighted-average number of common shares outstanding for the respective period. Diluted earnings per share includes the impact of dilutive securities such as unvested shares of restricted stock and performance share units. The following table presents the computations of basic and diluted earnings per share for the years ended December 31, 2015, 2014 and 2013:
| Year Ended December 31, | ||||||||||||||||||||||||
| 2015 | 2014 | 2013 | ||||||||||||||||||||||
| (Shares in thousands) | Basic | Diluted | Basic | Diluted | Basic | Diluted | ||||||||||||||||||
| Weighted-average shares outstanding common stock | 23,002 | 23,002 | 20,043 | 20,043 | 15,990 | 15,990 | ||||||||||||||||||
| Weighted-average shares outstanding performance share units and unvested restricted stock | — | — | — | 354 | — | 199 | ||||||||||||||||||
| Weighted average common and common equivalent shares outstanding | 23,002 | 23,002 | 20,043 | 20,397 | 15,990 | 16,189 | ||||||||||||||||||
| Net (loss) income | $ | (69,403 | ) | $ | (69,403 | ) | $ | 7,753 | $ | 7,753 | $ | 52,823 | $ | 52,823 | ||||||||||
| Net (loss) income per common share | $ | (3.02 | ) | $ | (3.02 | ) | $ | 0.39 | $ | 0.38 | $ | 3.30 | $ | 3.26 | ||||||||||
The diluted loss per share for the year ended December 31, 2015 did not include the antidilutive effect of 86,372 shares of unvested shares of restricted stock and performance share units.
| F-9 |
Other Significant Accounting Policies
The Company’s other significant accounting policies are described in the following notes:
| Investments in agency MBS, subsequent measurement | Note 4 |
| Investments in private-label MBS, subsequent measurement | Note 5 |
| Borrowings | Note 6 |
| To-be-announced agency MBS transactions, including “dollar rolls” | Note 7 |
| Derivative instruments | Note 7 |
| Balance sheet offsetting | Note 8 |
| Fair value measurements | Note 9 |
| Income taxes | Note 10 |
| Stock-based compensation | Note 13 |
Recent Accounting Pronouncements
The following table provides a brief description of recently issued accounting pronouncements and their actual or expected effect on the Company’s consolidated financial statements:
| Standard | Description | Date of Adoption |
Effect on the Consolidated Financial Statements |
| Recently Adopted Accounting Guidance | |||
| Accounting Standards Update (“ASU”) No. 2014-08, Reporting Discontinued Operations and Disclosures of Disposals of Components of an Entity (Topic 360) | This amendment changes the criteria for determining which disposals can be presented as discontinued operations and modifies related disclosure requirements. | January 1, 2015 | The adoption of this amendment did not have an effect on the Company’s consolidated financial statements. |
| ASU No. 2014-11, Repurchase-to-Maturity Transactions, Repurchase Financings, and Disclosures (Topic 860) | This amendment requires repurchase-to-maturity transactions to be accounted for as secured borrowings. In addition, this amendment requires separate accounting for a transfer of a financial asset executed contemporaneously with a repurchase agreement with the same counterparty (referred to as a “repurchase financing”). | January 1, 2015 | The adoption of this amendment did not have an effect on the Company’s consolidated financial statements. |
| Recently Issued Accounting Guidance Not Yet Adopted | |||
| ASU No. 2015-02, Amendments to the Consolidation Analysis (Topic 810) | This amendment makes targeted changes to the current consolidation guidance and ends the deferral granted to investment companies from applying variable interest entity guidance. | January 1, 2016 |
This amendment is not expected to have a material impact on the Company’s consolidated financial statements.
|
| ASU No. 2015-03, Simplifying the Presentation of Debt Issuance Costs (Subtopic 835-30) | This amendment requires debt issuance costs to be presented in the balance sheet as a direct reduction from the associated debt liability rather than as a separate asset. | January 1, 2016 | The adoption of this amendment will result in a change solely to the balance sheet presentation of debt issuance costs. The resulting change in presentation will not have a material impact on the Company’s consolidated financial statements. |
| ASU No. 2015-14, Revenue from Contracts with Customers (Topic 606) |
This amendment defers the effective date of ASU No. 2014-09 for all entities by one year.
ASU No. 2014-09 requires entities to recognize revenue to depict the transfer of promised goods or services to customers in amounts that reflect the consideration to which the entity expects to be entitled in exchange for those goods or services. Revenue recognition with respect to financial instruments is not within the scope of ASU No. 2014-09. |
January 1, 2018 |
The Company does not expect that the adoption of ASU No. 2015-14 will have a material impact on its consolidated financial statements.
|
| ASU No. 2016-01, Recognition and Measurement of Financial Assets and Financial Liabilities (Subtopic 825-10) | This amendment makes targeted changes to certain aspects of guidance applicable to financial assets and financial liabilities. The amendment primarily affects accounting for certain equity investments, financial liabilities measured under the fair value option, and certain financial instrument presentation and disclosure requirements. Accounting for investments in debt securities and financial liabilities not measured under the fair value option is largely unaffected by this amendment. | January 1, 2018 | The Company is currently evaluating the impact of this amendment on its consolidated financial statements. |
| F-10 |
Note 4. Investments in Agency MBS
The Company’s investments in agency MBS are reported in the accompanying consolidated balance sheets at fair value. Substantially all of the Company’s investments in agency MBS are classified as trading securities. Interest income from trading agency MBS is recognized based upon each security’s stated coupon rate. All other periodic changes in the fair value of trading agency MBS are recognized as a component of “investment loss, net” in the accompanying consolidated statements of comprehensive income. Amortization of purchase premiums and discounts on trading agency MBS, if any, are not recognized as an adjustment to periodic interest income but are, rather, reflected as a component of the periodic changes in fair value recognized in “investment loss, net.”
The following table provides the fair value of the Company’s available-for-sale and trading investments in agency MBS as of the dates indicated:
| Fair Value as of | ||||||||
| December 31, 2015 | December 31, 2014 | |||||||
| Agency MBS classified as: | ||||||||
| Available-for-sale | $ | 26 | $ | 40 | ||||
| Trading | 3,865,290 | 3,414,300 | ||||||
| Total | $ | 3,865,316 | $ | 3,414,340 | ||||
The following table provides additional information about the gains and losses recognized as a component of “investment loss, net” in the Company’s consolidated statements of comprehensive income for the periods indicated with respect to investments in agency MBS classified as trading securities:
| Year Ended December 31, | ||||||||||||
| 2015 | 2014 | 2013 | ||||||||||
| Net (losses) gains recognized in earnings for: | ||||||||||||
| Agency MBS still held at period end | $ | (49,198 | ) | $ | 82,801 | $ | (96,376 | ) | ||||
| Agency MBS sold during the period | (15,140 | ) | 1,351 | (25,787 | ) | |||||||
| Total | $ | (64,338 | ) | $ | 84,152 | $ | (122,163 | ) | ||||
The Company also invests in and finances fixed-rate agency MBS on a generic pool basis through sequential series of to-be-announced security transactions commonly referred to as “dollar rolls.” Dollar rolls are accounted for as a sequential series of derivative instruments. Refer to “Note 7. Derivative Instruments” for further information about dollar rolls.
Note 5. Investments in Private-Label MBS
The Company’s investments in private-label MBS are reported in the accompanying consolidated balance sheets at fair value. Investments in private-label MBS acquired prior to 2015 are classified as available-for-sale. The Company elected to classify its investments in private-label MBS acquired in 2015 as trading securities. The following table provides the fair value of the Company’s available-for-sale and trading investments in private-label MBS as of the dates indicated:
| F-11 |
| Fair Value as of | ||||||||
| December 31, 2015 | December 31, 2014 | |||||||
| Private-label MBS classified as: | ||||||||
| Available-for-sale | $ | 127,536 | $ | 267,437 | ||||
| Trading | 2,899 | — | ||||||
| Total | $ | 130,435 | $ | 267,437 | ||||
As of December 31, 2015, the private-label MBS portfolio consists almost entirely of “re-REMIC” securities. The Company’s investments in re-REMIC securities represent “mezzanine” interests in underlying, re-securitized senior class MBS issued by private-label Real Estate Mortgage Investment Conduit (“REMIC”) securitization trusts. During 2014, the Company’s private-label MBS portfolio also included senior class REMIC securities. The senior class REMIC securities that serve as collateral to the Company’s investments in re-REMIC securities, as well as those held as direct investments during 2014, represent beneficial interests in pools of prime or Alt-A residential mortgage loan collateral that hold the first right to cash flows and absorb credit losses only after their respective subordinate REMIC classes have been fully extinguished. The majority of the trusts that issued the Company’s investments in re-REMIC securities employ a “sequential” principal repayment structure, while a minority of the issuing trusts employ a “pro-rata” principal repayment structure. Accordingly, the majority of the Company’s mezzanine class re-REMIC securities are not entitled to receive principal repayments until the principal balance of the senior interest in the respective collateral group has been reduced to zero. Principal shortfalls are allocated on a “reverse sequential” basis. Accordingly, any principal shortfalls on the underlying senior class REMIC securities are first absorbed by the Company’s mezzanine class re-REMIC securities, to the extent of their respective principal balance, prior to being allocated to the senior interest in the respective collateral pool. Periodic interest accrues on each re-REMIC security’s outstanding principal balance at its contractual coupon rate. The Company’s private-label MBS, on a weighted-average basis, have a nominal amount of remaining structural credit enhancement provided by collateral-level subordinate interests.
The prime and Alt-A residential mortgage loans that serve as collateral to the underlying REMIC securitization trusts of the Company’s private-label MBS had the following weighted average characteristics, based on face value, as of the dates indicated:
| December 31, 2015 | December 31, 2014 | |||||||
| Original loan-to-value | 66 | % | 68 | % | ||||
| Original FICO score | 723 | 722 | ||||||
| Three-month voluntary prepayment rate | 6 | % | 8 | % | ||||
| Three-month default rate | 5 | % | 4 | % | ||||
| Three-month loss severities | 32 | % | 41 | % | ||||
Available-for-Sale Private-Label MBS
Periodic changes in the fair value of the Company’s available-for-sale private-label MBS that are not attributed to interest income or other-than-temporary impairments represent unrealized holding gains and losses. Unrealized holding gains and losses are accumulated in other comprehensive income until the securities are sold. Gross unrealized gains and losses accumulated in other comprehensive income for the Company’s investments in available-for-sale private-label MBS were the following as of the dates indicated:
| December 31, 2015 | ||||||||||||||||
| Amortized Cost Basis (1) | Unrealized | Fair Value | ||||||||||||||
| Gains | Losses | |||||||||||||||
| Private-label MBS | $ | 111,935 | $ | 15,601 | $ | — | $ | 127,536 | ||||||||
| (1) | Amortized cost includes net discounts of $52,620 at December 31, 2015. |
| F-12 |
| December 31, 2014 | ||||||||||||||||
| Amortized Cost Basis (1) | Unrealized | Fair Value | ||||||||||||||
| Gains | Losses | |||||||||||||||
| Private-label MBS | $ | 219,904 | $ | 47,533 | $ | — | $ | 267,437 | ||||||||
| (1) | Amortized cost includes net discounts of $133,333 at December 31, 2014. |
Upon the sale of available-for-sale private-label MBS, any gains or losses accumulated in other comprehensive income are recognized in earnings as a component of “investment gain (loss), net.” The Company uses the specific identification method to determine the realized gain or loss that is recognized in earnings upon the sale of an available-for-sale private-label MBS.
The following table presents the results of sales of available-for-sale private-label MBS for the periods indicated:
| Year Ended December 31, | ||||||||||||
| 2015 | 2014 | 2013 | ||||||||||
| Proceeds from sales | $ | 130,138 | $ | 86,318 | $ | 69,337 | ||||||
| Gross realized gains | 18,145 | 17,397 | 17,458 | |||||||||
| Gross realized losses | 420 | 140 | — | |||||||||
Accretable Yield
The excess of the Company’s estimate of undiscounted future cash flows expected to be collected over the security’s amortized cost basis represents that security’s accretable yield. The accretable yield is expected to be recognized as interest income over the remaining life of the security on a level-yield basis. The difference between undiscounted future contractual cash flows and undiscounted future expected cash flows represents the non-accretable difference. Based on actual payments received and/or changes in the estimate of future cash flows expected to be collected, the accretable yield and the non-accretable difference can change over time. Actual cash collections that exceed prior estimates and/or positive changes in the Company’s periodic estimate of expected future cash flows result in a reclassification of non-accretable difference to accretable yield. Conversely, actual cash collections that fall short of prior estimates and/or adverse changes in the Company’s periodic estimate of expected future cash flows result in a reclassification of accretable yield to non-accretable difference.
The following table presents the changes in the accretable yield solely for available-for-sale private-label MBS for the years ended December 31, 2015 and 2014:
| Year Ended December 31, | ||||||||
| 2015 | 2014 | |||||||
| Beginning balance | $ | 202,108 | $ | 326,330 | ||||
| Accretion | (15,218 | ) | (25,617 | ) | ||||
| Reclassifications, net | (6,202 | ) | (21,848 | ) | ||||
| Acquisitions | — | — | ||||||
| Sales | (95,636 | ) | (76,757 | ) | ||||
| Ending balance | $ | 85,052 | $ | 202,108 | ||||
| F-13 |
Other-than-Temporary Impairments
The Company evaluates available-for-sale MBS for other-than-temporary impairment on a quarterly basis. When the fair value of an available-for-sale security is less than its amortized cost at the quarterly reporting date, the security is considered impaired. Impairments determined to be other-than-temporary are recognized as a direct write-down to the security’s amortized cost basis with a corresponding charge recognized in earnings as a component of “investment gain (loss), net.” An impairment is considered other-than-temporary when (i) the Company intends to sell the impaired security, (ii) the Company more-likely-than not will be required to sell the impaired security prior to the recovery of its amortized cost basis, or (iii) a credit loss exists. A credit loss exists when the present value of the Company’s estimate of the cash flows expected to be collected from the security, discounted at the security’s existing effective interest rate, is less than the security’s amortized cost basis.
If the Company intends to sell an impaired security or it more-likely-than-not will be required to sell an impaired security before recovery of its amortized cost basis, the Company writes-down the amortized cost basis of the security to an amount equal to the security’s fair value and recognizes a corresponding other-than-temporary impairment charge in earnings as a component of “investment gain (loss), net.” If a credit loss exists for an impaired security that the Company does not intend to sell nor will it likely be required to sell prior to recovery, the Company writes-down the amortized cost basis of the security to an amount equal to the present value of cash flows expected to be collected, discounted at the security’s existing effective interest rate, and recognizes a corresponding other-than-temporary impairment charge in earnings as a component of “investment gain (loss), net.”
For the years ended December 31, 2015 and 2014, the Company recorded credit related other-than-temporary impairment charges of $2,417 and $420, respectively, as a component of “investment loss, net” on the consolidated statements of comprehensive income on certain available-for-sale private-label MBS. The following table presents a summary of cumulative credit related other-than-temporary impairment charges recognized on the available-for-sale private-label MBS held as of the dates indicated:
| Year Ended December 31, | ||||||||
| 2015 | 2014 | |||||||
| Cumulative credit related other-than-temporary impairments, beginning balance | $ | 18,903 | $ | 23,663 | ||||
| Additions for: | ||||||||
| Securities for which other-than-temporary impairments have not previously occurred | 2,417 | 420 | ||||||
| Securities with previously recognized other-than-temporary impairments | — | — | ||||||
| Reductions for sold or matured securities | (7,303 | ) | (5,180 | ) | ||||
| Cumulative credit related other-than-temporary impairments, ending balance | $ | 14,017 | $ | 18,903 | ||||
Trading Private-Label MBS
Periodic changes in the fair value of investments in trading private-label MBS that are not attributable to interest income are recognized as a component of “investment gain (loss), net” in the Company’s consolidated statements of comprehensive income. The following table provides additional information about the gains and losses recognized as a component of “investment loss, net” for the periods indicated with respect to investments in private-label MBS classified as trading securities:
| Year Ended December 31, | ||||||||||||
| 2015 | 2014 | 2013 | ||||||||||
| Net losses recognized in earnings for: | ||||||||||||
| Private-label MBS still held at period end | $ | (2 | ) | $ | — | $ | — | |||||
| Private-label MBS sold during the period | — | — | — | |||||||||
| Total | $ | (2 | ) | $ | — | $ | — | |||||
| F-14 |
Note 6. Borrowings
Repurchase Agreements
The Company finances the purchase of MBS through repurchase agreements, which are accounted for as collateralized borrowing arrangements. In a repurchase transaction, the Company sells MBS to a counterparty under a master repurchase agreement in exchange for cash and concurrently agrees to repurchase the same security at a future date in an amount equal to the cash initially exchanged plus an agreed-upon amount of interest. MBS sold under agreements to repurchase remain on the Company’s consolidated balance sheets because the Company maintains effective control over such securities throughout the duration of the arrangement. Throughout the contractual term of a repurchase agreement, the Company recognizes a “repurchase agreement” liability on its consolidated balance sheets to reflect the obligation to repay to the counterparty the proceeds received upon the initial transfer of the MBS. The difference between the proceeds received by the Company upon the initial transfer of the MBS and the contractually agreed-upon repurchase price is recognized as interest expense over the term of the repurchase arrangement on a level-yield basis.
Amounts borrowed pursuant to repurchase agreements are equal in value to a specified percentage of the fair value of the pledged collateral. The Company retains beneficial ownership of the pledged collateral throughout the term of the repurchase agreement. The counterparty to the repurchase agreements may require that the Company pledge additional securities or cash as additional collateral to secure borrowings when the value of the collateral declines.
As of December 31, 2015 and 2014, the Company had no amount at risk with a single repurchase agreement counterparty or lender greater than 10% of equity. The following table provides information regarding the Company’s outstanding repurchase agreement borrowings as of December 31, 2015 and December 31, 2014:
| December 31, 2015 | December 31, 2014 | |||||||
| Pledged with agency MBS: | ||||||||
| Repurchase agreements outstanding | $ | 2,797,561 | $ | 3,137,586 | ||||
| Agency MBS collateral, at fair value | 2,946,684 | 3,300,383 | ||||||
| Net amount (1) | 149,123 | 162,797 | ||||||
| Weighted-average rate | 0.61 | % | 0.38 | % | ||||
| Weighted-average term to maturity | 12.8 days | 14.0 days | ||||||
| Pledged with private-label MBS: | ||||||||
| Repurchase agreements outstanding | $ | 37,219 | $ | 42,189 | ||||
| Private-label MBS collateral, at fair value | 70,511 | 75,642 | ||||||
| Net amount (1) | 33,292 | 33,453 | ||||||
| Weighted-average rate | 2.42 | % | 1.98 | % | ||||
| Weighted-average term to maturity | 16.9 days | 21.8 days | ||||||
| Total MBS: | ||||||||
| Repurchase agreements outstanding | $ | 2,834,780 | $ | 3,179,775 | ||||
| MBS collateral, at fair value | 3,017,195 | 3,376,025 | ||||||
| Net amount (1) | 182,415 | 196,250 | ||||||
| Weighted-average rate | 0.64 | % | 0.40 | % | ||||
| Weighted-average term to maturity | 12.8 days | 14.1 days | ||||||
| (1) | Net amount represents the value of collateral in excess of corresponding repurchase obligation. The amount of collateral at-risk is limited to the outstanding repurchase obligation and not the entire collateral balance. |
| F-15 |
The following table provides information regarding the Company’s outstanding repurchase agreement borrowings during the years ended December 31, 2015 and 2014:
| December 31, 2015 | December 31, 2014 | |||||||
| Weighted-average outstanding balance | $ | 3,390,402 | $ | 2,438,479 | ||||
| Weighted-average rate | 0.42 | % | 0.37 | % | ||||
Federal Home Loan Bank Advances
In September 2015, the Company’s wholly-owned captive insurance subsidiary, Key Bridge Insurance, LLC (“Key Bridge”), was granted membership to the Federal Home Loan Bank of Cincinnati (“FHLBC”). The FHLBC, like each of the 11 regional Federal Home Loan Banks (collectively, the “FHLB”), is a cooperative that provides its member financial institutions with a number of financial products and services, including short and long-term secured borrowings that are known as “advances.” FHLBC advances may be collateralized by a number of real estate related assets, including agency MBS. As a member of the FHLBC, Key Bridge is required to acquire membership stock as well as activity-based stock (the amount of which is based upon a percentage of the dollar amount of its outstanding advances) in the FHLBC. As of December 31, 2015, Key Bridge had acquired $15,740 of capital stock in the FHLBC, which is included in “other assets” in the accompanying consolidated balance sheets. Similar to a repurchase agreement borrowing, the Company pledges agency MBS as collateral to secure the advance to Key Bridge, the amount of which is equal to a specified percentage of the fair value of the pledged collateral. The Company retains beneficial ownership of the pledged collateral throughout the term of the advance arrangement. The FHLBC may require that the Company pledge additional collateral to secure borrowings when the value of the collateral declines.
The following table provides information regarding the Company’s outstanding FHLB advances as of December 31, 2015:
| December 31, 2015 | ||||
| Pledged with agency MBS: | ||||
| FHLB advances outstanding | $ | 786,900 | ||
| Agency MBS collateral, at fair value | 805,163 | |||
| Net amount (1) | 18,263 | |||
| Weighted-average rate | 0.36 | % | ||
| Weighted-average term to maturity | 11.6 days | |||
| (1) | Net amount represents the value of collateral in excess of corresponding FHLB advance. The amount of collateral at-risk is limited to the outstanding FHLB advance and not the entire collateral balance. |
On January 12, 2016, the regulator of the FHLB system, the Federal Housing Finance Agency (“FHFA”), released a final rule that amends regulations governing FHLB membership, including an amendment which prevents captive insurance companies from being eligible for FHLB membership. Under the terms of the final rule, Key Bridge is required to terminate its membership and repay its existing advances within one year following the effective date of the final rule. In addition, Key Bridge is prohibited from obtaining new advances or renewing existing advances upon their maturity during the one year transition period. The final rule becomes effective on February 19, 2016. Subsequent to the release of the final rule, the Company has repaid all of its outstanding FHLBC advances, funded primarily through proceeds obtained from traditional repurchase agreement financing arrangements.
| F-16 |
Long-Term Debt
As of December 31, 2015 and December 31, 2014, the Company had $75,300 and $40,000, respectively, of outstanding long-term debentures. The Company’s long-term debentures consisted of the following as of the dates indicated:
| December 31, 2015 | December 31, 2014 | |||||||||||||||||||
| Senior Notes Due 2025 | Senior Notes Due 2023 | Trust Preferred Debt | Senior Notes Due 2023 | Trust Preferred Debt | ||||||||||||||||
| Outstanding Principal | $ | 35,300 | $ | 25,000 | $ | 15,000 | $ | 25,000 | $ | 15,000 | ||||||||||
| Annual Interest Rate | 6.75 | % | 6.625 | % | LIBOR+ 2.25 – 3.00 % | 6.625 | % | LIBOR+ 2.25 – 3.00 % | ||||||||||||
| Interest Payment Frequency | Quarterly | Quarterly | Quarterly | Quarterly | Quarterly | |||||||||||||||
| Weighted-Average Interest Rate | 6.75 | % | 6.625 | % | 3.07 | % | 6.625 | % | 2.98 | % | ||||||||||
| Maturity | March 15, 2025 | May 1, 2023 | 2033 – 2035 | May 1, 2023 | 2033 – 2035 | |||||||||||||||
| Early Redemption Date | March 15, 2018 | May 1, 2016 | 2008 – 2010 | May 1, 2016 | 2008 – 2010 | |||||||||||||||
On March 18, 2015, the Company completed a public offering of $35,300 of 6.75% senior notes due in 2025 and received net proceeds of $34,063 after payment of underwriting discounts, commissions, and expenses.
The senior notes due 2023 and the senior notes due 2025 are publicly traded on the New York Stock Exchange under the ticker symbols “AIW” and “AIC,” respectively. The senior notes due 2023 and senior notes due 2025 may be redeemed in whole or in part at any time and from time to time at the Company’s option on or after May 1, 2016 and March 15, 2018, respectively, at a redemption price equal to the principal amount plus accrued and unpaid interest. The indenture governing these senior notes contains certain covenants, including limitations on the Company’s ability to merge or consolidate with other entities or sell or otherwise dispose of all or substantially all of the Company’s assets.
Note 7. Derivative Instruments
In the normal course of its operations, the Company is a party to financial instruments that are accounted for as derivative instruments. Derivative instruments are recorded at fair value as either “derivative assets” or “derivative liabilities” in the consolidated balance sheets, with all periodic changes in fair value reflected as a component of “investment gain (loss), net” in the consolidated statements of comprehensive income. Cash receipts or payments related to derivative instruments are classified in the investing section of the consolidated statements of cash flows.
Types and Uses of Derivative Instruments
Interest Rate Derivatives
Most of the Company’s derivative instruments are interest rate derivatives that are intended to economically hedge changes, attributable to changes in benchmark interest rates, in certain MBS fair values and future interest cash flows on the Company’s short-term financing arrangements. Interest rate derivatives include centrally cleared interest rate swaps as well as exchange-traded instruments, such as Eurodollar futures, interest rate swap futures, U.S. Treasury note futures, and options on futures. While the Company uses its interest rate derivatives to economically hedge a portion of its interest rate risk, it has not designated such contracts as hedging instruments for financial reporting purposes.
The Company exchanges collateral with the counterparties to its interest rate derivative instruments at least on a daily basis based upon daily changes in fair value (also known as “variation margin”) as measured by the central clearinghouse through which those derivatives are cleared. In addition, the central clearinghouse requires market participants to deposit and maintain an “initial margin” amount which is determined by the clearinghouse and is generally intended to be set at a level sufficient to protect the clearinghouse from the maximum estimated single-day price movement in that market participant’s contracts. Cash initial and variation margin posted by the Company in respect of interest rate derivatives is included in the line item “deposits” in the accompanying consolidated balance sheets.
| F-17 |
To-Be-Announced Agency MBS Transactions, Including “Dollar Rolls”
In addition to interest rate derivatives that are used for interest rate risk management, the Company is a party to derivative instruments that economically serve as investments, such as forward contracts to purchase or sell fixed-rate “pass-through” agency MBS on a non-specified pool basis, which are known as to-be-announced (“TBA”) contracts. A TBA contract is a forward contract for the purchase or sale of a fixed-rate agency MBS at a predetermined price, face amount, issuer, coupon, and stated maturity on an agreed upon future date. The specific agency MBS that will be delivered to satisfy the TBA trade is not known at the inception of the trade. The Company accounts for TBA contracts as derivative instruments because the Company cannot assert that it is probable at inception and throughout the term of an individual TBA contract that its settlement will result in physical delivery of the agency MBS, or the individual TBA contract will not settle in the shortest time period possible.
The Company’s agency MBS investment portfolio includes net purchase (or “net long”) positions in TBA securities, which are primarily the result of executing sequential series of “dollar roll” transactions. The Company executes dollar roll transactions as a means of investing in and financing non-specified pools of fixed-rate agency MBS. Such transactions involve effectively delaying (or “rolling”) the settlement of a forward purchase of a TBA agency MBS by entering into an offsetting sale prior to the settlement date, net settling the “paired-off” positions in cash, and contemporaneously entering another forward purchase of a TBA agency MBS of the same characteristics for a later settlement date. TBA securities purchased or sold for a forward settlement month are generally priced at a discount relative to TBA securities purchased for settlement in the current month. This discount, often referred to as the dollar roll “price drop,” reflects compensation for the net interest income (interest income less financing costs) that is foregone as a result of relinquishing beneficial ownership of the MBS for the duration of the dollar roll (also known as “dollar roll income”). By executing a sequential series of dollar roll transactions, the Company is able to create the economic experience of investing in an agency MBS, financed with a repurchase agreement, over a period of time. Forward purchases and sales of TBA securities are accounted for as derivative instruments in the Company’s financial statements. Accordingly, dollar roll income is recognized as a component of “investment gains (losses), net” along with all other periodic changes in the fair value of TBA commitments.
Cash collateral posted by the Company with respect to TBA transactions is included in the line item “deposits” in the accompanying consolidated balance sheets.
In addition to TBA transactions, the Company may, from time to time, enter into commitments to purchase or sell other types of investment securities that do not qualify as regular-way security trades. Such commitments are also accounted for as derivative instruments.
Derivative Instrument Population and Fair Value
The following table presents the fair value of the Company’s derivative instruments as of the dates indicated:
| December 31, 2015 | December 31, 2014 | |||||||||||||||
| Assets | Liabilities | Assets | Liabilities | |||||||||||||
| Interest rate swaps | $ | 6,153 | $ | — | $ | — | $ | — | ||||||||
| 10-year U.S. Treasury note futures | 6,813 | — | — | — | ||||||||||||
| Eurodollar futures | — | — | 751 | (76,848 | ) | |||||||||||
| 10-year interest rate swap futures | — | — | — | (47,460 | ) | |||||||||||
| Put options on Eurodollar futures | 25 | — | — | — | ||||||||||||
| TBA commitments | — | (553 | ) | 516 | — | |||||||||||
| Total | $ | 12,991 | $ | (553 | ) | $ | 1,267 | $ | (124,308 | ) | ||||||
| F-18 |
Interest Rate Swaps
The following table presents information as of the date indicated about the Company’s interest rate swap agreements executed in the fourth quarter of 2015, all of which represent agreements to make semiannual interest payments based upon a fixed interest rate and receive quarterly variable interest payments based upon the prevailing three-month LIBOR rate on the date of reset:
| December 31, 2015 | ||||||||||||||||
| Notional Amount | Average Fixed Pay Rate | Average Remaining Maturity (Years) | Fair Value | |||||||||||||
| Years to maturity: | ||||||||||||||||
| Less than 2 years | $ | 750,000 | 1.04 | % | 1.9 | $ | 1,166 | |||||||||
| 2 to 10 years | 750,000 | 2.12 | % | 9.9 | 4,987 | |||||||||||
| Total / weighted-average | $ | 1,500,000 | 1.58 | % | 5.9 | $ | 6,153 | |||||||||
10-year U.S. Treasury Note Futures
The Company’s 10-year U.S. Treasury note futures held as of December 31, 2015 are short positions with an aggregate notional amount of $1,335,000 that mature in March 2016. Upon the maturity date of these futures contracts, the Company has the option to either net settle each contract in cash in an amount equal to the difference between the then-current fair value of the underlying 10-year U.S. Treasury note and the contractual sale price inherent to the futures contract, or to physically settle the contract by delivering the underlying 10-year U.S. Treasury note.
TBA Transactions
The following tables present information about the Company’s TBA purchase and sale commitments as of the dates indicated:
| December 31, 2015 | ||||||||||||||||
| Notional Amount: Net Purchase (Sale) Commitment | Average Contractual Forward Price | Average Market Price | Fair Value | |||||||||||||
| 30-year 3.5% coupon | $ | 275,000 | $ | 283,928 | $ | 283,469 | $ | (459 | ) | |||||||
| 30-year 4.0% coupon | 100,000 | 105,883 | 105,789 | (94 | ) | |||||||||||
| Total / weighted-average | $ | 375,000 | $ | 389,811 | $ | 389,258 | $ | (553 | ) | |||||||
| December 31, 2014 | ||||||||||||||||
| Notional Amount: Net Purchase (Sale) Commitment | Average Contractual Forward Price | Average Market Price | Fair Value | |||||||||||||
| 30-year 4.0% coupon | $ | 200,000 | $ | 213,047 | $ | 213,563 | $ | 516 | ||||||||
| F-19 |
Derivative Instrument Gains and Losses
For the years ended December 31, 2015 and 2014, the Company recorded net losses of $105,349 and $140,353, respectively, on its derivative instruments as a component of “investment gain (loss), net.” The following tables provide further information about the derivative gains and losses recognized within the periods indicated:
| For the Year Ended December 31, | ||||||||
| 2015 | 2014 | |||||||
| Interest rate derivatives: | ||||||||
| Interest rate swaps – accrual of periodic settlements, net (1) | $ | (1,282 | ) | $ | — | |||
| Interest rate swaps – unrealized gains, net | 7,419 | — | ||||||
| Eurodollar futures, net | (60,090 | ) | (50,293 | ) | ||||
| U.S. Treasury note futures, net | 10,229 | 1,574 | ||||||
| 10-year interest rate swap futures and other, net | (63,309 | ) | (97,412 | ) | ||||
| Total interest rate derivative losses, net | (107,033 | ) | (146,131 | ) | ||||
| TBA commitments, net | 1,684 | 5,778 | ||||||
| Total derivative losses, net | $ | (105,349 | ) | $ | (140,353 | ) | ||
| (1) | Represents the periodic net interest settlement incurred during the period (often referred to as "net interest carry"). |
Derivative Instrument Activity
The following tables summarize the volume of activity, in terms of notional amount, related to derivative instruments for the periods indicated:
| For the Year Ended December 31, 2015 | ||||||||||||||||||||
| Beginning of Period | Additions | Scheduled Settlements | Early Terminations | End of Period | ||||||||||||||||
| Eurodollar futures | $ | 41,090,000 | $ | 11,841,000 | $ | (7,235,000 | ) | $ | (45,696,000 | ) | $ | — | ||||||||
| 10-year interest rate swap futures | 1,145,000 | 2,685,000 | (3,130,000 | ) | (700,000 | ) | — | |||||||||||||
| Interest rate swaps | — | 1,500,000 | — | — | 1,500,000 | |||||||||||||||
| 2-year U.S. Treasury note futures | — | 350,000 | (350,000 | ) | — | — | ||||||||||||||
| 10-year U.S. Treasury note futures | — | 3,020,000 | (1,510,000 | ) | (175,000 | ) | 1,335,000 | |||||||||||||
| Put options on Eurodollar futures | — | 6,000,000 | (2,000,000 | ) | — | 4,000,000 | ||||||||||||||
| Commitments to purchase (sell) MBS, net | 200,000 | 2,782,544 | (2,607,544 | ) | — | 375,000 | ||||||||||||||
| F-20 |
| For the Year Ended December 31, 2014 | ||||||||||||||||||||
| Beginning of Period | Additions | Scheduled Settlements | Early Terminations | End of Period | ||||||||||||||||
| Eurodollar futures | $ | 15,545,000 | $ | 25,585,000 | $ | (40,000 | ) | $ | — | $ | 41,090,000 | |||||||||
| 10-year interest rate swap futures | 666,500 | 2,635,000 | (2,121,500 | ) | (35,000 | ) | 1,145,000 | |||||||||||||
| 5-year U.S. Treasury note futures | 100,000 | — | (100,000 | ) | — | — | ||||||||||||||
| Commitments to purchase (sell) MBS, net | 44,511 | 2,526,354 | (2,370,865 | ) | — | 200,000 | ||||||||||||||
Cash Collateral Posted for Derivative Instruments
The following table presents information about the cash collateral posted by the Company in respect of its derivative instruments, which is included in the line item “deposits” in the accompanying consolidated balance sheets:
| For the Year Ended December 31, | ||||||||
| 2015 | 2014 | |||||||
| Interest rate swaps | $ | 17,434 | $ | — | ||||
| Eurodollar futures | — | 96,147 | ||||||
| U.S. Treasury note futures | 11,197 | — | ||||||
| 10-year interest rate swap futures | — | 64,280 | ||||||
| TBA commitments | 798 | — | ||||||
| Total cash collateral posted | $ | 29,429 | $ | 160,427 | ||||
Note 8. Offsetting of Financial Assets and Liabilities
The agreements that govern certain of the Company’s derivative instruments and short-term financing arrangements provide for a right of setoff in the event of default or bankruptcy with respect to either party to such transactions. The Company presents derivative instruments and short-term financing arrangements, including any associated recognized collateral, in its consolidated balance sheets on a gross basis.
The following tables present information, as of the dates indicated, about the Company’s derivative instruments and short-term borrowing arrangements, including those subject to master netting (or similar) arrangements:
| As of December 31, 2015 | ||||||||||||||||||||||||
| Gross Amount Recognized | Amount Offset in the Consolidated Balance Sheets | Net Amount Presented in the Consolidated Balance Sheets | Gross Amount Not Offset in the Consolidated Balance Sheets | Net Amount | ||||||||||||||||||||
| Financial Instruments (1) | Cash Collateral (2) | |||||||||||||||||||||||
| Assets: | ||||||||||||||||||||||||
| Derivative instruments: | ||||||||||||||||||||||||
| Interest rate swaps | $ | 6,153 | $ | — | $ | 6,153 | $ | — | $ | — | $ | 6,153 | ||||||||||||
| 10-year U.S. Treasury note futures | 6,813 | — | 6,813 | — | — | 6,813 | ||||||||||||||||||
| Put options on Eurodollar futures | 25 | — | 25 | — | — | 25 | ||||||||||||||||||
| Total derivative instruments | 12,991 | — | 12,991 | — | — | 12,991 | ||||||||||||||||||
| Total assets | $ | 12,991 | $ | — | $ | 12,991 | $ | — | $ | — | $ | 12,991 | ||||||||||||
| Liabilities: | ||||||||||||||||||||||||
| Derivative instruments: | ||||||||||||||||||||||||
| TBA commitments | $ | 553 | $ | — | $ | 553 | $ | — | $ | (387 | ) | $ | 166 | |||||||||||
| Total derivative instruments | 553 | — | 553 | — | (387 | ) | 166 | |||||||||||||||||
| Repurchase agreements | 2,834,780 | — | 2,834,780 | (2,834,780 | ) | — | — | |||||||||||||||||
| Federal Home Loan Bank advances | 786,900 | — | 786,900 | (786,900 | ) | — | — | |||||||||||||||||
| Total liabilities | $ | 3,622,233 | $ | — | $ | 3,622,233 | $ | (3,621,680 | ) | $ | (387 | ) | $ | 166 | ||||||||||
| F-21 |
| As of December 31, 2014 | ||||||||||||||||||||||||
| Gross Amount Recognized | Amount Offset in the Consolidated Balance Sheets | Net Amount Presented in the Consolidated Balance Sheets | Gross Amount Not Offset in the Consolidated Balance Sheets | Net Amount | ||||||||||||||||||||
| Financial Instruments (1) | Cash Collateral (2) | |||||||||||||||||||||||
| Assets: | ||||||||||||||||||||||||
| Derivative instruments: | ||||||||||||||||||||||||
| Eurodollar futures | $ | 751 | $ | — | $ | 751 | $ | (751 | ) | $ | — | $ | — | |||||||||||
| TBA commitments | 516 | — | 516 | — | — | 516 | ||||||||||||||||||
| Total derivative instruments | 1,267 | — | 1,267 | (751 | ) | — | 516 | |||||||||||||||||
| Total assets | $ | 1,267 | $ | — | $ | 1,267 | $ | (751 | ) | $ | — | $ | 516 | |||||||||||
| Liabilities: | ||||||||||||||||||||||||
| Derivative instruments: | ||||||||||||||||||||||||
| Eurodollar futures | $ | 76,848 | $ | — | $ | 76,848 | $ | (751 | ) | $ | (76,097 | ) | $ | — | ||||||||||
| 10-year interest rate swap futures | 47,460 | — | 47,460 | — | (47,460 | ) | — | |||||||||||||||||
| Total derivative instruments | 124,308 | — | 124,308 | (751 | ) | (123,557 | ) | — | ||||||||||||||||
| Repurchase agreements | 3,179,775 | — | 3,179,775 | (3,179,775 | ) | — | — | |||||||||||||||||
| Total liabilities | $ | 3,304,083 | $ | — | $ | 3,304,083 | $ | (3,180,526 | ) | $ | (123,557 | ) | $ | — | ||||||||||
| (1) | Does not include the fair value amount of financial instrument collateral pledged in respect of repurchase agreements or Federal Home Loan Bank advances that exceeds the associated liability presented in the consolidated balance sheets. |
| (2) | Does not include the amount of cash collateral pledged in respect of derivative instruments that exceeds the associated derivative liability presented in the consolidated balance sheets. |
| F-22 |
Note 9. Fair Value Measurements
Fair Value of Financial Instruments
The accounting principles related to fair value measurements define fair value as the price that would be received to sell an asset or paid to transfer a liability in an orderly transaction between market participants at the measurement date. Financial Accounting Standards Board Accounting Standards Codification (“ASC”) Topic 820, Fair Value Measurements and Disclosures (“ASC Topic 820”), establishes a fair value hierarchy that prioritizes the inputs to valuation techniques used to measure fair value into three broad levels, giving the highest priority to quoted prices in active markets for identical assets or liabilities (Level 1) and the lowest priority to unobservable inputs (Level 3) as described below:
| Level 1 Inputs — | Unadjusted quoted prices in active markets for identical assets or liabilities that are accessible by the Company at the measurement date; |
| Level 2 Inputs — | Quoted prices in markets that are not active or financial instruments for which all significant inputs are observable, either directly or indirectly; and |
| Level 3 Inputs — | Unobservable inputs for the asset or liability, including significant judgments made by the Company about the assumptions that a market participant would use. |
The Company measures the fair value of the following assets and liabilities:
Mortgage-backed securities
Agency MBS — The Company’s investments in agency MBS are classified within Level 2 of the fair value hierarchy. Inputs to fair value measurements of the Company’s investments in agency MBS include price estimates obtained from third-party pricing services. In determining fair value, third party pricing sources use various valuation approaches, including market and income approaches. The Company makes inquiries of the third party pricing sources to understand the significant inputs and assumptions used to determine prices. The Company reviews the various third-party fair value estimates and performs procedures to validate their reasonableness, including comparison to recent trading activity for similar securities and an overall review for consistency with market conditions observed as of the measurement date.
Private-label MBS — The Company’s investments in private-label MBS are classified within Level 3 of the fair value hierarchy as private-label MBS trade infrequently and, therefore, the measurement of their fair value requires the use of significant unobservable inputs. In determining fair value, the Company primarily uses an income approach as well as market approaches. The Company utilizes present value techniques based on estimated cash flows of the instrument taking into consideration various assumptions derived by management based on their observations of assumptions used by market participants. These assumptions are corroborated by evidence such as historical collateral performance data, evaluation of historical collateral performance data for other securities with comparable or similar risk characteristics, and observed completed or pending transactions in similar instruments, when available. The significant inputs to the Company’s valuation process include collateral default, loss severity, prepayment, and discount rates (i.e., the rate of return demanded by market participants as of the measurement date). In general, significant increases (decreases) in default, loss severity, or discount rate assumptions, in isolation, would result in a significantly lower (higher) fair value measurement. However, significant increases (decreases) in prepayment rate assumptions, in isolation, may result in a significantly higher (lower) fair value measurement depending upon the instrument’s specific characteristics and the overall payment structure of the issuing securitization vehicle. It is difficult to generalize the interrelationships between these significant inputs as the actual results could differ considerably on an individual security basis. Therefore, each significant input is closely analyzed to ascertain its reasonableness for the Company’s purposes of fair value measurement.
| F-23 |
Measuring fair value is inherently subjective given the volatile and sometimes illiquid markets for these private-label MBS and requires management to make a number of judgments about the assumptions that a market participant would use, including assumptions about the timing and amount of future cash flows as well as the rate of return demanded by market participants. The assumptions the Company applies are specific to each security. Although the Company relies on its internal calculations to estimate the fair value of these private-label MBS, the Company considers indications of value from actual sales of similar private-label MBS to assist in the valuation process and to calibrate the Company’s models.
Derivative instruments
Exchange-traded derivative instruments — Exchange-traded derivative instruments, which include Eurodollar futures, U.S. Treasury note futures, interest rate swap futures, and options on futures, are classified within Level 1 of the fair value hierarchy as they are measured using quoted prices for identical instruments in liquid markets.
Centrally cleared interest rate swaps — Centrally cleared interest rate swaps are classified within Level 2 of the fair value hierarchy. The fair values of centrally cleared interest rate swaps are measured using the daily valuations reported by the clearinghouse through which the instrument was cleared. In performing its end-of-day valuations, the clearinghouse constructs forward interest rate curves (for example, three-month LIBOR forward rates) from its specific observations of that day’s trading activity. The clearinghouse uses the applicable forward interest rate curve to develop a market-based forecast of future remaining contractually required cash flows for each interest rate swap. Each market-based cash flow forecast is then discounted using the overnight index swap rate curve (sourced from the Federal Reserve Bank of New York) to determine a net present value amount which represents the instrument’s fair value. The Company reviews the valuations reported by the clearinghouse on an ongoing basis and performs procedures using readily available market data to independently verify their reasonableness.
Forward purchases and sales of TBA securities — Forward purchases and sales of TBA securities are generally classified within Level 2 of the fair value hierarchy. The fair value of each forward TBA contract is measured using broker or dealer quotations, which are based upon readily observable transaction prices occurring on the measurement date for forward contracts to buy or sell TBA securities with the same guarantor, contractual maturity, and coupon rate for delivery on the same forward settlement date as the contract under measurement.
Other
Long-term debt — As of December 31, 2015 and 2014, the Company’s long-term debt was $75,300 and $40,000, respectively, and consists of senior notes and trust preferred debt issued by the Company. The Company’s estimate of the fair value of long-term debt is $59,130 and $39,200 as of December 31, 2015 and 2014, respectively. The Company’s senior notes, which are publicly traded on the New York Stock Exchange, are classified within Level 1 of the fair value hierarchy. Trust preferred debt is classified within Level 2 of the fair value hierarchy as the fair value is estimated based on the quoted prices of the Company’s publicly traded senior notes.
FHLBC capital stock — FHLBC capital stock is initially purchased at par and may only be transferred back to the FHLBC or to another FHLBC member, subject to approval by the FHLBC, also at par. Due to the restrictions placed on transferability, it is not practical to determine the fair value of FHLBC capital stock. The par value and carrying amount of the FHLBC capital stock included in the line item “other assets” on the Company’s consolidated balance sheets is $15,740 as of December 31, 2015.
| F-24 |
Investments in equity securities of non-public companies and investment funds — As of December 31, 2015 and 2014, the Company had investments in equity securities and investment funds of $1,558 and $1,625, respectively, which are recorded at cost, net of impairments, and included in the line item “other assets” in the accompanying consolidated balance sheets. The Company’s estimate of the fair value of investments in equity securities and investment funds is $5,989 and $4,368 at December 31, 2015 and December 31, 2014, respectively. Investments in equity securities and investment funds are classified within Level 3 of the fair value hierarchy. The fair values of the Company’s investments in equity securities and investment funds, which are measured at fair value for the purposes of disclosure only, are not readily determinable. Accordingly, for its investments in equity securities, the Company estimates fair value by estimating the enterprise value of the investee and then waterfalls the enterprise value over the investee’s securities in the order of their preference relative to one another. To estimate the enterprise value of the investee, the Company uses traditional valuation methodologies, including recent investments in or tender offers for the equity securities of the investee. For its investments in investment funds, the Company estimates fair value based upon the investee’s net asset value per share.
Investments in interest-only MBS — The Company’s investments in interest-only MBS are included in the line item “other assets” on the Company’s consolidated balance sheets. The Company’s investments in interest-only MBS are classified within Level 3 of the fair value hierarchy because, like other private-label MBS, they are of an instrument type that trades infrequently and, accordingly, the measurement of fair value requires the use of significant unobservable inputs. The Company measures the fair value of its investments in interest-only MBS using a discounted cash flow technique consistent with that of its other investments in private-label MBS.
Financial assets and liabilities for which carrying value approximates fair value — Cash and cash equivalents, deposits, receivables, repurchase agreements, FHLB advances, payables, and other assets and liabilities are reflected in the consolidated balance sheets at their cost, which, due to the short-term nature of these instruments and their limited inherent credit risk, approximates fair value.
Fair Value Hierarchy
Financial Instruments Measured at Fair Value on a Recurring Basis
The following tables set forth financial instruments measured at fair value by level within the fair value hierarchy as of December 31, 2015 and 2014. Assets and liabilities are classified in their entirety based on the lowest level of input that is significant to the fair value measurement.
| December 31, 2015 | ||||||||||||||||
| Total | Level 1 | Level 2 | Level 3 | |||||||||||||
| MBS | ||||||||||||||||
| Trading: | ||||||||||||||||
| Agency MBS | $ | 3,865,290 | $ | — | $ | 3,865,290 | $ | — | ||||||||
| Private-label MBS | 2,899 | — | — | 2,899 | ||||||||||||
| Total trading | 3,868,189 | — | 3,865,290 | 2,899 | ||||||||||||
| Available-for-sale: | ||||||||||||||||
| Agency MBS | 26 | — | 26 | — | ||||||||||||
| Private-label MBS | 127,536 | — | — | 127,536 | ||||||||||||
| Total available-for-sale | 127,562 | — | 26 | 127,536 | ||||||||||||
| Total MBS | 3,995,751 | — | 3,865,316 | 130,435 | ||||||||||||
| Derivative assets | 12,991 | 6,838 | 6,153 | — | ||||||||||||
| Derivative liabilities | (553 | ) | — | (553 | ) | — | ||||||||||
| Interest-only MBS | 118 | — | — | 118 | ||||||||||||
| Total | $ | 4,008,307 | $ | 6,838 | $ | 3,870,916 | $ | 130,553 | ||||||||
| F-25 |
| December 31, 2014 | ||||||||||||||||
| Total | Level 1 | Level 2 | Level 3 | |||||||||||||
| MBS | ||||||||||||||||
| Trading: | ||||||||||||||||
| Agency MBS | $ | 3,414,300 | $ | — | $ | 3,414,300 | $ | — | ||||||||
| Available-for-sale: | ||||||||||||||||
| Agency MBS | 40 | — | 40 | — | ||||||||||||
| Private-label MBS | 267,437 | — | — | 267,437 | ||||||||||||
| Total available-for-sale | 267,477 | — | 40 | 267,437 | ||||||||||||
| Total MBS | 3,681,777 | — | 3,414,340 | 267,437 | ||||||||||||
| Derivative assets | 1,267 | 751 | 516 | — | ||||||||||||
| Derivative liabilities | (124,308 | ) | (124,308 | ) | — | — | ||||||||||
| Interest-only MBS | 212 | — | — | 212 | ||||||||||||
| Total | $ | 3,558,948 | $ | (123,557 | ) | $ | 3,414,856 | $ | 267,649 | |||||||
There were no transfers of financial instruments into or out of Levels 1, 2 or 3 during the years ended December 31, 2015 and 2014.
Level 3 Financial Assets and Liabilities
The following table provides information about the significant unobservable inputs used to measure the fair value of the Company’s private-label MBS as of the dates indicated:
| December 31, 2015 | December 31, 2014 | |||||||||||||||
| Weighted- average (1) | Range | Weighted- average (1) | Range | |||||||||||||
| Discount rate | 5.57 | % | 5.50 – 10.00 % | 5.55 | % | 5.15 – 10.00 % | ||||||||||
| Default rate | 2.78 | % | 1.45 – 6.20 % | 3.09 | % | 1.00 – 8.80 % | ||||||||||
| Loss severity rate | 45.84 | % | 35.00 – 65.00 % | 42.25 | % | 29.23 – 57.50 % | ||||||||||
| Prepayment rate | 11.02 | % | 7.75 – 17.70 % | 11.23 | % | 7.40 – 17.70 % | ||||||||||
| (1) | Based on face value. |
The table below sets forth a summary of changes in the fair value and gains and losses of the Company’s Level 3 investments in private-label MBS that are measured at fair value on a recurring basis for the years ended December 31, 2015 and 2014.
| Year Ended December 31, | ||||||||
| 2015 | 2014 | |||||||
| Beginning balance | $ | 267,437 | $ | 341,299 | ||||
| Total net gains (losses) | ||||||||
| Included in investment (loss) gain, net | 15,725 | 17,243 | ||||||
| Included in other comprehensive income | (31,933 | ) | (15,091 | ) | ||||
| Purchases | 2,870 | — | ||||||
| Sales | (130,137 | ) | (86,318 | ) | ||||
| Payments, net | (8,849 | ) | (15,313 | ) | ||||
| Accretion of discount | 15,322 | 25,617 | ||||||
| Ending balance | $ | 130,435 | $ | 267,437 | ||||
| Net unrealized gains (losses) included in earnings for the period for Level 3 assets still held at the reporting date | $ | (2,420 | ) | $ | (420 | ) | ||
| F-26 |
Note 10. Income Taxes
Arlington Asset is subject to taxation as a corporation under Subchapter C of the Internal Revenue Code of 1986, as amended (the “Code”). The Company’s consolidated subsidiary, Rosslyn REIT Trust (“Rosslyn REIT”), operates to qualify as a real estate investment trust (“REIT”) under the Code. Arlington Asset owns all the common shares of Rosslyn REIT Trust and all of the preferred shares are owned by outside investors.
As of December 31, 2015, the Company had net operating loss (“NOL”) carry-forwards of $107,090 that can be used to offset future taxable ordinary income. The Company’s NOL carry-forwards begin to expire in 2027. As of December 31, 2015, the Company had net capital loss (“NCL”) carry-forwards of $240,681 that can be used to offset future capital gains. The scheduled expirations of the Company’s NCL carry-forwards are $136,840 in 2019 and $103,841 in 2020.
The Company is subject to federal alternative minimum tax (“AMT”) and state and local taxes on its taxable income and gains that are not offset by its NOL and NCL carry-forwards.
Income taxes are provided for using the asset and liability method. Deferred tax assets and liabilities reflect the impact of temporary differences between the carrying amount of assets and liabilities pursuant to the application of GAAP and their respective tax bases and are stated at tax rates expected to be in effect when the taxes are actually paid or recovered. Deferred tax assets are also recorded for net operating loss carry-forwards, net capital loss carry-forwards and any tax credit carry-forwards. Deferred tax assets and liabilities consisted of the following as of December 31, 2015 and 2014:
| 2015 | 2014 | |||||||
| Net operating loss carry-forward | $ | 41,660 | $ | 60,467 | ||||
| Net unrealized losses on investments and derivatives | 24,677 | 24,434 | ||||||
| AMT credit | 8,195 | 7,244 | ||||||
| Stock-based compensation | 2,004 | 1,515 | ||||||
| Deferred net losses on designated derivatives | 8,066 | 2,733 | ||||||
| Other, net | (34 | ) | 582 | |||||
| Capital loss carry-forward | 93,625 | 52,860 | ||||||
| Valuation allowance on capital loss carry-forward | (80,663 | ) | (24,228 | ) | ||||
| Deferred tax assets, net | $ | 97,530 | $ | 125,607 | ||||
| F-27 |
The provision (benefit) for income taxes from operations consists of the following for the years ended December 31, 2015, 2014 and 2013:
| 2015 | 2014 | 2013 | ||||||||||
| Federal | $ | 32,613 | $ | 40,298 | $ | (22,918 | ) | |||||
| State | 5,948 | 7,349 | (15,766 | ) | ||||||||
| $ | 38,561 | $ | 47,647 | $ | (38,684 | ) | ||||||
| Current | $ | 970 | $ | 796 | $ | (14,860 | ) | |||||
| Deferred | 37,591 | 46,851 | (23,824 | ) | ||||||||
| $ | 38,561 | $ | 47,647 | $ | (38,684 | ) | ||||||
The provision (benefit) for income taxes results in effective tax rates that differ from the federal statutory rates. The reconciliation of the Company and its subsidiaries income tax attributable to net income computed at federal statutory rates the provision (benefit) for income taxes for the years ended December 31, 2015, 2014, and 2013 was as follows:
| 2015 | 2014 | 2013 | ||||||||||
| Federal income tax at statutory rate | $ | (10,795 | ) | $ | 19,390 | $ | 4,949 | |||||
| State income taxes, net of federal benefit | (1,203 | ) | 2,161 | 849 | ||||||||
| Expiration of capital loss carry-forward | — | 4,668 | 56,333 | |||||||||
| Reversal of unrecognized tax benefit related to uncertain tax position and related accrued interest and related AMT credits | — | — | (11,028 | ) | ||||||||
| Federal liability on state deferred tax assets | — | — | 1,237 | |||||||||
| Losses on available-for sale MBS acquired prior to 2012 | (3,987 | ) | (1,178 | ) | (2,441 | ) | ||||||
| Tax character adjustments | (1,934 | ) | (1,656 | ) | — | |||||||
| Other, net | 45 | 34 | 2,606 | |||||||||
| Valuation allowance | 56,435 | 24,228 | (91,189 | ) | ||||||||
| Total income tax provision (benefit) | $ | 38,561 | $ | 47,647 | $ | (38,684 | ) | |||||
A valuation allowance is provided against the deferred tax asset if, based on the Company’s evaluation, it is more-likely-than-not that some or all of the deferred tax assets will not be realized. All available evidence, both positive and negative, is considered to determine whether a valuation allowance for deferred tax assets is needed. Items considered in determining our valuation allowance include expectations of future earnings of the appropriate tax character, recent historical financial results, tax planning strategies, the length of statutory carry-forward periods and the expected timing of the reversal of temporary differences. As of December 31, 2015 and 2014, the Company provided a valuation allowance against the portion of its NCL carry-forwards for which the Company believes it is more likely than not that the benefits will not be realized prior to expiration. During the years ended December 31, 2015 and 2014, the Company recorded an increase to its valuation allowance of $56,435 and $24,228, respectively. The increase in the valuation allowance was primarily due to the increase in the NCL carry-forwards from net capital losses generated during those periods primarily as a result of unrealized and realized net capital losses from certain of its derivative hedge instruments.
Effective December 31, 2013, the Company contributed 40 of its private-label MBS with $367,642 in face value in a taxable contribution (the “Contribution”) to Rosslyn REIT Trust. The Contribution resulted in taxable capital gains of $68,041. The Company utilized net capital loss carry-forwards to offset the capital gain recognized on the Contribution for tax purposes.
With the completion of the Internal Revenue Service’s (“IRS”) examinations of the Company’s tax years 2009 and 2010 without any adjustment and the expiration of the statute of limitations on the 2009 state tax return, the Company reversed $12,810 of unrecognized tax benefits related to an uncertain tax position and $3,402 of related accrued interest during the year ended December 31, 2013. The Company also reversed deferred taxes associated with accrued interest and AMT credits of $5,184 related to the unrecognized tax benefits previously recorded.
| F-28 |
The Company recognizes uncertain tax positions in the financial statements only when it is more-likely-than-not that the position will be sustained upon examination by the relevant taxing authority based on the technical merits of the position. A position that meets this standard is measured at the largest amount of benefit that will more-likely-than-not be realized upon settlement. A liability is established for differences between positions taken in a tax return and the financial statements. As of December 31, 2015 and 2014, the Company assessed the need for recording a provision for any uncertain tax position and has made the determination that such provision is not necessary.
The Company is subject to examination by the IRS and state and local authorities in jurisdictions where the Company has significant business operations. The Company’s federal tax returns for 2012 and forward remain subject to examination by the IRS. As of December 31, 2015, there are no on-going examinations.
Note 11. Commitments and Contingencies
Contractual Obligations
The Company has contractual obligations to make future payments in connection with long-term debt and non-cancelable lease agreements. The following table sets forth these contractual obligations by fiscal year:
| 2016 | 2017 | 2018 | 2019 | 2020 | Thereafter | Total | ||||||||||||||||||||||
| Long-term debt maturities | $ | — | $ | — | $ | — | $ | — | $ | — | $ | 75,300 | $ | 75,300 | ||||||||||||||
| Minimum rental commitments | 446 | 458 | 471 | 483 | 497 | — | 2,355 | |||||||||||||||||||||
| $ | 446 | $ | 458 | $ | 471 | $ | 483 | $ | 497 | $ | 75,300 | $ | 77,655 | |||||||||||||||
Note 12. Shareholders’ Equity
The Company has authorized share capital of 450,000,000 shares of Class A common stock, par value $0.01 per share; 100,000,000 shares of Class B common stock, par value $0.01 per share; and 25,000,000 shares of undesignated preferred stock. Holders of the Class A and Class B common stock are entitled to one vote and three votes per share, respectively, on all matters voted upon by the shareholders. Shares of Class B common stock are convertible into shares of Class A common stock on a one-for-one basis at the option of the Company in certain circumstances including (i) upon sale or other transfer, (ii) at the time the holder of such shares of Class B common stock ceases to be affiliated with the Company and (iii) upon the sale of such shares in a registered public offering. The Company’s Board of Directors has the authority, without further action by the shareholders, to issue preferred stock in one or more series and to fix the terms and rights of the preferred stock.
Conversion of Class B Common Stock to Class A Common Stock
During the years ended December 31, 2015 and 2014, holders of the Company's Class B common stock converted an aggregate of 3,653 and 448,186 shares of Class B common stock into 3,653 and 448,186 shares of Class A common stock, respectively. There were no conversions of shares of Class B common stock into shares of Class A common stock during the year ended December 31, 2013.
Share Repurchases
In October 2015, the Board of Directors authorized an increase in the Company’s share repurchase program pursuant to which the Company may repurchase up to 2,000,000 shares of its Class A common stock, which included 205,485 shares previously available to be repurchased under the prior share repurchase program authorized by the Board of Directors in July 2010 (collectively, the “Repurchase Program”).
Repurchases under the Repurchase Program may be made from time to time on the open market and in private transactions at management’s discretion in accordance with applicable federal securities laws. The timing of repurchases and the exact number of shares of Class A common stock to be repurchased will depend upon market conditions and other factors. The Repurchase Program is funded using the Company’s cash on hand and cash generated from operations. The Repurchase Program has no expiration date and may be suspended or terminated at any time without prior notice.
| F-29 |
During the year ended December 31, 2015, the Company repurchased 48,695 shares of its Class A common stock at an average price of $12.15 per share for a total cost of $593. The Company had no share repurchase activities during the years ended December 31, 2014 and 2013. As of December 31, 2015, 1,951,305 shares of Class A common stock remain available for repurchases under the Repurchase Program.
Equity Offerings
During the years ended December 31, 2014 and 2013, the Company completed public offerings as follows:
| Closing date of the offering | March 13, 2013 | March 28, 2014 | September 8, 2014 | |||||||||
| Shares sold to public | 3,000,000 | 2,750,000 | 2,750,000 | |||||||||
| Shares sold pursuant to the underwriter over-allotment | 450,000 | 312,500 | 412,500 | |||||||||
| Total shares of Class A common stock | 3,450,000 | 3,062,500 | 3,162,500 | |||||||||
| Public offering price per share | $ | 25.50 | $ | 27.40 | $ | 27.61 | ||||||
| Net proceeds (1) | $ | 86,964 | $ | 81,669 | $ | 85,214 | ||||||
| (1) | Net of underwriting discounts and commissions and expenses. |
Shareholder Rights Agreement
The Board of Directors adopted and the Company’s shareholders approved a shareholder rights agreement (“Rights Plan”). Under the terms of the Rights Plan, in general, if a person or group acquires or commences a tender or exchange offer for beneficial ownership of 4.9% or more of the outstanding shares of our Class A common stock upon a determination by our Board of Directors (an “Acquiring Person”), all of our other Class A and Class B common shareholders will have the right to purchase securities from us at a discount to such securities’ fair market value, thus causing substantial dilution to the Acquiring Person.
The Board of Directors adopted the Rights Plan in an effort to protect against a possible limitation on the Company’s ability to use its NOL carry-forwards, NCL carry-forwards, and built-in losses under Sections 382 and 383 of the Code. The Company’s ability to use its NOLs, NCLs and built-in losses would be limited if it experienced an “ownership change” under Section 382 of the Code. In general, an “ownership change” would occur if there is a cumulative change in the ownership of the Company’s common stock of more than 50% by one or more “5% shareholders” during a three-year period. The Rights Plan was adopted to dissuade any person or group from acquiring 4.9% or more of the Company’s outstanding Class A common stock, each, an Acquiring Person, without the approval of the Board of Directors and triggering an “ownership change” as defined by Section 382.
The Rights Plan and any outstanding rights will expire at the earliest of (i) June 4, 2019, (ii) the time at which the rights are redeemed or exchanged pursuant to the Rights Plan, (iii) the repeal of Section 382 and 383 of the Code or any successor statute if the Board of Directors determines that the Rights Plan is no longer necessary for the preservation of the applicable tax benefits, and (iv) the beginning of a taxable year to which the Board of Directors determines that no applicable tax benefits may be carried forward.
Dividends
Pursuant to the Company’s variable dividend policy, the Board of Directors evaluates dividends on a quarterly basis and, in its sole discretion, approves the payment of dividends. The Company’s dividend payments, if any, may vary significantly from quarter to quarter. The Board of Directors has approved and the Company has declared the following dividends in 2015:
| Quarter Ended | Dividend Amount | Declaration Date | Record Date | Pay Date | ||||||
| December 31 | $ | 0.625 | December 17 | December 31 | January 29, 2016 | |||||
| September 30 | 0.625 | September 17 | September 30 | October 30 | ||||||
| June 30 | 0.875 | June 17 | June 30 | July 31 | ||||||
| March 31 | 0.875 | March 10 | March 31 | April 30 | ||||||
| F-30 |
The Board of Directors approved and the Company declared and paid the following dividends for 2014:
| Quarter Ended | Dividend Amount | Declaration Date | Record Date | Pay Date | ||||||
| December 31 | $ | 0.875 | December 18 | December 31 | January 30, 2015 | |||||
| September 30 | 0.875 | September 17 | September 29 | October 31 | ||||||
| June 30 | 0.875 | June 11 | June 30 | July 31 | ||||||
| March 31 | 0.875 | March 13 | March 31 | April 30 | ||||||
Note 13. Long-Term Incentive Plan
The Company provides its employees and its non-employee directors with long-term incentive compensation in the form of stock-based awards. On April 7, 2014, the Board of Directors adopted the Arlington Asset Investment Corp. 2014 Long-Term Incentive Plan (the “2014 Plan”), which was approved by the Company’s shareholders and became effective on July 15, 2014.
Under the 2014 Plan, a maximum number of 2,000,000 shares of Class A common stock of the Company, subject to adjustment as set forth in the 2014 Plan, were authorized for issuance and may be issued to employees, directors, consultants and advisors of the Company and its affiliates. As of December 31, 2015, 1,953,980 shares remained available for issuance under the 2014 Plan. The 2014 Plan replaced the Arlington Asset Investment Corp. 2011 Long-Term Incentive Plan (the “2011 Plan”). No additional grants will be made under the 2011 Plan. However, previous grants under the 2011 Plan will remain in effect subject to the terms of the 2011 Plan and the applicable award agreement, and shares of Class A common stock may be issued under the 2011 Plan. The shares of Class A common stock to be issued under the 2011 Plan are subject to the achievement of performance measures and/or vesting. As of December 31, 2015, 269,283 shares remained available for issuance under the 2011 Plan.
Under the 2014 Plan, the Compensation Committee of the Company’s Board of Directors may grant restricted stock, restricted stock units (“RSUs”), performance stock units (“PSUs”), stock options, stock appreciation rights (“SARs”) and/or other stock-based awards. However, no participant may be granted (i) stock options or SARs during any twelve month period covering more than 300,000 shares or (ii) restricted stock, RSUs, PSUs and/or other stock-based awards denominated in shares that are intended to qualify as performance based compensation under Section 162(m) that permit the participant to earn more than 300,000 shares for each twelve months in the vesting or period on which performance is measured (“Performance Period”). These share limits are subject to adjustment in the event of any merger, reorganization, consolidation, recapitalization, stock dividend, stock split, reverse stock split, spin-off, extraordinary cash dividend or similar transaction or other change in corporate structure affecting the share. In addition, during any calendar year no participant may be granted performance awards that are denominated in cash and that are intended to qualify as performance based compensation under Section 162(m) under which more than $10,000 may be earned for each twelve months in the Performance Period. Each of the individual award limits described in this paragraph will be multiplied by two during the first calendar year in which the participant commences employment with the Company and its affiliates. The 2014 Plan will terminate on the tenth anniversary of its effective date unless sooner terminated by the Board of Directors.
Stock-based compensation costs are initially measured at the estimated fair value of the awards on the grant date developed using appropriate valuation methodologies, as adjusted for estimates of future award forfeitures. Valuation methodologies used and subsequent expense recognition is dependent upon each award’s service and performance conditions.
Excess tax benefits from the tax deduction of stock-based awards exceeding the stock-based compensation recorded in accordance with GAAP are recorded as an increase to additional paid-in capital. Conversely, if the tax deduction of stock-based awards is less than the stock-based compensation recorded in accordance with GAAP, it is recorded as a decrease to additional paid-in capital to the extent of previously accumulated excess tax benefits recorded in additional paid-in capital with any remaining amount recorded as additional income tax provision. The gross windfall tax benefit is presented in the consolidated statements of cash flows as financing cash inflows.
| F-31 |
Performance Stock Unit Awards
Compensation costs for PSUs subject to nonmarket-based performance conditions (i.e. performance not predicated on changes in the Company’s stock price) are measured at the closing stock price on the dates of grant, adjusted for the probability of achieving certain benchmarks included in the performance metrics. These initial cost estimates are recognized as expense over the requisite performance periods, as adjusted for changes in estimated, and ultimately actual, performance and forfeitures. Compensation costs for components of PSUs subject to market-based performance conditions (i.e. performance predicated on changes in the Company’s stock price) are measured at the dates of grant using a Monte Carlo simulation model which incorporates into the valuation the inherent uncertainty regarding the achievement of the market-based performance metrics. These initial valuation amounts are recognized as expense over the requisite performance periods, subject only to adjustments for changes in estimated, and ultimately actual, forfeitures.
The Company has granted performance stock units to executive officers of the Company that are convertible into shares of Class A common stock following the applicable performance periods. The performance goals established by the Compensation Committee are based on (i) the compound annualized growth in the Company’s book value per share (i.e., book value change with such adjustments as determined and approved by the Compensation Committee plus dividends on a reinvested basis) during the applicable performance period (“Book Value PSUs’), and (ii) the compound annualized total shareholder return (i.e., share price change plus dividends on a reinvested basis) during the applicable performance period (“TSR PSUs”).
The Compensation Committee of the Board of Directors of the Company approved the following PSU grants:
| December 31, | ||||||||||||
| 2015 | 2014 | 2013 | ||||||||||
| Book Value PSUs granted | 45,054 | 35,126 | 34,221 | |||||||||
| Book Value PSU grant date fair value per share | $ | 19.56 | $ | 27.26 | $ | 27.03 | ||||||
| TSR PSUs granted | 58,169 | 35,593 | 34,567 | |||||||||
| TSR PSU grant date fair value per share | $ | 15.15 | $ | 26.90 | $ | 26.76 | ||||||
For the Company’s Book Value PSUs, the grant date fair value per share is based on the close price on the date of grant. For the Company’s TSR PSUs, the grant date fair value per share is based on a Monte Carlo simulation model. The following assumptions, determined as of the date of grant, were used in the Monte Carlo simulation model to measure the grant date fair value per share of the Company’s TSR PSUs:
| TSR PSUs Granted in: | ||||||||||||
| 2015 | 2014 | 2013 | ||||||||||
| Closing stock price on date of grant | $ | 19.56 | $ | 27.26 | $ | 27.03 | ||||||
| Beginning average stock price on date of grant (1) | $ | 20.82 | $ | 27.68 | $ | 27.58 | ||||||
| Expected volatility (2) | 21.72 | % | 31.03 | % | 33.70 | % | ||||||
| Dividend yield (3) | 0.00 | % | 0.00 | % | 0.00 | % | ||||||
| Risk-free rate (4) | 1.08 | % | 0.90 | % | 0.65 | % | ||||||
| (1) | Based upon the 30 trading days prior to and including the date of grant. |
| (2) | Based upon the most recent three-year volatility as of the date of grant. |
| (3) | Dividend equivalents are accrued during the performance period and deemed reinvested in additional stock units, which are to be paid out at the end of the performance period to the extent the underlying PSU is earned. Applying dividend yield assumption of 0.00% in the Monte Carlo simulation is mathematically equivalent to reinvesting dividends on a continuous basis and including the value of the dividends in the final payout. |
| (4) | Based upon the yield of a U.S. Treasury bond with a three-year maturity as of the date of grant. |
| F-32 |
The vesting of the PSUs is subject to both continued employment under the terms of the award agreement and the achievement of the Company performance goals established by the Compensation Committee. For PSU awards granted during the three years ended December 31, 2015, the Compensation Committee established a three-year performance period. The actual number of shares of Class A common stock that will be issued to each participant at the end of the applicable performance period will vary between 0% and 250% of the number of PSUs granted, depending on performance results. If the minimum threshold level of performance goals is not achieved, no PSUs are earned. To the extent the performance results are between the minimum threshold level and maximum level of performance goals, between 50% to 250% of the number of PSUs granted are earned.
PSUs do not have any voting rights. No dividends are paid on outstanding PSUs during the applicable performance period. Instead, dividend equivalents are accrued on outstanding PSUs during the applicable performance period, deemed invested in shares of Class A common stock and are paid out in shares of Class A common stock at the end of the performance period to the extent that the underlying PSUs vest. Upon settlement, vested PSUs are converted into shares of the Company’s Class A common stock on a one-for-one basis.
For the years ended December 31, 2015, 2014, and 2013, the Company recognized $(560), $2,457 and $1,485, respectively, of compensation expense related to PSU awards. For the year ended December 31, 2015, the compensation expense included a reversal of $1,474 of expense recognized in prior periods due to a reduction in the number of PSUs expected to vest based on deterioration in performance metrics. As of December 31, 2015 and 2014, the Company had unrecognized compensation expense related to PSU awards of $2,697 and $4,435, respectively. The unrecognized compensation expense as of December 31, 2015 is expected to be recognized over a weighted average period of 2.2 years. For the years ended December 31, 2015 and 2014, the intrinsic value of PSU awards that vested was $716 and $2,447, respectively. There were no PSU awards that vested for the year ended December 31, 2013.
Employee Restricted Stock Awards
Compensation costs for restricted stock awards subject only to service conditions are measured at the closing stock price on the dates of grant and are recognized as expense on a straight-line basis over the requisite service periods for the awards, as adjusted for changes in estimated, and ultimately actual, forfeitures.
The Company grants restricted common shares to employees that vest ratably over a three year period or cliff-vest after two to four years based on continued employment over these specified periods. A summary of these unvested restricted stock awards is presented below:
| Number of Shares | Weighted-average Grant-date Fair Value | Weighted- average Remaining Vested Period | ||||||||||
| Share Balance as of December 31, 2012 | 34,835 | $ | 24.24 | 2.2 | ||||||||
| Granted | 36,000 | 26.74 | — | |||||||||
| Forfeitures | — | — | — | |||||||||
| Vestitures | (13,162 | ) | 24.65 | — | ||||||||
| Share Balance as of December 31, 2013 | 57,673 | 25.71 | 2.0 | |||||||||
| Granted | 84,602 | 26.84 | — | |||||||||
| Forfeitures | — | — | — | |||||||||
| Vestitures | (25,163 | ) | 25.64 | — | ||||||||
| Share Balance as of December 31, 2014 | 117,112 | 26.54 | 1.9 | |||||||||
| Granted | 58,000 | 14.35 | — | |||||||||
| Forfeitures | (6,668 | ) | 26.34 | — | ||||||||
| Vestitures | (36,669 | ) | 25.63 | — | ||||||||
| Share Balance as of December 31, 2015 | 131,775 | 21.44 | 2.0 | |||||||||
For the years ended December 31, 2015, 2014, and 2013, the Company recognized $1,207, $927 and $632, respectively, of compensation expense related to restricted stock awards. As of December 31, 2015 and 2014, the Company had unrecognized compensation expense related to restricted stock awards of $1,631 and $2,181, respectively. The unrecognized compensation expense as of December 31, 2015 is expected to be recognized over a weighted average period of 2.0 years. For the years ended December 31, 2015, 2014 and 2013, the intrinsic value of restricted stock awards that vested were $646, $681 and $329, respectively.
| F-33 |
In addition, as part of the Company’s satisfaction of incentive compensation earned for past service under the Company’s variable compensation programs, employees may receive restricted Class A common stock in lieu of cash payments. These restricted Class A common stock shares are issued to an irrevocable trust and are not returnable to the Company. No such shares were issued in 2015, 2014 and 2013. As of December 31, 2015 and 2014, the Company had 9,155 vested shares of the undistributed restricted stock issued to the trust.
Director Restricted Stock Units
Compensation costs for RSU awards subject only to service conditions are measured at the closing stock price on the dates of grant and are recognized as expense on a straight-line basis over the requisite service periods for the awards, as adjusted for changes in estimated, and ultimately actual, forfeitures. Compensation costs for RSUs that do not require future service conditions are expensed immediately.
The Company’s non-employee directors are compensated in both cash and RSUs. RSUs awarded under the Company’s 2014 Plan vest immediately on the award grant date and are convertible into shares of Class A common stock. For RSUs granted under the Company’s 2014 Plan and 2011 Plan, the RSUs are convertible into shares of Class A common stock at the later of the date the non-employee director ceases to be a member of the Company’s Board or the first anniversary of the grant date. For RSUs granted under prior long-term incentive plans, the RSUs are convertible into shares of Class A common stock one year after the non-employee director ceases to be a member of the Company’s Board. The RSUs do not have any voting rights but are entitled to cash dividend equivalent payments. As of December 31, 2015, the Company had 148,417 RSUs outstanding. A summary of the RSUs grants is presented below:
| December 31, | ||||||||||||
| 2015 | 2014 | 2013 | ||||||||||
| RSUs granted | 25,506 | 15,521 | 15,616 | |||||||||
| Grant date fair value | $ | 20.78 | $ | 27.70 | $ | 27.53 | ||||||
The grant date fair value is based on the closing price of the Class A common stock on the New York Stock Exchange on the date of grant. For the years ended December 31, 2015, 2014 and 2013, the Company recognized $496, $430 and $430, respectively, of director fees related to these RSUs.
Note 14. Financial Instruments with Off-Balance-Sheet Risk and Credit Risk
As of December 31, 2015 and 2014, the Company had not entered into any transactions involving financial instruments that would expose the Company to significant related off-balance-sheet risk.
Note 15. Revisions to Previously Reported Financial Statements
During the first quarter of 2015, the Company concluded that the previously reported income tax provision (benefit) and the related income tax effect on other comprehensive income (loss) was incorrect for the fiscal years ended December 31, 2012 and 2013 with no impact on previously reported total comprehensive income. As a result of these errors, the Company also concluded that the previously reported accumulated other comprehensive income and accumulated deficit was incorrect as of the three fiscal years ended December 31, 2014 for the cumulative impact of the errors, however, with no impact on previously reported total stockholders’ equity. In addition, during the third quarter of 2015, the Company concluded that the previously reported deferred tax assets, net, was incorrect for the fiscal years ended December 31, 2013 and 2014 with a corresponding effect on the previously reported income tax provision (benefit) and net income for those periods. Although the impact of these changes were not material to the consolidated financial statements for the three fiscal years ended December 31, 2014, the Company has revised its previously reported consolidated financial statements as of December 31, 2014 and 2013 to reflect the cumulative impact of the errors. The following tables set forth the affected line items within the Company’s previously reported consolidated financial statements for the periods indicated.
| F-34 |
| As of or For the Year Ended December 31, 2014 | ||||||||||||
| As Previously Reported | Adjustment | As Revised | ||||||||||
| Consolidated Balance Sheets: | ||||||||||||
| Deferred tax assets, net | $ | 122,365 | $ | 3,242 | $ | 125,607 | ||||||
| Total assets | 4,014,489 | 3,242 | 4,017,731 | |||||||||
| Accumulated other comprehensive income, net of taxes | 42,793 | (6,921 | ) | 35,872 | ||||||||
| Accumulated deficit | (1,298,018 | ) | 10,163 | (1,287,855 | ) | |||||||
| Total stockholders’ equity | 642,032 | 3,242 | 645,274 | |||||||||
| Total liabilities and stockholders’ equity | 4,014,489 | 3,242 | 4,017,731 | |||||||||
| Consolidated Statements of Comprehensive Income: | ||||||||||||
| Income tax provision | $ | 49,446 | $ | (1,799 | ) | $ | 47,647 | |||||
| Net income | 5,954 | 1,799 | 7,753 | |||||||||
| Comprehensive loss | (4,443 | ) | 1,799 | (2,644 | ) | |||||||
| Year Ended December 31, 2013 | ||||||||||||
| As Previously Reported | Adjustment | As Revised | ||||||||||
| Consolidated Statements of Comprehensive Income: | ||||||||||||
| Income tax benefit | $ | (35,322 | ) | $ | (3,362 | ) | $ | (38,684 | ) | |||
| Net income | 49,461 | 3,362 | 52,823 | |||||||||
| Other comprehensive income, net of taxes | 14,184 | (2,441 | ) | 11,743 | ||||||||
| Comprehensive income | 63,645 | 921 | 64,566 | |||||||||
| Balances, December 31, 2012 | ||||||||||||
| As Previously Reported | Adjustment | As Revised | ||||||||||
| Consolidated Statements of Changes in Equity: | ||||||||||||
| Accumulated other comprehensive income | $ | 39,006 | $ | (4,480 | ) | $ | 34,526 | |||||
| Accumulated deficit | (1,219,906 | ) | 5,002 | (1,214,904 | ) | |||||||
| Total | 457,293 | 522 | 457,815 | |||||||||
Note 16. Quarterly Data (Unaudited)
The following tables set forth selected information for each of the fiscal quarters during the years ended December 31, 2015 and 2014. The selected quarterly data is derived from unaudited financial statements of the Company and has been prepared on the same basis as the annual, audited financial statements to include, in the opinion of management, all adjustments (consisting of only normal recurring adjustments) necessary for fair statement of the results for such periods.
The sum of quarterly earnings per share amounts may not equal full year earnings per share amounts due to differing average outstanding shares amounts for the respective periods.
| F-35 |
| Fiscal Year 2015 | ||||||||||||||||||||
Total Year | Fourth Quarter | Third Quarter | Second Quarter | First Quarter | ||||||||||||||||
| Interest income | $ | 154,593 | $ | 38,364 | $ | 40,575 | $ | 38,690 | $ | 36,964 | ||||||||||
| Interest expense | 18,889 | 5,421 | 5,165 | 4,575 | 3,728 | |||||||||||||||
| Net interest income | 135,704 | 32,943 | 35,410 | 34,115 | 33,236 | |||||||||||||||
| Investment loss, net | (152,379 | ) | (5,674 | ) | (69,298 | ) | (18,036 | ) | (59,371 | ) | ||||||||||
| Other expenses | 14,167 | 3,783 | 3,245 | 3,831 | 3,308 | |||||||||||||||
| (Loss) income before income taxes | (30,842 | ) | 23,486 | (37,133 | ) | 12,248 | (29,443 | ) | ||||||||||||
| Income tax provision | 38,561 | 4,675 | 15,497 | 5,647 | 12,742 | |||||||||||||||
| Net (loss) income | $ | (69,403 | ) | $ | 18,811 | $ | (52,630 | ) | $ | 6,601 | $ | (42,185 | ) | |||||||
| Basic (loss) earnings per share | $ | (3.02 | ) | $ | 0.82 | $ | (2.29 | ) | $ | 0.29 | $ | (1.84 | ) | |||||||
| Diluted (loss) earnings per share | $ | (3.02 | ) | $ | 0.82 | $ | (2.29 | ) | $ | 0.29 | $ | (1.84 | ) | |||||||
| Fiscal Year 2014 | ||||||||||||||||||||
Total Year | Fourth Quarter | Third Quarter | Second Quarter | First Quarter | ||||||||||||||||
| Interest income | $ | 123,547 | $ | 36,316 | $ | 33,301 | $ | 30,063 | $ | 23,867 | ||||||||||
| Interest expense | 11,391 | 3,454 | 2,976 | 2,676 | 2,285 | |||||||||||||||
| Net interest income | 112,156 | 32,862 | 30,325 | 27,387 | 21,582 | |||||||||||||||
| Investment (loss) gain, net | (38,687 | ) | (33,697 | ) | (6,982 | ) | 7,906 | (5,914 | ) | |||||||||||
| Other expenses | 18,069 | 4,480 | 5,054 | 4,380 | 4,155 | |||||||||||||||
| Income (loss) before income taxes | 55,400 | (5,315 | ) | 18,289 | 30,913 | 11,513 | ||||||||||||||
| Income tax provision | 47,647 | 25,651 | 5,442 | 12,074 | 4,480 | |||||||||||||||
| Net income (loss) | $ | 7,753 | $ | (30,966 | ) | $ | 12,847 | $ | 18,839 | $ | 7,033 | |||||||||
| Basic earnings (loss) per share | $ | 0.39 | $ | (1.35 | ) | $ | 0.62 | $ | 0.95 | $ | 0.42 | |||||||||
| Diluted earnings (loss) per share | $ | 0.38 | $ | (1.35 | ) | $ | 0.61 | $ | 0.94 | $ | 0.41 | |||||||||
| F-36 |