Attached files
| file | filename |
|---|---|
| EX-99.1 - EXHIBIT 99.1 - Polaris Inc. | a51384670ex99_1.htm |
| 8-K - POLARIS INDUSTRIES INC. 8-K - Polaris Inc. | a51384670.htm |
Exhibit 99.2
Second Quarter 2016 Earnings Results July 20, 2016 POLARIS INDUSTRIES INC.
Except for historical information contained herein, the matters set forth in this document, including but not limited to management’s expectations regarding 2016 sales, shipments, margins, currencies, net income and cash flow, the opportunities for expansion and diversification of the Company’s business and the Company’s guidance on earnings per share are forward-looking statements that involve certain risks and uncertainties that could cause actual results to differ materially from those forward-looking statements. Potential risks and uncertainties include such factors as product offerings, promotional activities and pricing strategies by competitors; manufacturing operation expansion initiatives; acquisition integration costs; warranty expenses; foreign currency exchange rate fluctuations; environmental and product safety regulatory activity; effects of weather; commodity costs; uninsured product liability claims; uncertainty in the retail and wholesale credit markets; performance of affiliate partners; changes in tax policy and overall economic conditions, including inflation, consumer confidence and spending and relationships with dealers and suppliers. Investors are also directed to consider other risks and uncertainties discussed in our 2015 annual report and Form 10-K filed by the Company with the Securities and Exchange Commission. The Company does not undertake any duty to any person to provide updates to its forward-looking statements.The data source for retail sales figures included in this presentation is registration information provided by Polaris dealers in North America and compiled by the Company or Company estimates. The Company must rely on information that its dealers supply concerning retail sales, and other retail sales data sources and this information is subject to revision.Non-GAAP Measure - Constant Currency Reporting. This presentation includes information regarding the Company’s 2016 expectations on a constant currency basis, which is a non-GAAP measure, as well as on a GAAP basis. For purpose of comparison, the results on a constant currency basis uses the respective prior year exchange rates for the comparative period to enhance the visibility of the underlying business trends, excluding the impact of translation arising from foreign currency exchange rate fluctuations. 2 Q2'16 Earnings SAFE HARBOR

Scott W. WineChairman & CEO Second Quarter 2016 Earnings Results July 20, 2016 POLARIS INDUSTRIES INC. Q2'16 Earnings 3
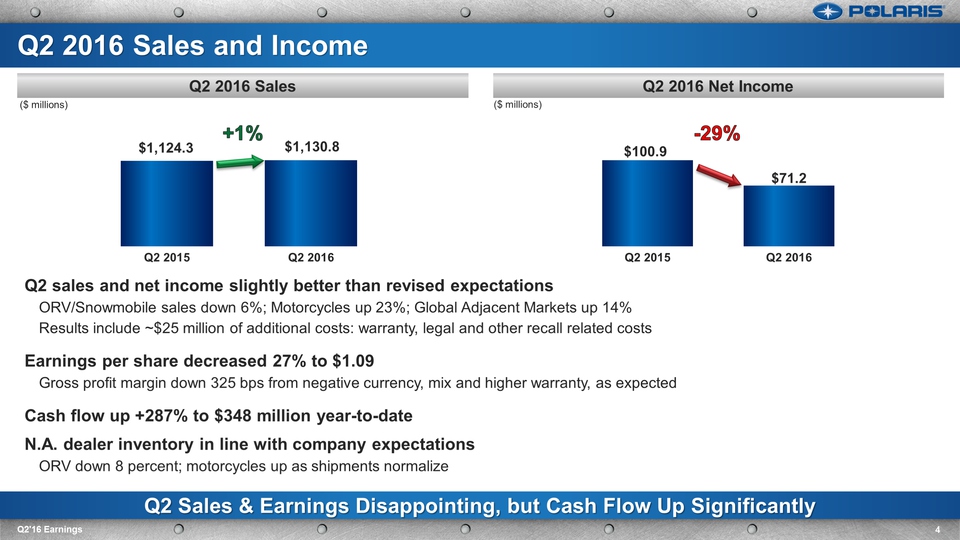
Q2 sales and net income slightly better than revised expectationsORV/Snowmobile sales down 6%; Motorcycles up 23%; Global Adjacent Markets up 14%Results include ~$25 million of additional costs: warranty, legal and other recall related costsEarnings per share decreased 27% to $1.09Gross profit margin down 325 bps from negative currency, mix and higher warranty, as expectedCash flow up +287% to $348 million year-to-dateN.A. dealer inventory in line with company expectationsORV down 8 percent; motorcycles up as shipments normalize Q2 Sales & Earnings Disappointing, but Cash Flow Up Significantly Q2 2016 Net Income Q2 2016 Sales 4 Q2'16 Earnings Q2 2016 Sales and Income +1% -29% ($ millions) ($ millions)
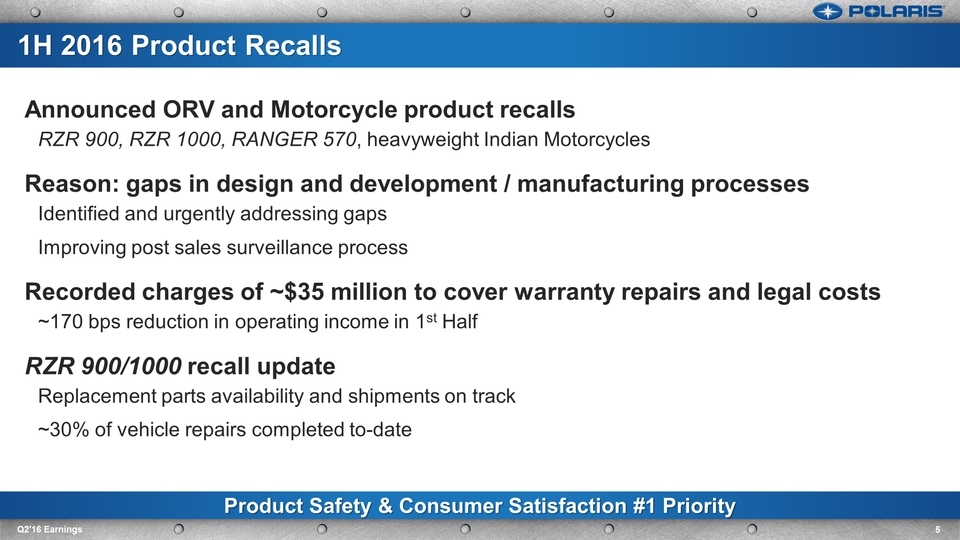
Announced ORV and Motorcycle product recallsRZR 900, RZR 1000, RANGER 570, heavyweight Indian MotorcyclesReason: gaps in design and development / manufacturing processesIdentified and urgently addressing gapsImproving post sales surveillance processRecorded charges of ~$35 million to cover warranty repairs and legal costs ~170 bps reduction in operating income in 1st HalfRZR 900/1000 recall updateReplacement parts availability and shipments on track~30% of vehicle repairs completed to-date Product Safety & Consumer Satisfaction #1 Priority 5 Q2'16 Earnings 1H 2016 Product Recalls
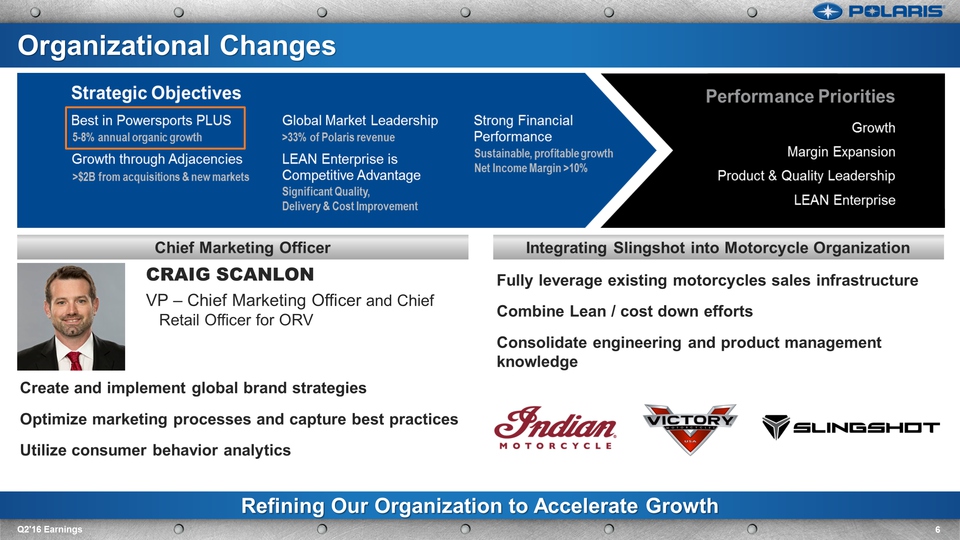
CRAIG SCANLONVP – Chief Marketing Officer and Chief Retail Officer for ORV Create and implement global brand strategiesOptimize marketing processes and capture best practicesUtilize consumer behavior analytics Fully leverage existing motorcycles sales infrastructureCombine Lean / cost down effortsConsolidate engineering and product management knowledge Refining Our Organization to Accelerate Growth 6 Q2'16 Earnings Organizational Changes Integrating Slingshot into Motorcycle Organization Chief Marketing Officer
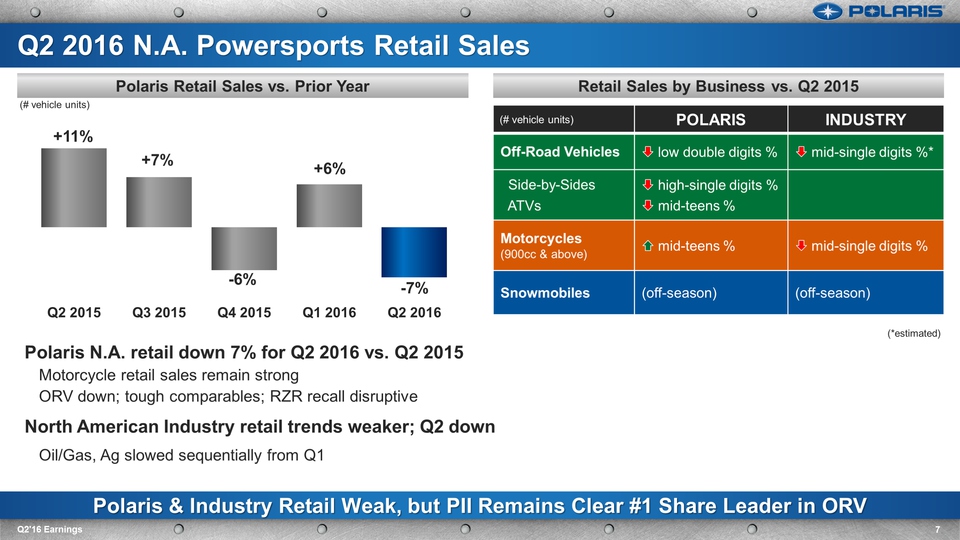
Polaris N.A. retail down 7% for Q2 2016 vs. Q2 2015Motorcycle retail sales remain strongORV down; tough comparables; RZR recall disruptiveNorth American Industry retail trends weaker; Q2 downOil/Gas, Ag slowed sequentially from Q1 Polaris & Industry Retail Weak, but PII Remains Clear #1 Share Leader in ORV Retail Sales by Business vs. Q2 2015 Polaris Retail Sales vs. Prior Year 7 Q2'16 Earnings Q2 2016 N.A. Powersports Retail Sales (# vehicle units) POLARIS INDUSTRY Off-Road Vehicles low double digits % mid-single digits %* Side-by-Sides ATVs high-single digits %mid-teens % Motorcycles(900cc & above) mid-teens % mid-single digits % Snowmobiles (off-season) (off-season) (*estimated) (# vehicle units)
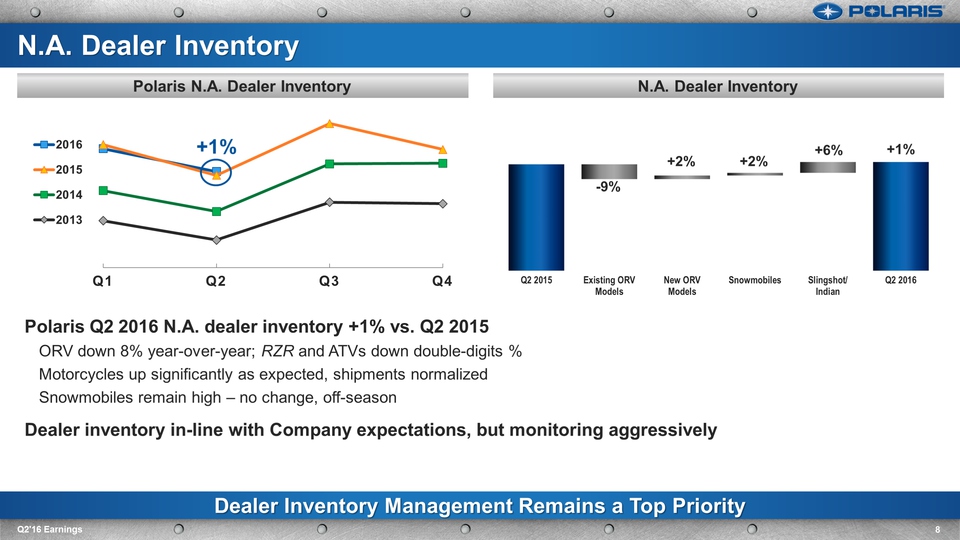
Polaris Q2 2016 N.A. dealer inventory +1% vs. Q2 2015ORV down 8% year-over-year; RZR and ATVs down double-digits %Motorcycles up significantly as expected, shipments normalizedSnowmobiles remain high – no change, off-seasonDealer inventory in-line with Company expectations, but monitoring aggressively Dealer Inventory Management Remains a Top Priority N.A. Dealer Inventory Polaris N.A. Dealer Inventory 8 Q2'16 Earnings N.A. Dealer Inventory +1% +1%
Mike SpeetzenEVP Finance & CFO Second Quarter 2016 Earnings Results July 20, 2016 POLARIS INDUSTRIES INC. Q2'16 Earnings 9
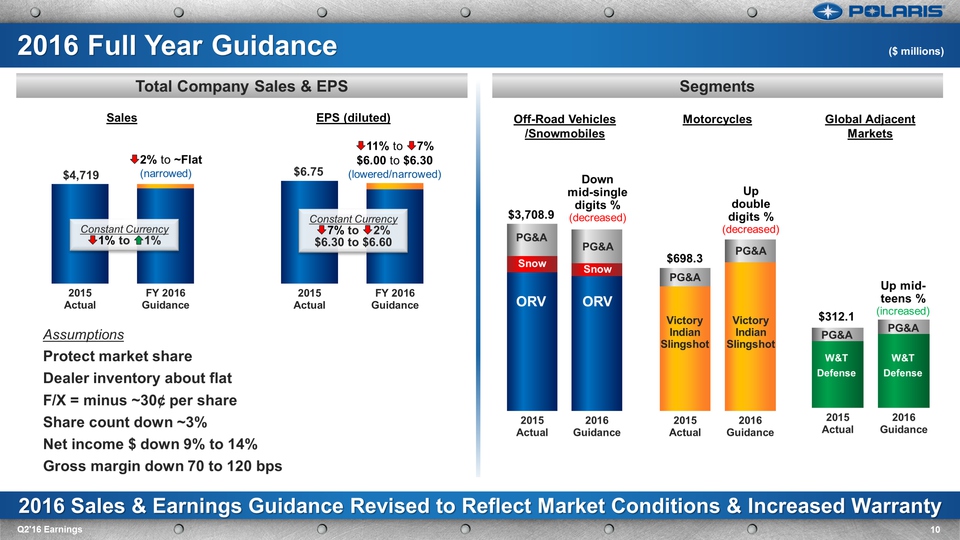
2016 Sales & Earnings Guidance Revised to Reflect Market Conditions & Increased Warranty 10 Q2'16 Earnings 2016 Full Year Guidance Segments Total Company Sales & EPS Assumptions Protect market shareDealer inventory about flatF/X = minus ~30¢ per shareShare count down ~3%Net income $ down 9% to 14%Gross margin down 70 to 120 bps 2% to ~Flat(narrowed) Constant Currency1% to 1% Constant Currency7% to 2%$6.30 to $6.60 11% to 7%$6.00 to $6.30(lowered/narrowed) Down mid-single digits %(decreased) ORV ORV PG&A PG&A Snow $3,708.9 Snow $698.3 Updouble digits %(decreased) VictoryIndianSlingshot VictoryIndianSlingshot PG&A PG&A PG&A PG&A W&TDefense W&TDefense Up mid-teens %(increased) $312.1 ($ millions) Sales EPS (diluted) Off-Road Vehicles /Snowmobiles Motorcycles Global Adjacent Markets
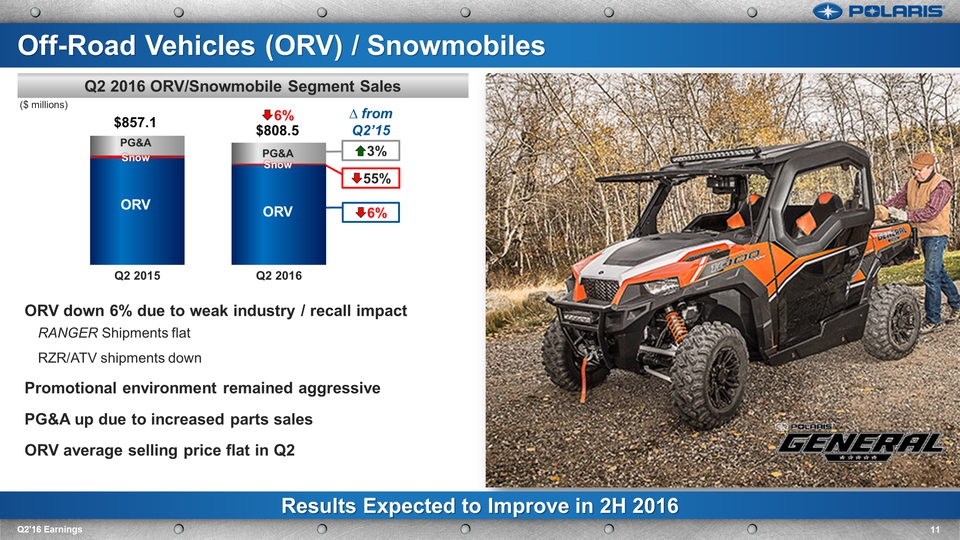
Q2 2016 ORV/Snowmobile Segment Sales ORV down 6% due to weak industry / recall impactRANGER Shipments flatRZR/ATV shipments downPromotional environment remained aggressivePG&A up due to increased parts salesORV average selling price flat in Q2 Results Expected to Improve in 2H 2016 11 Q2'16 Earnings Off-Road Vehicles (ORV) / Snowmobiles ($ millions) 6%$808.5 $857.1 ∆ from Q2’15 ORV PG&A Snow ORV PG&A Snow 6% 3% 55%
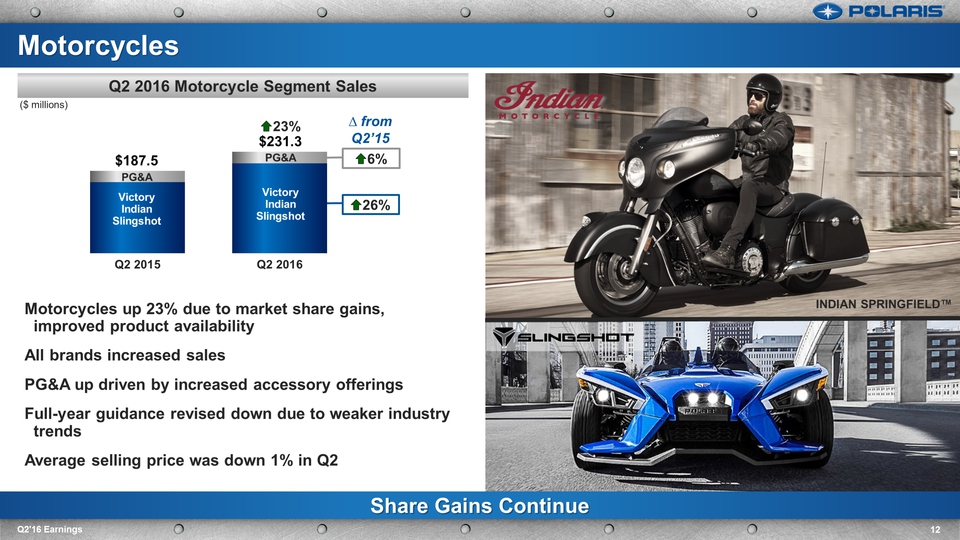
6% 26% Q2 2016 Motorcycle Segment Sales Motorcycles up 23% due to market share gains, improved product availabilityAll brands increased salesPG&A up driven by increased accessory offeringsFull-year guidance revised down due to weaker industry trendsAverage selling price was down 1% in Q2 Share Gains Continue 12 Q2'16 Earnings Motorcycles ($ millions) 23%$231.3 $187.5 PG&A VictoryIndianSlingshot VictoryIndianSlingshot PG&A ∆ from Q2’15 INDIAN SPRINGFIELD™
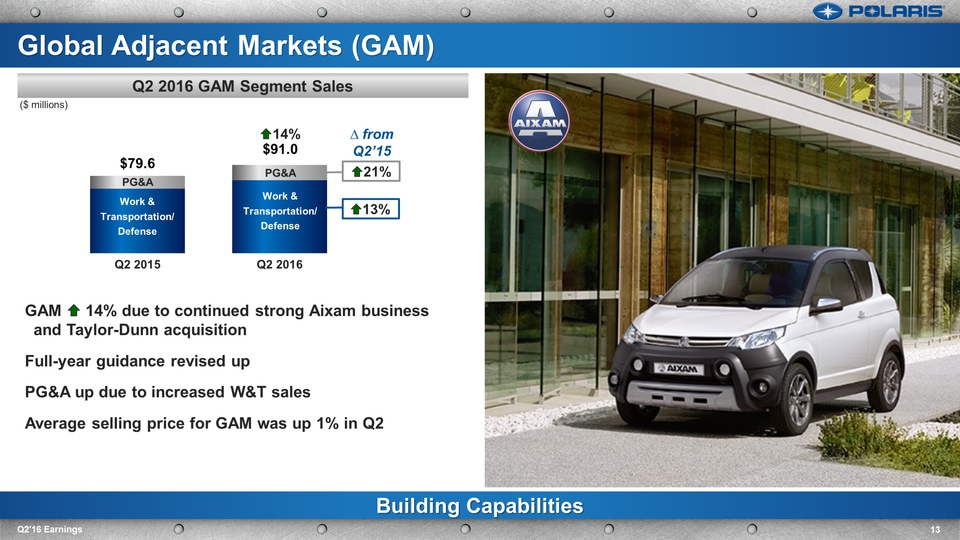
Q2 2016 GAM Segment Sales GAM 14% due to continued strong Aixam business and Taylor-Dunn acquisitionFull-year guidance revised upPG&A up due to increased W&T salesAverage selling price for GAM was up 1% in Q2 Building Capabilities 13 Q2'16 Earnings Global Adjacent Markets (GAM) ($ millions) PG&A PG&A Work &Transportation/Defense 14%$91.0 $79.6 Work &Transportation/Defense 21% 13% ∆ from Q2’15
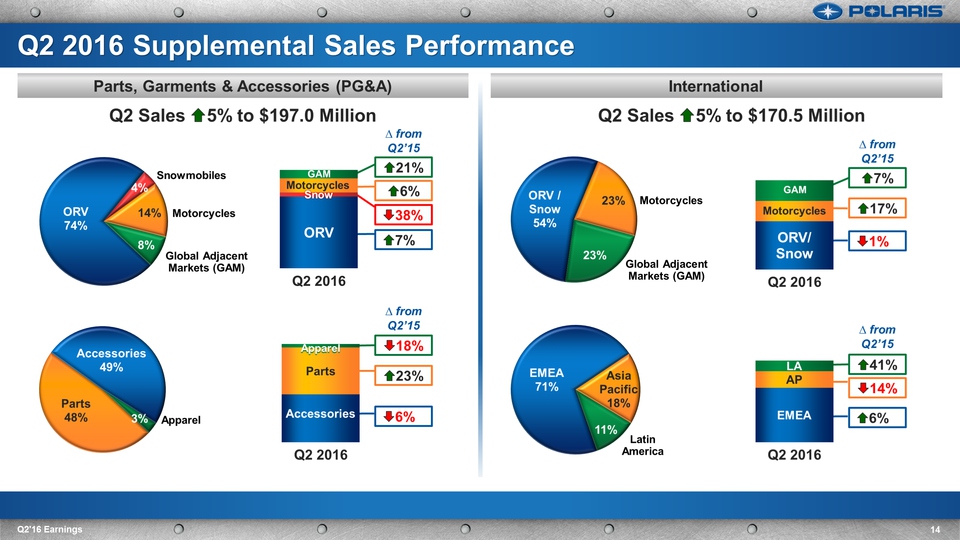
International Parts, Garments & Accessories (PG&A) 14 Q2'16 Earnings Q2 2016 Supplemental Sales Performance Motorcycles Global Adjacent Markets (GAM) Snowmobiles Motorcycles Global Adjacent Markets (GAM) Apparel 38% 21% LatinAmerica 6% 18% 7% 17% 41% 14% 1% 6% 7% 23% 6% Q2 Sales 5% to $197.0 Million ∆ from Q2’15 ∆ from Q2’15 Q2 Sales 5% to $170.5 Million ∆ from Q2’15 ∆ from Q2’15
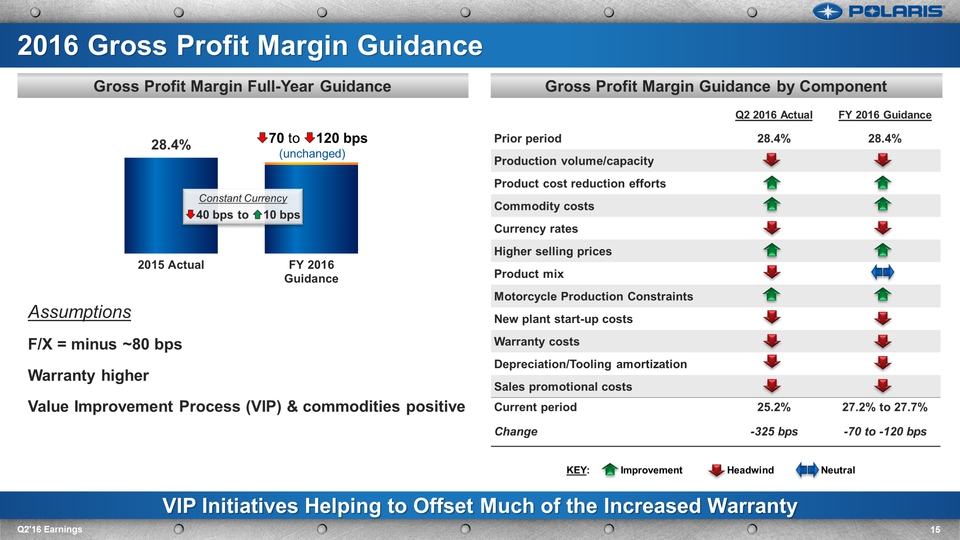
Gross Profit Margin Guidance by Component Gross Profit Margin Full-Year Guidance Q2 2016 Actual FY 2016 Guidance Prior period 28.4% 28.4% Production volume/capacity Product cost reduction efforts Commodity costs Currency rates Higher selling prices Product mix Motorcycle Production Constraints New plant start-up costs Warranty costs Depreciation/Tooling amortization Sales promotional costs Current period 25.2% 27.2% to 27.7% Change -325 bps -70 to -120 bps Assumptions F/X = minus ~80 bpsWarranty higherValue Improvement Process (VIP) & commodities positive VIP Initiatives Helping to Offset Much of the Increased Warranty 15 Q2'16 Earnings 2016 Gross Profit Margin Guidance 70 to 120 bps(unchanged) Constant Currency40 bps to 10 bps KEY: Improvement Headwind Neutral
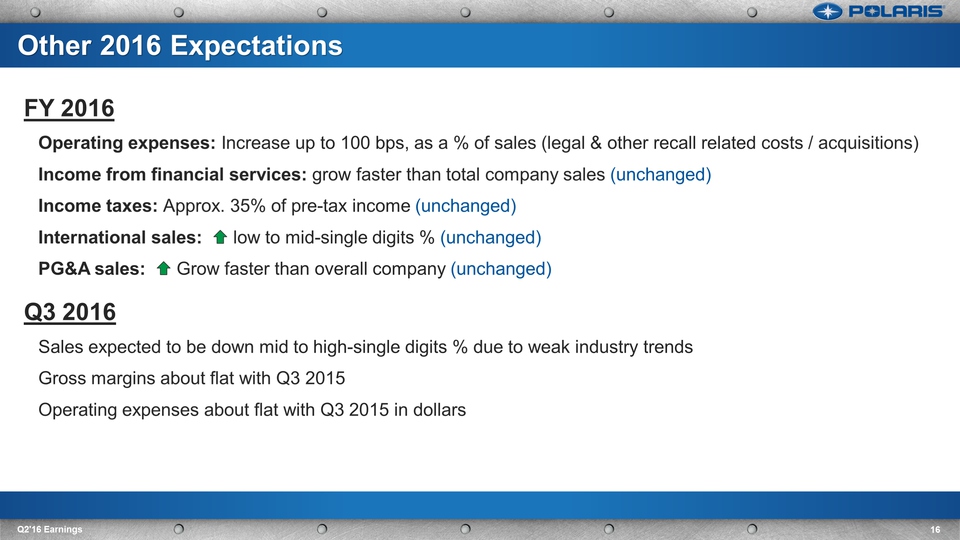
16 Q2'16 Earnings FY 2016Operating expenses: Increase up to 100 bps, as a % of sales (legal & other recall related costs / acquisitions)Income from financial services: grow faster than total company sales (unchanged)Income taxes: Approx. 35% of pre-tax income (unchanged)International sales: low to mid-single digits % (unchanged)PG&A sales: Grow faster than overall company (unchanged)Q3 2016Sales expected to be down mid to high-single digits % due to weak industry trendsGross margins about flat with Q3 2015 Operating expenses about flat with Q3 2015 in dollars Other 2016 Expectations

Scott W. WineChairman & CEO Second Quarter 2016 Earnings Results July 20, 2016 POLARIS INDUSTRIES INC. Q2'16 Earnings 17
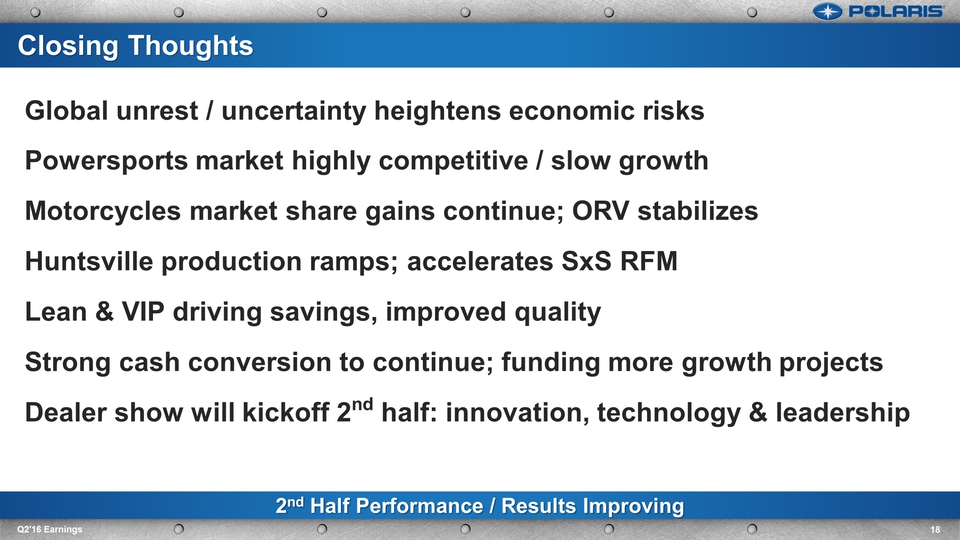
Global unrest / uncertainty heightens economic risksPowersports market highly competitive / slow growthMotorcycles market share gains continue; ORV stabilizesHuntsville production ramps; accelerates SxS RFM Lean & VIP driving savings, improved qualityStrong cash conversion to continue; funding more growth projectsDealer show will kickoff 2nd half: innovation, technology & leadership 2nd Half Performance / Results Improving 18 Q2'16 Earnings Closing Thoughts
Thank YouQuestions?
20 Q2'16 Earnings Vision and StrategyForeign Currency Exposure Q2 Financial PositionIncome from Financial Services SUPPLEMENTAL DATA
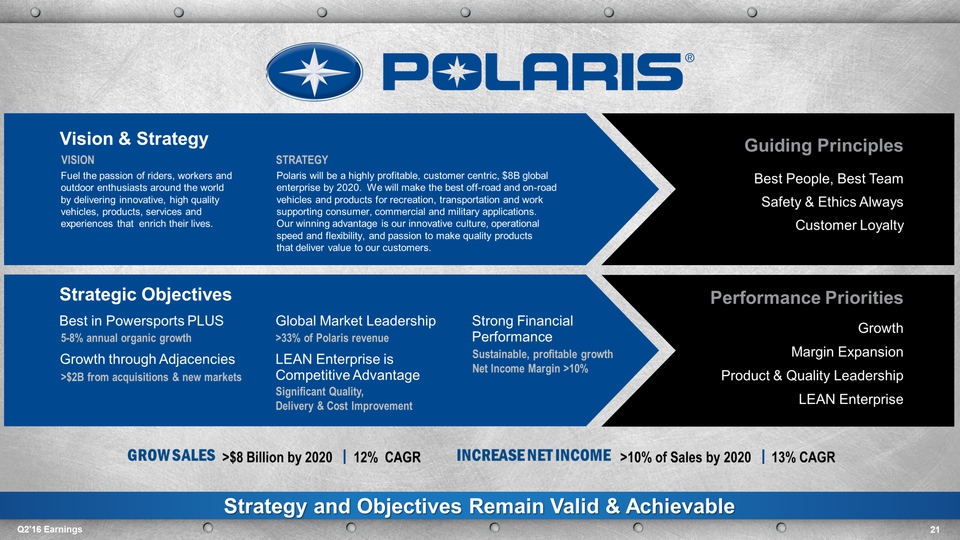
Strategic Objectives Vision & Strategy VISION Fuel the passion of riders, workers and outdoor enthusiasts around the world by delivering innovative, high quality vehicles, products, services and experiences that enrich their lives. STRATEGY Polaris will be a highly profitable, customer centric, $8B global enterprise by 2020. We will make the best off-road and on-road vehicles and products for recreation, transportation and work supporting consumer, commercial and military applications. Our winning advantage is our innovative culture, operational speed and flexibility, and passion to make quality productsthat deliver value to our customers. Best in Powersports PLUS Growth through Adjacencies 5-8% annual organic growth >$2B from acquisitions & new markets Global Market Leadership LEAN Enterprise is Competitive Advantage >33% of Polaris revenue Significant Quality, Delivery & Cost Improvement Strong Financial Performance Sustainable, profitable growthNet Income Margin >10% Guiding Principles Best People, Best Team Safety & Ethics Always Customer Loyalty Performance Priorities Growth Margin Expansion Product & Quality Leadership LEAN Enterprise >$8 Billion by 2020 12% CAGR >10% of Sales by 2020 13% CAGR 21 Q2'16 Earnings Strategy and Objectives Remain Valid & Achievable
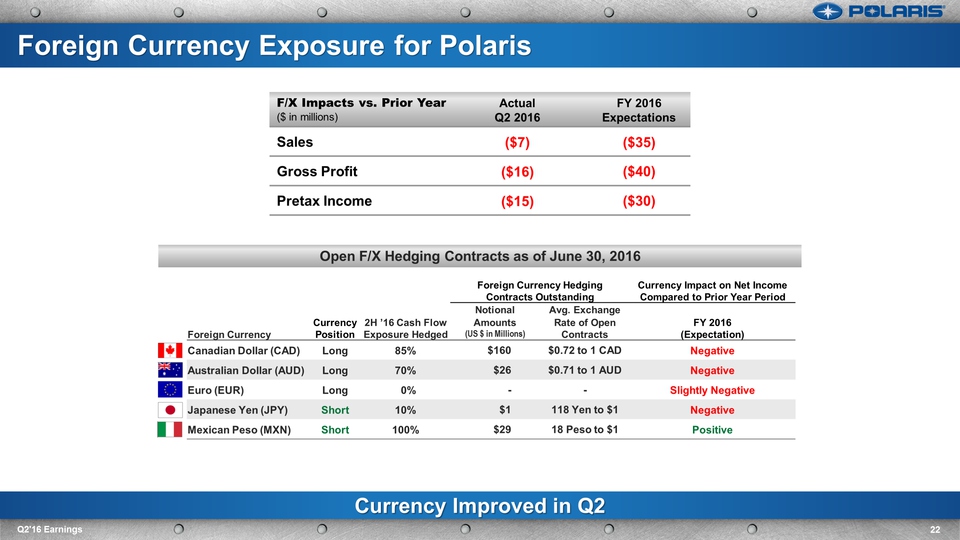
Currency Improved in Q2 22 Q2'16 Earnings Foreign Currency Exposure for Polaris Foreign Currency Hedging Contracts Outstanding Currency Impact on Net IncomeCompared to Prior Year Period Notional Avg. Exchange Foreign Currency CurrencyPosition 2H ’16 Cash FlowExposure Hedged Amounts(US $ in Millions) Rate of OpenContracts FY 2016(Expectation) Canadian Dollar (CAD) Long 85% $160 $0.72 to 1 CAD Negative Australian Dollar (AUD) Long 70% $26 $0.71 to 1 AUD Negative Euro (EUR) Long 0% - - Slightly Negative Japanese Yen (JPY) Short 10% $1 118 Yen to $1 Negative Mexican Peso (MXN) Short 100% $29 18 Peso to $1 Positive F/X Impacts vs. Prior Year($ in millions) ActualQ2 2016 FY 2016 Expectations Sales ($7) ($35) Gross Profit ($16) ($40) Pretax Income ($15) ($30) Open F/X Hedging Contracts as of June 30, 2016
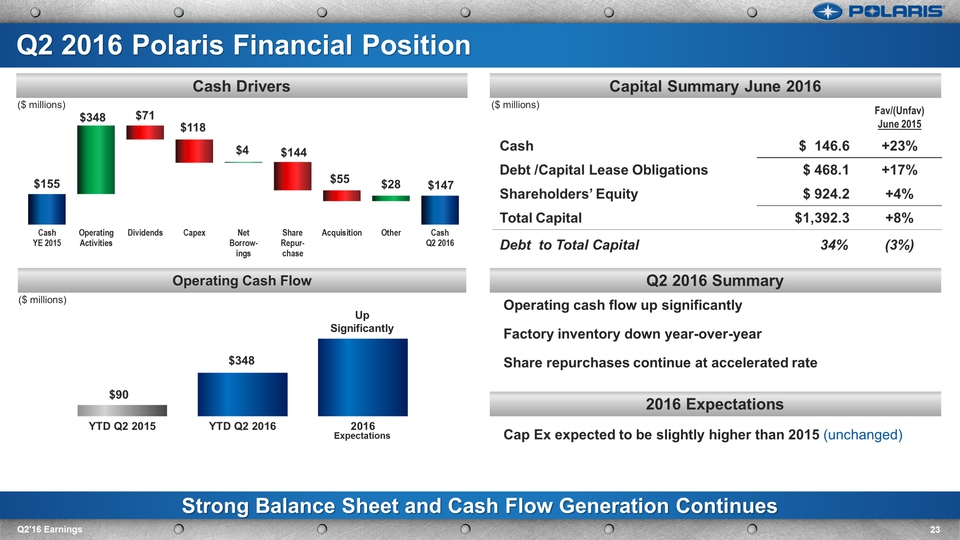
Q2 2016 Polaris Financial Position 23 Q2'16 Earnings Capital Summary June 2016 Cash Drivers Fav/(Unfav)June 2015 Cash $ 146.6 +23% Debt /Capital Lease Obligations $ 468.1 +17% Shareholders’ Equity $ 924.2 +4% Total Capital $1,392.3 +8% Debt to Total Capital 34% (3%) 2015Operating cash flow up significantlyFactory inventory down year-over-yearShare repurchases continue at accelerated rateCap Ex expected to be slightly higher than 2015 (unchanged) Operating Cash Flow Strong Balance Sheet and Cash Flow Generation Continues UpSignificantly ($ millions) ($ millions) ($ millions) Expectations Q2 2016 Summary 2016 Expectations
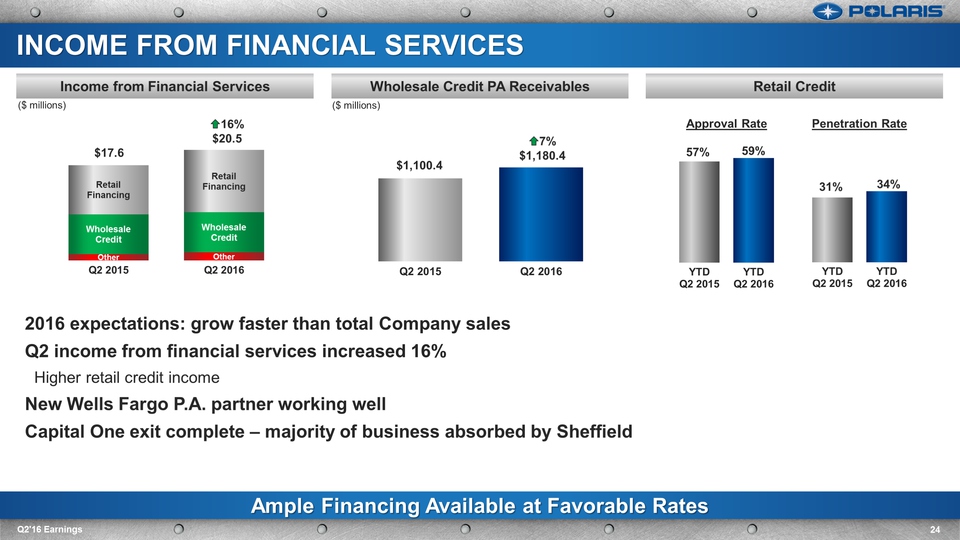
Retail Credit Wholesale Credit PA Receivables 24 Q2'16 Earnings Income from Financial Services Ample Financing Available at Favorable Rates INCOME FROM FINANCIAL SERVICES 2016 expectations: grow faster than total Company salesQ2 income from financial services increased 16%Higher retail credit incomeNew Wells Fargo P.A. partner working wellCapital One exit complete – majority of business absorbed by Sheffield $17.6 16%$20.5 7%$1,180.4 $1,100.4 ($ millions) ($ millions) Approval Rate Penetration Rate