Attached files
| file | filename |
|---|---|
| EX-99.1 - EXHIBIT 99.1 - Customers Bancorp, Inc. | ex99-1.htm |
| 8-K - CUSTOMERS BANCORP, INC. FORM 8-K - Customers Bancorp, Inc. | customers8k.htm |

Highly Focused, Low Risk, Above Average Growth Bank Holding Company Investor PresentationJuly, 2016NYSE: CUBI Member FDIC

* Forward-Looking Statements This presentation, as well as other written or oral communications made from time to time by us, contains forward-looking information within the meaning of the safe harbor provisions of the U.S. Private Securities Litigation Reform Act of 1995. These statements relate to future events or future predictions, including events or predictions relating to future financial performance, and are generally identifiable by the use of forward-looking terminology such as “believe,” “expect,” “may,” “will,” “should,” “plan,” “intend,” or “anticipate” or the negative thereof or comparable terminology. These forward-looking statements are only predictions and estimates regarding future events and circumstances and involve known and unknown risks, uncertainties and other factors, including the risks described under “Risk Factors” in our Annual Report on Form 10-K for the year ended December 31, 2015 and subsequent Quarterly Reports on Form 10-Q, as such factors may be updated from time to time in our filings with the SEC, that may cause actual results, levels of activity, performance or achievements to be materially different from any future results, levels of activity, performance or achievements expressed or implied by such forward-looking statements. The information is based upon various assumptions that may not prove to be correct.In addition to the risks described under “Risk Factors” in the reports we file with the SEC under the Securities Exchange Act of 1934, as amended, important factors to consider and evaluate with respect to such forward-looking statements include:changes in the external competitive market factors that might impact our results of operations;changes in laws and regulations, including without limitation changes in capital requirements under Basel III;changes in our business strategy or an inability to execute our strategy due to the occurrence of unanticipated events;our ability to identify potential candidates for, and consummate, acquisition or investment transactions;the timing of acquisition or investment transactions;constraints on our ability to consummate an attractive acquisition or investment transaction because of significant competition for these opportunities;local, regional and national economic conditions and events and the impact they may have on us and our customers;costs and effects of regulatory and legal developments, including the results of regulatory examinations and the outcome of regulatory or other governmental inquiries and proceedings, such as fines or restrictions on our business activities;ability to attract deposits and other sources of liquidity;changes in the financial performance and/or condition of our borrowers;changes in the level of non-performing and classified assets and charge-offs;changes in estimates of future loan loss reserve requirements based upon the periodic review thereof under relevant regulatory and accounting requirements; unforeseen challenges that may arise in connection with the consummation of our recently completed transaction with Higher One; inflation, interest rate, securities market and monetary fluctuations;

* Forward-Looking Statements timely development and acceptance of new banking products and services and perceived overall value of these products and services by users;changes in consumer spending, borrowing and saving habits;technological changes;our ability to increase market share and control expenses;continued volatility in the credit and equity markets and its effect on the general economy;effects of changes in accounting policies and practices, as may be adopted by the regulatory agencies, as well as the Public Company Accounting Oversight Board, the Financial Accounting Standards Board and other accounting standard setters;the businesses of Customers Bank and any acquisition targets or merger partners and subsidiaries not integrating successfully or such integration being more difficult, time-consuming or costly than expected, including with respect to our recent acquisition of certain assets from Higher One;material differences in the actual financial results of merger and acquisition activities compared with expectations, such as with respect to the full realization of anticipated cost savings and revenue enhancements within the expected time frame, including with respect to our acquisition of the Disbursements Business from Higher One.our ability to successfully implement our growth strategy, control expenses and maintain liquidity; andCustomers Bank’s ability to pay dividends to Customers Bancorp. You are cautioned not to place undue reliance on these forward-looking statements, which speak only as of the date hereof, or, in the case of other documents referred to herein, the dates of those documents. We do not undertake any obligation to release publicly or otherwise provide any revisions to these forward-looking statements to reflect events or circumstances occurring after the date hereof or to reflect the occurrence of unanticipated events, except as may be required under applicable law.
A $9.7 billion asset business bank serving privately held businesses A digital consumer bank, set up as a division of Customers Bank, serving millennials, middle income families and underbanked throughout the United States Member FDIC
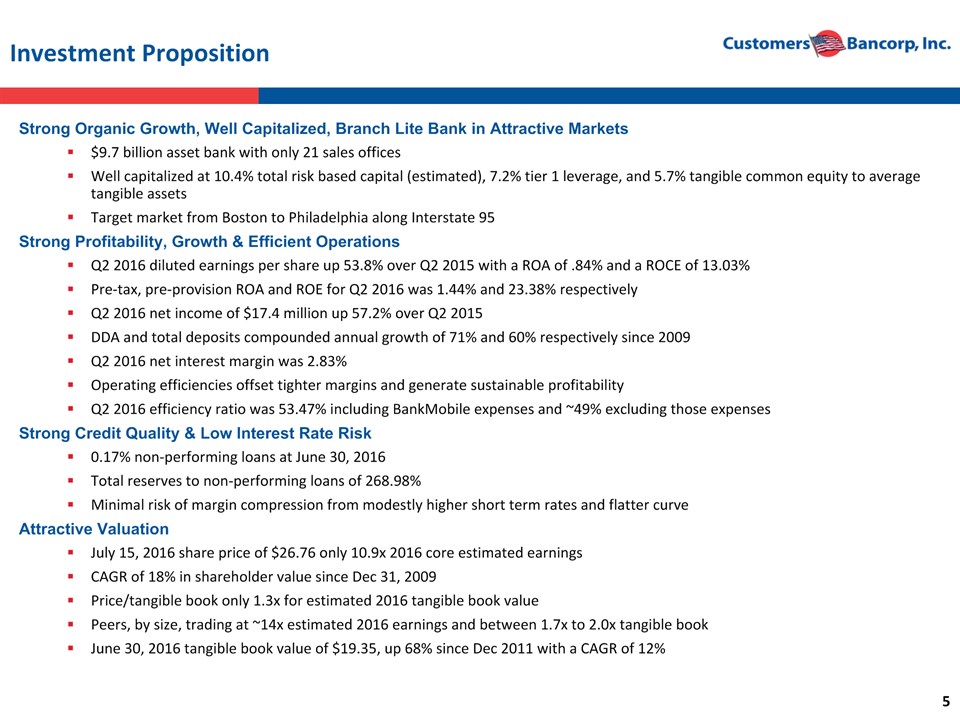
* Investment Proposition Strong Organic Growth, Well Capitalized, Branch Lite Bank in Attractive Markets$9.7 billion asset bank with only 21 sales officesWell capitalized at 10.4% total risk based capital (estimated), 7.2% tier 1 leverage, and 5.7% tangible common equity to average tangible assetsTarget market from Boston to Philadelphia along Interstate 95Strong Profitability, Growth & Efficient OperationsQ2 2016 diluted earnings per share up 53.8% over Q2 2015 with a ROA of .84% and a ROCE of 13.03%Pre-tax, pre-provision ROA and ROE for Q2 2016 was 1.44% and 23.38% respectivelyQ2 2016 net income of $17.4 million up 57.2% over Q2 2015 DDA and total deposits compounded annual growth of 71% and 60% respectively since 2009 Q2 2016 net interest margin was 2.83%Operating efficiencies offset tighter margins and generate sustainable profitabilityQ2 2016 efficiency ratio was 53.47% including BankMobile expenses and ~49% excluding those expensesStrong Credit Quality & Low Interest Rate Risk0.17% non-performing loans at June 30, 2016Total reserves to non-performing loans of 268.98%Minimal risk of margin compression from modestly higher short term rates and flatter curveAttractive ValuationJuly 15, 2016 share price of $26.76 only 10.9x 2016 core estimated earningsCAGR of 18% in shareholder value since Dec 31, 2009Price/tangible book only 1.3x for estimated 2016 tangible book valuePeers, by size, trading at ~14x estimated 2016 earnings and between 1.7x to 2.0x tangible bookJune 30, 2016 tangible book value of $19.35, up 68% since Dec 2011 with a CAGR of 12%

* Banking Industry Trends……How Do We Deal with These Issues Impediments to Growth External Forces Role of traditional bank branches changing very rapidlyMobile banking fastest growing channelBanks of all sizes revisiting their business strategies, revenue generation models and cost structuresTechnology and customer needs, desires and style changing rapidlyStudents, underbanked and middle class paying lion’s share of fees to banks Traditional CRE lending very difficult to do and under regulatory scrutinyVery little consumer loan growth; headwinds for consumer credit qualityGrowth exists only at niche playersMortgage banking revenues are extremely volatilePressure to reduce or eliminate Overdraft and other nuisance fees by CFPBRegulators principally focus on strength of risk management and compliance and less on profitable growth Business Issues Shareholder Expectations Start bank and sell at 2 to 3x book no longer an option – what do shareholders of small privately held banks do?Equity markets not available to small banksBanks need to earn 10% or more ROE if they want to remain independentConsistent ROE of 12% or greater and ROA of 1% or greater being rewarded well by market Slow economic growth. Some credit quality concerns emergingFewer good quality consumer and business loan opportunities for non niche playersPressure continues on margin. Days of 3.5%-4.0% margin are gone. Banks need to reduce efficiency ratiosDifficult to attract good talentMust be excellent at risk management and complianceShareholders want 10%+ ROE, consistent quality growth and strong risk management infrastructure Issues facing Us What is our unique strategy for revenue and profitable growth?How do we attract and retain best talent?How do we take advantage of technology?How do we deal with growing compliance burden?How do we manage our risks better than peers?How do we lower our efficiency ratios?

* Innovator / disruptor / not branch dependentDifferentiated / Unique modelTechnology savvyProduct dominance What is Our Business Model Credit Improving – Though Banks Face a Number of Operational Headwinds Credit Quality Improved over past 5 years; some pressure emergingQuality Asset Generation Remains A ChallengeBanks are starved for interest-earning assets and exploring new asset classes, competing on price and structure and looking into specialty finance business / lendingNIM Compression (1)Low rate environment for the foreseeable future will continue to compress NIMMany institutions wither betting on rates or otherwise taking excessive interest rate riskIndustry NIM continues to declineDown over 100 bps since 1995Low interest rate environment, competitive pressures likely to prevent return to historical levelsOperational leverage Expense management is top of mind as banks try to improve efficiency in light of revenue pressure and increased regulatory / compliance costsRegulatory pressure expected to stay robustNew StrategiesYesterday’s strategies may not be appropriate tomorrow Critical to Have a Winning Business Model Heavy branch based delivery systemStrong credit qualityCore depositsDependent on OD feesExpense management Traditional Banks Diversified revenue sourcesCross sell strengthCapital efficiencyHigher profitability / consistent earnings Fee Income Leaders Relationship & Innovative Banks Source: SNL Financial. 1Includes data for top 50 U.S. banks by assets.

* Our Competitive Advantage: A Highly Experienced Management Team
* Customers Bank Executing On Our Unique High Performing Banking Model
* Disciplined Model for Increasing Shareholder Value Strong organic revenue growth + scalable infrastructure = sustainable double digit EPS = growth and increased shareholder valueA very robust risk management driven business strategyBuild tangible book value per share each quarter via earningsAny book value dilution from any acquisitions must be overcome within 1-2 years; otherwise stick with organic growth strategySuperior execution through proven management team Disciplined Model for Superior Shareholder Value Creation
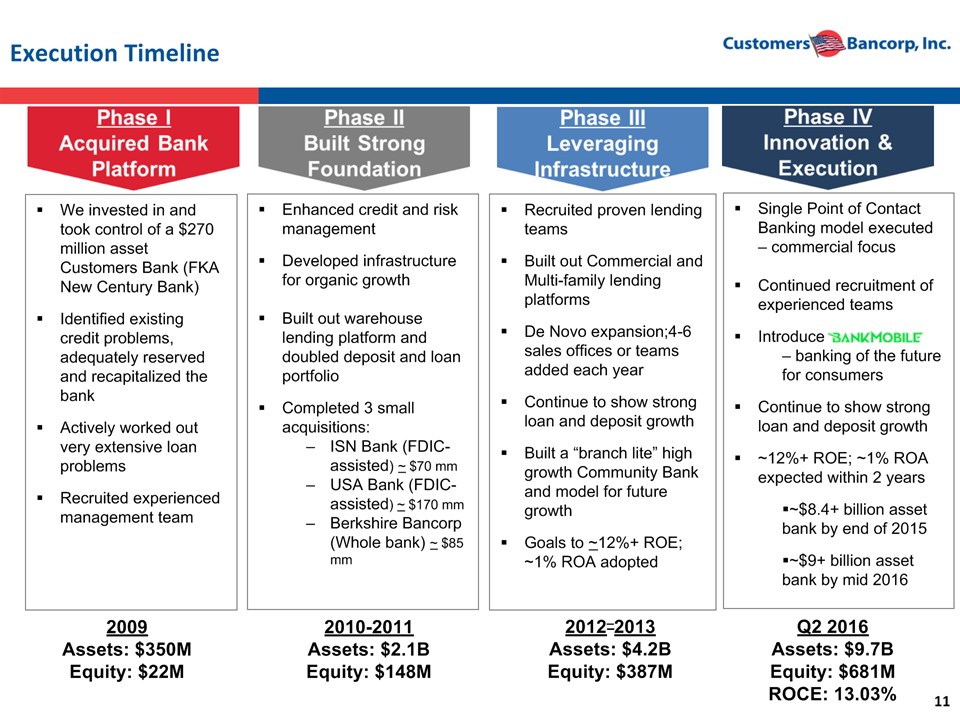
* Execution Timeline We invested in and took control of a $270 million asset Customers Bank (FKA New Century Bank)Identified existing credit problems, adequately reserved and recapitalized the bankActively worked out very extensive loan problemsRecruited experienced management team Enhanced credit and risk managementDeveloped infrastructure for organic growthBuilt out warehouse lending platform and doubled deposit and loan portfolioCompleted 3 small acquisitions:ISN Bank (FDIC-assisted) ~ $70 mmUSA Bank (FDIC-assisted) ~ $170 mmBerkshire Bancorp (Whole bank) ~ $85 mm Recruited proven lending teamsBuilt out Commercial and Multi-family lending platformsDe Novo expansion;4-6 sales offices or teams added each yearContinue to show strong loan and deposit growthBuilt a “branch lite” high growth Community Bank and model for future growthGoals to ~12%+ ROE; ~1% ROA adopted 2009Assets: $350MEquity: $22M 2010-2011Assets: $2.1BEquity: $148M 2012–2013Assets: $4.2BEquity: $387M Q2 2016Assets: $9.7BEquity: $681MROCE: 13.03% Single Point of Contact Banking model executed – commercial focusContinued recruitment of experienced teamsIntroduce – banking of the future for consumersContinue to show strong loan and deposit growth~12%+ ROE; ~1% ROA expected within 2 years~$8.4+ billion asset bank by end of 2015~$9+ billion asset bank by mid 2016

* Very Experienced Teams Exceptional Service Risk Based Incentive Compensation Banking Strategy – Customers Bank Business Banking Focus - ~95% of revenues come from business segmentsLoan and deposit business through these well diversified segments:Banking Privately Held Businesses – 42% of portfolio (including deferred costs and fees)Manufacturing, service, technology, wholesale, equipment financingPrivate mid size mortgage companiesBanking High Net Worth Families – 39% of portfolio (including deferred costs and fees)New York and regional multi family lendingSelected Commercial Real Estate – 15% of portfolio
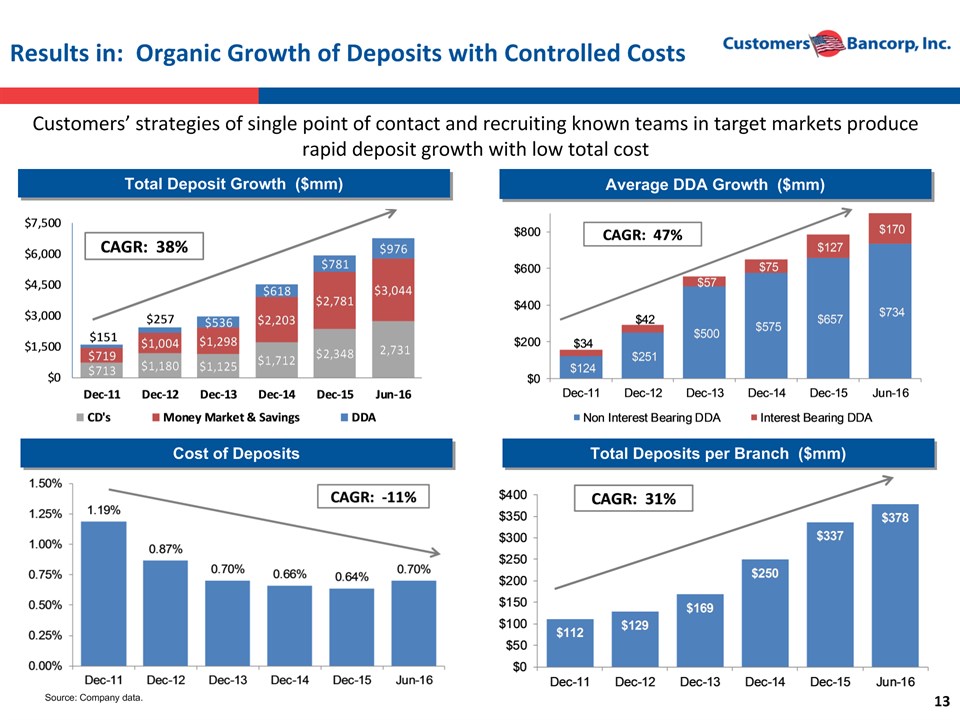
* Results in: Organic Growth of Deposits with Controlled Costs Source: Company data. Total Deposit Growth ($mm) Average DDA Growth ($mm) Cost of Deposits Total Deposits per Branch ($mm) Customers’ strategies of single point of contact and recruiting known teams in target markets produce rapid deposit growth with low total cost

* Lending Strategy High Growth with Strong Credit QualityContinuous recruitment and retention of high quality teamsCentralized credit committee approval for all loansLoans are stress tested for higher rates and a slower economyInsignificant delinquencies on loans originated since new management team took overCreation of solid foundation for future earnings Source: Company documents. Includes deferred costs and fees.

* NPL Source: SNL Financial, Company documents. Peer data consists of Northeast and Mid-Atlantic banks and thrifts with assets between $3.5 billion and $10.0 billion. Industry data includes all FDIC insured banks. Peer and Industry data as of June 30, 2016 Build an Outstanding Loan Quality Portfolio Charge Offs Asset Quality Indicators Continue to be Strong Note: Customers 2015 charge-offs includes 12 bps for a $9 million fraudulent loan

* C&I & Owner Occupied CRE Banking Strategy Private & Commercial BankingTarget companies with up to $100 million annual revenuesVery experienced teamsFour new teams with 14 professionals added in 2015, including a new business line Equipment Finance TeamSingle point of contactNE, NY, PA & NJ marketsSBA loans originated by small business relationship managersBanking Mortgage CompaniesPrivate banking focused on privately held mortgage companies generally with equity of $5 to $10 million Very strong credit quality relationship business with good fee income and deposits~75 strong mortgage companies as clients All outstanding loans are variable rate and classified as held for saleNon-interest bearing DDA’s are about 10% of outstanding loansBalances rebounding from 2013 low and expected to stay at this level Banking Privately Held Business Commercial Loan and Deposit Growth ($mm) Source: Company documents.

* Multi-Family Banking Strategy Banking High Net Worth Families Multi-Family Loan and Deposit Growth ($mm) Focus on families that have income producing real estate in their portfoliosPrivate banking approachFocus Markets: New York & Philadelphia MSAsAverage Loan Size: $5.0 – $7.0 millionRemote banking for deposits and other relationship based loansPortfolio grown organically from a start up with very experienced teams hired in the past 3 yearsStrong credit quality nicheInterest rate risk managed actively Source: Company documents.
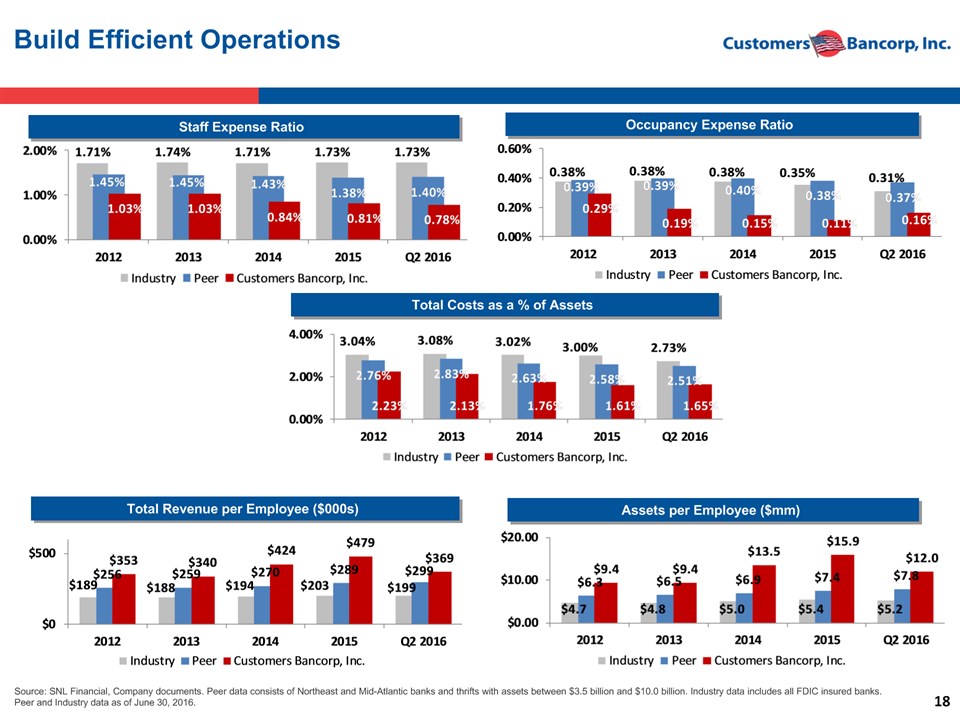
* Staff Expense Ratio Build Efficient Operations Source: SNL Financial, Company documents. Peer data consists of Northeast and Mid-Atlantic banks and thrifts with assets between $3.5 billion and $10.0 billion. Industry data includes all FDIC insured banks. Peer and Industry data as of June 30, 2016. Occupancy Expense Ratio Total Costs as a % of Assets Total Revenue per Employee ($000s) Assets per Employee ($mm)
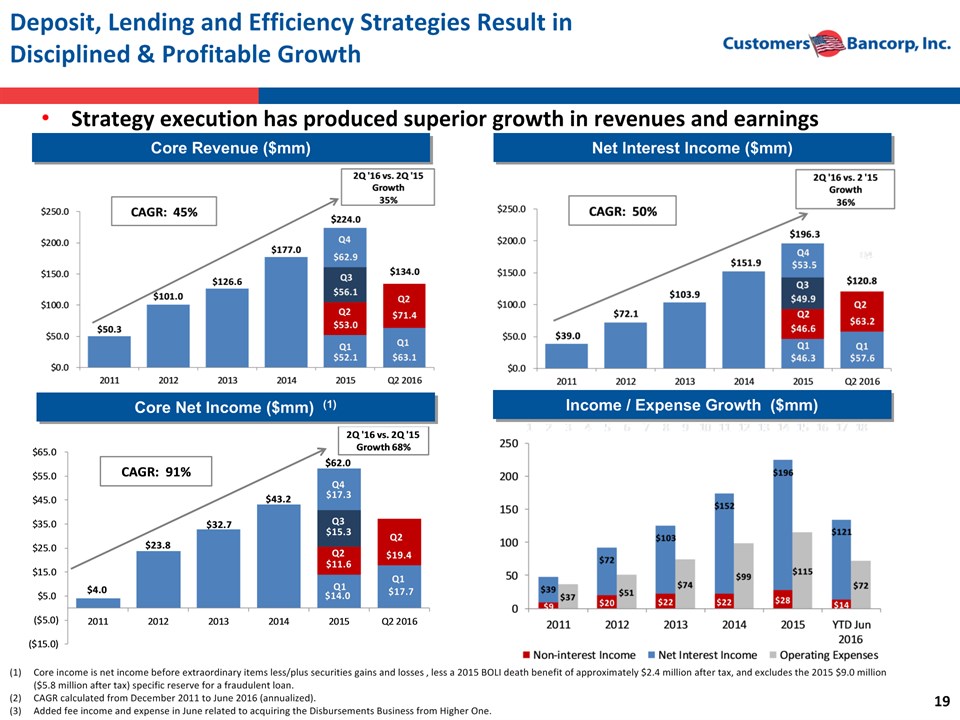
* Deposit, Lending and Efficiency Strategies Result in Disciplined & Profitable Growth Core Revenue ($mm) Core Net Income ($mm) (1) Net Interest Income ($mm) Strategy execution has produced superior growth in revenues and earnings Income / Expense Growth ($mm) Core income is net income before extraordinary items less/plus securities gains and losses , less a 2015 BOLI death benefit of approximately $2.4 million after tax, and excludes the 2015 $9.0 million ($5.8 million after tax) specific reserve for a fraudulent loan.CAGR calculated from December 2011 to June 2016 (annualized).Added fee income and expense in June related to acquiring the Disbursements Business from Higher One.
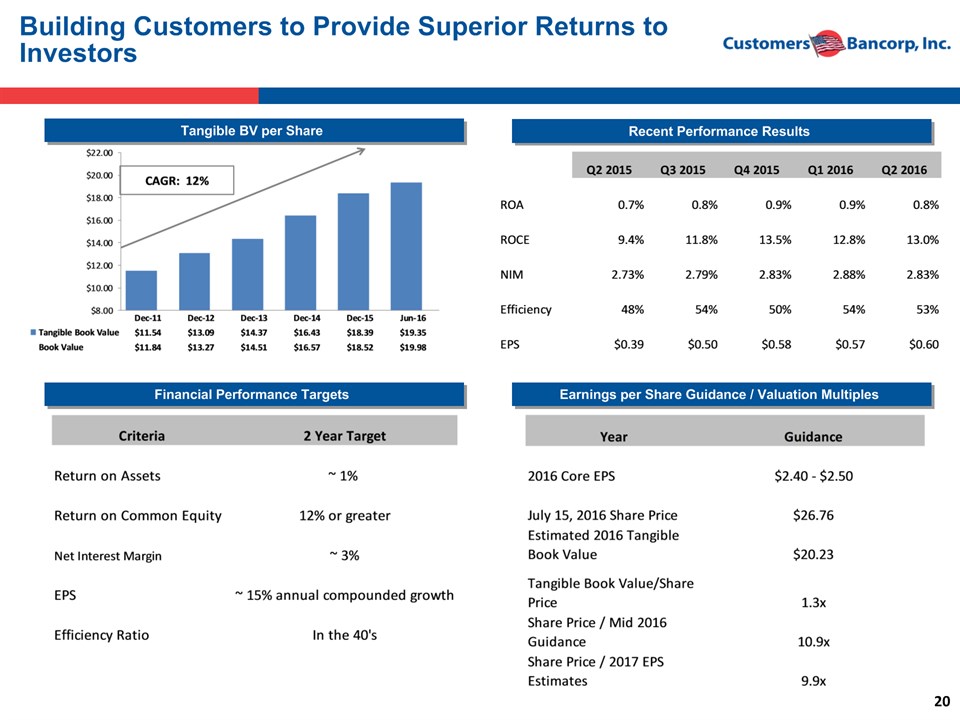
* Tangible BV per Share Building Customers to Provide Superior Returns to Investors Recent Performance Results Financial Performance Targets Earnings per Share Guidance / Valuation Multiples

* Our Approach to Developing a Winning Business Model Must focus on both “Relationship” or “High Touch” banking combined with “Highly Efficient” or “High Tech”. Strategy should be unique as to not be copied easilyAttract and retain best high quality talent. Business Bankers / Relationship Bankers with approximately 15 years+ experience who bring a book of business with themCompensate leaders based upon risk and profitability with both cash and equityNever deviate from following critical success factorsOnly focus on very strong credit quality nichesHave very strong risk management cultureHave significantly lower efficiency ratio than peers to deliver sustainable strong profitability and growth with lower margin and lower risk profileAlways attract and retain top quality talentCulture of innovation and continuous improvement
*

* Startling Facts about Banks Banks each year charge about $32 billion in overdraft fees – that’s allowing or creating over 1 billion overdrafts each year….Why??Payday lenders charge consumers another $7 billion in feesThat’s more than 3x what America spends on Breast Cancer and Lung Cancer combined and almost the amount Americans spend on vegetablesThis is about 50% of all America spends on Food StampsSome of banking industries most profitable consumer customers hate banksAnother estimated 25% consumers are unbanked or under bankedThis should not be happening in AmericaWe hope to start, in a small way, a new revolution to profitably address this problem

* No fee or very low fee banking, 25 bps higher interest savings, line of credit, 55,000 ATM’s, Personal Banker and more, all in the palm of your handMarketing Strategy Target technology dependent younger consumers; including underserved / underbanked and middle income AmericansCapitalize on retaining at least 75% of our ~ two million student customers as lifetime customersReach middle income markets also through Affinity Banking GroupsRevenue generation from debit card interchange and margin from low cost core depositsDurbin Amendment a unique opportunity for Bank MobileExpected to achieve profitability within 12 months and above average, franchise value, ROA and ROE within 5 years Creating a Virtual Bank for the Future for Consumers

* Executive Summary of Recent Acquisition Strategically compelling acquisition for CUBI and transformational transaction for , making it one of the top digital banks in the USBusiness to be combined with platform marking inflection point in its developmentAssume servicing of ~2mm new student checking customers holding over $500mm in non-interest bearing depositsImmediately accelerates evolution from investment phase to shareholder return phasePowerful customer acquisition model drives maximum lifetime customer valueProven and sustainable business model; 14 year operating history and over $70bn in payments processedGenerates over 500,000 new student checking accounts annuallyPositions as the primary banking relationship as students evolve to young professionals and target retail consumer base changes from Gen X to millennialsCUBI uniquely positioned to capitalize on low risk transactionCustomers Bank has a deep understanding of the business given existing Higher One relationship coupled with extensive due diligenceDeal structured to address past regulatory and reputational risk of legacy practices Extensive dialogue with relevant regulators to preview transaction and go-forward operating modelFinancially attractive transaction to CUBI shareholders while creating one of the most technologically advanced businesses in banking todayAccretive to core EPS in first full year following closeLimited TBVPS dilution with rapid breakeven despite 100% cash transactionPractically all payments to Higher One are tax deductibleHighly attractive IRR CUBI Acquired Student Checking Customers & Refund Disbursement Business from Higher One

* BankMobile Business Model – Old vs. New Higher One acquisition coupled with existing technology enables BankMobile to convert student customers into lifetime customers

* BankMobile’s Customer Lifecycle Ecosystem BankMobile is well positioned to be its customers' primary banking relationship throughout their lives

* Additional option value for CUBI Shareholders created by pro forma platform Significant Value for with Embedded Upside ~2 million active deposit customers on day oneOver 500,000 new accounts per yearPotential for long-term growth rate of 15% - 20%Existing students with automatic recurring growthUnique opportunity to capture lifetime value of customers and cross-sell value added products and servicesPro forma platform has significant additional growth prospects via partnerships (lending products) and select acquisitions Embedded Upside Opportunity End Game Fee Revenue Expansion can drive P/E ExpansionValuation on Payments Processors & FinTech sector for a business segment …think multiple of revenues….CUBI shareholders participate in platform contributions:A division of Customers BankRetain Intellectual Property (IP), rent for feeCUBI to explore various strategic options for to maximize shareholder value
* Contacts Company:Robert Wahlman, CFO Tel: 610-743-8074 rwahlman@customersbank.comwww.customersbank.com Jay SidhuChairman & CEOTel: 610-301-6476 jsidhu@customersbank.comwww.customersbank.com

* Appendix

* Customers Bank Risk Management

* Elements of an Effective Risk Management Program

* ERM Framework at Customers Bancorp, Inc. Well Defined ERM Plan – ERM Integration into CAMELS +++++
* Customers Bancorp, Inc. Financial Statements

* Income Statement CUSTOMERS BANCORP, INC. AND SUBSIDIARIES CUSTOMERS BANCORP, INC. AND SUBSIDIARIES CUSTOMERS BANCORP, INC. AND SUBSIDIARIES CUSTOMERS BANCORP, INC. AND SUBSIDIARIES CUSTOMERS BANCORP, INC. AND SUBSIDIARIES CUSTOMERS BANCORP, INC. AND SUBSIDIARIES CUSTOMERS BANCORP, INC. AND SUBSIDIARIES CUSTOMERS BANCORP, INC. AND SUBSIDIARIES CUSTOMERS BANCORP, INC. AND SUBSIDIARIES CUSTOMERS BANCORP, INC. AND SUBSIDIARIES CUSTOMERS BANCORP, INC. AND SUBSIDIARIES CUSTOMERS BANCORP, INC. AND SUBSIDIARIES CONSOLIDATED STATEMENTS OF OPERATIONS FOR THE THREE MONTHS ENDED - UNAUDITED CONSOLIDATED STATEMENTS OF OPERATIONS FOR THE THREE MONTHS ENDED - UNAUDITED CONSOLIDATED STATEMENTS OF OPERATIONS FOR THE THREE MONTHS ENDED - UNAUDITED CONSOLIDATED STATEMENTS OF OPERATIONS FOR THE THREE MONTHS ENDED - UNAUDITED CONSOLIDATED STATEMENTS OF OPERATIONS FOR THE THREE MONTHS ENDED - UNAUDITED CONSOLIDATED STATEMENTS OF OPERATIONS FOR THE THREE MONTHS ENDED - UNAUDITED CONSOLIDATED STATEMENTS OF OPERATIONS FOR THE THREE MONTHS ENDED - UNAUDITED CONSOLIDATED STATEMENTS OF OPERATIONS FOR THE THREE MONTHS ENDED - UNAUDITED CONSOLIDATED STATEMENTS OF OPERATIONS FOR THE THREE MONTHS ENDED - UNAUDITED CONSOLIDATED STATEMENTS OF OPERATIONS FOR THE THREE MONTHS ENDED - UNAUDITED CONSOLIDATED STATEMENTS OF OPERATIONS FOR THE THREE MONTHS ENDED - UNAUDITED CONSOLIDATED STATEMENTS OF OPERATIONS FOR THE THREE MONTHS ENDED - UNAUDITED (Dollars in thousands, except per share data) Q2 Q2 Q2 Q1 Q1 Q1 Q2 Q2 Q2 2016 2016 2016 2016 2016 2016 2015 2015 2015 Interest income: Loans receivable, including fees $ 59,013 $ 54,472 $ 42,801 Loans held for sale 17,429 17,429 14,106 14,106 13,522 13,522 Investment securities 3,638 3,638 3,709 3,709 2,253 2,253 Other 1,241 1,241 1,111 1,111 1,107 1,107 Total interest income 81,321 81,321 73,398 73,398 59,683 59,683 Interest expense: Deposits 11,142 11,142 10,212 10,212 8,145 8,145 Other borrowings 1,620 1,620 1,606 1,606 1,496 1,496 FHLB advances 3,716 3,716 2,268 2,268 1,799 1,799 Subordinated debt 1,685 1,685 1,685 1,685 1,685 1,685 Total interest expense 18,163 18,163 15,771 15,771 13,125 13,125 Net interest income 63,158 63,158 57,627 57,627 46,558 46,558 Provision for loan losses 786 786 1,980 1,980 9,335 9,335 Net interest income after provision for loan losses 62,372 62,372 55,647 55,647 37,223 37,223 Non-interest income: Mortgage warehouse transactional fees 3,074 3,074 2,548 2,548 2,799 2,799 Interchange and card revenue 1,890 1,890 369 369 132 132 Bank-owned life insurance 1,120 1,120 1,123 1,123 1,169 1,169 Deposit fees 787 787 255 255 247 247 Gain on sale of loans 285 285 644 644 827 827 Mortgage loans and banking income 285 285 165 165 287 287 Gain (loss) on sale of investment securities — — 26 26 (69 (69 ) Other 816 816 364 364 1,001 1,001 Total non-interest income 8,257 8,257 5,494 5,494 6,393 6,393 Non-interest expense: Salaries and employee benefits 18,107 18,107 17,263 17,263 14,448 14,448 FDIC assessments, taxes, and regulatory fees 4,435 4,435 4,030 4,030 995 995 Technology, communication and bank operations 3,854 3,854 2,643 2,643 2,838 2,838 Professional services 3,636 3,636 2,572 2,572 2,792 2,792 Occupancy 2,473 2,473 2,325 2,325 2,199 2,199 Acquisition related expenses 874 874 176 176 — — Loan workout expense (income) 487 487 418 418 (13 (13 ) Advertising and promotion 334 334 253 253 429 429 Other real estate owned expense (income) 183 183 287 287 (580 (580 ) Other 3,800 3,800 3,938 3,938 2,552 2,552 Total non-interest expense 38,183 38,183 33,905 33,905 25,660 25,660 Income before tax expense 32,446 32,446 27,236 27,236 17,956 17,956 Income tax expense 13,016 13,016 9,537 9,537 6,400 6,400 Net income 19,430 19,430 17,699 17,699 11,556 11,556 Preferred stock dividends 2,062 2,062 1,286 1,286 507 507 Net income available to common shareholders $ 17,368 $ 16,413 $ 11,049 Basic earnings per common share $ 0.64 $ 0.61 $ 0.41 Diluted earnings per common share $ 0.60 $ 0.57 $ 0.39

* Income Statement CUSTOMERS BANCORP, INC. AND SUBSIDIARIES CUSTOMERS BANCORP, INC. AND SUBSIDIARIES CUSTOMERS BANCORP, INC. AND SUBSIDIARIES CUSTOMERS BANCORP, INC. AND SUBSIDIARIES CUSTOMERS BANCORP, INC. AND SUBSIDIARIES CUSTOMERS BANCORP, INC. AND SUBSIDIARIES CUSTOMERS BANCORP, INC. AND SUBSIDIARIES CUSTOMERS BANCORP, INC. AND SUBSIDIARIES CONSOLIDATED STATEMENTS OF OPERATIONS FOR THE SIX MONTHS ENDED - UNAUDITED CONSOLIDATED STATEMENTS OF OPERATIONS FOR THE SIX MONTHS ENDED - UNAUDITED CONSOLIDATED STATEMENTS OF OPERATIONS FOR THE SIX MONTHS ENDED - UNAUDITED CONSOLIDATED STATEMENTS OF OPERATIONS FOR THE SIX MONTHS ENDED - UNAUDITED CONSOLIDATED STATEMENTS OF OPERATIONS FOR THE SIX MONTHS ENDED - UNAUDITED CONSOLIDATED STATEMENTS OF OPERATIONS FOR THE SIX MONTHS ENDED - UNAUDITED CONSOLIDATED STATEMENTS OF OPERATIONS FOR THE SIX MONTHS ENDED - UNAUDITED CONSOLIDATED STATEMENTS OF OPERATIONS FOR THE SIX MONTHS ENDED - UNAUDITED (Dollars in thousands, except per share data) June 30, June 30, June 30, June 30, June 30, June 30, 2016 2016 2016 2015 2015 2015 Interest income: Loans receivable, including fees $ 113,485 $ 85,894 Loans held for sale 31,535 31,535 24,422 24,422 Investment securities 7,347 7,347 4,616 4,616 Other 2,352 2,352 3,469 3,469 Total interest income 154,719 154,719 118,401 118,401 Interest expense: Deposits 21,356 21,356 15,671 15,671 Other borrowings 3,225 3,225 2,984 2,984 FHLB advances 5,984 5,984 3,488 3,488 Subordinated debt 3,370 3,370 3,370 3,370 Total interest expense 33,935 33,935 25,513 25,513 Net interest income 120,784 120,784 92,888 92,888 Provision for loan losses 2,766 2,766 12,299 12,299 Net interest income after provision for loan losses 118,018 118,018 80,589 80,589 Non-interest income: Mortgage warehouse transactional fees 5,622 5,622 5,072 5,072 Interchange and card revenue 2,259 2,259 262 262 Bank-owned life insurance 2,243 2,243 2,230 2,230 Deposit fees 1,042 1,042 426 426 Gain on sale of loans 929 929 2,058 2,058 Mortgage loans and banking income 450 450 438 438 Gain (loss) on sale of investment securities 26 26 (69 (69 ) Other 1,180 1,180 1,709 1,709 Total non-interest income 13,751 13,751 12,126 12,126 Non-interest expense: Salaries and employee benefits 35,370 35,370 28,400 28,400 FDIC assessments, taxes, and regulatory fees 8,465 8,465 4,273 4,273 Technology, communication and bank operations 6,496 6,496 5,369 5,369 Professional services 6,207 6,207 4,705 4,705 Occupancy 4,798 4,798 4,300 4,300 Acquisition related expenses 1,050 1,050 — — Loan workout 905 905 256 256 Advertising and promotion 587 587 776 776 Other real estate owned 470 470 304 304 Other 7,739 7,739 4,742 4,742 Total non-interest expense 72,087 72,087 53,125 53,125 Income before tax expense 59,682 59,682 39,590 39,590 Income tax expense 22,553 22,553 14,082 14,082 Net income 37,129 37,129 25,508 25,508 Preferred stock dividends 3,348 3,348 507 507 Net income available to common shareholders $ 33,781 $ 25,001 Basic earnings per common share $ 1.25 $ 0.93 Diluted earnings per common share $ 1.17 $ 0.88

* Balance Sheet

* Net Interest Margin

* Loan Composition

* Loan Composition

* Asset Quality CUSTOMERS BANCORP, INC. AND SUBSIDIARIES CUSTOMERS BANCORP, INC. AND SUBSIDIARIES CUSTOMERS BANCORP, INC. AND SUBSIDIARIES CUSTOMERS BANCORP, INC. AND SUBSIDIARIES CUSTOMERS BANCORP, INC. AND SUBSIDIARIES CUSTOMERS BANCORP, INC. AND SUBSIDIARIES CUSTOMERS BANCORP, INC. AND SUBSIDIARIES CUSTOMERS BANCORP, INC. AND SUBSIDIARIES CUSTOMERS BANCORP, INC. AND SUBSIDIARIES CUSTOMERS BANCORP, INC. AND SUBSIDIARIES CUSTOMERS BANCORP, INC. AND SUBSIDIARIES CUSTOMERS BANCORP, INC. AND SUBSIDIARIES CUSTOMERS BANCORP, INC. AND SUBSIDIARIES CUSTOMERS BANCORP, INC. AND SUBSIDIARIES CUSTOMERS BANCORP, INC. AND SUBSIDIARIES CUSTOMERS BANCORP, INC. AND SUBSIDIARIES CUSTOMERS BANCORP, INC. AND SUBSIDIARIES CUSTOMERS BANCORP, INC. AND SUBSIDIARIES CUSTOMERS BANCORP, INC. AND SUBSIDIARIES CUSTOMERS BANCORP, INC. AND SUBSIDIARIES CUSTOMERS BANCORP, INC. AND SUBSIDIARIES CUSTOMERS BANCORP, INC. AND SUBSIDIARIES CUSTOMERS BANCORP, INC. AND SUBSIDIARIES CUSTOMERS BANCORP, INC. AND SUBSIDIARIES CUSTOMERS BANCORP, INC. AND SUBSIDIARIES CUSTOMERS BANCORP, INC. AND SUBSIDIARIES CUSTOMERS BANCORP, INC. AND SUBSIDIARIES CUSTOMERS BANCORP, INC. AND SUBSIDIARIES CUSTOMERS BANCORP, INC. AND SUBSIDIARIES CUSTOMERS BANCORP, INC. AND SUBSIDIARIES CUSTOMERS BANCORP, INC. AND SUBSIDIARIES CUSTOMERS BANCORP, INC. AND SUBSIDIARIES CUSTOMERS BANCORP, INC. AND SUBSIDIARIES CUSTOMERS BANCORP, INC. AND SUBSIDIARIES CUSTOMERS BANCORP, INC. AND SUBSIDIARIES CUSTOMERS BANCORP, INC. AND SUBSIDIARIES CUSTOMERS BANCORP, INC. AND SUBSIDIARIES CUSTOMERS BANCORP, INC. AND SUBSIDIARIES CUSTOMERS BANCORP, INC. AND SUBSIDIARIES CUSTOMERS BANCORP, INC. AND SUBSIDIARIES ASSET QUALITY - UNAUDITED ASSET QUALITY - UNAUDITED ASSET QUALITY - UNAUDITED ASSET QUALITY - UNAUDITED ASSET QUALITY - UNAUDITED ASSET QUALITY - UNAUDITED ASSET QUALITY - UNAUDITED ASSET QUALITY - UNAUDITED ASSET QUALITY - UNAUDITED ASSET QUALITY - UNAUDITED ASSET QUALITY - UNAUDITED ASSET QUALITY - UNAUDITED ASSET QUALITY - UNAUDITED ASSET QUALITY - UNAUDITED (Dollars in thousands) As of June 30, 2016 As of June 30, 2016 As of June 30, 2016 As of June 30, 2016 As of June 30, 2016 As of June 30, 2016 As of June 30, 2016 As of June 30, 2016 As of June 30, 2016 As of June 30, 2016 As of June 30, 2016 As of June 30, 2016 As of June 30, 2016 As of December 31, 2015 As of December 31, 2015 As of December 31, 2015 As of December 31, 2015 As of December 31, 2015 As of December 31, 2015 As of December 31, 2015 As of December 31, 2015 As of December 31, 2015 As of December 31, 2015 As of December 31, 2015 As of December 31, 2015 As of December 31, 2015 As of June 30, 2015 As of June 30, 2015 As of June 30, 2015 As of June 30, 2015 As of June 30, 2015 As of June 30, 2015 As of June 30, 2015 As of June 30, 2015 As of June 30, 2015 As of June 30, 2015 As of June 30, 2015 As of June 30, 2015 As of June 30, 2015 Total Loans Total Loans Total Loans Non Accrual /NPLs Non Accrual /NPLs Non Accrual /NPLs Total Credit Reserves Total Credit Reserves Total Credit Reserves NPLs / Total Loans NPLs / Total Loans Total Reserves to Total NPLs Total Reserves to Total NPLs Total Loans Total Loans Total Loans Non Accrual /NPLs Non Accrual /NPLs Non Accrual /NPLs Total Credit Reserves Total Credit Reserves Total Credit Reserves NPLs / Total Loans NPLs / Total Loans Total Reserves to Total NPLs Total Reserves to Total NPLs Total Loans Total Loans Total Loans Non Accrual /NPLs Non Accrual /NPLs Non Accrual /NPLs Total Credit Reserves Total Credit Reserves Total Credit Reserves NPLs / Total Loans NPLs / Total Loans Total Reserves to Total NPLs Total Reserves to Total NPLs Loan Type Total Loans Total Loans Total Loans Non Accrual /NPLs Non Accrual /NPLs Non Accrual /NPLs Total Credit Reserves Total Credit Reserves Total Credit Reserves NPLs / Total Loans NPLs / Total Loans Total Reserves to Total NPLs Total Reserves to Total NPLs Total Loans Total Loans Total Loans Non Accrual /NPLs Non Accrual /NPLs Non Accrual /NPLs Total Credit Reserves Total Credit Reserves Total Credit Reserves NPLs / Total Loans NPLs / Total Loans Total Reserves to Total NPLs Total Reserves to Total NPLs Total Loans Total Loans Total Loans Non Accrual /NPLs Non Accrual /NPLs Non Accrual /NPLs Total Credit Reserves Total Credit Reserves Total Credit Reserves NPLs / Total Loans NPLs / Total Loans Total Reserves to Total NPLs Total Reserves to Total NPLs Originated Loans Multi-Family $ 3,303,077 $ — $ 12,368 — % —% —% $ 2,903,814 $ — $ 12,016 —% —% —% —% $ 2,232,273 $ — $ 8,734 — % — % Commercial & Industrial (1) 1,082,109 1,082,109 6,605 6,605 10,999 10,999 0.61 % 166.53 % 990,621 990,621 2,760 2,760 8,864 8,864 0.28 % 321.16 % 792,701 792,701 1,173 1,173 13,476 13,476 0.15 % 1,148.85 % Commercial Real Estate- Non-Owner Occupied 1,092,851 1,092,851 — — 4,390 4,390 — % — % 906,544 906,544 788 788 3,706 3,706 0.09 % 470.30 % 840,922 840,922 271 271 3,335 3,335 0.03 % 1,230.63 % Residential 119,489 119,489 32 32 2,240 2,240 0.03 % 7,000.00 % 113,858 113,858 32 32 1,992 1,992 0.03 % 6,225.00 % 105,332 105,332 9 9 1,722 1,722 0.01 % 19,133.33 % Construction 99,381 99,381 — — 1,209 1,209 — % —% —% 87,006 87,006 — — 1,074 1,074 — % —% —% 68,073 68,073 — — 844 844 — % — % Other consumer 545 545 — — 8 8 — % —% —% 712 712 — — 9 9 — % —% —% 890 890 — — 16 16 — % — % Total Originated Loans 5,697,452 5,697,452 6,637 6,637 31,214 31,214 0.12 % 470.30 % 5,002,555 5,002,555 3,580 3,580 27,661 27,661 0.07 % 772.65 % 4,040,191 4,040,191 1,453 1,453 28,127 28,127 0.04 % 1,935.79 % Loans Acquired Bank Acquisitions 192,173 192,173 6,172 6,172 6,445 6,445 3.21 % 104.42 % 206,971 206,971 4,743 4,743 7,492 7,492 2.29 % 157.96 % 184,326 184,326 6,439 6,439 9,049 9,049 3.49 % 140.53 % Loan Purchases 224,649 224,649 1,818 1,818 1,684 1,684 0.81 % 92.63 % 243,619 243,619 2,448 2,448 1,653 1,653 1.00 % 67.52 % 299,378 299,378 2,664 2,664 1,871 1,871 0.89 % 70.23 % Total Acquired Loans 416,822 416,822 7,990 7,990 8,129 8,129 1.92 % 101.74 % 450,590 450,590 7,191 7,191 9,145 9,145 1.60 % 127.17 % 483,704 483,704 9,103 9,103 10,920 10,920 1.88 % 119.96 % Deferred costs and unamortized premiums, net 302 302 — — — — — % —% —% 334 334 — — — — —% —% —% —% 930 930 — — — — — % — % Total Loans Held for Investment 6,114,576 6,114,576 14,627 14,627 39,343 39,343 0.24 % 268.98 % 5,453,479 5,453,479 10,771 10,771 36,806 36,806 0.20 % 341.71 % 4,524,825 4,524,825 10,556 10,556 39,047 39,047 0.23 % 369.90 % Total Loans Held for Sale 2,301,821 2,301,821 — — — — — % —% —% 1,797,064 1,797,064 — — — — —% —% — % 2,030,348 2,030,348 — — — — — % — % Total Portfolio $ 8,416,397 $ 14,627 $ 39,343 0.17 % 268.98 % $ 7,250,543 $ 10,771 $ 36,806 0.15 % 341.71 % $ 6,555,173 $ 10,556 $ 39,047 0.16 % 369.90 % (1) Commercial & industrial loans, including owner occupied commercial real estate. (1) Commercial & industrial loans, including owner occupied commercial real estate. (1) Commercial & industrial loans, including owner occupied commercial real estate. (1) Commercial & industrial loans, including owner occupied commercial real estate. (1) Commercial & industrial loans, including owner occupied commercial real estate. (1) Commercial & industrial loans, including owner occupied commercial real estate. (1) Commercial & industrial loans, including owner occupied commercial real estate. (1) Commercial & industrial loans, including owner occupied commercial real estate. (1) Commercial & industrial loans, including owner occupied commercial real estate. (1) Commercial & industrial loans, including owner occupied commercial real estate. (1) Commercial & industrial loans, including owner occupied commercial real estate. (1) Commercial & industrial loans, including owner occupied commercial real estate. (1) Commercial & industrial loans, including owner occupied commercial real estate. (1) Commercial & industrial loans, including owner occupied commercial real estate. (1) Commercial & industrial loans, including owner occupied commercial real estate. (1) Commercial & industrial loans, including owner occupied commercial real estate. (1) Commercial & industrial loans, including owner occupied commercial real estate. (1) Commercial & industrial loans, including owner occupied commercial real estate. (1) Commercial & industrial loans, including owner occupied commercial real estate. (1) Commercial & industrial loans, including owner occupied commercial real estate. (1) Commercial & industrial loans, including owner occupied commercial real estate. (1) Commercial & industrial loans, including owner occupied commercial real estate. (1) Commercial & industrial loans, including owner occupied commercial real estate.

* Net Charge Offs