Attached files
| file | filename |
|---|---|
| 8-K - FORM 8-K - TRANSATLANTIC PETROLEUM LTD. | d194122d8k.htm |
2016 Annual General Meeting Exhibit 99.1
FORWARD LOOKING STATEMENTS Outlooks, projections, estimates, targets and business plans in this presentation or any related subsequent discussions are forward-looking statements. Actual future results, including TransAtlantic Petroleum Ltd.’s own production growth and mix; financial results; the amount and mix of capital expenditures; resource additions and recoveries; finding and development costs; project and drilling plans, timing, costs, and capacities; revenue enhancements and cost efficiencies; industry margins; margin enhancements and integration benefits; and the impact of technology could differ materially due to a number of factors. These include market prices for natural gas, natural gas liquids and oil products; estimates of reserves and economic assumptions; the ability to produce and transport natural gas, natural gas liquids and oil; the results of exploration and development drilling and related activities; economic conditions in the countries and provinces in which we carry on business, especially economic slowdowns; actions by governmental authorities, receipt of required approvals, increases in taxes, legislative and regulatory initiatives relating to fracture stimulation activities, changes in environmental and other regulations, and renegotiations of contracts; political uncertainty, including actions by insurgent groups or other conflict; the negotiation and closing of material contracts; shortages of drilling rigs, equipment or oilfield services; and other factors discussed here and under the heading “Risk Factors" in our Annual Report on Form 10-K for the year ended December 31, 2015, which is available on our website at www.transatlanticpetroleum.com and on www.sec.gov. See also TransAtlantic’s audited financial statements and the accompanying management discussion and analysis. Forward-looking statements are based on management’s knowledge and reasonable expectations on the date hereof, and we assume no duty to update these statements as of any future date. The information set forth in this presentation does not constitute an offer, solicitation or recommendation to sell or an offer to buy any securities of the Company. The information published herein is provided for informational purposes only. The Company makes no representation that the information and opinions expressed herein are accurate, complete or current. The information contained herein is current as of the date hereof, but may become outdated or subsequently may change. Nothing contained herein constitutes financial, legal, tax, or other advice. The SEC has generally permitted oil and gas companies, in their filings with the SEC, to disclose only proved reserves that a company has demonstrated by actual production or conclusive formation tests to be economically and legally producible under existing economic and operating conditions. We may use the terms “estimated ultimate recovery,” “EUR,” “probable,” “possible,” and “non-proven” reserves, “prospective resources” or “upside” or other descriptions of volumes of resources or reserves potentially recoverable through additional drilling or recovery techniques that the SEC’s guidelines may prohibit us from including in filings with the SEC. These estimates are by their nature more speculative than estimates of proved reserves and accordingly are subject to substantially greater risk of actually being realized by the Company. There is no certainty that any portion of estimated prospective resources will be discovered. If discovered, there is no certainty that it will be commercially viable to produce any portion of the estimated prospective resources. Note on Adjusted EBITDAX: Adjusted EBITDAX is a non-GAAP financial measure that represents earnings from continuing operations before income taxes, interest, depreciation, depletion, amortization, impairment, abandonment, and exploration expenses, unrealized derivative gains and losses, foreign exchange gains and losses, non-cash share-based compensation expense and significant non-recurring expenses. The Company believes Adjusted EBITDAX assists management and investors in comparing the Company’s performance and ability to fund capital expenditures and working capital requirements on a consistent basis without regard to depreciation, depletion and amortization and impairment of oil and natural gas properties and exploration expenses, which can vary significantly from period to period. In addition, management uses Adjusted EBITDAX as a financial measure to evaluate the Company’s operating performance. Adjusted EBITDAX is also widely used by investors and rating agencies. Adjusted EBITDAX is not a measure of financial performance under GAAP. Accordingly, it should not be considered as a substitute for net income, income from operations, or cash flow provided by operating activities prepared in accordance with GAAP. Net income, income from operations, or cash flow provided by operating activities may vary materially from Adjusted EBITDAX. Investors should carefully consider the specific items included in the computation of Adjusted EBITDAX. The Company has disclosed Adjusted EBITDAX to permit a comparative analysis of its operating performance and debt servicing ability relative to other companies. Note on Possible Reserves: possible reserves are those additional reserves that are less certain to be recovered than probable reserves. There is a 10% probability that the quantities actually recovered will equal or exceed the sum of proved plus probable plus possible reserves. Note on BOE: BOE (barrel of oil equivalent) is derived by converting natural gas to oil in the ratio of six thousand cubic feet (MCF) of natural gas to one barrel (bbl) of oil. BOE may be misleading, particularly if used in isolation. A BOE conversion ratio of 6 Mcf:1 bbl is based on an energy equivalency conversion method primarily applicable at the burner tip and does not represent a value equivalency at the wellhead.
In response to the steep drop in oil price over the past 18+ months, TransAtlantic has aggressively reduced costs, significantly paid down debt and divested Albanian assets and liabilities SUMMARY
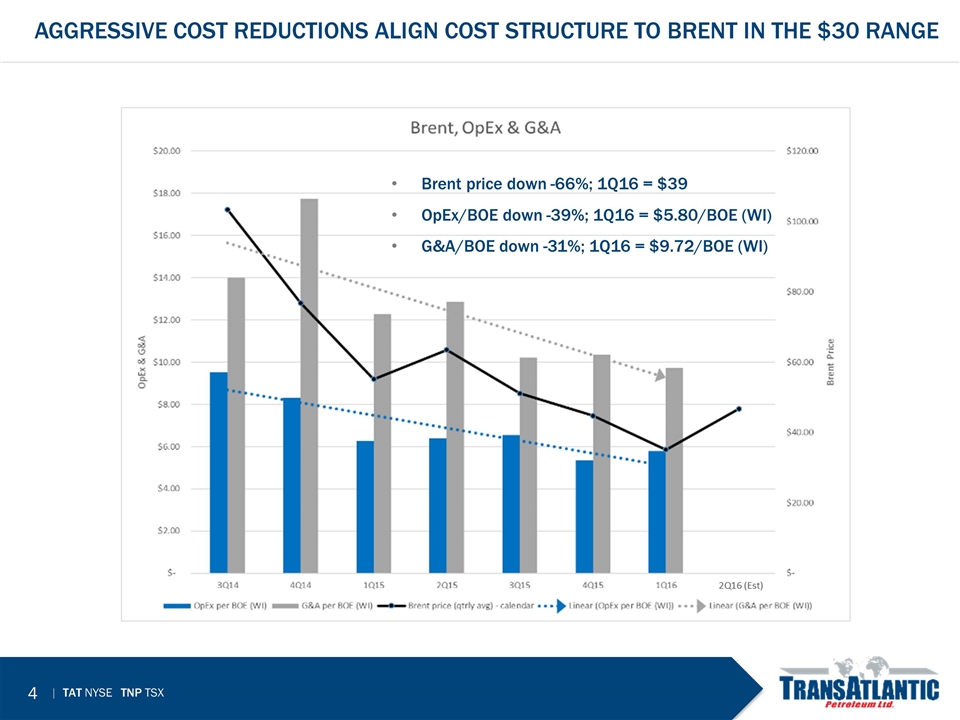
Aggressive Cost reductions align cost structure to Brent in the $30 range Brent price down -66%; 1Q16 = $39 OpEx/BOE down -39%; 1Q16 = $5.80/BOE (WI) G&A/BOE down -31%; 1Q16 = $9.72/BOE (WI)
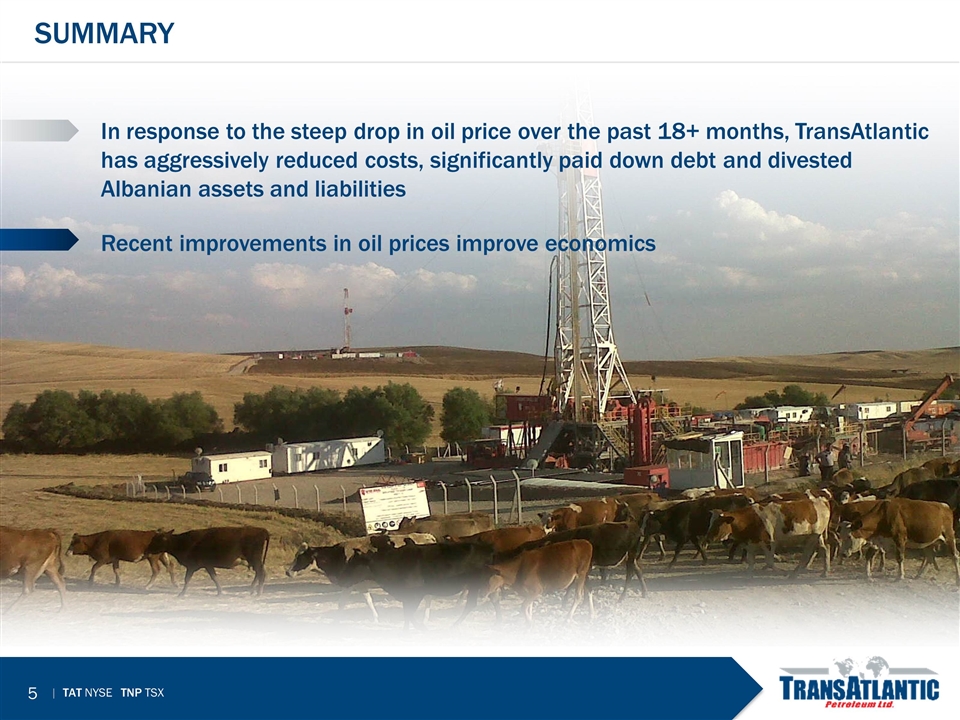
In response to the steep drop in oil price over the past 18+ months, TransAtlantic has aggressively reduced costs, significantly paid down debt and divested Albanian assets and liabilities Recent improvements in oil prices improve economics SUMMARY
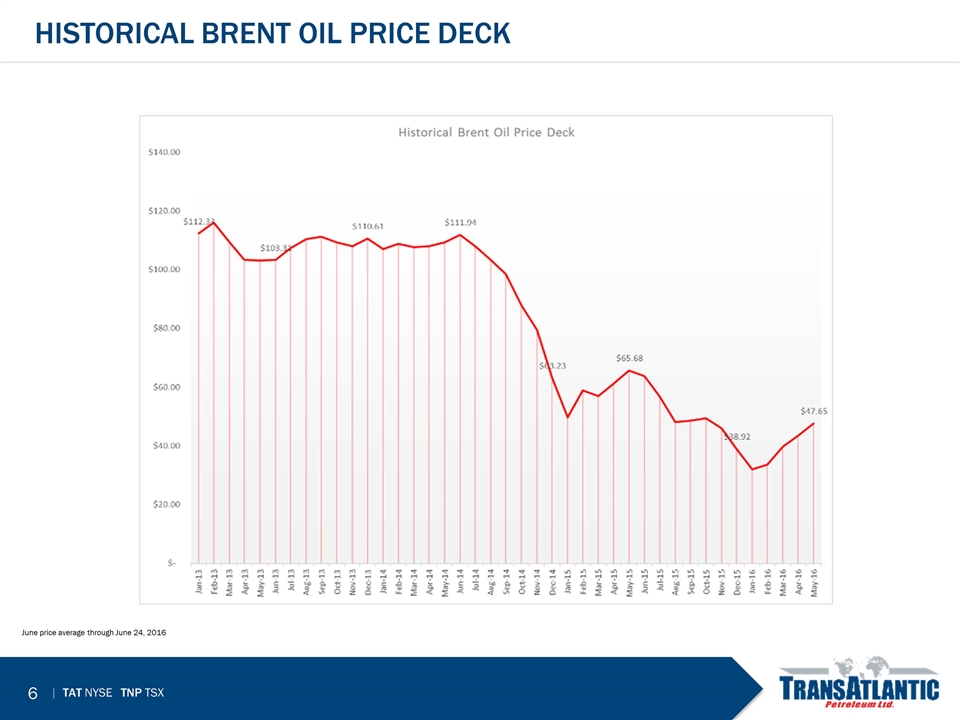
Historical brent OIL Price deck June price average through June 24, 2016
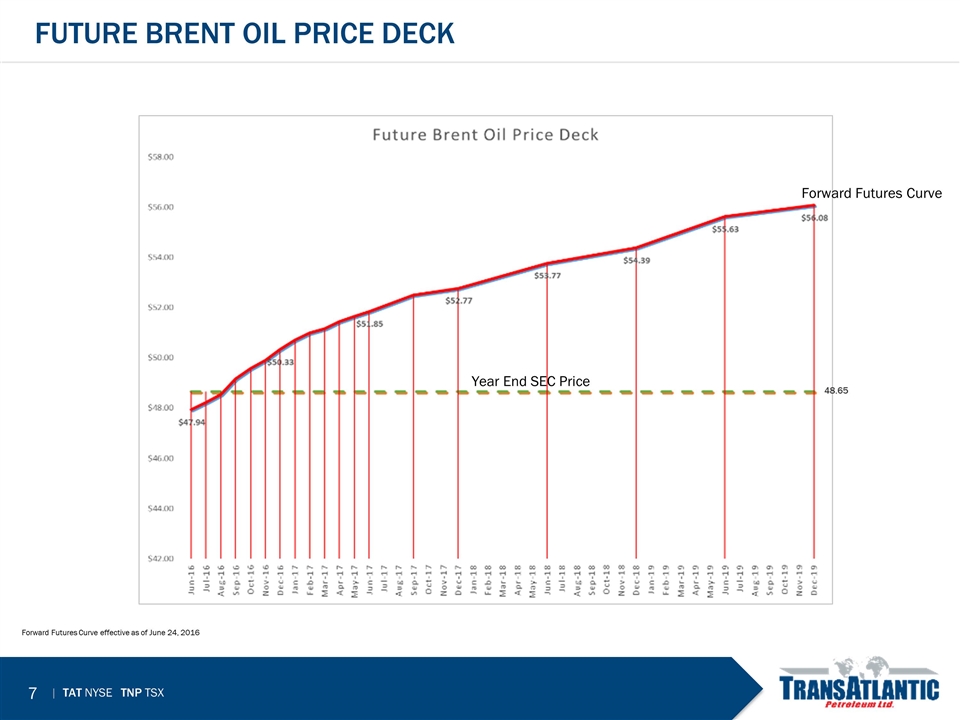
Future brent OIL Price deck Forward Futures Curve effective as of June 24, 2016 Forward Futures Curve Year End SEC Price 48.65
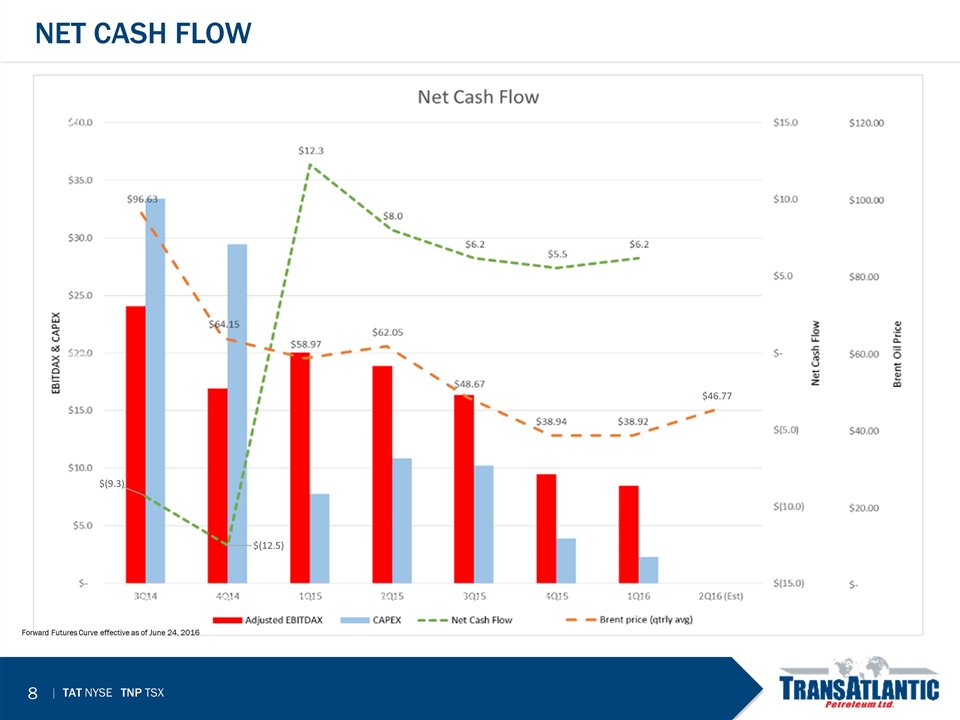
$46.77 $(9.3) $(12.5) NET Cash flow Forward Futures Curve effective as of June 24, 2016
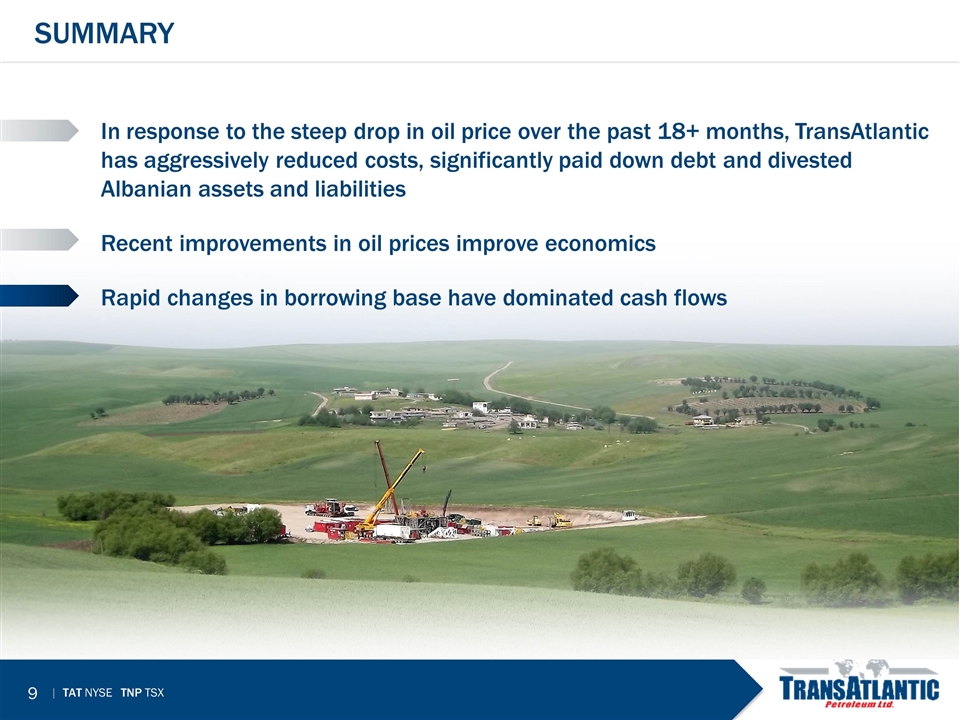
In response to the steep drop in oil price over the past 18+ months, TransAtlantic has aggressively reduced costs, significantly paid down debt and divested Albanian assets and liabilities Recent improvements in oil prices improve economics Rapid changes in borrowing base have dominated cash flows SUMMARY
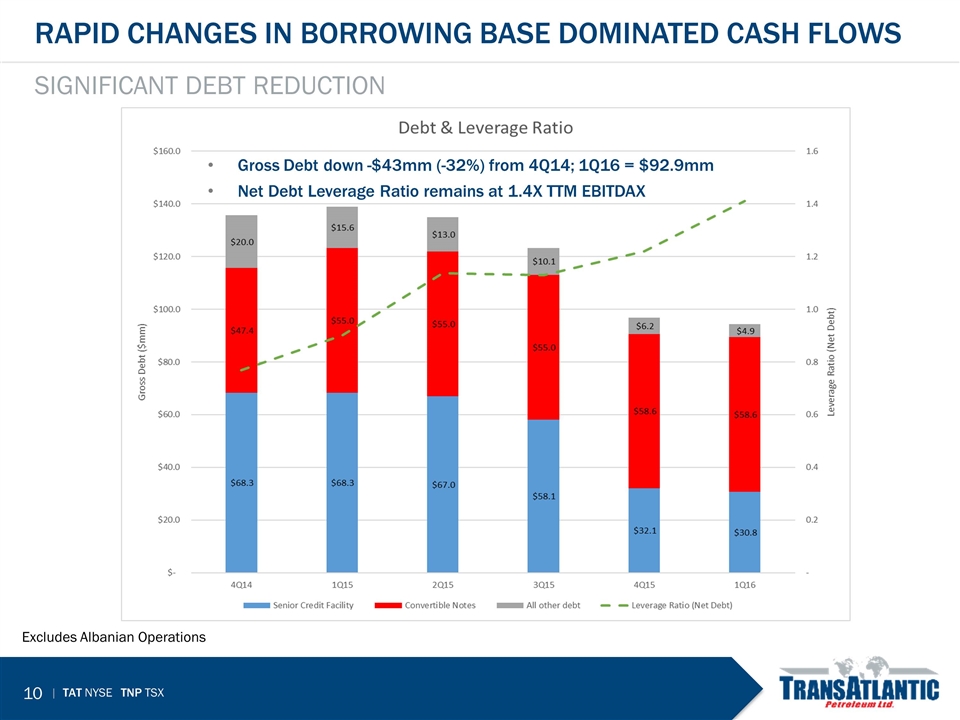
Rapid Changes in Borrowing base dominated cash flows Significant debt reduction Excludes Albanian Operations Gross Debt down -$43mm (-32%) from 4Q14; 1Q16 = $92.9mm Net Debt Leverage Ratio remains at 1.4X TTM EBITDAX
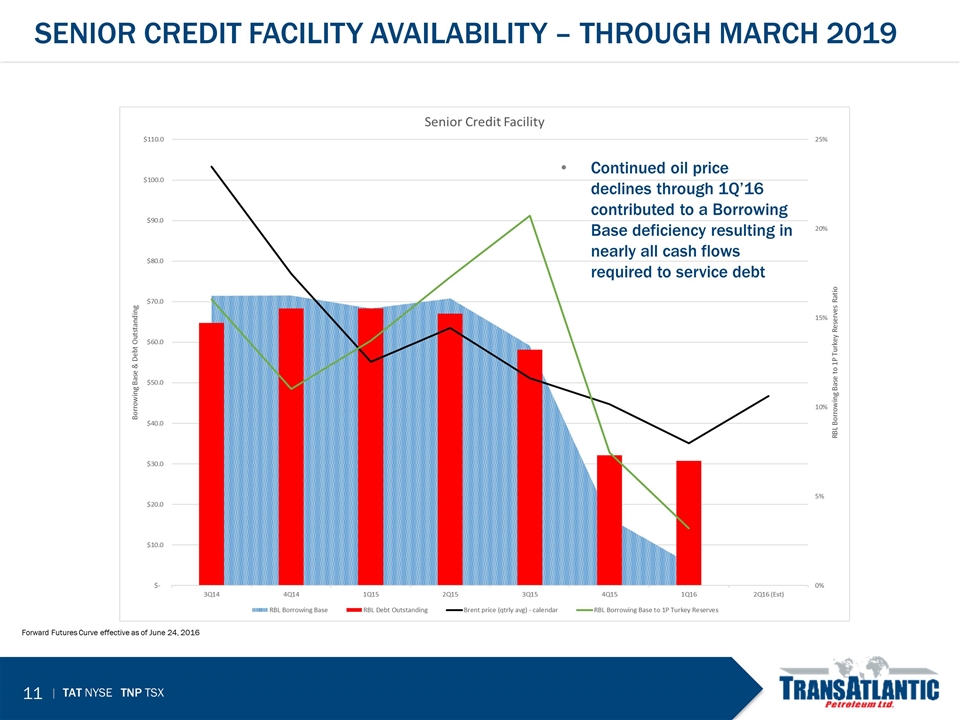
senior credit facility availability – Through March 2019 Forward Futures Curve effective as of June 24, 2016 Continued oil price declines through 1Q’16 contributed to a Borrowing Base deficiency resulting in nearly all cash flows required to service debt
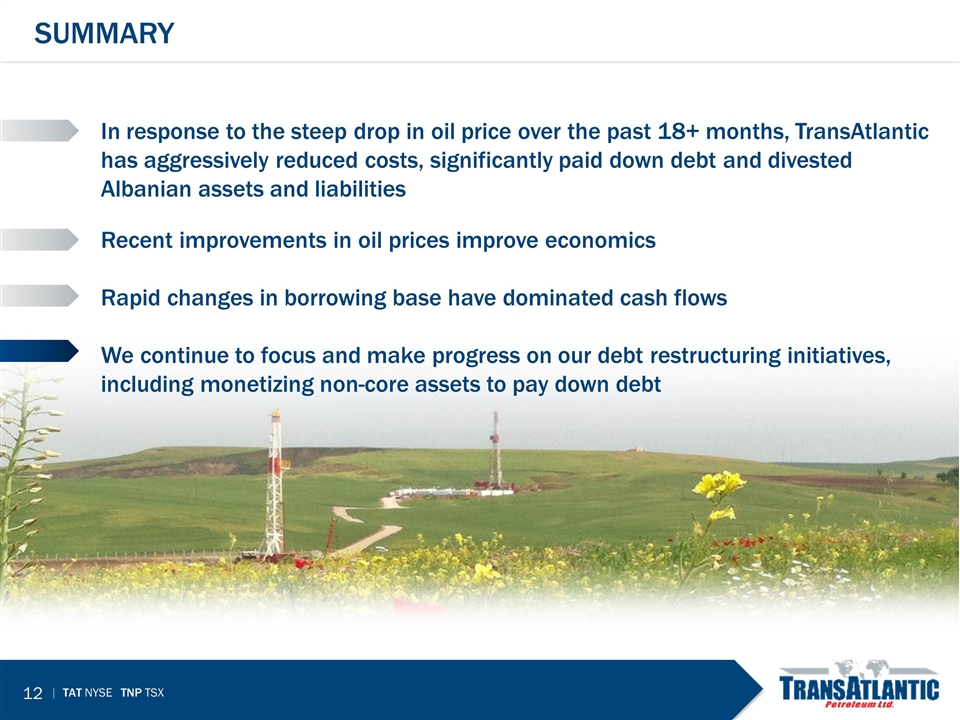
In response to the steep drop in oil price over the past 18+ months, TransAtlantic has aggressively reduced costs, significantly paid down debt and divested Albanian assets and liabilities Recent improvements in oil prices improve economics Rapid changes in borrowing base have dominated cash flows We continue to focus and make progress on our debt restructuring initiatives, including monetizing non-core assets to pay down debt SUMMARY
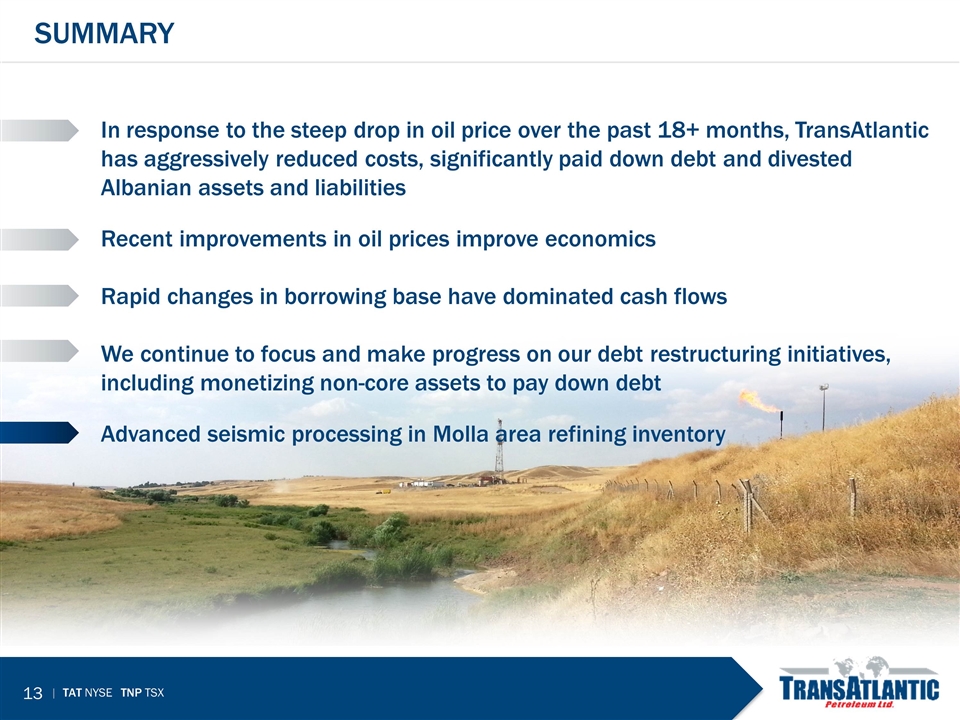
In response to the steep drop in oil price over the past 18+ months, TransAtlantic has aggressively reduced costs, significantly paid down debt and divested Albanian assets and liabilities Recent improvements in oil prices improve economics Rapid changes in borrowing base have dominated cash flows We continue to focus and make progress on our debt restructuring initiatives, including monetizing non-core assets to pay down debt Advanced seismic processing in Molla area refining inventory SUMMARY
TransAtlantic Petroleum’s lease position in SE Turkey is very promising. Recent advances in seismic processing has led to an improved understanding of the geology of the region. Reprocessing of the 3D seismic is enabling TransAtlantic: to convert the data from time to depth for more accurate mapping define major unconformities identify changes in lithology and rock characteristics more accurately pick faults and the displacement along the faults. As a result, TransAtlantic currently has identified numerous leads and prospects in the Mardin, Hazro, Dadas, and Bedinan sections. SE Turkey
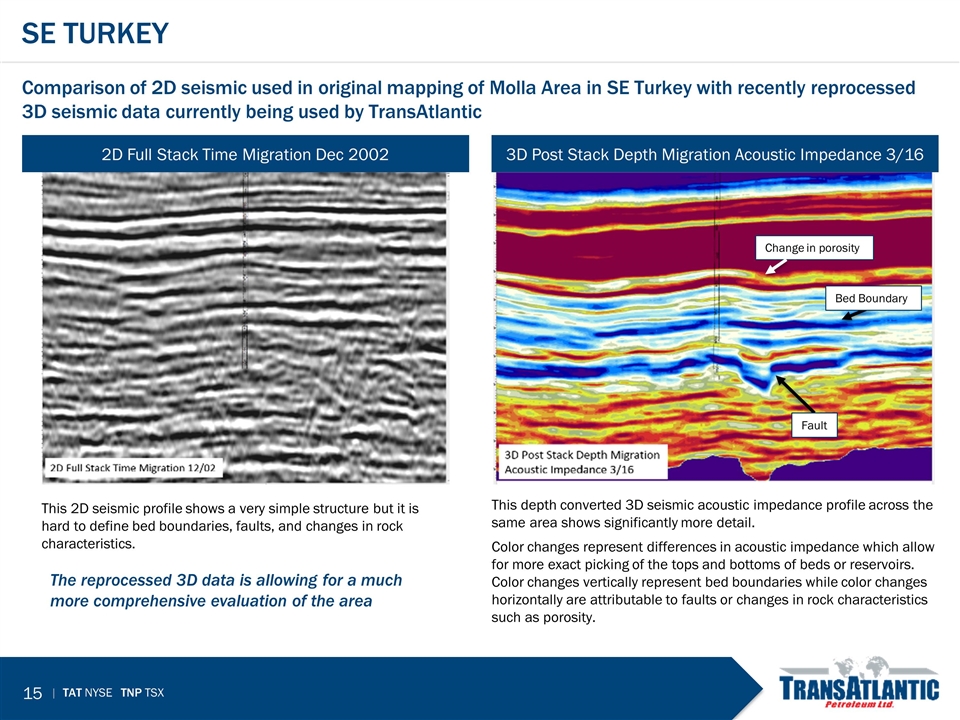
Change in porosity Fault Bed Boundary Se turkey Comparison of 2D seismic used in original mapping of Molla Area in SE Turkey with recently reprocessed 3D seismic data currently being used by TransAtlantic 2D Full Stack Time Migration Dec 2002 This 2D seismic profile shows a very simple structure but it is hard to define bed boundaries, faults, and changes in rock characteristics. 3D Post Stack Depth Migration Acoustic Impedance 3/16 This depth converted 3D seismic acoustic impedance profile across the same area shows significantly more detail. Color changes represent differences in acoustic impedance which allow for more exact picking of the tops and bottoms of beds or reservoirs. Color changes vertically represent bed boundaries while color changes horizontally are attributable to faults or changes in rock characteristics such as porosity. The reprocessed 3D data is allowing for a much more comprehensive evaluation of the area
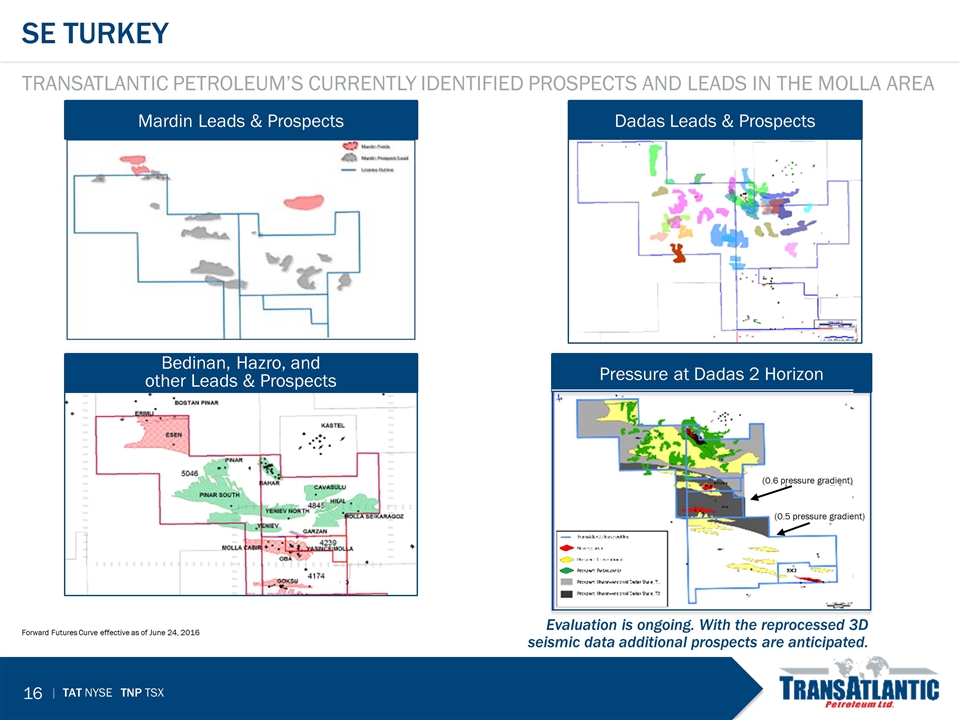
SE turkey TransAtlantic Petroleum’s currently identified prospects and leads in the Molla Area Forward Futures Curve effective as of June 24, 2016 Mardin Leads & Prospects Bedinan, Hazro, and other Leads & Prospects Dadas Leads & Prospects Evaluation is ongoing. With the reprocessed 3D seismic data additional prospects are anticipated. Pressure at Dadas 2 Horizon (0.6 pressure gradient) (0.5 pressure gradient)
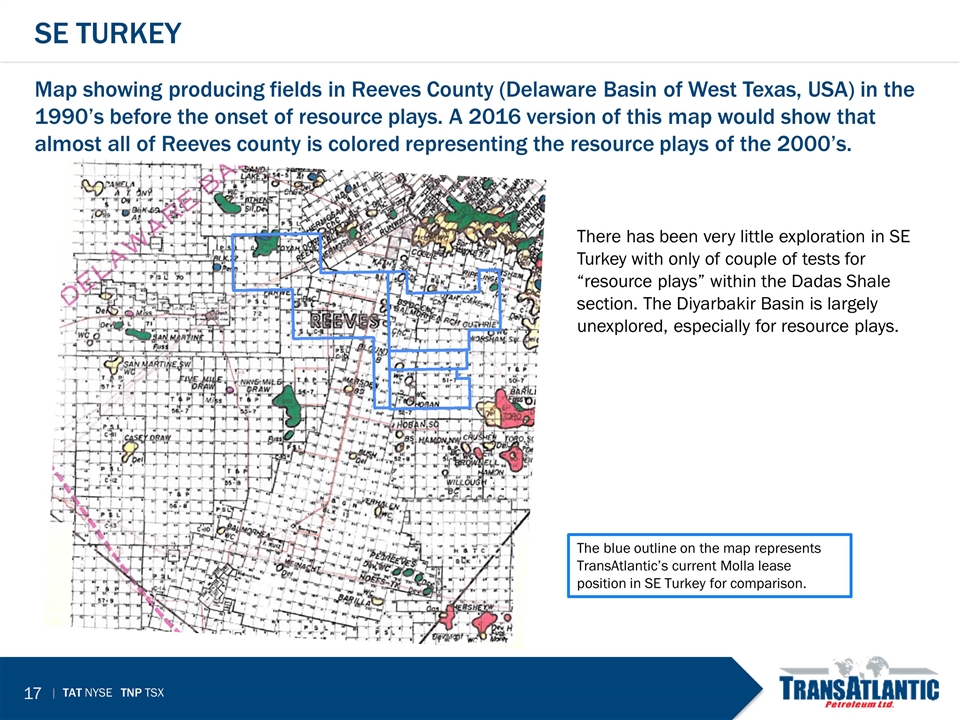
SE Turkey Map showing producing fields in Reeves County (Delaware Basin of West Texas, USA) in the 1990’s before the onset of resource plays. A 2016 version of this map would show that almost all of Reeves county is colored representing the resource plays of the 2000’s. The blue outline on the map represents TransAtlantic’s current Molla lease position in SE Turkey for comparison. There has been very little exploration in SE Turkey with only of couple of tests for “resource plays” within the Dadas Shale section. The Diyarbakir Basin is largely unexplored, especially for resource plays.
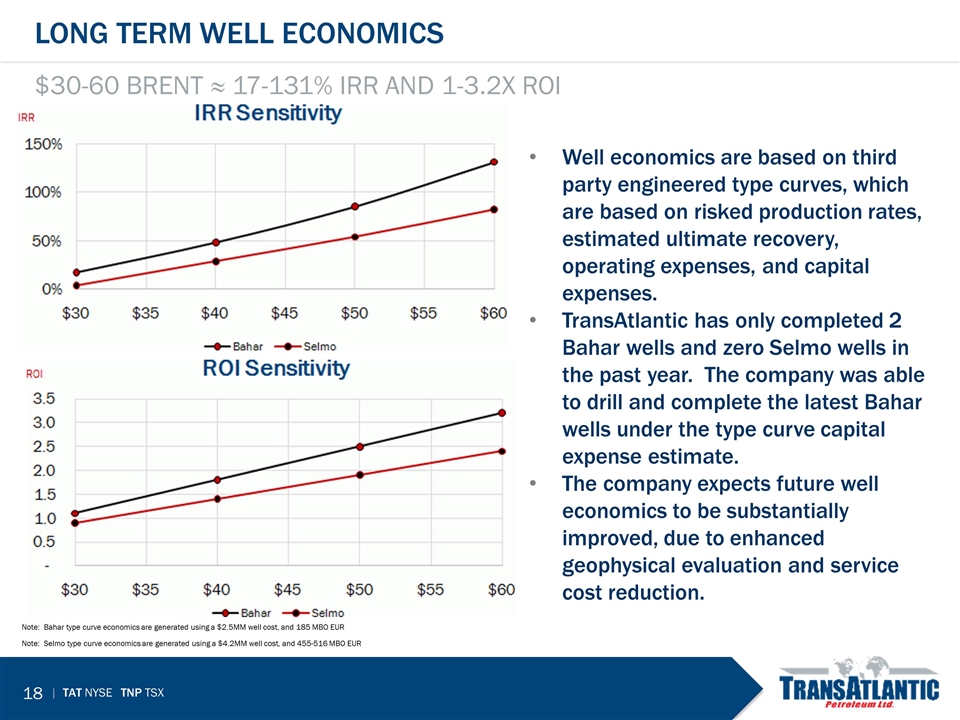
Long term well economics $30-60 Brent ≈ 17-131% IRR and 1-3.2x ROI Note: Bahar type curve economics are generated using a $2.5MM well cost, and 185 MBO EUR Note: Selmo type curve economics are generated using a $4.2MM well cost, and 455-516 MBO EUR Well economics are based on third party engineered type curves, which are based on risked production rates, estimated ultimate recovery, operating expenses, and capital expenses. TransAtlantic has only completed 2 Bahar wells and zero Selmo wells in the past year. The company was able to drill and complete the latest Bahar wells under the type curve capital expense estimate. The company expects future well economics to be substantially improved, due to enhanced geophysical evaluation and service cost reduction.
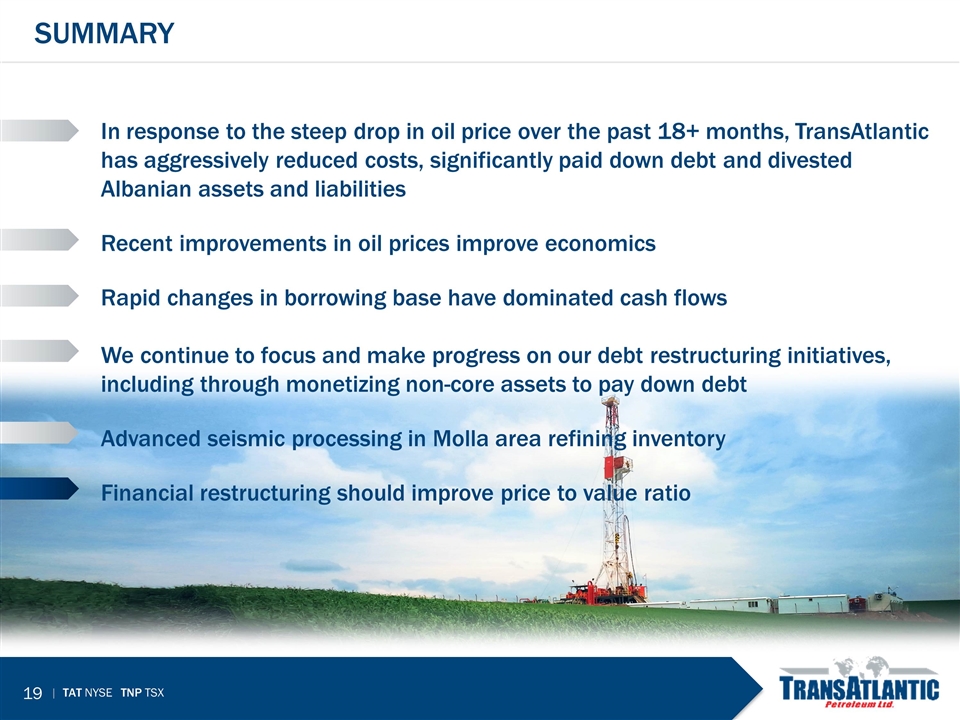
In response to the steep drop in oil price over the past 18+ months, TransAtlantic has aggressively reduced costs, significantly paid down debt and divested Albanian assets and liabilities Recent improvements in oil prices improve economics Rapid changes in borrowing base have dominated cash flows We continue to focus and make progress on our debt restructuring initiatives, including through monetizing non-core assets to pay down debt Advanced seismic processing in Molla area refining inventory Financial restructuring should improve price to value ratio SUMMARY
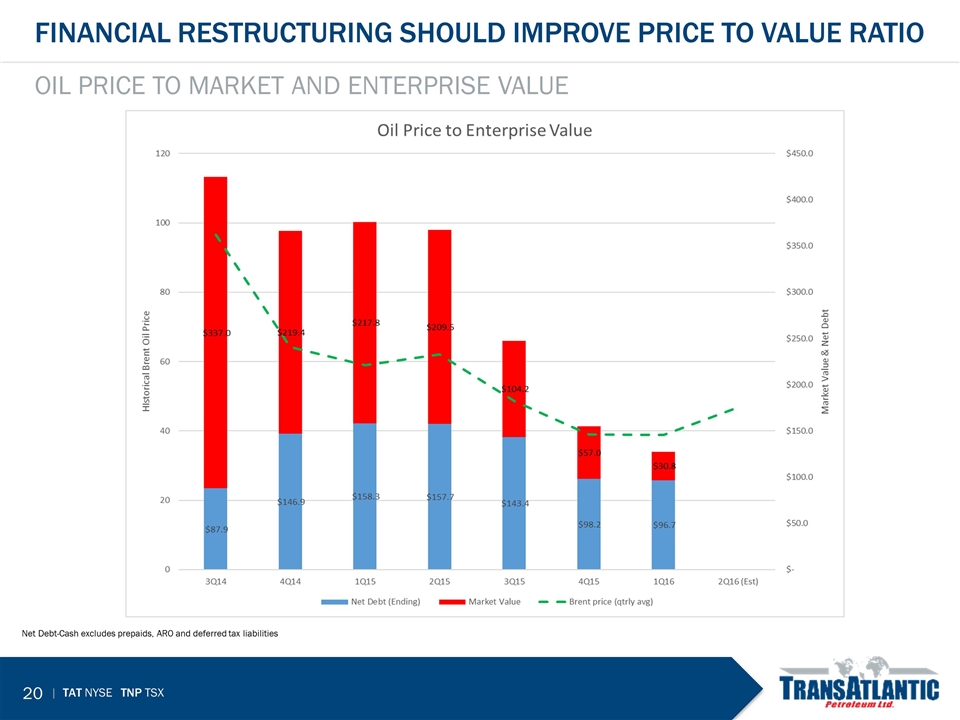
Oil price to market and enterprise value Net Debt-Cash excludes prepaids, ARO and deferred tax liabilities Financial restructuring should improve price to value ratio
In response to the steep drop in oil price over the past 18+ months, TransAtlantic has aggressively reduced costs, significantly paid down debt and divested Albanian assets and liabilities Recent improvements in oil prices improve economics Rapid changes in borrowing base have dominated cash flows We continue to focus and make progress on our debt restructuring initiatives, including through monetizing non-core assets to pay down debt Advanced seismic processing in Molla area refining inventory Financial restructuring should improve price to value ratio Questions SUMMARY
