Attached files
| file | filename |
|---|---|
| EX-99.1 - EX-99.1 - NEWFIELD EXPLORATION CO /DE/ | a16-13835_1ex99d1.htm |
| 8-K - 8-K - NEWFIELD EXPLORATION CO /DE/ | a16-13835_18k.htm |
Exhibit 99.2
@NFX June 21, 2016
2Q16e average Anadarko Basin net production >83,000 boepd Recent eastern STACK SXL wells tracking in-line with 950 Mboe type curve 2 Recent “best-in-class” STACK SXL well costs ($6.2 mm3) Strong 2Q16e results highlight superior execution Advancing the learning curve in the Anadarko Basin Superior execution Raised 2Q16e total Company production guidance to ~15.2 Mmboe Raised 2Q16e Domestic production guidance to ~13.6 Mmboe Raised 2Q16e International production guidance to ~1.6 Mmboe 2 1 Pro forma for anticipated closing of recent announced acquisition 2 EUR refers to potential recoverable oil and natural gas hydrocarbon quantities with ethane processing and may not be reflective of SEC proved reserves. Actual quantities that may be recovered could vary significantly 3 D&C includes gross drilling, completion, artificial lift and facilities costs Announced strategic STACK acquisition Expands industry-leading STACK acreage footprint to ~265,000 net acres (~50% avg. WI) 1 Significant overlap with NFX legacy acreage More than 90% of the acreage to be acquired is held-by-production
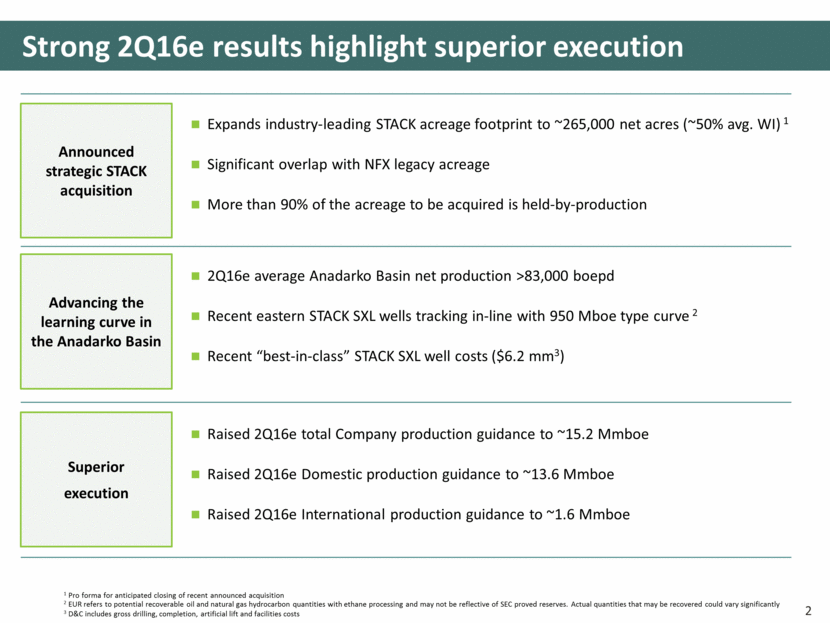
Anadarko Basin key messages Newfield acreage Meramec Woodford SCOOP STACK Grew 2Q16e average net production to >83,000 boepd 56% of estimated total domestic production Drilling remains focused on HBP “New” eastern STACK SXL results tracking in-line with 950 Mboe type curve2 4 wells average IP24 rate: 1,213 boepd (87% liquids) “New best-in-class” STACK SXL well drilled in 8.3 days for $6.2MM, including facilities 1 Expect to enter full-field development in 2017 3 1 Gross completed well cost includes gross drilling, completion, artificial lift and facilities costs 2 EUR refers to potential recoverable oil and natural gas hydrocarbon quantities with ethane processing and may not be reflective of SEC proved reserves. Actual quantities that may be recovered could vary significantly
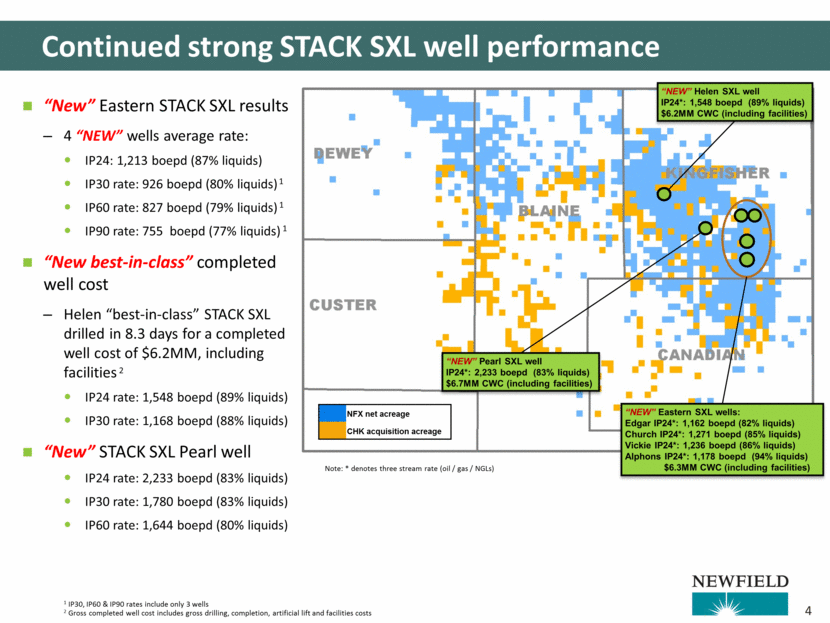
Continued strong STACK SXL well performance “NEW” Pearl SXL well IP24*: 2,233 boepd (83% liquids) $6.7MM CWC (including facilities) “NEW” Helen SXL well IP24*: 1,548 boepd (89% liquids) $6.2MM CWC (including facilities) Note: * denotes three stream rate (oil / gas / NGLs) “NEW” Eastern SXL wells: Edgar IP24*: 1,162 boepd (82% liquids) Church IP24*: 1,271 boepd (85% liquids) Vickie IP24*: 1,236 boepd (86% liquids) Alphons IP24*: 1,178 boepd (94% liquids) $6.3MM CWC (including facilities) “New” Eastern STACK SXL results 4 “NEW” wells average rate: IP24: 1,213 boepd (87% liquids) IP30 rate: 926 boepd (80% liquids) 1 IP60 rate: 827 boepd (79% liquids) 1 IP90 rate: 755 boepd (77% liquids) 1 “New best-in-class” completed well cost Helen “best-in-class” STACK SXL drilled in 8.3 days for a completed well cost of $6.2MM, including facilities 2 IP24 rate: 1,548 boepd (89% liquids) IP30 rate: 1,168 boepd (88% liquids) “New” STACK SXL Pearl well IP24 rate: 2,233 boepd (83% liquids) IP30 rate: 1,780 boepd (83% liquids) IP60 rate: 1,644 boepd (80% liquids) 1 IP30, IP60 & IP90 rates include only 3 wells 2 Gross completed well cost includes gross drilling, completion, artificial lift and facilities costs 4 NFX net acreage CHK acquisition acreage
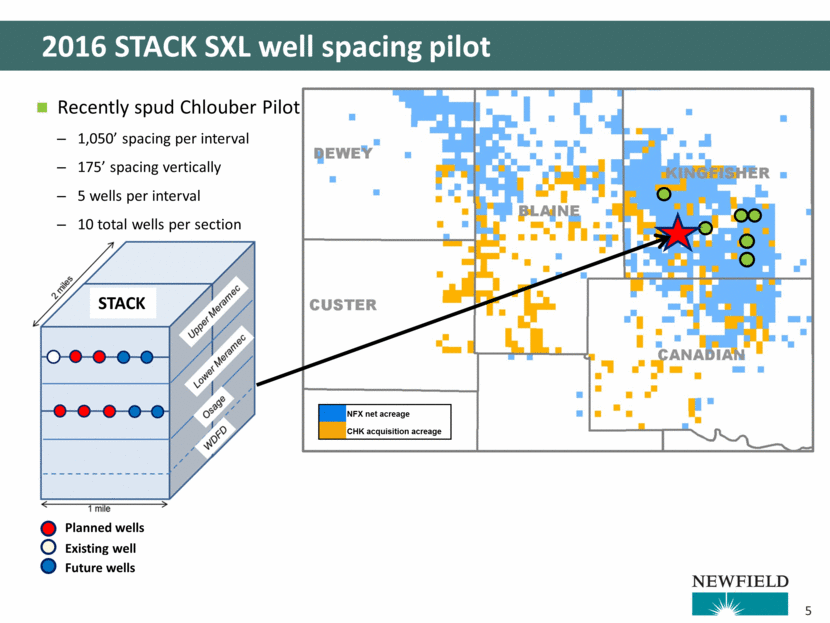
2016 STACK SXL well spacing pilot Recently spud Chlouber Pilot 1,050’ spacing per interval 175’ spacing vertically 5 wells per interval 10 total wells per section STACK 5 Planned wells Existing well Future wells NFX net acreage CHK acquisition acreage
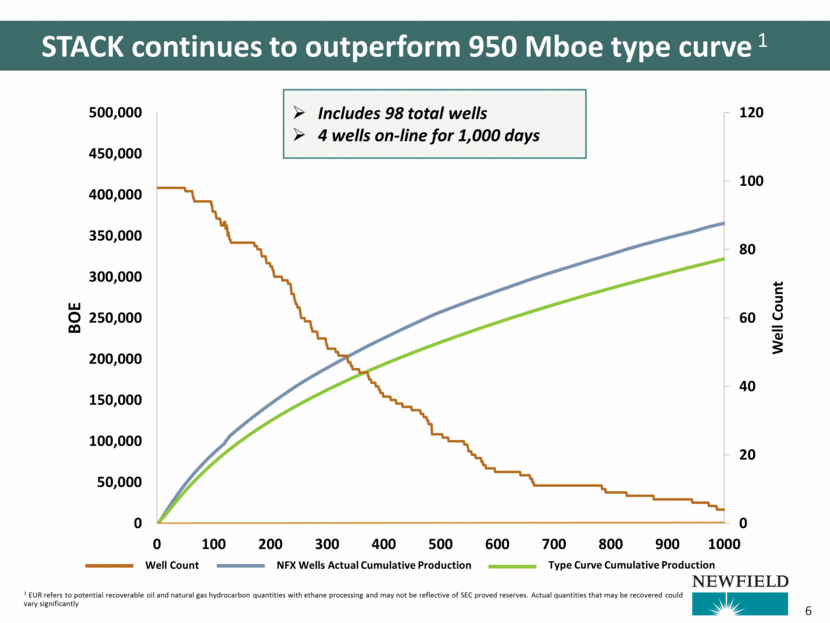
STACK continues to outperform 950 Mboe type curve 1 NFX Wells Actual Cumulative Production Well Count Type Curve Cumulative Production Includes 98 total wells 4 wells on-line for 1,000 days 1 EUR refers to potential recoverable oil and natural gas hydrocarbon quantities with ethane processing and may not be reflective of SEC proved reserves. Actual quantities that may be recovered could vary significantly 6 0 20 40 60 80 100 120 0 50,000 100,000 150,000 200,000 250,000 300,000 350,000 400,000 450,000 500,000 0 100 200 300 400 500 600 700 800 900 1000 Well Count BOE
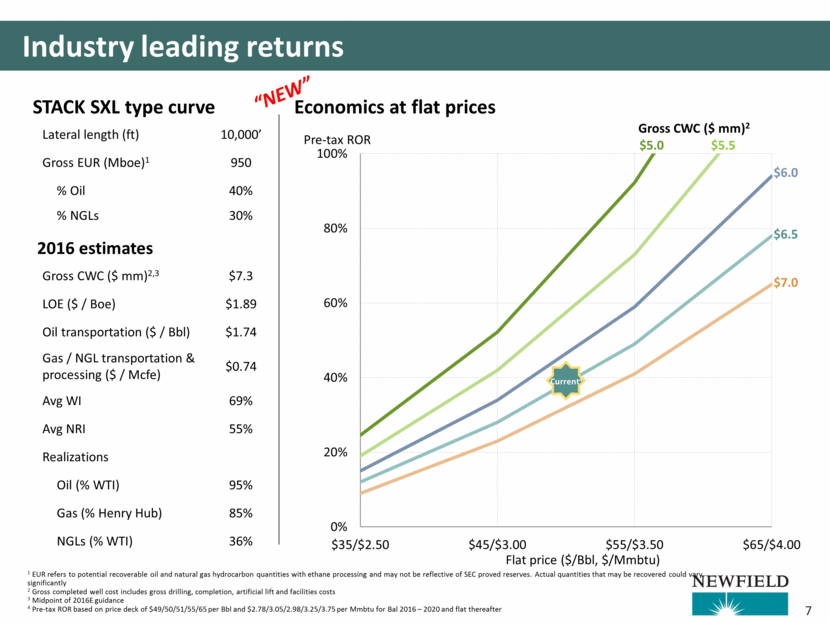
Lateral length (ft) 10,000’ Gross EUR (Mboe)1 950 % Oil 40% % NGLs 30% 2016 estimates Gross CWC ($ mm)2,3 $7.3 LOE ($ / Boe) $1.89 Oil transportation ($ / Bbl) $1.74 Gas / NGL transportation & processing ($ / Mcfe) $0.74 Avg WI 69% Avg NRI 55% Realizations Oil (% WTI) 95% Gas (% Henry Hub) 85% NGLs (% WTI) 36% 7 Industry leading returns STACK SXL type curve 1 EUR refers to potential recoverable oil and natural gas hydrocarbon quantities with ethane processing and may not be reflective of SEC proved reserves. Actual quantities that may be recovered could vary significantly 2 Gross completed well cost includes gross drilling, completion, artificial lift and facilities costs 3 Midpoint of 2016E guidance 4 Pre-tax ROR based on price deck of $49/50/51/55/65 per Bbl and $2.78/3.05/2.98/3.25/3.75 per Mmbtu for Bal 2016 – 2020 and flat thereafter Pre-tax ROR Economics at flat prices $6.0 Gross CWC ($ mm)2 $6.5 $7.0 Flat price ($/Bbl, $/Mmbtu) Current4 $5.5 $5.0 “NEW” 0% 20% 40% 60% 80% 100% $35/$2.50 $45/$3.00 $55/$3.50 $65/$4.00
Forward looking statements and related matters This presentation contains forward-looking statements within the meaning of Section 27A of the Securities Act of 1933, as amended, and Section 21E of the Securities Exchange Act of 1934, as amended. The words “may,” “believe,” “expect,” “anticipate,” “intend,” “estimate,” “project,” “target,” “goal,” “plan,” “should,” “will,” “predict,” “guidance,” “potential” or other similar expressions are intended to identify forward-looking statements. Other than historical facts included in this presentation, all information and statements, including but not limited to information regarding planned capital expenditures, estimated reserves, estimated production targets, drilling and development plans, the timing of production, planned capital expenditures, and other plans and objectives for future operations, are forward-looking statements. Although, as of the date of this presentation, Newfield believes that these expectations are reasonable, this information is based upon assumptions and anticipated results that are subject to numerous uncertainties and risks. Actual results may vary significantly from those anticipated due to many factors, including but not limited to commodity prices, drilling results, our liquidity and the availability of capital resources, operating risks, industry conditions, China and U.S. governmental regulations, financial counterparty risks, the prices of goods and services, the availability of drilling rigs and other support services, our ability to monetize assets and repay or refinance our existing indebtedness, labor conditions, severe weather conditions, and other operating risks. Please see Newfield’s 2015 Annual Report on Form 10-K and Quarterly Report on Form 10-Q for 1Q 2016, both filed with the U.S. Securities and Exchange Commission (SEC), for a discussion of other factors that may cause actual results to vary. Unpredictable or unknown factors not discussed herein or in Newfield’s SEC filings could also have material adverse effects on actual results. Readers are cautioned not to place undue reliance on forward-looking statements, which speak only as of the date of this presentation. Unless legally required, Newfield undertakes no obligation to publicly update or revise any forward-looking statements, whether as a result of new information, future events or otherwise. This presentation has been prepared by Newfield and includes market data and other statistical information from sources believed by Newfield to be reliable, including independent industry publications, government publications or other published independent sources. Some data are also based on Newfield’s good faith estimates, which are derived from its review of internal sources as well as the independent sources described above. Although Newfield believes these sources are reliable, it has not independently verified the information and cannot guarantee its accuracy and completeness. Actual quantities that may be ultimately recovered from Newfield’s interests may differ substantially from the estimates in this presentation. Factors affecting ultimate recovery include the scope of Newfield’s ongoing drilling program, which will be directly affected by commodity prices, the availability of capital, drilling and production costs, availability of drilling services and equipment, drilling results, lease expirations, transportation constraints, regulatory approvals and other factors, and actual drilling results, including geological and mechanical factors affecting recovery rates. Newfield may use terms in this presentation, such as “EURs”, “upside potential”, “net unrisked resource”, “gross EURs”, and similar terms that the SEC’s guidelines strictly prohibit in SEC filings. These terms include reserves with substantially less certainty than proved reserves, and no discount or other adjustment is included in the presentation of such reserve numbers. Investors are urged to consider closely the oil and gas disclosures in Newfield’s 2015 Annual Report on Form 10-K and 1Q 2016 Quarterly Report on Form 10-Q, available at www.newfield.com, www.sec.gov or by writing Newfield at 4 Waterway Square Place, Suite 100, The Woodlands, Texas 77380 Attn: Investor Relations. 8
