Attached files
| file | filename |
|---|---|
| 8-K - FORM 8-K - II-VI INC | d374808d8k.htm |
www.ii-vi.com NASDAQ: IIVI Investor Presentation June 2016 Our Technologies for Tomorrow’s Innovations A global leader powered by engineered material solutions that fully satisfy our customers Exhibit 99.1
www.ii-vi.com I NASDAQ: IIVI Matters discussed in this presentation may contain forward-looking statements that are subject to risks and uncertainties. These risks and uncertainties could cause the forward-looking statements and II-VI Incorporated’s (the Company’s) actual results to differ materially. In evaluating these forward-looking statements, you should specifically consider the “Risk Factors” in the Company’s most recent Form 10-K and Form 10-Q. Forward-looking statements are only estimates and actual events or results may differ materially. II-VI Incorporated disclaims any obligation to update information contained in any forward-looking statement. This presentation contains certain non-GAAP financial measures. Reconciliations of non-GAAP financial measures to their most comparable GAAP financial measures are presented at the end of this presentation. Safe Harbor Statement
Ne Ne Our Core – Material Excellence Ne Sc 21
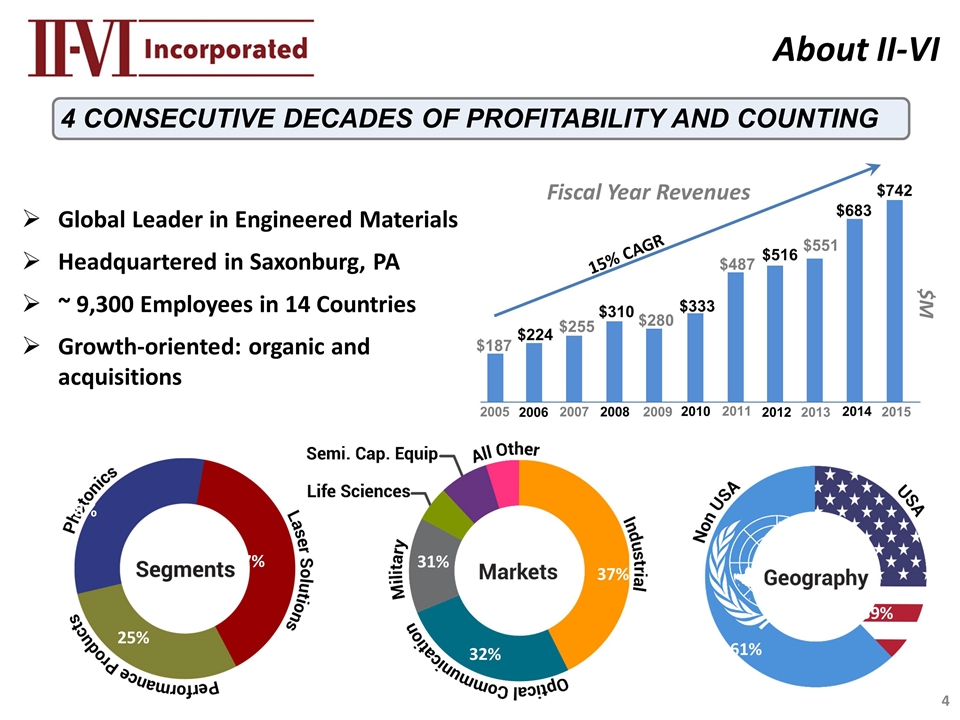
Global Leader in Engineered Materials Headquartered in Saxonburg, PA ~ 9,300 Employees in 14 Countries Growth-oriented: organic and acquisitions 4 CONSECUTIVE DECADES OF PROFITABILITY AND COUNTING Fiscal Year Revenues $M 63% 37% 31% 37% 32% 36% 35% 13% 6% 7% 3% 15% CAGR 2005 $187 $224 $255 $310 $280 $333 $487 $516 $551 $683 2006 2007 2008 2009 2010 2011 2012 2013 2014 About II-VI 25% 37% 38% 2015 $742 61% 39%
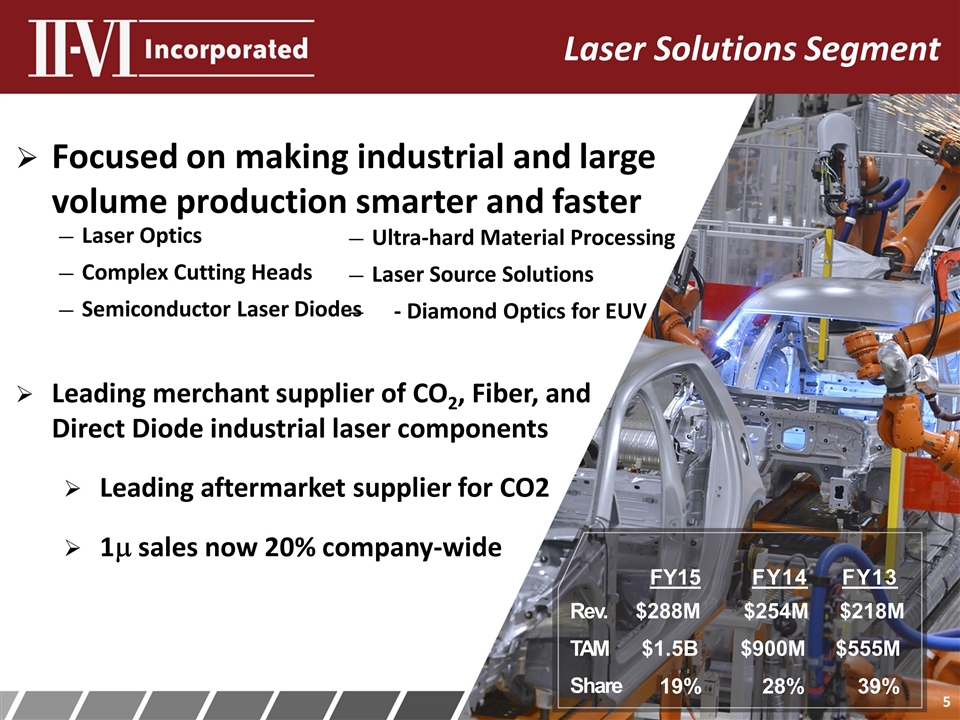
Rev. TAM Share Laser Solutions Segment Focused on making industrial and large volume production smarter and faster Leading merchant supplier of CO2, Fiber, and Direct Diode industrial laser components Leading aftermarket supplier for CO2 1m sales now 20% company-wide Laser Optics Complex Cutting Heads Semiconductor Laser Diodes Ultra-hard Material Processing Laser Source Solutions - Diamond Optics for EUV $288M $254M $218M $1.5B $900M $555M 19% 28% 39% FY15 FY14 FY13
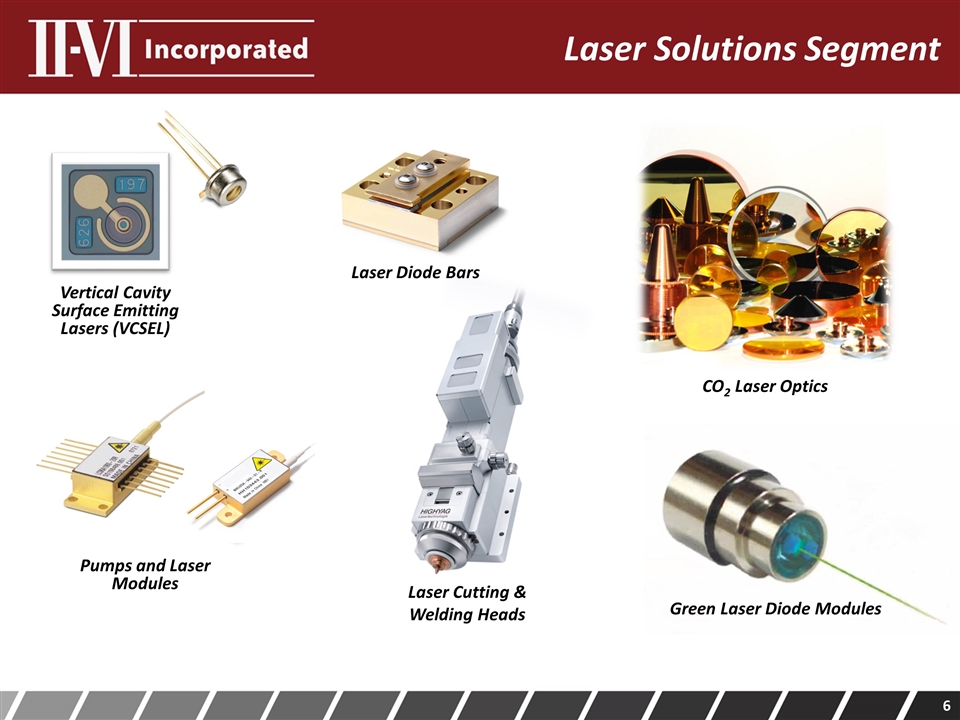
Laser Solutions Segment Vertical Cavity Surface Emitting Lasers (VCSEL) CO2 Laser Optics Laser Cutting & Welding Heads Laser Diode Bars Green Laser Diode Modules Pumps and Laser Modules
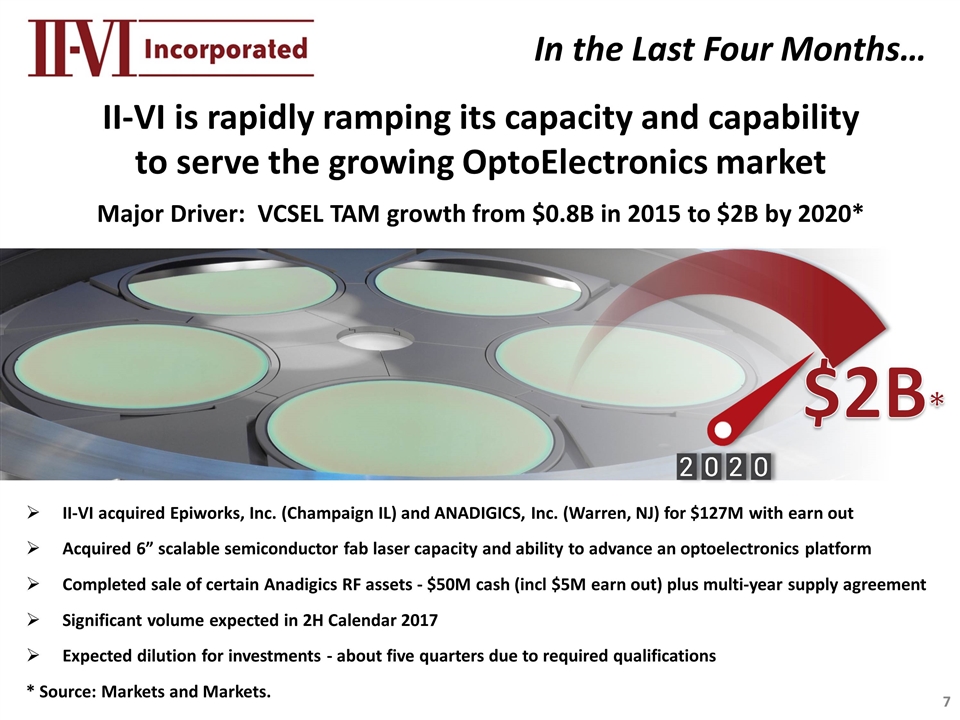
In the Last Four Months… II-VI acquired Epiworks, Inc. (Champaign IL) and ANADIGICS, Inc. (Warren, NJ) for $127M with earn out Acquired 6” scalable semiconductor fab laser capacity and ability to advance an optoelectronics platform Completed sale of certain Anadigics RF assets - $50M cash (incl $5M earn out) plus multi-year supply agreement Significant volume expected in 2H Calendar 2017 Expected dilution for investments - about five quarters due to required qualifications * Source: Markets and Markets. $2B* II-VI is rapidly ramping its capacity and capability to serve the growing OptoElectronics market Major Driver: VCSEL TAM growth from $0.8B in 2015 to $2B by 2020*
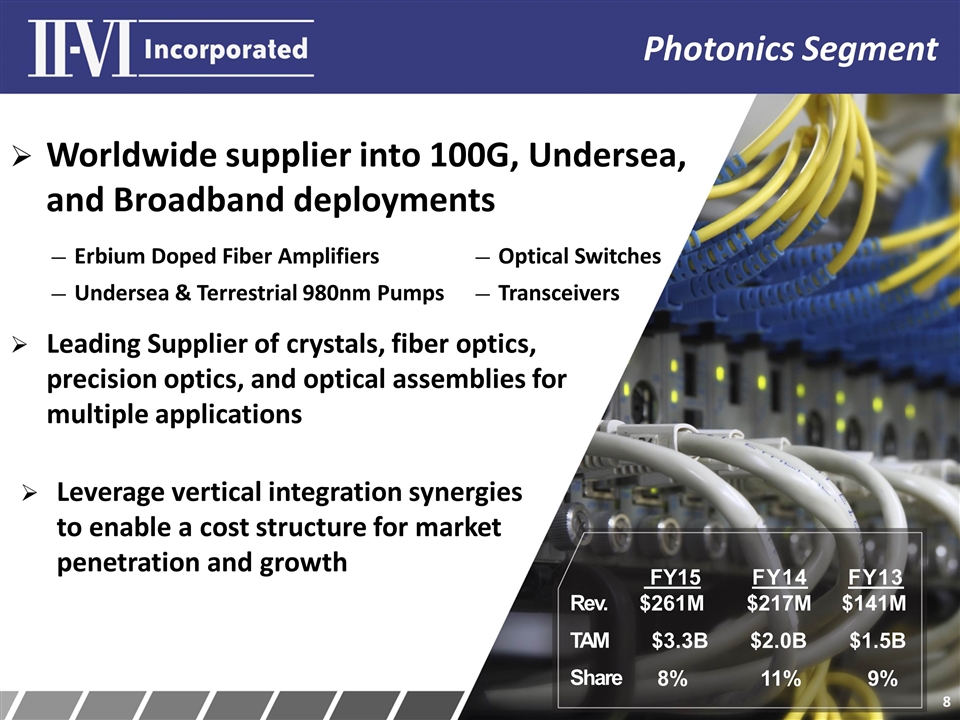
Photonics Segment Worldwide supplier into 100G, Undersea, and Broadband deployments Leading Supplier of crystals, fiber optics, precision optics, and optical assemblies for multiple applications Leverage vertical integration synergies to enable a cost structure for market penetration and growth Erbium Doped Fiber Amplifiers Undersea & Terrestrial 980nm Pumps Optical Switches Transceivers Rev. TAM Share $261M $217M $141M $3.3B $2.0B $1.5B 8% 11% 9% FY15 FY14 FY13
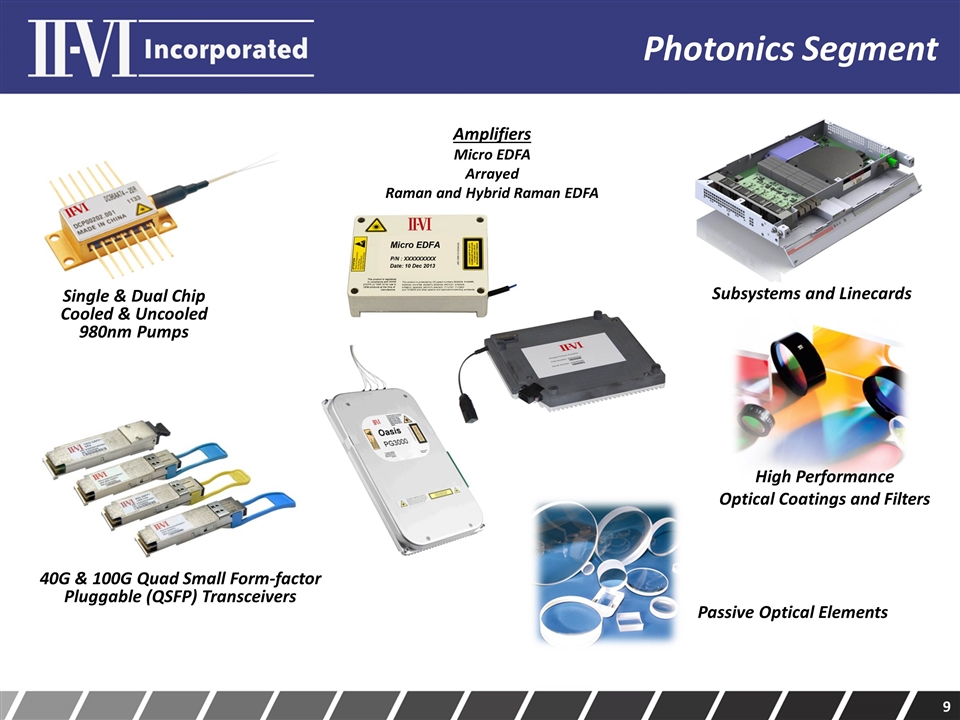
Photonics Segment Single & Dual Chip Cooled & Uncooled 980nm Pumps 40G & 100G Quad Small Form-factor Pluggable (QSFP) Transceivers High Performance Optical Coatings and Filters Subsystems and Linecards Amplifiers Micro EDFA Arrayed Raman and Hybrid Raman EDFA Passive Optical Elements
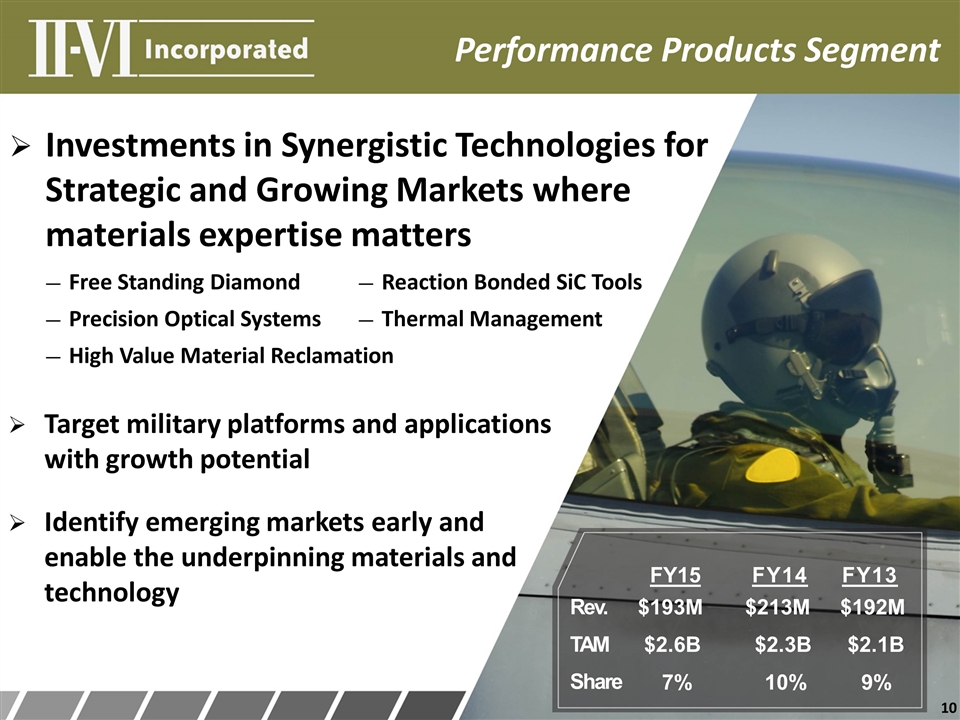
Investments in Synergistic Technologies for Strategic and Growing Markets where materials expertise matters Free Standing Diamond Precision Optical Systems High Value Material Reclamation Reaction Bonded SiC Tools Thermal Management Target military platforms and applications with growth potential Identify emerging markets early and enable the underpinning materials and technology Performance Products Segment Rev. TAM Share $193M $213M $192M $2.6B $2.3B $2.1B 7% 10% 9% FY15 FY14 FY13
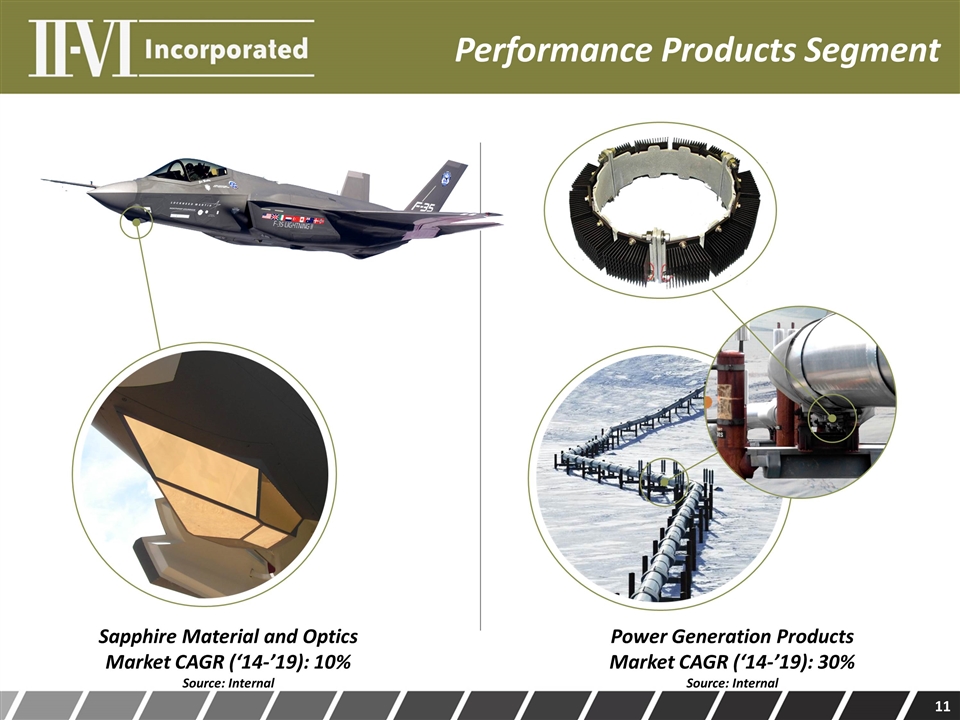
Performance Products Segment Sapphire Material and Optics Market CAGR (‘14-’19): 10% Source: Internal Power Generation Products Market CAGR (‘14-’19): 30% Source: Internal
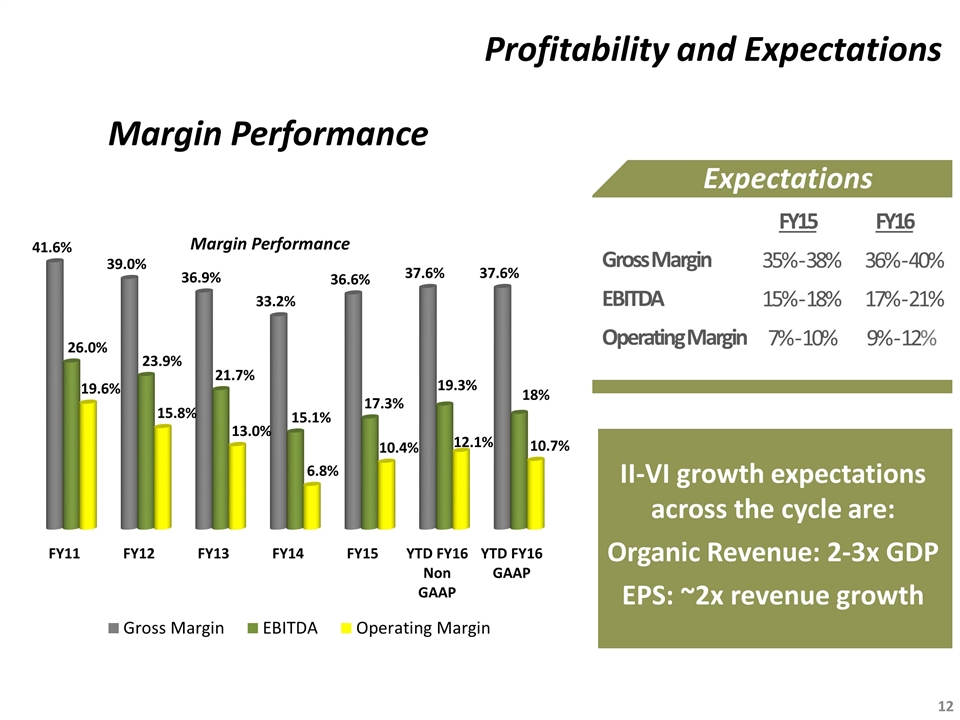
Gross Margin EBITDA Operating Margin FY15 FY16 35% - 38% 36% - 40% 15% - 18% 17% - 21% 7% - 10% 9% - 12% Expectations Margin Performance Profitability and Expectations II-VI growth expectations across the cycle are: Organic Revenue: 2-3x GDP EPS: ~2x revenue growth
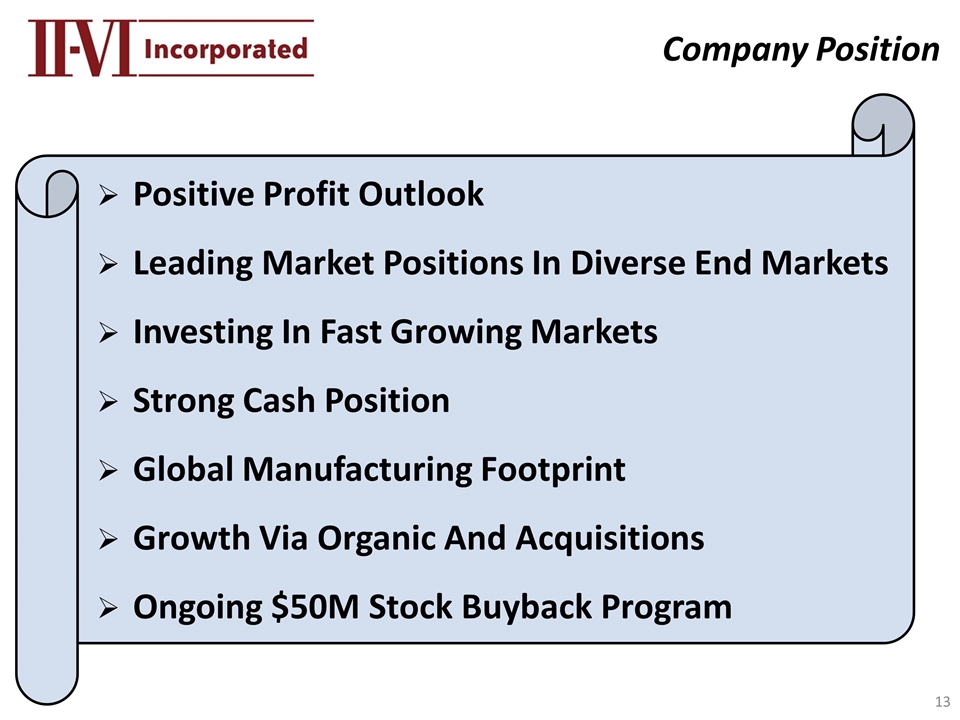
Company Position Positive Profit Outlook Leading Market Positions In Diverse End Markets Investing In Fast Growing Markets Strong Cash Position Global Manufacturing Footprint Growth Via Organic And Acquisitions Ongoing $50M Stock Buyback Program
