Attached files
| file | filename |
|---|---|
| EX-21.01 - LIST OF SUBSIDIARIES - II-VI INC | dex2101.htm |
| EX-31.01 - SECTION 302 CEO CERTIFICATION - II-VI INC | dex3101.htm |
| EX-23.01 - CONSENT OF ERNST & YOUNG LLP - II-VI INC | dex2301.htm |
| EX-31.02 - SECTION 302 CFO CERTIFICATION - II-VI INC | dex3102.htm |
| EX-32.01 - SECTION 906 CEO CERTIFICATION - II-VI INC | dex3201.htm |
| EX-32.02 - SECTION 906 CFO CERTIFICATION - II-VI INC | dex3202.htm |
United States
SECURITIES AND EXCHANGE COMMISSION
Washington, D.C. 20549
FORM 10-K
| x | Annual Report pursuant to Section 13 or 15(d) of the Securities Exchange Act of 1934 |
| for the fiscal year ended June 30, 2010 |
| ¨ | Transition report pursuant to Section 13 or 15(d) of the Securities Exchange Act of 1934 for the transition period from to . |
Commission File Number: 0-16195
II-VI INCORPORATED
(Exact name of registrant as specified in its charter)
| PENNSYLVANIA | 25-1214948 | |
| (State or other jurisdiction of incorporation or organization) |
(I.R.S. Employer Identification No.) | |
| 375 Saxonburg Boulevard | ||
| Saxonburg, PA | 16056 | |
| (Address of principal executive offices) | (Zip code) | |
Registrant’s telephone number, including area code: 724-352-4455
Securities registered pursuant to Section 12(b) of the Act:
|
Title of Each Class |
Name of Each Exchange on Which Registered | |
| Common Stock, no par value | Nasdaq Global Select Market |
Securities registered pursuant to Section 12(g) of the Act: None
Indicate by check mark if the registrant is a well-known seasoned issuer, as defined in Rule 405 of the Securities Act.
Yes No X
Indicate by check mark if the registrant is not required to file reports pursuant to Section 13 or Section 15(d) of the Exchange Act.
Yes No X
Indicate by check mark whether the registrant (1) has filed all reports required to be filed by Section 13 or 15(d) of the Securities Exchange Act of 1934 during the preceding 12 months (or for such shorter period that the registrant was required to file such reports), and (2) has been subject to such filing requirements for the past 90 days.
Yes X No
Indicate by check mark whether the registrant has submitted electronically and posted on its corporate Web site, if any, every Interactive Data File required to be submitted and posted pursuant to Rule 405 of Regulation S-T during the preceding 12 months (or for shorter period that the registrant was required to submit and post such files).
Yes No
Indicate by check mark if disclosure of delinquent filers pursuant to Item 405 of Regulation S-K is not contained herein, and will not be contained, to the best of registrant’s knowledge, in definitive proxy or information statements incorporated by reference in Part III of this Form 10-K or any amendment to this Form 10-K. ¨
Indicate by check mark whether the registrant is a large accelerated filer, an accelerated filer, a non-accelerated filer, or a smaller reporting company. See definition of “large accelerated filer,” “accelerated filer” and “smaller reporting company” in Rule 12b-2 of the Exchange Act. (Check one):
Large accelerated filer x Accelerated filer ¨ Non-accelerated filer ¨ Smaller reporting company ¨
(Do not check if a smaller reporting company)
Indicate by check mark whether the registrant is a shell company (as defined in Rule 12b-2 of the Exchange Act).
Yes ¨ No x
Aggregate market value of outstanding Common Stock, no par value, held by non-affiliates of the Registrant at December 31, 2009, was approximately $767,938,000 based on the closing sale price reported on the Nasdaq Global Select Market. For purposes of this calculation only, directors and executive officers of the Registrant and their spouses are deemed to be affiliates of the Registrant.
Number of outstanding shares of Common Stock, no par value, at August 20, 2010, was 30,916,051.
DOCUMENTS INCORPORATED BY REFERENCE
Portions of the registrant’s definitive proxy statement, which will be issued in connection with the 2010 Annual Meeting of Shareholders of II-VI Incorporated, are incorporated by reference into Part III of this Annual Report on Form 10-K.
Forward-Looking Statements
This annual report on Form 10-K (including certain information incorporated herein by reference) contains forward-looking statements made pursuant to Section 21E of the Securities Exchange Act of 1934, as amended, and the safe harbor provisions of the Private Securities Litigation Reform Act of 1995. These statements relate to the Company’s performance on a going-forward basis. Forward looking statements are also identified by words such as “expects,” “anticipates,” “intends,” “plans,” “projects” or similar expressions.
The forward-looking statements in this Form 10-K involve risks and uncertainties, which could cause actual results, performance or trends to differ materially from those expressed in the forward-looking statements herein or in previous disclosures. The Company believes that all forward-looking statements made by it have a reasonable basis, but there can be no assurance that these expectations, beliefs or projections as expressed in the forward-looking statements will actually occur or prove to be correct. Actual results could materially differ from such statements. In addition to general industry and economic conditions, including any failure to sustain the recent recovery from the global economic downturn, factors that could cause actual results to differ materially from those discussed in the forward-looking statements include, but are not limited to: (i) the failure of any one or more of the assumptions stated above to prove to be correct; (ii) the Risk Factors set forth in Item 1A; (iii) purchasing patterns from customers and end-users; (iv) timely release of new products, and acceptance of such new products by the market; (v) the introduction of new products by competitors and other competitive responses; and/or (vi) the Company’s ability to devise and execute strategies to respond to market conditions.
1
PART I
| ITEM 1. | BUSINESS |
Introduction
II-VI Incorporated (“II-VI”, the “Company,” “we,” “us,” or “our”) was incorporated in Pennsylvania in 1971. Our executive offices are located at 375 Saxonburg Boulevard, Saxonburg, Pennsylvania 16056. Our telephone number is 724-352-4455. Reference to “II-VI,” the “Company,” “we,” “us,” or “our” in this Form 10-K, unless the context requires otherwise, refers to II-VI Incorporated and its wholly-owned and majority-owned subsidiaries. The Company’s name is pronounced “Two Six Incorporated.” The majority of our revenues are attributable to the sale of optical components for industrial, military and medical laser applications, telecommunication products, compound semiconductor substrate-based products for industrial, medical and military applications, and elements for material processing and refinement. Reference to “fiscal” or “fiscal year” means our fiscal year ended June 30 for the year referenced.
In January 2010, the Company acquired all the outstanding shares of Photop Technologies, Inc. (“Photop”). Photop headquartered in Fuzhou, China is a vertically integrated manufacturer of crystal materials, optics, microchip lasers for display applications and optical modules for use in fiber optic communication networks and other diverse consumer and commercial applications. Photop became an operating unit within our Near-Infrared Optics business segment. The financial results for the fiscal year ended June 30, 2010 includes the results of Photop for six months.
In June 2009, the Company sold its x-ray and gamma-ray radiation sensor business, eV PRODUCTS, Inc., which was previously reported in the Compound Semiconductor Group business segment. Financial and operational data included herein for the fiscal years ended June 30, 2009, 2008 and earlier periods reflect the presentation of eV PRODUCTS, Inc. as a discontinued operation.
In January 2008, the Company acquired a 74.93% equity interest in HIGHYAG Lasertechnologie GmbH (“HIGHYAG”), a designer and manufacturer of automated equipment to deliver high power one micron laser light for cutting, drilling and welding in automotive, semiconductor and other material processing applications, which became an operating unit within the Infrared Optics business segment.
Our internet address is www.ii-vi.com. Information contained on our website is not part of, and should not be construed as being incorporated by reference into, this Annual Report on Form 10-K. We post the following reports on our website as soon as reasonably practical after they are electronically filed with or furnished to the Securities and Exchange Commission (the “SEC”): our annual reports on Form 10-K, our quarterly reports on Form 10-Q, our current reports on Form 8-K, and any amendments to those reports or statements filed or furnished pursuant to Section 13(a) or 15(d) of the Securities Exchange Act of 1934. In addition, we post our proxy statements on Schedule 14A related to our annual shareholders’ meetings as well as reports filed by our directors, officers and ten-percent beneficial owners pursuant to Section 16 of the Securities Exchange Act of 1934. We also make available on our website our corporate governance documents, including the Company’s Code of Business Ethics, governance guidelines and the charters for various board committees. All such documents are located on the Investors page of our website and are available free of charge.
Information Regarding Market Segments and Foreign Operations
Financial data regarding our revenues, results of operations, industry segments and international sales for the three years ended June 30, 2010 is set forth in the consolidated statements of earnings and in Note M to the Company’s consolidated financial statements included in Item 8 of this Form 10-K. We also discuss certain Risk Factors set forth in Item 1A of this Form 10-K related to our foreign operations which are incorporated herein by reference.
2
General Description of Business
We develop, refine, manufacture and market high-technology materials and derivative precision components and products for precision use in industrial, military, telecommunications, medical and aerospace applications. We use advanced engineered material growth technologies coupled with proprietary high-precision fabrication, micro-assembly, thin-film coating and electronic integration to enable complex optoelectronic devices and modules. Our products are supplied to manufacturers and users in a wide variety of markets including industrial, defense, telecommunications and medical and are deployed in applications that we believe improve the cost and performance of laser cutting, welding and marking operations; reduce the cost and improve the operations of telecommunication products; reduce the cost and improve the reliability of medical procedures; and reduce the cost and improve the performance of cooling and power generation solutions. A key strategy is to develop, refine and manufacture complex materials. We focus on providing critical components to the heart of our customers’ assembly lines for products such as high-power laser material processing systems, military fire control and missile guidance devices, fiber optics and wireless communication systems, medical diagnostic systems and industrial, commercial and consumer thermal management systems. We develop, manufacture, refine and market infrared and near-infrared laser optical elements, military infrared optical components, selenium and tellurium metals and chemicals, thermoelectric cooling and power generation solutions and single crystal silicon carbide (SiC) substrates.
Our U.S. production operations are located in Pennsylvania, Florida, California, New Jersey, Texas and Mississippi and our non-U.S. production operations are based in Singapore, China, Vietnam, the Philippines and Germany. In addition to sales offices at most of our manufacturing sites, we have sales and marketing subsidiaries in Germany, Japan, China, Switzerland, Belgium, the United Kingdom (U.K.) and Italy. Approximately 49% of our revenues in the fiscal year ended June 30, 2010 were from product sales to customers outside of the U.S.
Our primary products are as follows:
| – | Laser-related products for CO2 lasers and forward-looking infrared systems, and high precision optical elements used to focus and direct infrared lasers onto target work surfaces. The majority of these laser products require advanced optical materials that are internally produced. |
| – | Laser-related products for one micron lasers for cutting, drilling and welding in automotive, semiconductor and other material processing applications. We produce tools for laser material processing, including modular laser processing heads for fiber lasers, yttrium aluminum garnet (YAG) lasers and other one micron laser systems. We also manufacture beam delivery systems including fiber optic cables and modular beam systems. |
| – | Laser-related products for solid-state lasers, high precision optical elements and assemblies used to focus and direct laser beams onto target work surfaces and Ultra-violet (UV) Filters used in systems to detect shoulder-launched missiles to help improve the survivability of low-flying aircraft if attacked. The majority of these laser products require advanced optical materials and crystals that are internally produced. |
| – | Photonics and optical components products for use in optical communication networks and other diverse consumer and commercial applications. We leverage our expertise in crystal materials and optics to design and manufacture a diverse range of customized optics and optical components such as projection devices and lasers. |
| – | Military infrared optical products and assemblies including optics for targeting and navigation systems. |
3
| – | Selenium and tellurium metals and chemicals via refining and reclamation processes. These products are used as additive materials for metallurgical, glass and animal feed applications, and are used for photovoltaic, electronic and other industrial applications. |
| – | Thermoelectric coolers, thermoelectric systems, power generation modules and power generation systems based on highly engineered semiconductor materials that provide reliable and low cost temperature control or power generation capability. |
| – | SiC substrates which are wide bandgap semiconductor materials that enable high-temperature, high-power and high-frequency device capabilities. |
Our Markets
Our market-focused businesses are organized by technology and products. Our business is comprised of the following primary markets:
| – | Design, manufacture and marketing of optical and electro-optical components and materials for infrared optics for industrial, medical and military applications by our II-VI Infrared operations. |
| – | Design, manufacture and marketing of customized technology for laser material processing to deliver high-power one micron laser light for industrial applications by our Infrared Optics’ HIGHYAG operations. |
| – | Design, manufacture and marketing of ultra-violet, visible and near-infrared laser products for industrial, military, scientific and medical instruments, including laser gain materials and products for solid-state YAG and other crystal-based lasers by our VLOC operations in the Near-Infrared Optics segment. |
| – | Design, manufacture and marketing of a diverse range of customized optics and optical components for consumer and commercial application such as fiber optic communications, projection and display systems and biomedical instrumentation by our Photop operations in the Near-Infrared Optics segment. |
| – | Design, manufacture and marketing of infrared products for military applications by our Military & Materials’ Military Infrared Optics operations. |
| – | Refinement, reclamation, manufacturing and marketing of selenium and tellurium products for industrial applications by our Military & Materials’ Materials Processing and Refinement operations. |
| – | Design, manufacture and marketing of thermoelectric cooling and power-generation products for use in defense, telecommunications, medical, automotive, consumer and industrial markets by our Compound Semiconductor Group’s Marlow Industries, Inc. (“Marlow”) operations. |
| – | Design, manufacture and marketing of single crystal SiC substrates for use in defense and space, telecommunications, and industrial markets by our Compound Semiconductor Group’s Wide Bandgap Group (“WBG”) operations. |
Infrared Optics Market. Over the last few years, significant increases in the installed worldwide base of laser machines for a variety of laser processing applications have driven CO2 laser optics component consumption. It is estimated that there are over 55,000 CO2 laser systems currently deployed in the world. CO2 lasers offer benefits in a wide variety of cutting, welding, drilling, ablation, cladding, heat treating and marking
4
applications for materials such as steel alloys, non-ferrous metals, plastics, wood, paper, fiberboard, ceramics and composites. Laser systems enable the manufacturers to reduce part cost and improve quality, as well as augment process precision, speed, throughput, flexibility, repeatability and automation. Automobile manufacturers, for example, deploy lasers both to cut body components and to weld those parts together in high-throughput production lines. Manufacturers of motorcycles, lawn mowers and garden tractors cut, trim, and weld metal parts with lasers to reduce post-processing steps and, therefore, lower overall manufacturing costs. Furniture manufacturers utilize lasers because of their easily reconfigurable, low-cost prototyping and production capabilities for customer-specified designs. In high-speed food and pharmaceutical packaging lines, laser marking is used to provide automated product, date, and lot coding on containers. In addition to being installed by original equipment manufacturers (“OEMs”) of laser systems in new machine builds, our optical components are purchased as replacement parts by end users of laser machines to maintain proper system performance. We believe that the current addressable market serviced by the II-VI Infrared business is approximately $500 million.
One Micron Laser Market. In many areas of material processing, laser technology has proved to be a better alternative to conventional production techniques. The precise cut and elegant seam are visible proof of a laser beam’s machining efficiency. Industrial applications such as cutting, drilling and welding have driven the recent market growth of the one-micron laser systems, and are demanding increased performance, lower total cost of ownership, ease of use and portability of one-micron laser systems. One micron laser systems require efficient and reliable tools, including modular laser processing heads for fiber lasers, beam delivery systems including fiber optic cables and modular beam systems. We believe that the current addressable market serviced by HIGHYAG is approximately $50 million.
Near-Infrared Optics Market. The Near-Infrared laser market is driven by applications in the military, medical, industrial and telecommunication markets. Military applications include use in rangefinders, target designators, missile detection, countermeasures and high energy laser weapon systems. Medical applications include aesthetic, vision correction, dental and diagnostic lasers. Industrial market segments addressed by YAG lasers are used in higher power applications such as cutting and welding, and lower power applications such as marking and scribing. These industrial applications are demanding higher performance levels for less cost, creating competition for other technologies. The telecommunication market is being driven by demand for high-bandwidth communication capabilities by the growing number of broadband users worldwide and the greater reliance on high-bandwidth capabilities in our daily lives. For example, video and music downloads, gaming and other on-line interactive applications are growing rapidly. Optical networks are being extended closer to the end user with fiber-to-the-home and other fiber networks. Mobile data traffic also is increasing as smart phones continue to proliferate with increasingly sophisticated audio, photo, video, email and Internet capabilities. The resulting traffic, in turn, is felt throughout the network, including the core that depends on optical technology. The near-infrared market also addresses opportunities in the semiconductor processing, instrumentation and research segments. We believe that the current addressable market serviced by our Near-Infrared Optics segment is approximately $1.2 billion.
Military Infrared Optics Market. We provide several key infrared optical components such as windows, domes and related subassemblies to the military market for infrared applications in night vision, targeting, navigation and Homeland Security systems. Infrared window and window assemblies for navigational and targeting systems are deployed on fixed and rotary-wing aircraft, such as the F-16 fighter jet, Apache Attack Helicopter, Joint Strike Fighter and ground vehicles such as the Abrams M-1 Tank and Bradley Fighting Vehicle. Infrared domes are used on missiles with infrared guidance systems ranging from small, man-portable designs to larger designs mounted on helicopters, fixed-wing aircraft and ground vehicles. Additionally, multiple fighter jets including the F-16 are being equipped with large area sapphire windows manufactured by the Company, as a key component for the aircraft providing advanced targeting and imaging systems. The development and manufacture of these large area sapphire windows has played a key role in our ability to provide an even larger suite of sapphire panels that are a key component of the Joint Strike Fighter Electro Optical Targeting System. High-precision domes are an integral component of a missile’s targeting system providing efficient tactical capability while serving as a protective cover to its internal components. Our military infrared optical products are sold
5
primarily to U.S. government prime contractors and directly to various U.S. government agencies. We believe that the current addressable market serviced by our Military Infrared Optics business is approximately $500 million.
Materials Processing and Refinement Market. Numerous processes require the presence of high-purity elements for proper processing. The Company’s Pacific Rare Specialty Metals & Chemicals, Inc. (“PRM”) business addresses the market for two specific rare elements: selenium and tellurium. Selenium and tellurium usually are by-products of refining processes for other more common materials such as copper and zinc. High-purity selenium and tellurium are used in a variety of industrial applications, including the manufacture of steel and glass, the production of animal feeds and fertilizers, the manufacture of thermoelectric coolers and the production of photovoltaic solar panels. Our products are sold to customers who require selenium and/or tellurium in their manufacturing processes. We believe that the current addressable market serviced by our PRM business is approximately $110 million, although demand is highly dependent upon minor metal indexed pricing.
Thermoelectric Coolers Market. Thermoelectric coolers (“TECs”) are solid-state semiconductor devices that act as small heat pumps to cool, heat or temperature stabilize a wide range of materials, components and systems. Conversely, the principles underlying thermoelectrics allow TECs to be used as a source of power when subjected to a temperature difference. TECs are more reliable than alternative cooling solutions that require moving parts and provide more precise temperature control solutions than competing technologies. TECs also have many other advantages which spurred the adoption of TECs in a variety of industries and applications. For example, TECs provide critical cooling and temperature stabilization solutions in a myriad of defense and space applications, including infrared cooled and un-cooled temperature stabilized night vision technologies and thermal reference sources that are deployed in state-of-the-art weapons, as well as cooling high powered lasers used for range finding target designation by military personnel. TECs also allow for temperature stabilization for telecommunication lasers that generate and amplify optical signals for fiber optics systems. Thermoelectric cooling solutions appear in a variety of medical applications including instrumentation and analytical applications such as DNA replication, blood analyzers and medical laser equipment. The industrial, commercial, and consumer markets provide a variety of niche applications ranging from desk-top refrigerators and wine coolers to semi-conductor process and test equipment. Mosquito trap applications utilize the power generation capabilities of the technology to rid residences, resorts and camps of mosquitoes. In addition, power generation applications are expanding into fields such as waste heat recovery, heat scavenging and co-generation. We believe the current addressable market serviced by our Marlow Industries, Inc. business is approximately $250 million.
Silicon Carbide Substrate Market. Silicon Carbide (SiC) is a wide bandgap semiconductor material that offers high-temperature, high-power and high-frequency capabilities as a substrate for applications that are emerging at the high-performance end of the defense, telecommunication and industrial markets. SiC has certain intrinsic physical and electronic advantages over competing semiconductor materials such as Silicon and Gallium Arsenide. For example, the high thermal conductivity of SiC enables SiC-based devices to operate at high power levels and still dissipate the excess heat generated. Typically, our customers deposit either SiC or Gallium Nitride (GaN) epitaxial layers on a SiC substrate and then fabricate optoelectronic or electronic devices. SiC and GaN-based structures are being developed and deployed for the manufacture of a wide variety of microwave and power switching devices. High-power, high-frequency SiC-based microwave devices are used in next generation wireless switching telecommunication applications and in both commercial and military radar applications. SiC based, high-power, high-speed devices improve the performance, efficiency and reliability of electrical power transmission and distribution systems (“smart grid”), as well as power conditioning and switching in power supplies and motor controls in a wide variety of applications including aircraft, hybrid vehicles, industrial, communications and green energy applications. We believe the current addressable market serviced by our Wide Bandgap Group is approximately $35 million.
6
Our Strategy
Our strategy is to build businesses with world-class, high technology materials capabilities at their core. Our significant materials capabilities are as follows:
| – | Infrared Optics: Zinc Selenide (ZnSe) and Zinc Sulfide (ZnS) |
| – | Near-Infrared Optics: Yttrium Aluminum Garnet (YAG), Yttrium Lithium Fluoride (YLF), Calcium Fluoride (CaF2), Potassium Nickel Sulfate (KNS), Neodymium doped Yttrium Vanadate (Nd:YVO4), Potassium Titanyl Phosphate (KTP) and Borium Borate Oxide (BBO) |
| – | Military Infrared Optics: Germanium (Ge) |
| – | Materials Processing and Refinement: Selenium (Se) and Tellurium (Te) |
| – | Thermoelectric Coolers: Bismuth Telluride (Bi2Te 3) |
| – | Silicon Carbide Substrates: Silicon Carbide (SiC) |
We manufacture precision parts and components from these and other materials using our expertise in low damage surface and micro fabrication, thin-film coating and exacting metrology. A substantial portion of our business is based on contracts with market leaders, which enables forward planning and production efficiencies. We intend to capitalize on the execution of this proven model, participate effectively in the growth of the market and continue our focus on operational excellence as we execute additional growth initiatives.
Our specific strategies are as follows:
| – | Vertical-Integration. By combining the capabilities of our various business segments and operating units, we have created opportunities for our businesses to address manufacturing opportunities across multiple disciplines and markets. Where appropriate, we develop and/or acquire technological capabilities in areas such as material refinement, crystal growth, fabrication, diamond-turning, thin-film coating, metrology and assembly. |
| – | Investment in Manufacturing Operations. We continually invest in our manufacturing operations worldwide to increase production capacity and capabilities. The majority of our capital expenditures are for our manufacturing operations. |
| – | Enhance Our Reputation as a Quality and Customer Service Leader. We are committed to understanding our customers’ needs and meeting their expectations. We have established ourselves as a consistent, high quality supplier of components into our customers’ assembly lines. In many cases, we deliver on a just-in-time basis. We believe our quality and delivery performance enhance our relationships with our customers. |
| – | Identify New Products and Markets. We intend to identify new products and markets to meet evolving customer requirements for high performance materials. Due to the special properties of the advanced materials we produce, we believe there are numerous applications and markets for such materials. |
| – | Utilize Asian Manufacturing Operations. Our manufacturing operations in Singapore, China, the Philippines and Vietnam play an important role in the operational and financial performance of the Company. We will continue to invest in these operations and utilize their capabilities. |
| – | Identify and Complete Strategic Acquisitions and Alliances. Some of the markets we participate in remain fragmented, and we expect consolidation to occur over the next several years. We will |
7
| carefully pursue strategic acquisitions and alliances with companies whose products or technologies may compliment our current products, expand our market opportunities or create synergies with our current capabilities. We intend to identify acquisition opportunities that accelerate our access to emerging high-growth segments of the markets we serve and further leverage our competencies and economies of scale. |
| – | Pursue Military Programs. Our Military Infrared Optics business serves military and defense applications. In addition, a portion of our other businesses are focused on products that are utilized in military and defense applications. Our strategy is to actively work with major defense contractors during the initial product development phase in order to incorporate our products into our customers’ systems. Early participation in long-term programs has proven to be a successful strategy and a competitive advantage in addressing the military market. |
| – | Balanced Approach to Research and Development. Our research and development program includes both internally and externally funded research and development expenditures targeting an overall investment of between 5 and 10 percent of product revenues. We are committed to accepting the right mix of internally and externally funded research that ties closely to our long-term strategic objectives. |
Our Products
The main products for each of our markets are described as follows:
Infrared Optics. We supply a broad line of precision infrared optical components such as lenses, output couplers, windows and mirrors for use in CO2 lasers. Our precision optical components are used to attenuate the amount of laser energy, enhance the properties of the laser beam and focus and direct laser beams to a target work surface. The optical components include both reflective and transmissive optics and are made from materials such as ZnSe, copper, silicon, gallium arsenide and germanium. Transmissive optics used with CO2 lasers are predominately made from ZnSe. We believe we are the largest manufacturer of ZnSe in the world. We supply replacement optics to end users of CO2 lasers. Over time, optics may become contaminated and must be replaced to maintain peak laser operations. This aftermarket portion of our business continues to grow as laser applications proliferate worldwide and the installed base of serviceable laser systems increases each year. We estimate that 85% to 90% of our infrared optics sales service this installed base of CO2 laser systems. We serve the aftermarket via a combination of selling to OEM and selling directly to system end users.
One Micron Laser Components. Our broad expertise in laser technology, optics, sensor technology and laser applications enables us to supply a broad array of tools for laser materials processing, including modular laser processing heads for fiber lasers, YAG lasers and other one micron laser systems. We also manufacture beam delivery systems including fiber optic cables and modular beam systems.
Near-Infrared Optics. We manufacture products across a broad spectral range, including UV, Visible and Near-Infrared. We offer a wide variety of standard and custom laser gain materials, optics and assemblies for military, medical, industrial, telecommunication, scientific and research and development laser systems. Laser gain materials are produced to stringent industry specifications and precisely fabricated to customer demands. Key materials and precision optical components for YAG and other solid-state laser systems complete our near-infrared optics product offerings. We manufacture waveplates, polarizers, lenses, prisms and mirrors for visible and near-infrared applications, which are used to control or alter visible or near-infrared energy and its polarization. In addition, we manufacture coated windows used as debris shields in the industrial and medical laser aftermarkets. For our telecommunications market, we offer micro optics and photonic crystal parts for optical communications components, optical and photonic crystal parts for instrumentation and laser applications, optical communication components and functional modules for optical communications and DPSS laser for optical instruments, display and biotechnology. Our Near-Infrared Optics segment also produces
8
components for UV Filters used in early warning missile detection. The end use of the UV Filter products we make is in systems used to detect shoulder-launched missiles to help improve the survivability of low-flying aircraft when attacked.
Military Infrared Optics. We offer optics and optical subassemblies for military infrared systems including thermal imaging, night vision, targeting and navigation systems. Our product offering is comprised of missile domes, electro-optical windows and subassemblies, imaging lenses and other components. Our precision optical products utilize infrared optical materials such as Sapphire, Germanium, Zinc Sulfide, Zinc Selenide, Silicon, and Aluminum Oxynitride. In addition, our products also include visible materials and fused silica. Our products are currently utilized on the F-16 fighter jet, Apache Attack Helicopter, Joint Strike Fighter and ground vehicles such as the Abrams M-1 Tank and Bradley Fighting Vehicle.
Material Processing and Refinement. Our product offering includes selenium and tellurium metals and chemicals in a variety of purity levels and forms.
Thermoelectric Coolers. We supply a broad array of thermoelectric modules and related assemblies to various market segments. In the defense market, TECs are used in guidance systems, smart weapons and night vision systems, as well as soldier cooling. TECs are also used in products providing temperature stabilization for telecommunication lasers that generate and amplify optical signals for fiber optic communication systems. We also produce and sell a variety of solutions from thermoelectric components to complete subsystems used in the medical equipment market and other industrial and commercial applications. Thermoelectric modules, used as power generators are also applied in a range of end-use applications. We offer single-stage TECs, micro TECs, multi-stage TECs, planar multi-stage TECs, extended life coolers, thermoelectric thermal reference sources, power generators and thermoelectric assemblies.
Silicon Carbide. Our product offerings are 6H-SiC (semi-insulating) and 4H-SiC (conducting) poly-types and are available in sizes up to 100mm diameter. SiC substrates are used in wireless infrastructure, radio frequency (RF) electronics and power switching industries.
Research, Development and Engineering
Our research and development program includes internally and externally funded research and development expenditures targeting an overall investment of between 5 and 10 percent of product revenues. From time to time, the ratio of externally funded contract activity to internally funded contract activity varies due to the unevenness of government research programs and changes in the focus of our internally funded research programs. We are committed to accepting the right mix of internally and externally funded research that ties closely to our long-term strategic objectives.
We devote significant resources to research, development and engineering programs directed at the continuous improvement of existing products and processes and to the timely development of new technologies, materials and products. We believe that our research, development and engineering activities are essential to our ability to establish and maintain a leadership position in each of the markets that we serve. As of June 30, 2010, we employed 617 people in research, development and engineering functions, 475 of who are engineers or scientists. In addition, certain manufacturing personnel support or participate in research and development on an ongoing basis. Interaction between the development and manufacturing functions enhances the direction of projects, reduces costs and accelerates technology transfers.
During the fiscal year ended June 30, 2010, we focused our research and development investments in the following areas:
| – | Silicon Carbide Substrate Technology: SiC substrate technology development efforts continue to move forward, with emphasis in the areas of defect density reduction, substrate fabrication, surface |
9
| polishing and diameter expansion. We were awarded continued funding through the Missile Defense Agency (MDA) focused on the manufacturing producibility of 100mm diameter 6H-SiC (semi-insulating) substrates for RF applications. We have also been awarded new funding through the Air Force Research Laboratory (AFRL) for development and manufacturing optimization of 100mm – 150mm 4H (semi-conducting) SiC substrates for high power switching applications and 6H (semi-insulating) SiC substrates for RF applications. Our research and development efforts in all of these areas have been both internally and externally funded. |
| – | Ceramic Oxide Materials: Our activities in this area are focused on process improvements, benchmarking the quality of commercially available research-grade ceramics and comparing their properties and performance to single crystal materials. Continued efforts involve investigation of composite materials for thermally-enhanced laser architectures and could lead to new applications. Our research and development efforts in this area have been both internally and externally funded. |
| – | Photonics Design: We have ongoing efforts to refine and improve our photonic crystal materials, optical parts, micro optical parts, passive and active components, laser instrumentation and display. Our research and development efforts in this area have been internally funded. |
| – | Thermoelectric Materials and Devices: We continue to develop the industry-leading Bi2Te 3 Micro-Alloyed Materials (MAM) for thermoelectric cooling applications. Enabled by the thermal performance and fine grain microstructure of MAM, our research and development has focused on achieving levels of miniaturization and watt density beyond the reach of TECs based on single crystal and polycrystalline materials produced by standard crystal growth techniques. In addition, we are developing capabilities in thermo-electric power generation materials that, combined with our intellectual property position, will allow us to bring to market new thermoelectric compounds that have been developed for NASA. Our research and development efforts in this area have been both internally and externally funded. |
The development and manufacturing of our products and processes is largely based on proprietary technical know-how and expertise. We rely on a combination of contract provisions, trade secret laws, invention disclosures and patents to protect our proprietary rights. We have entered into selective intellectual property licensing agreements. When faced with potential infringement of our proprietary information, we have in the past and continue currently to assert and vigorously protect our intellectual property rights.
Internal research and development expenditures were $11.8 million, $10.2 million and $7.7 million for the fiscal years ended June 30, 2010, 2009 and 2008, respectively. For these same periods, the external research and development expenditures were $7.0 million, $7.5 million and $9.4 million, respectively.
Marketing and Sales
We market our products through a direct sales force in the U.S., Japan, Singapore, China, the Philippines, Germany, Belgium, Switzerland, the U.K. and Italy, and through representatives and distributors elsewhere in the world. Our market strategy is focused on understanding customer requirements and building market awareness and acceptance of our products. New products are continually being produced and sold to our established customers in all markets.
Each of our product lines is responsible for its own worldwide marketing and sales functions, as follows, although certain subsidiaries sell more than one product line:
| – | The Infrared Optics marketing and sales activities are handled through a direct sales force in the U.S. and through our wholly-owned subsidiaries in Japan, Singapore, China, Germany, Belgium, Switzerland, the U.K. and Italy as well as through distributors throughout the rest of the world. |
10
| – | The One Micron Laser marketing and sales activities are handled through a direct sales force in the U.S. and Germany as well as through distributors throughout the rest of the world. |
| – | Each of our subsidiaries in the Near-Infrared Optics segment is responsible for its own worldwide marketing and sales functions, although certain subsidiaries sell more than one product line. However, there is significant cooperation and coordination between our subsidiaries to utilize the most efficient and appropriate marketing channel when addressing these diverse markets. The Near-Infrared Optics segment markets its products through its direct sales force in the U.S., China, Germany and Japan and through distributors throughout the rest of the world. |
| – | The Military Infrared Optics marketing and sales initiative is handled through a direct sales force in the U.S. |
| – | The Materials Processing and Refinement marketing and sales initiative is handled through a direct sales force in the Philippines and occasionally through non-exclusive distribution channels. |
| – | The Thermoelectric Coolers marketing and sales initiative is handled through a direct sales force in the U.S., through our wholly-owned subsidiary in Germany, through direct sales forces co-located in II-VI offices in Japan, Singapore and China as well as through distributors throughout the rest of the world. |
| – | The Silicon Carbide marketing and sales initiative is handled through a direct sales force in the U.S. and at our wholly-owned international subsidiaries. |
Our sales forces develop effective communications with our OEM and end-user customers worldwide. Products are actively marketed through targeted mailings, telemarketing, select advertising, attendance at trade shows and customer partnerships. Our sales forces include a highly-trained team of application engineers to assist customers in designing, testing and qualifying our parts as key components of our customers’ systems. As of June 30, 2010, we employed 196 individuals in sales, marketing and support.
We do business with a number of customers in the defense industry, who in turn generally contract with a governmental entity, typically a U.S. governmental agency. Most governmental programs are subject to funding approval and can be modified or terminated without warning by a legislative or administrative body. The discussion provided in the section on Risk Factors set forth in Item 1A of this Form 10-K related to our exposure to government markets is incorporated herein by reference.
Manufacturing Technology and Processes
As noted in the “Our Strategy” section, many of the products we produce depend on our ability to manufacture and refine technically challenging materials and components. The table below shows these key materials.
| Product Line |
Materials Produced/Refined | |
| •Infrared Optics |
ZnSe and ZnS | |
| •Near-Infrared Optics – VLOC |
YAG, YLF, CaF2 and KNS | |
| •Near-Infrared Optics – Photop |
Nd:YVO4, KTP and BBO | |
| •Military Infrared Optics |
Ge | |
| •Materials Processing and Refinement |
Se and Te | |
| •Thermoelectric Coolers |
Bi2Te 3 | |
| •Silicon Carbide Substrates |
SiC |
11
The ability to produce, process and refine these difficult materials and to control their quality and yields is an expertise of the Company. Processing these materials into finished products is also difficult to accomplish; yet the quality and reproducibility of these products are critical to the performance of our customers’ instruments and systems. In the markets we serve, there are a limited number of suppliers of many of the components we manufacture and there are very few industry-standard products.
Our network of worldwide manufacturing sites allows products to be produced in regions that provide cost-effective advantages and enable proximity to our customers. We employ numerous advanced manufacturing technologies and systems at our manufacturing facilities. These include automated Computer Numeric Control optical fabrication, high throughput thin-film coaters, micro precision metrology and custom-engineered automated furnace controls for the crystal growth processes. Manufacturing products for use across the electro-magnetic spectrum requires the capability to repeatedly produce products with high yields to atomic tolerances. We embody a technology and quality mindset that gives our customers the confidence to utilize our products on a just-in-time basis straight into the heart of their production lines.
Sources of Supply
The major raw materials we use include zinc, selenium, hydrogen selenide, hydrogen sulfide, tellurium, yttrium oxide, aluminum oxide, iridium, platinum, bismuth, silicon, thorium fluoride, antimony, carbon, gallium arsenide, copper, germanium, molybdenum, quartz, optical glass and other materials. Excluding our own production, there are more than two external suppliers for all of the above materials except for ZnSe, ZnS, hydrogen selenide and thorium fluoride, for which there is only one proven source of supply outside of the Company’s capabilities. For many materials, we have entered into purchase arrangements whereby suppliers provide discounts for annual volume purchases in excess of specified amounts.
The continued high-quality of and access to these materials is critical to the stability and predictability of our manufacturing yields. We conduct testing of materials at the onset of the production process. Additional research and capital investment may be needed to better define future starting material specifications. We have not experienced significant production delays due to shortages of materials. However, we do occasionally experience problems associated with vendor-supplied materials not meeting contract specifications for quality or purity. A significant failure of our suppliers to deliver sufficient quantities of necessary high-quality materials on a timely basis could have a materially adverse effect on the results of our operations.
Customers
Our existing customer base for infrared optics including our laser component products consists of over 5,000 customers worldwide. The main groups of customers for these products are as follows:
| • | OEM and system integrators of industrial, medical and military laser systems. Representative customers are Rofin-Sinar Technologies, Trumpf and Bystronic. |
| • | Laser end users who require replacement optics for their existing laser systems. Representative customers are John Deere and Caterpillar. |
| • | Military and aerospace customers who require products for use in advanced targeting, navigation and surveillance. Representative customers are Northrop Grumman and Lockheed-Martin. |
For our one micron laser products, our customers are automotive manufacturers, laser manufacturers and system integrators. Representative customers are Volkswagen, Daimler and Thyssen.
For our near-infrared laser-based optics and crystal products, our customers are OEMs and system integrators of solid-state lasers used in industrial, scientific, military and medical markets. Representative customers include Candela Corporation, Raytheon and Northrop Grumman.
12
For our near-infrared high volume optics and components products our customers are sub-system integrators for telecommunication and data communication and manufacturers of consumer products such as displays and projection devices. Due to the competitive landscape within the telecommunication market and the existence of non-disclosure agreements, the Company is unable to disclose its main customer group.
For our military infrared optics products, our customers are manufacturers of equipment and devices for aerospace, defense and commercial markets. Representative customers include Lockheed-Martin, Raytheon and various U.S. government agencies.
For our materials processing and refining products, our customers are manufacturers and developers of materials for industrial applications, including the manufacturing of steel and glass, the production of animal feeds and fertilizers and the manufacturing of thermo-electric coolers and solar cells. Examples of external customers include Retorte and 5NPlus, Inc., while internal customers are II-VI Infrared and Marlow Industries.
For our thermoelectric products, our customers are manufacturers and developers of equipment and devices for defense and space, telecommunications, medical and industrial, automotive and commercial markets. Representative customers include Raytheon, Beckman Coulter and Bookham Technologies.
For our SiC products, our customers are manufacturers and developers of equipment and devices for high power RF electronics and high power and high voltage switching and power conversion systems for both the U.S. Department of Defense and commercial applications. We are currently dependent on a limited number of key customers for our SiC products.
Competition
We believe that we are a significant producer of products and services in our addressed markets. In the area of infrared laser optics and materials, we believe we are an industry leader. We believe that we are an industry leader in laser material processing tools for high power one micron laser systems. We are a significant supplier of YAG rods and near-infrared laser optics to the worldwide markets for defense, scientific, research, medical and industrial applications. We are a leading photonics designer and integrator of display optics, precision optics and crystal materials for telecommunication applications. We are a leading supplier of infrared optics used in complex military assemblies for targeting, navigation and thermal imaging systems to major military prime contractors. We believe we are a leading supplier of selenium and tellurium products for electronic, agricultural and thermoelectric applications. We believe we are a global leader in the design and manufacturer of TECs and thermal control subsystems. We believe we are a preferred alternative to the leading supplier of single crystal SiC substrates for use in the defense, telecommunication and industrial markets.
We compete on the basis of product technical specifications, quality, delivery time, technical support and pricing. Management believes that we compete favorably with respect to these factors and that our vertical integration, manufacturing facilities and equipment, experienced technical and manufacturing employees and worldwide marketing and distribution provide competitive advantages.
We have a number of present and potential competitors that are larger and have greater financial, selling, marketing or technical resources. Competitors producing infrared laser optics include Sumitomo Electric and Ophir Optronics. Competing producers of automated equipment and laser material processing tools to deliver high power one micron laser systems include Optoskand, Precitec and Laser Mechanisms. Competing producers of YAG materials and optics include Northrop Grumman and CVI Melles Griot. Competing producers of optical communication products include Neophotonics Corp., O-Net Communications Ltd. and OPLINK Communication, Inc. Competing producers of infrared optics for military applications are DRS, Goodrich, Elcan and in-house fabrication and thin film coating capabilities of major military customers, such as Raytheon Corporation. Competing producers of selenium and tellurium metals and chemicals include Umicore and Vital Chemical. Competing producers of TECs include Komatsu, Laird Technologies and Ferrotec. Competing producers of single crystal SiC substrates include Cree, Dow Corning and Nippon Steel.
13
In addition to competitors who manufacture products similar to those we produce, there are other technologies or materials that can compete with our products.
Bookings and Backlog
We define our bookings as customer orders received that are expected to be converted to revenues over the next twelve months. For long-term customer orders, the Company records only those orders which are expected to be converted into revenues within twelve months from the end of the reporting period due to the inherent uncertainty of an order that far in the future. For the year ended June 30, 2010, our bookings, including those bookings converted to revenues prior to year end, were approximately $388 million compared to bookings of approximately $261 million for the year ended June 30, 2009.
We define our backlog as bookings that have not been converted to revenues by the end of the reporting period. Bookings are adjusted if changes in customer demands or production schedules move a delivery beyond twelve months. As of June 30, 2010, our backlog was approximately $157 million compared to approximately $103 million at June 30, 2009. Photop contributed approximately $17 million of backlog as of January 4, 2010, the acquisition date.
Employees
As of June 30, 2010, we employed 6,869 persons worldwide. Of these employees, 617 were engaged in research, development and engineering, 5,461 in direct production (of which 1,251 employees of Photop in Fuzhou, China work under contract manufacturing arrangements for customers of the Company) and the balance of the Company’s employees work in sales and marketing, administration, finance and support services. Our production staff includes highly skilled optical craftsmen. We have a long-standing practice of encouraging active employee participation in areas of operations management. We believe our relations with our employees to be good. We reward our employees with incentive compensation based on achievement of performance goals. 139 employees located in the Philippines are covered under a collective bargaining agreement.
Trade Secrets, Patents and Trademarks
We rely on our trade secrets, proprietary know-how, invention disclosures and patents to help us develop and maintain our competitive position. We have begun to aggressively pursue process and product patents in certain areas of our businesses. We have confidentiality and noncompetition agreements with certain personnel. We require that all U.S. employees sign a confidentiality and noncompetition agreement upon commencement of employment.
The processes and specialized equipment utilized in crystal growth, infrared materials fabrication and infrared optical coatings as developed by us are complex and difficult to duplicate. However, there can be no assurance that others will not develop or patent similar technology or that all aspects of our proprietary technology will be protected. Others have obtained patents covering a variety of infrared optical configurations and processes, and others could obtain patents covering technology similar to our technology. We may be required to obtain licenses under such patents, and there can be no assurance that we would be able to obtain such licenses, if required, on commercially reasonable terms, or that claims regarding rights to technology will not be asserted which may adversely affect our results of operations. In addition, our research and development contracts with agencies of the U.S. Government present a risk that project-specific technology could be disclosed to competitors as contract reporting requirements are fulfilled.
We currently hold several registered tradenames and trademarks including the following:
“II-VI Incorporated(TM)” tradename
“Infraready Optics(TM)” tradename for replacement optics for industrial CO2 lasers
“MP-5(TM) ” tradename for low absorption coating technology
14
“Marlow Industries, Inc.( TM)” tradename
“Marlow Industries, Inc.( TM)” trademark
“Photop Technologies, Inc.(TM)” tradename
| ITEM 1A. | RISK FACTORS |
The Company cautions investors that its performance and, therefore, any forward-looking statement is subject to risks and uncertainties. Various important factors including, but not limited to, the following may cause the Company’s future results to differ materially from those projected in any forward-looking statement.
General Economic Conditions May Adversely Affect Our Business, Operating Results and Financial Condition
Current and future conditions in the economy have an inherent degree of uncertainty. As a result, it is difficult to estimate the level of growth or contraction for the economy as a whole. It is even more difficult to estimate growth or contraction in various parts, sectors and regions of the economy, including industrial, military, medical and telecommunication markets in which we participate. Because all components of our forecasting are dependent upon estimates of growth or contraction in the markets we serve and demand for our products, the prevailing economic uncertainties render estimates of future income and expenditures very difficult to make. In addition, changes in general economic conditions may affect industries in which our customers operate. These changes could include decreases in the rate of consumption or use of our customers’ products due to economic downturn. These conditions may have a material adverse effect on demand for our customers’ product and, in turn, on demand for our products. Adverse changes have occurred and, although we have experienced improvements in worldwide markets and customers’ demand in the second half of fiscal year 2010, may reoccur in the future as a result of declining or flat global or regional economic conditions, fluctuations in currency and commodity prices, wavering confidence, capital expenditure reductions, unemployment, decline in stock markets, contraction of credit availability or other factors affecting economic conditions generally. These changes may negatively affect sales of products, increase exposure to losses from bad debt, increase the cost and availability of financing and increase costs associated with manufacturing and distributing products. Any economic downturn or the failure to sustain the recent recovery from the global economic downturn could have a material adverse effect on our business, results of operations or financial condition.
Our Future Success Depends on International Sales and Management of Global Operations
Sales to customers in countries other than the U.S. accounted for approximately 49%, 44% and 47% of revenues during the years ended June 30, 2010, 2009 and 2008, respectively. We anticipate that international sales will continue to account for a significant portion of our revenues for the foreseeable future. In addition, we manufacture products in Singapore, China, Vietnam, the Philippines and Germany and maintain direct sales offices in Germany, Japan, Switzerland, the U.K., Belgium, Singapore, China and Italy. Sales and operations outside of the U.S. are subject to certain inherent risks, including fluctuations in the value of the U.S. dollar relative to foreign currencies, the current global economic downturn, tariffs, quotas, taxes and other market barriers, political and economic instability, restrictions on the export or import of technology, potentially limited intellectual property protection, difficulties in staffing and managing international operations and potentially adverse tax consequences. There can be no assurance that any of these factors will not have a material adverse effect on our business, results of operations or financial condition. In particular, currency exchange fluctuations in countries where we do business in the local currency could have a material adverse affect on our business, results of operations or financial condition by rendering us less price-competitive than foreign manufacturers. Our sales in Japan are denominated in Yen and, accordingly, are affected by fluctuations in the dollar/Yen currency exchange rates. We generally reduce our exposure to such fluctuations of the Yen through forward exchange agreements which target to hedge approximately 75% of our sales in Japan. We do not engage in the speculative trading of financial derivatives. There can be no assurance, however, that our practices will reduce or eliminate the risk of fluctuation of the U.S. dollar/Japanese Yen exchange rate.
15
There Are Limitations on the Protection of Our Intellectual Property
We rely on a combination of trade secrets, patents, copyright and trademark laws combined with employee noncompetition and nondisclosure agreements to protect our intellectual property rights. There can be no assurance that the steps taken by us will be adequate to prevent misappropriation of our technology or intellectual property. Furthermore, there can be no assurance that third-parties will not assert infringement claims against us in the future. Asserting our intellectual property rights or defending against third-party claims could involve substantial expense, thus materially and adversely affecting our business, results of operations or financial condition. In the event a third-party were successful in a claim that one of our processes infringed its proprietary rights, we could be required to pay substantial damages or royalties, or expend substantial amounts in order to obtain a license or modify processes so that they no longer infringe such proprietary rights, any of which could have a material adverse effect on our business, results of operations or financial condition.
We Depend on Highly Complex Manufacturing Processes Which Require Products from Limited Sources of Supply
We utilize high-quality, optical grade ZnSe in the production of many of our infrared optical products. We are the leading producer of ZnSe for our internal use and for external sale. The production of ZnSe is a complex process requiring a highly controlled environment. A number of factors, including defective or contaminated materials, could adversely affect our ability to achieve acceptable manufacturing yields of high quality ZnSe. ZnSe is available from only one significant outside source whose quantities and quality of ZnSe may be limited. Lack of adequate availability of high quality ZnSe would have a material adverse effect upon us. There can be no assurance that we will not experience manufacturing yield inefficiencies which could have a material adverse effect on our business, results of operations or financial condition.
We produce Hydrogen Selenide gas which is used in our production of ZnSe. There are risks inherent in the production and handling of such material. Our lack of proper handling of Hydrogen Selenide could require us to curtail our production of Hydrogen Selenide. Hydrogen Selenide is available from only one outside source whose quantities and quality may be limited. The cost of purchasing such material is greater than the cost of internal production. As a result, the purchase of a substantial portion of such material from the outside source would increase our ZnSe production costs. Therefore, an inability to internally produce Hydrogen Selenide could have a material adverse effect on our business, results of operations or financial condition.
In addition, we produce and utilize other high purity and relatively uncommon materials and compounds to manufacture our products including, but not limited to ZnS, YAG, YLF, CaF2, KNS, V, Ge, Se, Te, Bi2Te 3 and SiC. A significant failure of our internal production processes or our suppliers to deliver sufficient quantities of these necessary materials on a timely basis could have a material adverse effect on our business, results of operations or financial condition.
Commodity Prices May Adversely Affect our Results of Operations and Financial Condition
We are exposed to a variety of market risks, including the effects of changes in commodity prices. Our PRM business purchases, produces and sells high purity Te, Se and other raw materials based upon quoted market prices from minor metal exchanges. As a result, changes in commodity prices which may not be recovered in our product sales could have a material adverse effect on our business, results of operations or financial condition.
We May Expand Product Lines and Markets by Acquiring Other Businesses
Our business strategy includes expanding our product lines and markets through internal product development and acquisitions. Any acquisition could result in potentially dilutive issuances of equity securities, the incurrence of debt and contingent liabilities and amortization expense related to intangible assets acquired,
16
any of which could have a material adverse effect on our business, results of operations or financial condition. In addition, acquired businesses may be experiencing operating losses. Any acquisition will involve numerous risks, including difficulties in the assimilation of the acquired company’s operations and products, uncertainties associated with operating in new markets and working with new customers and the potential loss of the acquired company’s key personnel.
The following information relates to significant acquisitions made since June 30, 2000.
| Acquired Party |
Year Acquired | Business Segments |
Percentage Ownership as of June 30, 2010 |
||||
| Laser Power Corporation |
Fiscal 2001 | Military & Materials and Infrared Optics | 100 | % | |||
| Silicon Carbide Group of Litton Systems, Inc. |
Fiscal 2002 | Compound Semiconductor Group | 100 | % | |||
| II-VI Deutschland GmbH |
Fiscal 2003 and 2006 |
Infrared Optics and Near-Infrared Optics | 100 | % | |||
| II-VI Suisse S.a.r.l. |
Fiscal 2004 and 2007 |
Infrared Optics | 100 | % | |||
| Ultra-violet Filter Product Line of Coherent, Inc. |
Fiscal 2004 | Near-Infrared Optics | 100 | % | |||
| Marlow Industries, Inc. |
Fiscal 2005 | Compound Semiconductor Group | 100 | % | |||
| Pacific Rare Specialty Metals & Chemicals, Inc. |
Fiscal 2007 | Military & Materials | 98 | % | |||
| HIGHYAG Lasertechnologie GmbH |
Fiscal 2008 | Infrared Optics | 75 | % | |||
| Photop Technologies, Inc. |
Fiscal 2010 | Near-Infrared Optics | 100 | % |
Exposure to Government Markets
With our acquisition of Marlow and the increase in the military portion of our Infrared and Near-Infrared Optics businesses, as well as our continued Military Infrared Optics business, sales to customers in the defense industry have increased and totaled approximately 30% of revenues in the fiscal year ended June 30, 2010. These customers in turn generally contract with a governmental entity, typically a U.S. governmental agency. Most governmental programs are subject to funding approval and can be modified or terminated with no warning upon the determination of a legislative or administrative body. The loss or failure to obtain certain contracts or the loss of a major government customer could have a material adverse effect on our business, results of operations or financial condition.
Some Systems Are Complex in Design and May Contain Defects that Are Not Detected Until Deployed Which Could Increase Our Costs and Reduce Our Revenues
Some systems that utilize our products are inherently complex in design and require ongoing maintenance. As a result of the technical complexity of our products, changes in our or our suppliers’ manufacturing processes or in the use of defective or contaminated materials by us or our suppliers could result in a material adverse effect on our ability to achieve acceptable manufacturing yields and product reliability. To the extent that we do not achieve acceptable yields or product reliability, our business, results of operation, financial condition or customer relationships could be materially adversely affected.
Our customers may discover defects in our products after the products have been fully deployed and operated under peak stress conditions. In addition, some of our products are combined with products from other vendors, which may contain defects. Should problems occur, it may be difficult to identify the source of the problem. If we are unable to fix defects or other problems, we could experience, among other things: loss of
17
customers; increased costs of product returns and warranty expenses; damage to our brand reputation; failure to attract new customers or achieve market acceptance; diversion of development and engineering resources; or legal action by our customers. The occurrence of any one or more of the foregoing factors could have a material adverse effect on our business, results of operations or financial condition.
We May Encounter Substantial Competition
We may encounter substantial competition from other companies in the same market, including established companies with significant resources. Some of our competitors may have financial, technical, marketing or other capabilities more extensive than ours and may be able to respond more quickly than we can to new or emerging technologies and other competitive pressures. We may not be able to compete successfully against our present or future competitors, and competition could have a material adverse effect on our business, results of operations or financial condition.
The Market Price of Our Common Stock Can Be Highly Volatile as the Stock Market in General Can Be Highly Volatile
Factors that could cause fluctuation in the stock price include, among other things, general economic and market conditions; actual or anticipated variations in operating results; changes in financial estimates by securities analysts; our inability to meet or exceed securities analysts’ estimates or expectations; conditions or trends in the industries in which our products are purchased; announcements by us or our competitors of significant acquisitions, strategic partnerships, divestitures, joint ventures or other strategic initiatives; capital commitments; additions or departures of key personnel; and sales of Common Stock.
Many of these factors are beyond our control. These factors could cause the market price of our Common Stock to decline, regardless of our operating performance.
Our Success Depends on Our Ability to Retain Key Personnel
We are highly dependent upon the experience and continuing services of certain scientists, engineers, production and management personnel. Competition for the services of these personnel is intense, and there can be no assurance that we will be able to retain or attract the personnel necessary for our success. The loss of the services of our key personnel could have a material adverse effect on our business, results of operations or financial condition.
A Significant Portion of Our Business is Dependent on Other Cyclical Industries
Our business is significantly dependent on the demand for products produced by end-users of industrial lasers. Many of these end-users are in industries that historically have experienced a highly cyclical demand for their products. As a result, demand for our products is subject to cyclical fluctuations. This cyclical demand could have a material adverse effect on our business, results of operations or financial condition.
Our Success Depends on New Products and Processes
In order to meet our strategic objectives, we must continue to develop, manufacture and market new products, develop new processes and improve existing processes. As a result, we expect to continue to make significant investments in research and development and to continue to consider from time to time the strategic acquisition of businesses, products or technologies complementary to our business. Our success in developing, introducing and selling new and enhanced products depends upon a variety of factors including product selection, timely and efficient completion of product design and development, timely and efficient implementation of manufacturing and assembly processes, effective sales and marketing and product performance in the field. There can be no assurance that we will be able to develop and introduce new products or enhancements to our existing
18
products and processes in a manner which satisfies customer needs or achieves market acceptance. The failure to do so could have a material adverse effect on our ability to grow our business.
Keeping Pace with Key Industry Developments is Essential
We are engaged in industries which will be affected by future developments. The introduction of products or processes utilizing new developments could render existing products or processes obsolete or unmarketable. Our continued success will depend upon our ability to develop and introduce on a timely and cost-effective basis new products, processes and applications that keep pace with developments and address increasingly sophisticated customer requirements. There can be no assurance that we will be successful in identifying, developing and marketing new products, applications and processes and that we will not experience difficulties that could delay or prevent the successful development, introduction and marketing of product or process enhancements or new products, applications or processes, or that our products, applications or processes will adequately meet the requirements of the marketplace and achieve market acceptance. Our business, results of operations and financial condition could be materially and adversely affected if we were to incur delays in developing new products, applications or processes or if we do not gain market acceptance for the same.
Changes in Tax Rates, Tax Liabilities or Tax Accounting Rules Could Affect Future Results
As a global company, we are subject to taxation in the United States and various other countries and jurisdictions. Significant judgment is required to determine worldwide tax liabilities. Our future tax rates could be affected by changes in the composition of earnings in countries with differing tax rates or changes in tax laws. Changes in tax laws or tax rulings may have a significantly adverse impact on our effective tax rate. For example, proposals for fundamental U.S. international tax reform, such as the recent proposals by President Obama’s administration, if enacted, could have a significant adverse impact on our effective tax rate. In addition, we are subject to regular examination of our income tax returns by the Internal Revenue Service and other tax authorities. We regularly assess the likelihood of favorable or unfavorable outcomes resulting from these examinations to determine the adequacy of our provision for income taxes. Although we believe our tax estimates are reasonable, there can be no assurance that any final determination will not be materially different than the treatment reflected in our historical income tax provision and accruals, which could materially and adversely affect our business, results of operation or financial condition.
Declines in the Operating Performance of one of Our Business Segments Could Result in an Impairment of the Segment’s Goodwill
As of June 30, 2010, we had goodwill of approximately $56.1 million on our Consolidated Balance Sheet. We test our goodwill on an annual basis or when an indication of possible impairment exists in order to determine whether the carrying value of our assets is still supported by the fair value of the underlying business. To the extent that it is not, we are required to record an impairment charge to reduce the asset to fair value. A decline in the operating performance of any of our business segments could result in a goodwill impairment charge which could have a material adverse effect on our results of operations or financial condition.
Provisions in our Articles of Incorporation and By-Laws May Limit the Price that Investors May be Willing to Pay in the Future for Shares of Our Common Stock
Our articles of incorporation and by-laws contain provisions which could make us a less attractive target for a hostile takeover or make more difficult or discourage a merger proposal, a tender offer or a proxy contest. Such provisions include: classification of the board of directors into three classes; a procedure which requires shareholders or the board of directors to nominate directors in advance of a meeting to elect such directors; the ability of the board of directors to issue additional shares of Common Stock or preferred stock without shareholder approval; and certain provisions requiring supermajority approval (at least two-thirds of the votes cast by all shareholders entitled to vote thereon, voting together as a single class). In addition, the Pennsylvania
19
Business Corporation Law contains provisions which may have the effect of delaying or preventing a change in our control. All of these provisions may limit the price that investors may be willing to pay for shares of our Common Stock.
We Are Subject to Stringent Environmental Regulation
We use or generate certain hazardous substances in our research and manufacturing facilities. We believe that our handling of such substances is in material compliance with applicable local, state and federal environmental, safety and health regulations at each operating location. We invest substantially in proper protective equipment, process controls and specialized training to minimize risks to employees, surrounding communities and the environment resulting from the presence and handling of such hazardous substances. We regularly conduct employee physical examinations and workplace monitoring regarding such substances. When exposure problems or potential exposure problems have been uncovered, corrective actions have been implemented and re-occurrence has been minimal or non-existent. We do not carry environmental impairment insurance.
Relative to the generation and use of the hazardous substance Hydrogen Selenide, we have in place an emergency response plan. Special attention has been given to all procedures pertaining to this gaseous material to minimize the chances of its accidental release into the atmosphere.
With respect to the manufacturing, use, storage and disposal of the low-level radioactive material Thorium Fluoride, our facilities and procedures have been inspected and licensed by the Nuclear Regulatory Commission. Thorium-bearing by-products are collected and shipped as solid waste to a government-approved low-level radioactive waste disposal site in Clive, Utah.
The generation, use, collection, storage and disposal of all other hazardous by-products, such as suspended solids containing heavy metals or airborne particulates, are believed by us to be in material compliance with regulations. We believe that we have obtained all of the permits and licenses required for operation of our business.
Although we do not know of any material environmental, safety or health problems in our properties or processes, there can be no assurance that problems will not develop in the future which could have a material adverse effect on our business, results of operations or financial condition.
Natural Disasters or Other Global or Regional Catastrophic Events Could Disrupt Our Operations and Adversely Affect Results
Despite our concerted effort to minimize risk to our production capabilities and corporate information systems and to reduce the effect of unforeseen interruptions to us through business continuity planning, we still may be exposed to interruptions due to catastrophe, natural disaster, pandemic, terrorism or acts of war, which are beyond our control. Disruptions to our facilities or systems, or to those of our key suppliers, could also interrupt operational processes and adversely impact our ability to manufacture our products and provide services and support to our customers. As a result, our business, results of operations or financial condition could be materially adversely affected.
Recently Issued Financial Accounting Standards
The Company adopted new U.S. Generally Accepted Accounting Principles (GAAP) guidance related to business combinations beginning in its first quarter of fiscal 2010. Under the new guidance, an entity is required to recognize the assets acquired, liabilities assumed, contractual contingencies, and contingent consideration at their fair value on the acquisition date. It further requires that acquisition-related costs be recognized separately from the acquisition and expensed as incurred; that restructuring costs generally be expensed in periods
20
subsequent to the acquisition date; and that changes in accounting for deferred tax asset valuation allowances and acquired income tax uncertainties after the measurement period be recognized as a component of the provision for income taxes. In addition, acquired in-process research and development is capitalized as an intangible asset and tested for impairment in a manner consistent with goodwill.
The Company adopted new U.S. GAAP guidance related to non-controlling interests in consolidated financial statements beginning in its first quarter of fiscal 2010. The Company’s adoption of this guidance did not have a significant impact on its consolidated financial statements. The provision of these standards was applied prospectively, except for the presentation and disclosure requirements, which were applied retrospectively to all periods presented. The guidance revises accounting and reporting standards for the non-controlling interest in a subsidiary and the accounting for the deconsolidation of a subsidiary. It also clarifies that changes in a parent’s ownership interest in a subsidiary that does not result in deconsolidation are equity transactions if the parent retains its controlling financial interest and requires that a parent recognize a gain or loss in net income when a subsidiary is deconsolidated. The gain or loss is measured using the fair value of the non-controlling equity investment on the deconsolidation date. The guidance also requires expanded disclosures regarding the interest of the parent and the non-controlling interest.
In January 2010, the FASB issued amended standards requiring additional fair value disclosures. The amended standards require disclosures of transfers in and out of Levels 1 and 2 of the fair value hierarchy, as well as requiring gross basis disclosures for purchases, sales, issuances and settlements within the Level 3 reconciliation. Additionally, the update clarifies the requirement to determine the level of disaggregation for fair value measurement disclosures and to disclose valuation techniques and inputs used for both recurring and nonrecurring fair value measurements in either Level 2 or Level 3. The Company adopted the new guidance in the third quarter of fiscal 2010, except for the disclosures related to purchases, sales, issuance and settlements, which will be effective for the Company beginning in the first quarter of fiscal 2012. Because these new standards are related primarily to disclosures, their adoption has not had and is not expected to have a significant impact on the Company’s consolidated financial statements.
In October 2009, the FASB issued Accounting Standards Update 2009-13, “Multiple-Deliverable Revenue Arrangements,” codified in ASC Topic 605. This update provides application guidance on whether multiple deliverables exist, how the deliverables should be separated and how the consideration should be allocated to one or more units of accounting. This guidance establishes a selling price hierarchy for determining the selling price of a deliverable. The selling price used for each deliverable will be based on vendor-specific objective evidence, if available, third-party evidence if vendor-specific objective evidence is not available, or estimated selling price if neither vendor-specific or third-party evidence is available. The Company will be required to apply this guidance prospectively for revenue arrangements entered into or materially modified in the fiscal year beginning on or after June 15, 2010. The Company is currently evaluating the impact that adoption of this guidance will have on the determination or reporting of the company’s financial results for fiscal 2011 and prospectively.
In June 2009, the FASB issued new guidance concerning the determination of the primary beneficiary of a variable interest entity (“VIE”). This new guidance amends current U.S. GAAP by: requiring ongoing reassessments of whether an enterprise is the primary beneficiary of a VIE; amending the quantitative approach previously required for determining the primary beneficiary of the VIE; modifying the guidance used to determine whether an entity is a VIE; adding an additional reconsideration event (e.g. troubled debt restructurings) for determining whether an entity is a VIE; and requiring enhanced disclosures regarding an entity’s involvement with a VIE. This new guidance will be effective for the Company beginning in its first quarter of fiscal 2011, with earlier adoption prohibited. The Company does not expect the impact of this new guidance to be material to its consolidated financial statements.
| ITEM 1B. | UNRESOLVED STAFF COMMENTS |
None.
21
| ITEM 2. | PROPERTIES |
Information regarding our principal United States properties at June 30, 2010 is set forth below:
| Location |
Primary Use(s) | Primary Business Segment(s) |
Square Footage |
Ownership | ||||
| Saxonburg, PA |
Manufacturing, Corporate |
Infrared Optics and Compound Semiconductor Group | 252,000 | Owned | ||||
| Temecula, CA |
Manufacturing and Research and |
Military & Materials | 90,000 | Leased | ||||
| Dallas, TX |
Manufacturing and Research and |
Compound Semiconductor Group | 68,000 | Owned and Leased | ||||
| New Port Richey and Port Richey, FL |
Manufacturing and Research and |
Near-Infrared Optics | 67,000 | Owned | ||||
| Pine Brook, NJ |
Manufacturing and Research and Development |
Compound Semiconductor Group | 19,000 | Leased | ||||
| Starkville, MS |
Manufacturing | Compound Semiconductor Group | 3,000 | Leased | ||||
| Sunnyvale, CA |
Distribution | Near-Infrared Optics | 2,300 | Leased | ||||
| Chatsworth, CA |
Distribution | Near-Infrared Optics | 2,000 | Leased | ||||
| Weatogue, CT |
Distribution | Infrared Optics | 700 | Leased |
Information regarding our principal foreign properties at June 30, 2010 is set forth below:
| Location |
Primary Use(s) | Primary Business Segment(s) |
Square Footage |
Ownership | ||||
| China |
Manufacturing | Infrared Optics, Near-Infrared Optics and Compound Semiconductor Group | 941,000 | Leased | ||||
| Philippines |
Manufacturing | Military & Materials | 226,000 | Leased | ||||
| Vietnam |
Manufacturing | Near-Infrared Optics and Compound Semiconductor Group | 54,000 | Leased | ||||
| Singapore |
Manufacturing | Infrared Optics | 37,000 | Leased | ||||
| Germany |
Manufacturing and Distribution |
Infrared Optics, Near-Infrared Optics and Compound Semiconductor Group | 22,000 | Leased | ||||
| Japan |
Distribution | Infrared Optics, Near-Infrared Optics and Compound Semiconductor Group | 3,000 | Leased | ||||
| Switzerland |
Distribution | Infrared Optics | 3,000 | Leased | ||||
| Belgium |
Distribution | Infrared Optics | 3,000 | Leased | ||||
| United Kingdom |
Distribution | Infrared Optics and Near-Infrared Optics | 3,000 | Leased | ||||
| Italy |
Distribution | Infrared Optics and Near-Infrared Optics | 1,500 | Leased |
22
The square footage listed for each of the above properties represents facility square footage except in the case of the Philippines location which is land only.
| ITEM 3. | LEGAL PROCEEDINGS |
The Company and its subsidiaries are involved in various claims and lawsuits incidental to the business. Each of these matters is subject to various uncertainties, and it is possible that these matters may be resolved unfavorably to the Company. Management believes, after consulting with legal counsel, that the ultimate liabilities, if any, resulting from such legal proceedings will not materially affect the Company’s financial position, liquidity or results of operation.
| ITEM 4. | REMOVED AND RESERVED |
EXECUTIVE OFFICERS OF THE REGISTRANT
The executive officers of the Company and their respective ages and positions are as follows. Each executive officer listed has been appointed by the Board of Directors to serve until removed or until a successor is appointed and qualified. On May 31, 2010, Dr. Carl J. Johnson retired as Chairman (an executive officer position) of the Company . Dr. Johnson remains Chairman of the Company’s Board of Directors.
| Name |
Age | Position | ||
| Francis J. Kramer | 61 | President, Chief Executive Officer and Director | ||
| Craig A. Creaturo | 40 | Chief Financial Officer and Treasurer | ||
| Herman E. Reedy | 67 | Executive Vice President – Infrared Optics | ||
| Vincent D. Mattera, Jr. | 54 | Executive Vice President | ||
| James Martinelli | 52 | Vice President – Military and Materials Businesses |
Francis J. Kramer has been employed by the Company since 1983, has been its President since 1985, and has been its Chief Executive Officer since July 2007. Mr. Kramer has served as a Director of the Company since 1989. Previously, Mr. Kramer served as Chief Operating Officer from 1985 to June 2007. Mr. Kramer joined the Company as Vice President and General Manager of Manufacturing and was named Executive Vice President and General Manager of Manufacturing in 1984. Prior to his employment by the Company, Mr. Kramer was the Director of Operations for the Utility Communications Systems Group of Rockwell International Corp. Mr. Kramer graduated from the University of Pittsburgh with a B.S. degree in Industrial Engineering and from Purdue University with an M.S. degree in Industrial Administration.
Craig A. Creaturo has been employed by the Company since 1998 and has been its Chief Financial Officer since November 2004 and Treasurer since 2000. Previously, Mr. Creaturo served as Chief Accounting Officer, Director of Finance, Accounting and Information Systems and Corporate Controller. Prior to his employment by the Company, Mr. Creaturo was employed by the Pittsburgh, Pennsylvania office of Arthur Andersen LLP from 1992 to 1998 and served in the audit and attestation division with a final position as Audit Manager. Mr. Creaturo graduated from Grove City College with a B.S. degree in Accounting. Mr. Creaturo is a Certified Public Accountant in the Commonwealth of Pennsylvania and is a member of the American Institute of Certified Public Accountants and the Pennsylvania Institute of Certified Public Accountants.
Herman E. Reedy has been employed by the Company since 1977 and has been Executive Vice President – Infrared Optics since February 2003. Previously, Mr. Reedy held positions at the Company as Vice President and General Manager of Quality and Engineering, Manager of Quality and Manager of Components. Prior to his employment by the Company, Mr. Reedy was employed by Essex International, Inc., serving last as Manager, MOS Wafer Process Engineering. Prior to 1973, he was employed by Carnegie Mellon University and previously held positions with SemiElements, Inc. and Westinghouse Electric Corporation. Mr. Reedy is a graduate of the University of Pittsburgh with a B.S. degree in Electrical Engineering.
23
Vincent D. Mattera, Jr., has been employed by the Company since 2004 and has been Executive Vice President since January 2010. Previously, Dr. Mattera was Vice President of Compound Semiconductor Group from 2004 to 2010. Dr. Mattera had served as a Director of the Company from 2000 to 2002. Dr. Mattera had been Vice President, Undersea Optical Transport, Agere Systems (formerly Lucent Technologies, Microelectronics and Communications Technologies Group) since 2001. Previously, Dr. Mattera was Optoelectronic Device Manufacturing and Process Development Vice President with Lucent Technologies, Microelectronics and Communications Technologies Group from 2000 until 2001. He was Director of Optoelectronic Device Manufacturing and Development at Lucent Technologies, Microelectronics Group from 1997 to 2000. From 1995 to 1997 he served as Director, Indium Phosphide Semiconductor Laser Chip Design and Process Development with Lucent Technologies, Microelectronics Group. From 1984 to 1995 he held management positions with AT&T Bell Laboratories. Dr. Mattera holds B.S. and Ph.D. degrees in Chemistry from the University of Rhode Island and Brown University, respectively.
James Martinelli has been employed by the Company since 1986 and has been Vice President – Military & Materials Businesses since February 2003. Previously, Mr. Martinelli served as General Manager of Laser Power Corporation from 2000 to 2003. Mr. Martinelli joined the Company as Accounting Manager in 1986, was named Corporate Controller in 1990 and named Chief Financial Officer and Treasurer in 1994. Prior to his employment by the Company, Mr. Martinelli was Accounting Manager at Tippins Incorporated and Pennsylvania Engineering Corporation from 1980 to 1985. Mr. Martinelli graduated from Indiana University of Pennsylvania with a B.S. degree in Accounting.
24
PART II
| ITEM 5. | MARKET FOR REGISTRANT’S COMMON EQUITY, RELATED STOCKHOLDER MATTERS AND ISSUER PURCHASES OF EQUITY SECURITIES |
The Company’s Common Stock is traded on the Nasdaq Global Select Market under the symbol “IIVI.” The following table sets forth the range of high and low closing sale prices per share of the Company’s Common Stock for the fiscal periods indicated, as reported by Nasdaq.
| High | Low | |||||
| Fiscal 2010 |
||||||
| First Quarter |
$ | 27.75 | $ | 19.42 | ||
| Second Quarter |
$ | 32.86 | $ | 25.09 | ||
| Third Quarter |
$ | 33.84 | $ | 25.58 | ||
| Fourth Quarter |
$ | 37.89 | $ | 29.63 | ||
| Fiscal 2009 |
||||||
| First Quarter |
$ | 47.14 | $ | 34.11 | ||
| Second Quarter |
$ | 37.85 | $ | 15.32 | ||
| Third Quarter |
$ | 20.33 | $ | 15.00 | ||
| Fourth Quarter |
$ | 25.92 | $ | 17.75 | ||
On August 20, 2010, the last reported sale price for the Common Stock was $33.71 per share. As of such date, there were approximately 868 holders of record of the Common Stock. The Company historically has not paid cash dividends and does not anticipate paying cash dividends in the foreseeable future.
During the fiscal year ended June 30, 2009, the Company completed a share repurchase program which was authorized by the Company’s Board of Directors. During this program in the fiscal year ended June 30, 2009, the Company purchased 500,000 shares of its Common Stock for $12.9 million, which was completed in December 2008. As of June 30, 2010 the Company did not have an open stock repurchase program.
The information incorporated by reference in Item 12 of this Form 10-K from our 2010 Proxy Statement under heading “Equity Compensation Plan Information” is hereby incorporated by reference into this Item 5.
25
PERFORMANCE GRAPH
The following graph compares cumulative total stockholder return on the Company’s Common Stock with the cumulative total shareholder return of the companies listed in the Nasdaq Market Index and with a peer group of companies constructed by the Company for the period from June 30, 2005, through June 30, 2010. The Company changed its peer group in fiscal 2010 in order to better reflect comparability in terms of revenue, returns on sales and market capitalization. The prior fiscal year’s peer group consisted of AXT, Inc., Coherent Inc., Cree, Inc. Electro Scientific Industries, Inc., and Rofin-Sinar (“Prior Peer Group”). The new Peer Group now includes Ceradyne, Inc., Cree, Inc., Cymer, Inc., Park Electrochemical Corp., Rofin-Sinar and Rogers Corp.
COMPARISON OF FIVE YEAR CUMULATIVE TOTAL RETURN
AMONG THE COMPANY, THE NASDAQ MARKET INDEX, THE PEER GROUP AND THE PRIOR PEER GROUP
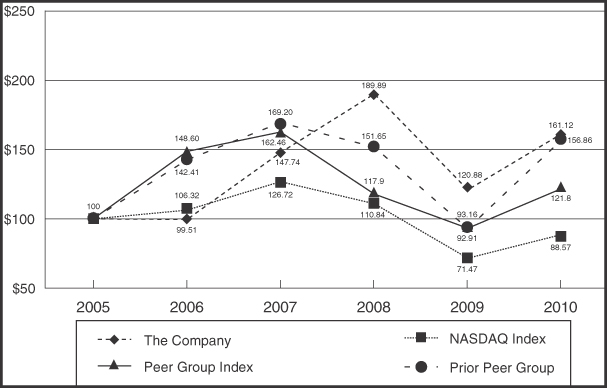
| Base Year 2005 |
2006 | 2007 | 2008 | 2009 | 2010 | |||||||
| The Company |
100.00 | 99.51 | 147.74 | 189.89 | 120.88 | 161.12 | ||||||
| Peer Group Index |
100.00 | 148.60 | 162.46 | 117.9 | 93.16 | 121.8 | ||||||
| Prior Peer Group |
100.00 | 142.41 | 169.20 | 151.65 | 92.91 | 156.86 | ||||||
| NASDAQ Index |
100.00 | 106.32 | 126.72 | 110.84 | 71.47 | 88.57 |
The above graph represents and compares the value, through June 30, 2010, of a hypothetical investment of $100 made at the closing price on June 30, 2005, in each of (i) the Company’s Common Stock, (ii) the Nasdaq Market Index, and (iii) the companies comprising the Peer Group and (iv) the companies comprising the Prior Peer Group and assuming, in each case, the reinvestment of dividends.
26
| ITEM 6. | SELECTED FINANCIAL DATA |
FIVE-YEAR FINANCIAL SUMMARY
The following selected financial data for the five fiscal years presented are derived from II-VI’s audited consolidated financial statements as adjusted to reflect the Company’s eV PRODUCTS business as a discontinued operation for fiscal years 2009 and earlier. The data should be read in conjunction with the consolidated financial statements and the related notes thereto included elsewhere in the annual report.
| Year Ended June 30, | 2010 | 2009 | 2008 | 2007 | 2006 | ||||||||||||||
| (000 except per share data) | |||||||||||||||||||
| Statement of Earnings |
|||||||||||||||||||
| Net revenues from continuing operations |
$ | 345,091 | $ | 292,222 | $ | 316,191 | $ | 254,684 | $ | 223,626 | |||||||||
| Earnings from continuing operations |
$ | 38,735 | $ | 38,911 | $ | 65,698 | $ | 38,442 | $ | 11,089 | |||||||||
| Loss from discontinued operation |
$ | — | $ | (2,077 | ) | $ | (1,425 | ) | $ | (476 | ) | $ | (295 | ) | |||||
| Net earnings attributable to noncontrolling interests |
$ | 158 | $ | 53 | $ | 5 | $ | — | $ | — | |||||||||
| Net earnings attributable to II-VI Incorporated |
$ | 38,577 | $ | 36,781 | $ | 64,268 | $ | 37,966 | $ | 10,794 | |||||||||
| Basic earnings (loss) per share: |
|||||||||||||||||||
| Continuing operations |
$ | 1.28 | $ | 1.31 | $ | 2.21 | $ | 1.31 | $ | 0.38 | |||||||||
| Discontinued operation |
$ | — | $ | (0.07 | ) | $ | (0.05 | ) | $ | (0.02 | ) | $ | (0.01 | ) | |||||
| Consolidated |
$ | 1.28 | $ | 1.24 | $ | 2.16 | $ | 1.29 | $ | 0.37 | |||||||||
| Diluted earnings (loss) per share: |
|||||||||||||||||||
| Continuing operations |
$ | 1.25 | $ | 1.29 | $ | 2.16 | $ | 1.27 | $ | 0.37 | |||||||||
| Discontinued operation |
$ | — | $ | (0.07 | ) | $ | (0.05 | ) | $ | (0.02 | ) | $ | (0.01 | ) | |||||
| Consolidated |
$ | 1.25 | $ | 1.22 | $ | 2.11 | $ | 1.25 | $ | 0.36 | |||||||||
| Diluted weighted average shares outstanding |
30,752 | 30,082 | 30,489 | 30,228 | 29,901 | ||||||||||||||
| Year Ended June 30, | 2010 | 2009 | 2008 | 2007 | 2006 | ||||||||||||||
| ($000) | |||||||||||||||||||
| Balance Sheet |
|||||||||||||||||||
| Working capital |
$ | 215,085 | $ | 198,244 | $ | 179,744 | $ | 110,635 | $ | 84,833 | |||||||||
| Total assets, including assets held for sale |
508,981 | 368,416 | 360,926 | 287,924 | 250,296 | ||||||||||||||
| Long-term debt |
3,384 | 3,665 | 3,791 | 14,940 | 23,614 | ||||||||||||||
| Total debt |
3,384 | 3,665 | 3,791 | 14,995 | 31,167 | ||||||||||||||
| Retained earnings |
295,683 | 257,106 | 220,325 | 158,287 | 120,321 | ||||||||||||||
| Shareholders’ equity |
410,860 | 322,871 | 290,631 | 219,440 | 170,591 | ||||||||||||||
27
| ITEM 7. | MANAGEMENT’S DISCUSSION AND ANALYSIS OF FINANCIAL CONDITION AND RESULTS OF OPERATIONS |
FORWARD-LOOKING STATEMENTS
Certain statements contained in this Management’s Discussion and Analysis of Financial Condition and Results of Operations are forward-looking statements. Forward-looking statements are also identified by words such as “expects,” “anticipates,” “believes,” “intends,” “plans,” “projects,” or similar expressions. Actual results could differ materially from those anticipated in these forward-looking statements for many reasons, including risk factors described in the Risk Factors set forth in this Item 1A, which are incorporated herein by reference.
OVERVIEW
The Company generates revenues, earnings and cash flows from developing, manufacturing and marketing high technology materials and derivative products for precision use in industrial, military, telecommunications, medical and aerospace applications. We also generate revenue, earnings and cash flows from external customers and government funded research and development contracts relating to the development and manufacture of new technologies, materials and products.
Our customer base includes OEMs, laser end users, system integrators of high-power lasers, manufacturers of equipment and devices for the industrial, military, telecommunications and medical markets, and U.S. government prime contractors, various U.S. government agencies and thermo-electric integrators.
CRITICAL ACCOUNTING ESTIMATES
The preparation of financial statements and related disclosures in conformity with accounting principles generally accepted in the United States of America and the Company’s discussion and analysis of its financial condition and results of operations requires the Company’s management to make judgments, assumptions and estimates that affect the amounts reported in its consolidated financial statements and accompanying notes. Note A of the Notes to our Consolidated Financial Statements describes the significant accounting policies and accounting methods used in the preparation of the Company’s consolidated financial statements. Management bases its estimates on historical experience and on various other assumptions that it believes to be reasonable under the circumstances, the results of which form the basis for making judgments about the carrying values of assets and liabilities. Actual results may differ from these estimates.
Management believes the Company’s critical accounting estimates are those related to revenue recognition, allowance for doubtful accounts, warranty reserves, inventory valuation, valuation of long-lived assets including acquired intangibles and goodwill, accrual of bonus and profit sharing estimates, accrual of income tax liability estimates, accounting for share-based compensation and self-insurance for workers’ compensation. Management believes these estimates to be critical because they are both important to the portrayal of the Company’s financial condition and results of operations, and they require management to make judgments and estimates about matters that are inherently uncertain.
Management has discussed the development and selection of these critical accounting estimates with the Audit Committee of the Board of Directors and the Audit Committee has reviewed the foregoing disclosure. In addition, there are other items within our financial statements that require estimation, but are not deemed critical as defined above. Changes in estimates used in these and other items could have a material impact on the financial statements.
The Company recognizes revenues when the criteria of SEC Staff Accounting Bulletin (“SAB 104”) (as defined below) are met. Revenues for product shipments are realizable when we have persuasive evidence of a sales arrangement, the product has been shipped or delivered, the sale price is fixed or determinable and
28
collectability is reasonably assured. Title and risk of loss passes from the Company to its customer at the time of shipment in most cases with the exception of certain customers. For these customers, which represent less than 5% of our consolidated revenues, title does not pass and revenue is not recognized until the customer has received the product at its physical location.
We establish an allowance for doubtful accounts and warranty reserves based on historical experience and believe the collection of revenues, net of these reserves, is reasonably assured. Our allowance for doubtful accounts and warranty reserve balances at June 30, 2010 was approximately $1.1 million and $1.0 million, respectively. Our reserve estimates have historically been proven to be materially correct based upon actual charges incurred.
The Company’s revenue recognition policy is consistently applied across the Company’s segments, product lines and geographical locations. Further, we do not have post shipment obligations such as training or installation, customer acceptance provisions, credits and discounts, rebates and price protection or other similar privileges. Our distributors and agents are not granted price protection. Our distributors and agents, who comprise less than 10% of consolidated revenue, have no additional product return rights beyond the right to return defective products that are covered by our warranty policy. We believe our revenue recognition practices are consistent with SAB 104 – Revenue Recognition in Financial Statements and that we have adequately considered the requirements of Accounting Standards Codification (“ASC”) 605 Revenue Recognition.
Revenues generated from transactions other than product shipments are contract related and have historically accounted for approximately 5% or less of the Company’s consolidated revenues. For this portion of revenues, the Company follows the guidelines of ASC 910 Contractors – Construction for contracts which are related to research and development.
The Company establishes an allowance for doubtful accounts based on historical experience and believes the collection of revenues, net of these reserves, is reasonably assured. The allowance for doubtful accounts is an estimate for potential non-collection of accounts receivable based on historical experience. The Company has not experienced a non-collection of accounts receivable materially affecting its financial position or results of operations as of and for the fiscal years ended June 30, 2010, 2009 and 2008. If the financial condition of the Company’s customers were to deteriorate causing an impairment of their ability to make payments, additional provisions for bad debts may be required in future periods.
The Company records a warranty reserve as a charge against earnings based on a historical percentage of revenues utilizing actual returns over a period that approximates historical warranty experience. If actual returns in the future are not consistent with the historical data used to calculate these estimates, additional warranty reserves could be required.
The Company records a slow moving inventory reserve as a charge against earnings for all products on hand for more than twelve months to eighteen months depending on the products that have not been sold to customers or cannot be further manufactured for sale to alternative customers. An additional reserve is recorded for product on hand that is in excess of product sold to customers over the same periods noted above. If actual market conditions are less favorable than projected, additional inventory reserves may be required.
The Company tests goodwill and indefinite-lived intangible assets on an annual basis for impairment or when events or changes in circumstances indicate that goodwill or indefinite-lived intangible assets might be impaired. Other intangible assets are amortized over their estimated useful lives. The determination of the estimated useful lives of other intangible assets and whether goodwill or indefinite-lived intangibles are impaired involves judgments based upon long-term projections of future performance. Estimates of fair value are based on our projection of revenues, operating costs and cash flows of each reporting unit considering historical and anticipated results, general economic and market conditions. The fair values of the reporting units are determined using a discounted cash flow analysis based on historical and projected financial information as well as market
29
analysis. The carrying value of goodwill at June 30, 2010 and 2009 was $56.1 million and $26.1 million, respectively. The annual goodwill impairment analysis considers the financial projections of the reporting unit based on the most recently completed budgeting and long-term strategic planning processes and also considers the current financial performance compared to the prior projections of the reporting unit. Changes in our financial performance, judgments and projections could result in an impairment of goodwill or indefinite-lived intangible assets.
As a result of the purchase price allocations from our prior acquisitions and due to our decentralized structure, our goodwill is included in multiple reporting units. Due to the cyclical nature of our business, and the other factors described under “Risk Factors” herein, the profitability of our individual reporting units may periodically suffer from downturns in customer demand, operational challenges and other factors. These factors may have a relatively more pronounced impact on the individual reporting units as compared to the Company as a whole, and might adversely affect the fair value of the reporting units. If material adverse conditions occur that impact one or more of our reporting units, our determination of future fair value may not support the carrying amount of one or more of our reporting units, and the related goodwill would need to be written down.
The Company records certain bonus and profit sharing estimates as a charge against earnings. These estimates are adjusted to actual based on final results of operations achieved during the fiscal year. Certain partial bonus amounts are paid quarterly based on interim Company performance, and the remainder is paid after fiscal year end and final determination of the applicable percentage. Other bonuses are paid annually.
The Company prepares and files tax returns based on its interpretation of tax laws and regulations and records estimates based on these judgments and interpretations. In the normal course of business, the Company’s tax returns are subject to examination by various taxing authorities, which may result in future tax, interest, and penalty assessments by these authorities. Inherent uncertainties exist in estimates of many tax positions due to changes in tax law resulting from legislation, regulation and/or as concluded through the various jurisdictions’ tax court systems. The Company recognizes the tax benefit from an uncertain tax position only if it is more likely than not that the tax position will be sustained on examination by the taxing authorities, based on the technical merits of the position. The tax benefits recognized in the financial statements from such a position are measured based on the largest benefit that has a greater than 50 percent likelihood of being realized upon ultimate resolution. The amount of unrecognized tax benefits is adjusted for changes in facts and circumstances. For example, adjustments could result from significant amendments to existing tax law and the issuance of regulations or interpretations by the taxing authorities, new information obtained during a tax examination, or resolution of an examination. The Company believes that its estimates for uncertain tax positions are appropriate and sufficient to pay assessments that may result from examinations of its tax returns. The Company recognizes both accrued interest and penalties related to unrecognized tax benefits in income tax expense.
The Company has recorded valuation allowances against certain of its deferred tax assets, primarily those that have been generated from net operating losses in certain taxing jurisdictions. In evaluating whether the Company would more likely than not recover these deferred tax assets, it has not assumed any future taxable income or tax planning strategies in the jurisdictions associated with these carry-forwards where history does not support such an assumption. Implementation of tax planning strategies to recover these deferred tax assets or future income generation in these jurisdictions could lead to the reversal of these valuation allowances and a reduction of income tax expense.
Accounting Standards Codification (ASC) 718 “Compensation-Stock Compensation” (formerly SFAS No. 123 (revised 2004), (“SFAS 123(R)”) “Share-Based Payment,” The Company recognizes the share-based compensation expense over the requisite service period of the individual grantees, which generally equals the vesting period.
The Company is self-insured for certain losses related to workers’ compensation for its U.S. employees. Additionally, third-party insurance is obtained to limit our exposure to these claims in excess of $0.4 million per
30
occurrence and $1.0 million in the aggregate per policy year. When estimating its self-insurance liability, the Company considers a number of factors, including historical claims experience, demographic and severity factors and valuations provided by independent third party consultants. Periodically, management reviews its assumptions and the valuations to determine the adequacy of its self-insurance liability.
EXECUTIVE SUMMARY
The Company began seeing improvements in its worldwide markets in the second half of fiscal year 2010 resulting in increased customer demand. The acquisition of Photop made positive contributions to both the Company’s top line revenue and bottom line earnings growth. The Company continues to integrate Photop’s operations into the consolidated group and expects continued strong financial results in fiscal year 2011. The Company’s core industrial based segment, Infrared Optics has seen strengthening demand from its industrial based customers as laser machine utilization rates began to increase during the second half of fiscal 2010. The Company is anticipating building on this momentum into fiscal year 2011 by expanding its manufacturing capacity including capital expenditures at the majority of its business units to capitalize on the further strengthening of the worldwide economies.
Fiscal 2010 Compared to Fiscal 2009
RESULTS OF OPERATIONS
Overview (millions except per share data)
| Year Ended June 30, |
% Increase |
||||||||
| 2010 | 2009 | ||||||||
| Bookings |
$ | 387.6 | $ | 261.1 | 48 | % | |||
| Revenues |
345.1 | 292.2 | 18 | % | |||||
| Net earnings attributable to II-VI Incorporated |
38.6 | 36.8 | 5 | % | |||||
| Diluted earnings per share |
1.25 | 1.22 | 2 | % | |||||
The above results include Photop for six of the twelve months ended June 30, 2010 as this acquisition was completed on January 4, 2010.
BOOKINGS Bookings increased 48% to $387.6 million in fiscal year 2010 compared to $261.1 million in fiscal year 2009. Included in bookings for the year ended June 30, 2010 was approximately $59.4 million of bookings from Photop. Excluding Photop, the majority of the Company’s business units realized higher levels of bookings in fiscal year 2010 compared to fiscal year 2009. The Company began seeing improved customer demands during the second half of fiscal year 2010 as worldwide economies began to rebound from their lower levels in the later part of fiscal year 2008 and in fiscal year 2009. In addition to the bookings recorded by Photop, the major factors that contributed to the general increase in bookings include:
| • | Pacific Rare Specialty Metals Company (“PRM”) in the Company’s Military & Materials segment recognized an increase in bookings of over $20 million or 265%. The Company benefited from an increase in demand and pricing for its selenium and tellurium raw materials from its industrial-based customers, especially in China as worldwide industrial markets became more active. |
| • | The Infrared Optics segment experienced an increase in bookings of over $19 million or 17% as a result of increased demand as its customer base began to increase laser machine utilization rates and replenish their inventory levels of spare optic parts. |
31
REVENUES Revenues increased 18% to $345.1 million in fiscal year 2010 compared to $292.2 million in fiscal year 2009. Included in revenues for the year ended June 30, 2010 was approximately $46.9 million of revenues from Photop. Excluding Photop, the increase in revenues during the current year compared to the same period last year was primarily due to increased revenues recognized at the Company’s Military & Materials segment as the Company’s Exotic Electro-Optics (“EEO”) and PRM units each recorded revenue increases in excess of 10%.
NET EARNINGS Net earnings attributable to II-VI Incorporated increased 5% in fiscal year 2010 to $38.6 million ($1.25 per share-diluted) from $36.8 million ($1.22 per share-diluted) in fiscal year 2009. The increase in net earnings attributable to II-VI Incorporated during the current year compared to the same period last fiscal year was primarily the result of the positive contribution of Photop to the Company’s operating results. In addition, incremental margins realized on higher shipment volume at certain of the Company’s business units during the current fiscal year also favorably impacted net earnings. Net earnings were negatively impacted by approximately $5.1 million, pre-tax of increased share-based compensation expense as the Company continues to utilize this form of compensation to incentivize its employees and also used equity compensation for the Photop integration. The Company’s effective income tax rate for the current fiscal year was approximately 24.5% compared to an effective income tax rate of 16% for fiscal 2009. The lower effective income tax rate for fiscal year 2009 was the result of recording a favorable income tax benefit relating to the reversal of approximately $4.7 million of unrecognized income tax benefits.
SEGMENTS Bookings, revenues and segment earnings for the Company’s reportable segments are discussed below. Segment earnings differ from income from operations in that segment earnings excludes certain operational expenses included in other expense – net as reported. Management believes segment earnings to be a useful measure as it reflects the results of segment performance over which management has direct control and is used by management in its evaluation of segment performance. See also Note M to the Company’s Consolidated Financial Statements for further information on the Company’s reportable segments.
Infrared Optics (millions)
| Year Ended June 30, |
% Increase (Decrease) |
||||||||
| 2010 | 2009 | ||||||||
| Bookings |
$ | 139.4 | $ | 119.3 | 17 | % | |||
| Revenues |
135.1 | 130.9 | 3 | % | |||||
| Segment earnings |
24.6 | 28.0 | (12 | )% | |||||
The Company’s Infrared Optics segment includes the combined operations of II-VI Infrared and HIGHYAG.
Bookings for fiscal year 2010 for Infrared Optics increased 17% to $139.4 million from $119.3 million in fiscal year 2009. The increase in bookings in the current fiscal year was driven by improved worldwide industrial product demand as customers began to replenish their relatively low levels of inventory spurred by the global recovery that began during the current year. In particular, bookings from customers in Asia and North America increased approximately 46% and 18%, respectively, in fiscal year 2010 compared to fiscal year 2009 as low power OEMs are seeing increased demand in new laser systems for marking, engraving and material processing.
Revenues for fiscal year 2010 for Infrared Optics increased 3% to $135.1 million from $130.9 million in fiscal year 2009. The improvement in revenues during the current fiscal year is the result of increased shipments to the segment’s high and low power CO2 laser optics aftermarket customers in the second half of fiscal year
32
2010 as higher laser machine utilization rates drove demand for replacement parts and replenishment of spare parts inventory.
Segment earnings for fiscal year 2010 for Infrared Optics decreased 12% to $24.6 million from $28.0 million in fiscal year 2009. The decrease in segment earnings during the current fiscal year compared to the same period last year was primarily due to increased share-based compensation expense recorded in the current year of approximately $3.3 million.
Near-Infrared Optics (millions)
| Year Ended June 30, |
% Increase |
||||||||
| 2010 | 2009 | ||||||||
| Bookings |
$ | 105.6 | $ | 37.8 | 180 | % | |||
| Revenues |
88.5 | 45.6 | 94 | % | |||||
| Segment earnings |
12.3 | 7.1 | 73 | % | |||||
The Company’s Near-Infrared Optics segment includes the combined operations of VLOC Incorporated and Photop. The above results include Photop for six of the twelve months ended June 30, 2010 as this acquisition was completed in January 2010.
Bookings for fiscal year 2010 for Near-Infrared Optics increased 180% to $105.6 million from $37.8 million in fiscal year 2009. Included in bookings for the year ended June 30, 2010 was approximately $59.4 million of bookings from Photop. Excluding Photop, bookings increased during the current fiscal year primarily due to the timing of receipt of its UV Filter product orders compared to the timing of the order receipt in fiscal year 2009. In addition, the segment recorded higher YAG bookings in the current fiscal year due to increased demand from its industrial-and medical-based customers located in China and Germany.
Revenues for fiscal year 2010 for Near-Infrared Optics increased 94% to $88.5 million compared to $45.6 million in fiscal year 2009. Included in revenues for the year ended June 30, 2010 was approximately $46.9 million of revenues from Photop. Excluding Photop, revenues decreased due to the continued planned reduction in the shipment volume of the Company’s UV Filter product line as a result of reduced demand from the Company’s military customers. In addition, the segment also realized lower external contract revenues in the current fiscal year due to the delay in the receipt of a contract in the current year.
Segment earnings for fiscal year 2010 for Near-Infrared Optics increased 73% to $12.3 million from $7.1 million in fiscal year 2009. The increase in segment earnings for the current fiscal year compared to the same period last year was due primarily to the inclusion of Photop’s operating results. The increase in segment earnings related to Photop were somewhat offset by lower profitability due to reduced shipment volumes of the UV Filter product line.
Military & Materials (millions)
| Year Ended June 30, |
% Increase |
||||||||
| 2010 | 2009 | ||||||||
| Bookings |
$ | 79.0 | $ | 50.0 | 58 | % | |||
| Revenues |
65.7 | 57.0 | 15 | % | |||||
| Segment earnings |
9.3 | 6.5 | 43 | % | |||||
The Company’s Military & Materials segment includes the combined operations of EEO and PRM.
33
Bookings for fiscal year 2010 for Military & Materials increased 58% to $79.0 million from $50.0 million in fiscal year 2009. The increase in bookings in the current fiscal year compared to the same period last year was primarily the result of increased product demand at PRM, which saw its bookings level increase by over three-fold from the prior fiscal year. PRM benefited from an increase in demand and pricing for its selenium and tellurium raw materials from its industrial-based customers, especially in China, as worldwide industrial markets became more active. In addition, higher market-index pricing for these two raw materials also contributed to the increased booking levels. EEO experienced a 14% increase in bookings in the current fiscal year compared to the same period last year as a result of the Company’s continued expansion of its sapphire product line for the Joint Strike Fighter Program.
Revenues for fiscal year 2010 for Military & Materials increased 15% to $65.7 million compared to $57.0 million in fiscal year 2009. The increase in revenues in the current fiscal year compared to the prior fiscal year was due to revenue improvements at both EEO and PRM. EEO realized increased revenues due to increased volume of shipments of its sapphire product line. PRM contributed to the segment’s revenue increase as PRM began benefitting from the increasing worldwide industrial demand for both selenium used in glass and steel manufacturing and tellurium utilized in the photovoltaic industry.
Segment earnings for fiscal year 2010 for Military & Materials increased 43% to $9.3 million from $6.5 million in fiscal year 2009. The improvement in segment earnings in the current year was primarily due to incremental margins realized on increased revenues at both EEO and PRM. In addition, PRM’s margins were favorably impacted as a result of the sale of ancillary materials such as gold and silver which carry a higher profit margin than the PRM’s main products.
Compound Semiconductor Group (millions)
| Year Ended June 30, |
% Increase (Decrease) |
||||||||
| 2010 | 2009 | ||||||||
| Bookings |
$ | 63.5 | $ | 54.1 | 17 | % | |||
| Revenues |
55.9 | 58.7 | (5 | )% | |||||
| Segment earnings |
5.5 | 6.2 | (11 | )% | |||||
The Compound Semiconductor Group includes the combined operations of Marlow, the Wide Bandgap Group (“WBG”) and the Worldwide Materials Group (“WMG”).
Bookings for fiscal year 2010 from the Compound Semiconductor Group increased 17% to $63.5 million from $54.1 million in fiscal year 2009. The increase in bookings in the current fiscal year compared to the same period last year was due to increased bookings at Marlow, which has benefited from increased product demand from the majority of its markets, including defense, telecom, consumer and medical markets as customers introduced new products which require thermoelectric cooling and/or power generation technology. In addition, during the fourth quarter of fiscal year 2010, Marlow booked $2.0 million of a contract from a government agency for the development of advanced cooling modules for military applications.
Revenues for fiscal year 2010 from the Compound Semiconductor Group decreased 5% to $55.9 million compared to $58.7 million in fiscal year 2009. The decrease in revenues in the current fiscal year compared to the same period last year was the result of lower shipments at Marlow due to lower demand from industrial-based customers as a result of the general economic stagnation that existed during the first-half of fiscal year 2010. The lower revenues at Marlow were partially offset by increased revenue volume at WBG as the Company’s product portfolio continues to gain commercial acceptance from its customer base.
Segment earnings for fiscal year 2010 for the Compound Semiconductor Group decreased 11% to $5.5 million from $6.2 million in fiscal year 2009. The decrease in segment earnings for the current fiscal year
34
compared to the same period last year was primarily the result of the lower shipment volume at Marlow primarily as a result of the general economic environment that Marlow encountered during the first half of the current fiscal year relating to its industrial-based customers.
Costs and Expenses
Manufacturing gross margin, which is defined as net domestic and international revenue less cost of goods sold, for fiscal year 2010 was $131.7 million or 39% of revenues compared to $113.1 million or 40% of revenues in fiscal year 2009. The increase in manufacturing gross margin stated in dollars for fiscal 2010 compared to the same period last fiscal year was due to increased revenues recorded by the Company. Gross margin percentage decreased during the current fiscal year as a result of the inclusion of Photop which has lower gross margin levels in comparison to the Company’s historical margins.
Contract research and development gross margin, which is calculated as contract research and development revenues less contract research and development expense, for fiscal year 2010 was $2.9 million or 29% of revenues compared to contract research and development gross margin of $3.0 million or 28% of revenues for fiscal year 2009. During fiscal year 2010, the Company recorded $0.6 million less in contract revenues compared to the prior fiscal year as a result of external delays in the awarding of the contracts from the various government agencies. The higher gross margin for fiscal year 2010 despite lower contract revenues compared to the prior year was the result of a more favorable mix of contracts related to defense and military programs which historically have higher profit margins.
Company-funded internal research and development expenses for fiscal year 2010 were $11.8 million or 3% of total revenues compared to $10.2 million or 3% of total revenues for fiscal year 2009. The increase in Company-funded internal research and development expense in relative dollars in the current fiscal year compared to the same period last year is primarily the result of the inclusion of the research and development activities at Photop.
Selling, general and administrative expenses for the fiscal year 2010 were $71.1 million or 21% of revenues compared to $58.1 million or 20% of revenues for the same period last fiscal year. The increase in the dollar amount of selling general and administration expense for the current fiscal year compared to the same period last fiscal year was due the addition of Photop as well as higher worldwide bonus expense resulting from improved operating profitability in the current fiscal year as well as increased levels of share-based compensation expense.
Interest expense for fiscal year 2010 was $0.1 million compared to $0.2 million for fiscal year 2009. The low level of interest expense is the result of the Company having relatively low levels of debt outstanding for the fiscal years 2010 and 2009.
Other expense for fiscal 2010 was $0.3 million compared to other expense of $1.3 million for fiscal year 2009. Other expense for fiscal year 2010 consisted of foreign currency losses of $2.9 million due to the weakening of the Euro, which resulted in unrealized foreign currency losses for certain U.S. dollar denominated obligations at several of the Company’s international subsidiaries. Foreign currency losses during the current fiscal year was partially offset by other income including equity earnings from the Company’s investments, interest income on excess cash reserves and unrealized gains on the Company’s deferred compensation plan. Other expense for fiscal 2009 consisted of foreign currency losses offset by equity earnings from the Company’s equity investments and interest income on excess cash reserves.
The Company’s effective income tax rate for fiscal year 2010 was 24.5% compared to an effective income tax rate of 16.0% for fiscal year 2009. The lower income tax rate in fiscal year 2009 was the result of the Company recording a favorable income tax benefit of approximately $4.7 million relating to the reversal of unrecognized tax benefits resulting from the completion of the Internal Revenue Service’s examination of certain of the Company’s federal income tax returns.
35
Fiscal 2009 Compared to Fiscal 2008
RESULTS OF CONTINUING OPERATIONS
Overview (millions except per share data)
| Year Ended June 30, |
% Decrease |
||||||||
| 2009 | 2008 | ||||||||
| Bookings |
$ | 261.1 | $ | 345.3 | (24 | )% | |||
| Revenues |
292.2 | 316.2 | (8 | )% | |||||
| Net earnings |
36.8 | 64.3 | (43 | )% | |||||
| Diluted earnings per share |
1.22 | 2.11 | (42 | )% | |||||
BOOKINGS Bookings from continuing operations decreased 24% to $261.1 million in fiscal year 2009 compared to $345.3 million in fiscal year 2008. The majority of the Company’s business segments realized lower bookings in fiscal year 2009 compared to fiscal year 2008. The Company’s business segments were negatively impacted by the overall challenging macro-economic environment that began during the Company’s fiscal year 2009. The major factors that contributed to this overall decline in bookings include:
| • | The Infrared Optics segment recorded a decrease in bookings of $20.5 million or 26% in fiscal year 2009 compared to the prior fiscal year due to a downturn in the industrial markets brought on by the worldwide economic recession. |
| • | The Near-Infrared Optics segment, as previously announced, has continued to ramp down its UV Filter product line as a result of reduced demand from its military customer. UV Filter bookings declined $21.6 million or 76% from its order rate for this product line in fiscal year 2008. |
| • | PRM in the Company’s Military & Materials segment recognized a decrease in bookings of $4.0 million or 64% due to market price volatility for its two main raw materials, Selenium and Tellurium which impacted the product requirements. |
Somewhat buffering the overall decrease in the Company’s bookings during fiscal year 2009 was the increase in military and defense orders at the majority of the Company’s segments as its military product offerings were being introduced into more key military programs.
The Company’s order backlog at June 30, 2009 of $103 million decreased 23% during fiscal year 2009 compared to the prior fiscal year as a result of the general economic slowdown, whereby the Company experienced significant slowdown in its order run rate.
REVENUES Revenues from continuing operations decreased 8% to $292.2 million in fiscal year 2009 compared to $316.2 million in fiscal year 2008. The primary reasons for the revenue decrease was a lower volume of shipments from the Infrared Optics segment resulting from a lowering demand from the segments industrial based customers as a result of the deterioration of the worldwide economy. In addition, the Company’s Near-Infrared Optic’s UV Filter product line recognized approximately $10 million less revenue in fiscal year 2009 compared to the prior fiscal year as this product line continued to ramp down. The overall decrease in revenues was partially offset by increased revenue volumes at the Company’s EEO and Marlow operations relating to increased shipment volume of military and defense related product offerings.
NET EARNINGS Net earnings attributable to II-VI Incorporated decreased 43% in fiscal year 2009 to $36.8 million ($1.22 per share-diluted) from $64.3 million ($2.11 per share-diluted) in fiscal year 2008. During fiscal year 2008 the Company sold its equity investment in 5NPlus, Inc. for $30.2 million in cash, on which it recorded an after-tax gain of $15.9 million ($0.52 per share-diluted). In addition to the gain on 5NPlus,
36
Inc. in fiscal year 2008, the decrease in earnings was primarily due to less incremental margin recognized on the lower volume of revenues. The Company also incurred $1.0 million more in share-based compensation expense in fiscal year 2009 compared to the prior fiscal year. Offsetting the net earnings in fiscal year 2009 was the lower effective income tax rate resulting from the Company recording a favorable income tax benefit of approximately $4.7 million in accordance with FIN 48 relating to the reversal of unrecognized tax benefits from the completion of an Internal Revenue Service examination of certain of the Company’s Federal income tax returns.
SEGMENTS Bookings, revenues and segment earnings for the Company’s reportable segments are discussed below. Segment earnings differ from income from operations in that segment earnings excludes certain operational expenses included in other expense – net as reported. Management believes segment earnings to be a useful measure as it reflects the results of segment performance, over which management has direct control and is used by management in its evaluation of segment performance. See also Note M to the Company’s Consolidated Financial Statements for further information on the Company’s reportable segments.
Infrared Optics (millions)
| Year Ended June 30, |
% Decrease |
||||||||
| 2009 | 2008 | ||||||||
| Bookings |
$ | 119.3 | $ | 161.7 | (26 | )% | |||
| Revenues |
130.9 | 151.9 | (14 | )% | |||||
| Segment earnings |
28.0 | 36.2 | (23 | )% | |||||
The Company’s Infrared Optics segment includes the combined operations of II-VI Infrared and HIGHYAG. The results of operations include HIGHYAG for only six months of fiscal year 2008, as this acquisition was completed in January 2008.
Bookings for fiscal year 2009 for Infrared Optics decreased 26% to $119.3 million from $161.7 million in fiscal year 2008. The decrease in bookings for fiscal year 2009 compared to the prior fiscal year was due to the weakness in the worldwide industrial markets as a result of the worldwide economic recession. Based on data received from our customers we believe that laser system utilization within these markets decreased approximately 50% from the prior year, which in turn lowered demand for the segment’s replacement optics. In addition, bookings from high power laser OEMs in Japan and Europe decreased significantly as these customers continued to consume their existing inventory and face lower product demand due to decreased laser utilization rates and less new laser manufacturing. Offsetting somewhat the significant decrease in bookings in fiscal year 2009 was an increase in bookings from the segment’s military and ZnSe and ZnS materials customers, which experienced a 40% increase in orders compared to the prior fiscal year.
Revenues for fiscal year 2009 for Infrared Optics decreased 14% to $130.9 million from $151.9 million in fiscal year 2008. The decrease in revenues for fiscal year 2009 compared to the prior fiscal year was due to lower shipment volume to OEMs and aftermarket customers worldwide. This lower shipment volume began during the Company’s second fiscal quarter of 2009 and was the direct result of the general deterioration of the industrial markets brought on by the global macroeconomic environment.
Segment earnings for fiscal year 2009 for Infrared Optics decreased 23% to $28.0 million from $36.2 million in fiscal year 2008. The decrease in segment earnings in fiscal year 2009 compared to the prior fiscal year was primarily due to the reduction of margin realized on the segment’s lower shipment volume. In addition, the segment recorded approximately $1.0 million more of share-based compensation expense during fiscal year 2009 compared to the prior fiscal year. The segment reduced its operating cost structure to align it with lower product demands.
37
Near-Infrared Optics (millions)
| Year Ended June 30, |
% Decrease |
||||||||
| 2009 | 2008 | ||||||||
| Bookings |
$ | 37.8 | $ | 65.9 | (43 | )% | |||
| Revenues |
45.6 | 58.7 | (22 | )% | |||||
| Segment earnings |
7.1 | 11.9 | (40 | )% | |||||
Bookings for fiscal year 2009 for Near-Infrared Optics decreased 43% to $37.8 million from $65.9 million in fiscal year 2008. The decrease in bookings for fiscal 2009 compared to the prior fiscal year was due primarily to the anticipated reduction in the order rates of the segment’s UV Filter product line, which experienced a $21.6 million reduction in orders compared to the prior fiscal year. In addition to the decrease for the UV Filter product line, the segment also experienced a decrease in orders from its industrial and medical customers in fiscal year 2009 as demand for these product lines was negatively impacted by the economic downturn. Somewhat offsetting the overall bookings decline during the fiscal year 2009 was an increase in military orders.
Revenues for fiscal year 2009 for Near-Infrared Optics decreased 22% to $45.6 million compared to $58.7 million in the prior fiscal year. The decrease in revenues for fiscal 2009 compared to the prior fiscal year was primarily due to the reduction in the shipment rates of the UV Filter product line. The revenue decrease was somewhat offset by increased non-UV Filter military product shipments during fiscal year 2009.
Segment earnings for fiscal year 2009 for Near-Infrared Optics decreased 40% to $7.1 million from $11.9 million in fiscal year 2008. The deterioration in segment earnings in fiscal year 2009 compared to the prior fiscal year was the result of a reduction in margin realized on less revenues from its UV Filter, industrial and medical product lines. In addition, segment earnings were also negatively impacted by a $0.8 million write-off of certain equipment of its UV Filter product line due to reduction in certain product demands.
Military & Materials (millions)
| Year Ended June 30, |
% Increase/ (Decrease) |
||||||||
| 2009 | 2008 | ||||||||
| Bookings |
$ | 50.0 | $ | 61.9 | (19 | )% | |||
| Revenues |
57.0 | 50.5 | 13 | % | |||||
| Segment earnings |
6.5 | 7.1 | (8 | )% | |||||
The Company’s Military & Materials segment includes the combined operations of EEO and PRM.
Bookings for fiscal year 2009 for Military & Materials decreased 19% to $50.0 million from $61.9 million in fiscal year 2008. The decrease in bookings for fiscal 2009 compared to the prior fiscal year was the result of lower booking levels at the segment’s PRM operation. During the fiscal year 2009, the market price of selenium and tellurium experienced lower volatility as a result of lower industrial demand for these two materials which are used in the manufacture of steel, glass and automobiles. The lower booking level at PRM was partially offset by increased military bookings at EEO in fiscal year 2009 compared to the prior fiscal year as a result of increased military orders for the Company’s sapphire and core military product lines. During the current fiscal year, EEO’s bookings increased 27% compared to the prior year, driven by increased orders of Advanced Targeting Pod (“ATP”) Sniper Shrouds and sapphire windows for the Joint Strike Fighter (“JSF”) Electro Optical Targeting System program.
38
Revenues for fiscal year 2009 for Military & Materials increased 13% to $57.0 million compared to $50.5 million in fiscal year 2008. The increase in revenues in the fiscal year 2009 compared to the same period in the prior fiscal year was primarily due to increased military shipments of EEO’s sapphire and core military product lines.
Segment earnings for fiscal year 2009 for Military & Materials decreased 8% to $6.5 million from $7.1 million in fiscal year 2008. The decrease in segment earnings in fiscal year 2009 despite an increase in revenues was primarily due to a decline in fiscal year 2009 of market pricing of selenium and tellurium resulting in a lower of cost or market write-down of inventories of approximately $1.5 million. The decrease in segment earnings was somewhat offset by earnings improvements at EEO resulting from incremental margin realized on the increased sales volume in fiscal year 2009 as well as continued improved operational performance.
Compound Semiconductor Group (millions)
| Year Ended June 30, |
% Increase (Decrease) |
||||||||
| 2009 | 2008 | ||||||||
| Bookings |
$ | 54.1 | $ | 55.8 | (3 | )% | |||
| Revenues |
58.7 | 55.1 | 7 | % | |||||
| Segment earnings |
6.2 | 6.5 | (5 | )% | |||||
The Compound Semiconductor Group includes the combined operations of Marlow, the Wide Bandgap Group (“WBG”) and the Worldwide Materials Group (“WMG”).
Bookings for fiscal year 2009 from the Compound Semiconductor Group decreased 3% to $54.1 million from $55.8 million in fiscal year 2008. The decrease in bookings in fiscal year 2009 compared to the prior fiscal year was primarily due to a one-time large booking from an industrial customer of Marlow which was received during the prior fiscal year. The decrease in bookings was partially offset by a receipt of a $5.2 million U.S. Department of Defense research and development contract booking during fiscal year 2009 at WBG focusing on SiC material growth.
Revenues for fiscal year 2009 from the Compound Semiconductor Group increased 7% to $58.7 million compared to $55.1 million in fiscal year 2008. The increase in revenues in fiscal year 2009 compared to prior fiscal year was due to increased shipment volume at Marlow to its customers in the defense and medical industries.
Segment earnings for fiscal year 2009 for the Compound Semiconductor Group decreased 5% to $6.2 million from $6.5 million in fiscal year 2008. The decrease in segment earnings during fiscal year 2009 compared to the prior fiscal year was due primarily to reduced external contract revenue in fiscal year 2009 at WBG. In addition, WMG, which assists the Company’s research and development efforts, increased its developmental efforts on certain material-based research projects, thereby incurring more expense than in the prior year.
Costs and Expenses
Manufacturing gross margin, which is defined as net domestic and international revenue less cost of goods sold was $113.1 million for fiscal year 2009, or 40% of revenues, compared to $127.4 million or 42% of revenues in fiscal year 2008. The decrease in manufacturing gross margin for fiscal 2009 compared to the prior fiscal year was due to several factors including lower margin on reduced revenues, primarily in the Infrared Optics and Near-Infrared Optics business segments which realized 14% and 22% less revenue, respectively, during the fiscal year 2009 compared to the prior fiscal year. PRM experienced lower manufacturing gross
39
margin due to write-downs of their selenium and tellurium raw material inventory to lower of cost or market based upon the general decline in the market price of these commodities. In addition, Near-Infrared Optics wrote-off approximately $0.8 million of certain equipment of its UV Filter product line due to continued reduction in product demand.
Contract research and development gross margin, which is calculated as contract research and development revenues less contract research and development expense was $3.0 million for fiscal year 2009, or 28% of revenues compared to a contract gross margin of $2.8 million or 23% of revenues for fiscal year 2008. The improvement in contact gross margin during fiscal year 2009 compared to the prior fiscal year was due to several factors including the mix of contracts to higher margin contracts as well as favorable contract cost rate adjustments initiated during the second half of fiscal year 2009. The contract research and development revenues and costs were a result of research and development efforts in the Near-Infrared Optics, Military & Materials and the Compound Semiconductor Group segments and was a blend of cost plus fixed fee, cost reimbursement and fixed fee contract activities.
Company-funded internal research and development expenses were $10.2 million for fiscal year 2009, or 3% of total revenues compared to $7.7 million or 2% of total revenues for fiscal year 2008. The increase in internal research and development expense during fiscal year 2009 compared to the prior fiscal year was due to increased internal research and development activities at the Company’s Infrared Optics, Military & Materials and Compound Semiconductor Group segments. These operations have been focusing their internal development on improving material yields and quality process controls as well as new product and technology development.
Selling, general and administrative expenses were $58.1 million for the fiscal year 2009, or 20% of revenues compared to $60.8 million or 19% of revenues for the prior fiscal year. The decrease in the dollar amount of selling general and administration expense for fiscal year 2009 compared to the prior fiscal year was due to certain costs reductions initiated by the Company to align its cost structure with the decreased revenue levels brought on by the current economic environment.
Interest expense was $0.2 million for fiscal year 2009 and was comparable to fiscal year 2008. The low level of interest expense is the result of the Company having relatively low levels of debt outstanding for the fiscal years 2009 and 2008.
Other expense was $1.4 million for fiscal year 2009, compared to other income of $2.7 million for fiscal year 2008. Other expense for fiscal 2009 consisted of foreign currency losses of $2.7 million due to the unfavorable movement of the U.S. dollar relative to the Company’s foreign subsidiaries’ functional currencies including the Euro, Japanese Yen and the British Pound. The foreign currency losses during fiscal year 2009 were partially offset against equity earnings from the Company minority interest in Fuxin Electronic Technology of $1.0 million and interest income of $0.7 million on excess cash reserves. Other income for the fiscal year 2008 primarily consisted of foreign currency gains realized of $1.1 million as well as interest income of $1.4 million from excess cash reserves.
During the fiscal year 2008, the Company sold its equity investment in 5NPlus for $30.2 million in cash on which it recorded a pre-tax gain of $26.5 million.
The Company’s effective income tax rate for fiscal year 2009 was 16.0% compared to an effective income tax rate of 27.5% for fiscal year 2008. The lower income tax rate in fiscal year 2009 was the result of the Company recording a favorable income tax benefit of approximately $4.7 million in accordance with FIN 48 relating to the reversal of unrecognized tax benefits resulting from the completion of the Internal Revenue Service’s examination of certain of the Company’s federal income tax returns. In addition, the Company reduced income tax expense by reversing $1.1 million of a deferred income tax valuation allowance related to foreign tax credit carry forwards as a result of an identified tax planning strategy. These benefits were partially offset by increased income tax expense of $0.9 million at certain of the Company’s foreign locations. The higher effective
40
income tax rate for the fiscal year 2008 was primarily due to the U.S. income taxes on the gain from the sale of the equity investment.
Discontinued Operation
In June 2009, the Company sold its x-ray and gamma-ray radiation business, eV PRODUCTS, Inc. for approximately $5.2 million in cash. The Company recognized a $2.0 million loss on the sale net of a $1.2 million income tax benefit. Included in the loss were transaction costs of approximately $1.2 million. Results for this business for the year ended June 30, 2009 and 2008 were revenues of $8.8 million and $7.2 million, respectively, and loss before income taxes of $3.3 million including a pre-tax loss on disposal of $3.2 million for June 30, 2009 compared to a loss before income taxes of $2.3 million for the year ended June 30, 2008.
LIQUIDITY AND CAPITAL RESOURCES
Historically, our primary source of cash has been provided through operations and long-term borrowings. Other sources of cash include proceeds received from the exercise of stock options and sale of equity investment. Our historical uses of cash have been for capital expenditures, purchases of businesses, payment of principal and interest on outstanding debt obligations and purchases of treasury stock. Supplemental information pertaining to our sources and uses of cash is presented as follows:
Sources (uses) of Cash (millions):
| Year Ended June 30, |
||||||||||||
| 2010 | 2009 | 2008 | ||||||||||
| Net cash provided by operating activities |
$ | 72.4 | $ | 48.8 | $ | 45.8 | ||||||
| Proceeds from exercise of stock options |
2.6 | 1.8 | 3.8 | |||||||||
| Purchase of business, net of cash acquired |
(45.6 | ) | – | – | ||||||||
| Additions to property, plant and equipment |
(13.8 | ) | (15.6 | ) | (17.9 | ) | ||||||
| Net payments on debt obligations |
(0.6 | ) | (0.5 | ) | (11.7 | ) | ||||||
| Purchases of treasury stock |
– | (12.9 | ) | (5.9 | ) | |||||||
| Investment in unconsolidated businesses |
(4.8 | ) | (4.9 | ) | – | |||||||
Cash Provided by Operating Activities:
Cash provided by operating activities was $72.4 million and $48.8 million for the fiscal years ended June 30, 2010 and 2009, respectively. The increase in cash provided by operating activities for fiscal year 2010 compared to the same period last year was due to improved working capital management relating to the Company’s inventory, accounts payable and accrued other current liabilities during the current fiscal year. In addition, cash provided by operations was also favorably impacted by the favorable operating results of Photop.
Cash provided by operating activities was $48.8 million and $45.5 million for the fiscal years ended June 30, 2009 and 2008, respectively. The increase in cash from continuing operations for fiscal year 2009 despite the lower earnings was the result of significant improvements in the level of working capital, principally related to the collection of our accounts receivable and lower net cash tax payments made during fiscal year 2009.
Cash (used in) provided by investing activities:
Cash used in investing activities was $65.1 million and $18.3 million for the fiscal years ended June 30, 2010 and 2009, respectively. The increase in cash used by investing activities in the current fiscal year compared to the same period last year was primarily the result of the Company’s cash consideration paid for its acquisition of Photop in the amount of $45.6 million.
41
Cash (used in) provided by investing activities was $(18.3) million and $7.1 million for the fiscal years ended June 30, 2009 and 2008, respectively. The increase in cash used by investing activities in fiscal year 2009 compared to the prior year was primarily the result of the Company receiving $30.2 million of proceeds from the sale of its equity investment in fiscal year 2008. During fiscal year 2009, the Company purchased $15.6 million of capital expenditures compared to $17.9 million in fiscal year 2008. The reduction in capital expenditure in fiscal year 2009 was a strategic decision to slow down capital investments due to a slowdown of the Company’s general business activities as a result of the worldwide economic recession encountered in fiscal year 2009. In addition, during fiscal year 2009, the Company increased its minority investment in Fuxin Electronic Technology by $4.9 million.
Cash provided by (used in) financing activities:
Cash provided by financing activities was $3.0 million for the year ended June 30, 2010 and cash used in financing activities was $(10.3) million for the year ended June 30, 2009. During fiscal year 2010, cash generated from financing activities included $3.6 million in proceeds from exercise of stock options and excess tax benefits from share-based compensation expense offset by $0.6 million of payments made on the Company’s Yen loan. During fiscal year 2009, the Company repurchased approximately $12.9 million of treasury stock.
Cash used in financing activities was $10.3 million and $9.7 million for the years ended June 30, 2009 and 2008, respectively. During fiscal years 2009 and 2008, the Company repurchased treasury stock of $12.9 million and $5.9 million, respectively. Net debt payments were $0.5 million and $11.7 million for fiscal years 2009 and 2008, respectively. Cash used in financing activities was offset by proceeds from the exercise of stock options and excess tax benefits from share-based compensation expense.
The Company’s credit facility is a $60.0 million line of credit which, under certain conditions, may be expanded to $100.0 million. The credit facility has a five-year term through October 2011 and has interest rates ranging from LIBOR plus 0.50% to LIBOR plus 1.25%. Additionally, the facility is subject to certain covenants, including those relating to minimum interest coverage and maximum leverage ratios. The weighted average interest rate of borrowings was 2.2% for the fiscal years ended June 30, 2010 and 2009, respectively. The Company had $59.1 million and $59.3 million available under its line of credit as of June 30, 2010 and 2009, respectively.
Our cash position, borrowing capacity and debt obligations are as follows (in millions):
| Year Ended June 30, | ||||||
| 2010 | 2009 | |||||
| Cash and cash equivalents |
$ | 108.0 | $ | 95.9 | ||
| Additional borrowing capacity under existing credit facility |
59.1 | 59.3 | ||||
| Total debt obligations |
3.4 | 3.7 | ||||
The Company believes cash flow from operations, existing cash reserves and available borrowing capacity will be sufficient to fund its working capital needs, capital expenditures and internal and external growth for fiscal 2011.
OFF-BALANCE SHEET ARRANGEMENTS
The Company’s off-balance sheet arrangements include the Operating Lease Obligations and the Purchase Obligations disclosed in the contractual obligations table below as well as letters of credit as discussed in Note H to the Company’s Consolidated Financial Statements. The Company enters into these off-balance sheet arrangements to acquire goods and services used in its business.
42
TABULAR DISCLOSURE OF CONTRACTUAL OBLIGATIONS
| Payments Due By Period | |||||||||||||||
| Contractual Obligations | Total | Less Than 1 Year |
1-3 Years |
3-5 Years |
More Than 5 Years | ||||||||||
| ($000’s) Long-Term Debt Obligations |
$ | 3,384 | $ | – | $ | 3,384 | $ | – | $ | – | |||||
| Interest Payments(1) |
187 | 75 | 112 | – | – | ||||||||||
| Capital Lease Obligations |
– | – | – | – | – | ||||||||||
| Operating Lease Obligations(2) |
31,094 | 4,547 | 5,509 | 3,953 | 17,085 | ||||||||||
| Purchase Obligations(3) |
29,966 | 20,540 | 9,426 | – | – | ||||||||||
| Other Long-Term Liabilities Reflected on the Registrant’s Balance Sheet |
– | – | – | – | – | ||||||||||
| Total |
$ | 64,631 | $ | 25,162 | $ | 18,431 | $ | 3,953 | $ | 17,085 | |||||
| (1) | Variable rate interest obligations are based on the interest rate in effect at June 30, 2010. |
| (2) | Includes obligations for the use of two parcels of land related to PRM. The lease obligations extend through years 2039 and 2056. |
| (3)A | “purchase obligation” is defined as an agreement to purchase goods or services that is enforceable and legally binding on the Company and that specifies all significant terms, including fixed or minimum quantities to be purchased; fixed, minimum, or variable price provisions; and the approximate timing of the transaction. These amounts are primarily comprised of open purchase order commitments to vendors for the purchase of supplies and materials and unpaid purchase price and contingent earnouts for the Company’s recent acquisitions of HIGHYAG and Photop and its investment in Langfang Haobo Diamond Co., Ltd. |
The gross unrecognized income tax benefits at June 30, 2010 which are excluded from the above table are $4.5 million. The Company is not able to reasonably estimate how the liability will increase or decrease over time.
| ITEM 7A. | QUANTITATIVE AND QUALITATIVE DISCLOSURES ABOUT MARKET RISK |
MARKET RISKS
The Company is exposed to market risks arising from adverse changes in foreign currency exchange rates and interest rates. In the normal course of business, the Company uses a variety of techniques and derivative financial instruments as part of its overall risk management strategy primarily focused on its exposure to the Japanese Yen. No significant changes have occurred in the techniques and instruments used other than those described below.
In addition, the Company has transactions denominated in Euros and Pounds Sterling. As a result of the Company’s hedging activities discussed below, changes in the foreign currency exchange rates of these currencies did not have a material impact on the results of operations for fiscal 2010.
Foreign Exchange Risks
In the normal course of business, the Company enters into foreign currency forward exchange contracts with its financial institutions. The purpose of these contracts is to hedge ordinary business risks regarding foreign currencies on product sales. Foreign currency exchange contracts are used to limit transactional exposure to changes in currency rates. The Company enters into foreign currency forward contracts that permit it to sell specified amounts of foreign currencies expected to be received from its export sales for pre-established U.S. dollar amounts at specified dates. The forward contracts are denominated in the same foreign currencies in which export sales are denominated. These contracts provide the Company with an economic hedge in which settlement
43
will occur in future periods and which otherwise would expose the Company to foreign currency risk. The Company monitors its positions and the credit ratings of the parties to these contracts. While the Company may be exposed to potential losses due to risk in the event of non-performance by the counterparties to these financial instruments, it does not anticipate such losses.
The Company entered into a low interest rate Yen loan with PNC Bank in an effort to minimize the foreign currency exposure in Japan. A change in the interest rate of 1% for this Yen loan would have had an immaterial impact to interest expense and a 10% change in the Yen to U.S. dollar exchange rate would have changed revenues in the range from a decrease of approximately $1.8 million to an increase of approximately $2.1 million for the year ended June 30, 2010.
For II-VI Singapore Pte., Ltd. and its subsidiaries, II-VI Suisse S.a.r.l., and Pacific Rare Specialty Metals & Chemicals, Inc., the functional currency is the U.S. dollar. Gains and losses on the remeasurement of the local currency financial statements are included in net earnings. Foreign currency gains (losses) were $(0.2) million, $0.5 million and $1.0 million for the years ended June 30, 2010, 2009 and 2008, respectively.
For all other foreign subsidiaries, the functional currency is the local currency. Assets and liabilities of those operations are translated into U.S. dollars using the period-end exchange rate while income and expenses are translated using the average exchange rates for the reporting period. Translation adjustments are recorded as accumulated other comprehensive income within shareholders’ equity.
Interest Rate Risks
As of June 30, 2010, the Company’s total borrowings of $3.4 million were from a loan denominated in Japanese Yen. As such, the Company is exposed to changes in interest rates. A change in the interest rate of 1% would not have a material impact for the fiscal year ended June 30, 2010.
44
| ITEM 8. | FINANCIAL STATEMENTS AND SUPPLEMENTARY DATA |
MANAGEMENT’S REPORT ON INTERNAL CONTROL OVER FINANCIAL REPORTING
Management’s Responsibility for Preparation of the Financial Statements
Management is responsible for the preparation of the financial statements included in the annual report on Form 10-K. The financial statements were prepared in accordance with the accounting principles generally accepted in the United States of America and include amounts that are based on the best estimates and judgments of management. The other financial information contained in this annual report is consistent with the financial statements.
Management’s Report on Internal Control Over Financial Reporting
Management is responsible for establishing and maintaining adequate internal control over financial reporting. The Company’s internal control system is designed to provide reasonable assurance concerning the reliability of the financial data used in the preparation of the Company’s financial statements, as well as reasonable assurance with respect to safeguarding the Company’s assets from unauthorized use or disposition.
All internal control systems, no matter how well designed, have inherent limitations. Therefore, even those systems determined to be effective can provide only reasonable assurance with respect to financial statement presentation and other results of such systems.
Management conducted an evaluation of the effectiveness of the Company’s internal control over financial reporting as of June 30, 2010. In making this evaluation, management used the criteria set forth by the Committee of Sponsoring Organizations of the Treadway Commission (COSO) in Internal Control — Integrated Framework. Management’s evaluation included reviewing the documentation of its controls, evaluating the design effectiveness of controls and testing their operating effectiveness. Management has excluded from the scope of its assessment of internal control over financial reporting the operations and related assets of Photop Technologies, Inc. (Photop) which II-VI acquired on January 4, 2010. At June 30, 2010 and for the period ending January 4, 2010 through June 30, 2010, the total assets and total revenues subject to Photop constituted $134.9 million and $46.9 million, respectively for the year then ended. Based on the evaluation, management concluded that as of June 30, 2010, the Company’s internal controls over financial reporting were effective and provides reasonable assurance that the accompanying financial statements do not contain any material misstatement.
Ernst & Young LLP, an independent registered public accounting firm, has issued their report on the effectiveness of our internal control over financial reporting which also excluded the financial reporting controls associated with Photop as of June 30, 2010. Their report is included herein.
45
Report of Independent Registered Public Accounting Firm
The Board of Directors and Shareholders of II-VI Incorporated and Subsidiaries:
We have audited II-VI Incorporated and Subsidiaries’ internal control over financial reporting as of June 30, 2010, based on criteria established in Internal Control — Integrated Framework issued by the Committee of Sponsoring Organizations of the Treadway Commission (the COSO criteria). II-VI Incorporated and Subsidiaries’ management is responsible for maintaining effective internal control over financial reporting, and for its assessment of the effectiveness of internal control over financial reporting included in the accompanying Management’s Report on Internal Control over Financial Reporting. Our responsibility is to express an opinion on the Company’s internal control over financial reporting based on our audit.
We conducted our audit in accordance with the standards of the Public Company Accounting Oversight Board (United States). Those standards require that we plan and perform the audit to obtain reasonable assurance about whether effective internal control over financial reporting was maintained in all material respects. Our audit included obtaining an understanding of internal control over financial reporting, assessing the risk that a material weakness exists, testing and evaluating the design and operating effectiveness of internal control based on the assessed risk, and performing such other procedures as we considered necessary in the circumstances. We believe that our audit provides a reasonable basis for our opinion.
A company’s internal control over financial reporting is a process designed to provide reasonable assurance regarding the reliability of financial reporting and the preparation of financial statements for external purposes in accordance with generally accepted accounting principles. A company’s internal control over financial reporting includes those policies and procedures that (1) pertain to the maintenance of records that, in reasonable detail, accurately and fairly reflect the transactions and dispositions of the assets of the company; (2) provide reasonable assurance that transactions are recorded as necessary to permit preparation of financial statements in accordance with generally accepted accounting principles, and that receipts and expenditures of the company are being made only in accordance with authorizations of management and directors of the company; and (3) provide reasonable assurance regarding prevention or timely detection of unauthorized acquisition, use or disposition of the company’s assets that could have a material effect on the financial statements.
Because of its inherent limitations, internal control over financial reporting may not prevent or detect misstatements. Also, projections of any evaluation of effectiveness to future periods are subject to the risk that controls may become inadequate because of changes in conditions, or that the degree of compliance with the policies or procedures may deteriorate.
As indicated in the accompanying Management’s Report on Internal Control Over Financial Reporting, management’s assessment of and conclusion on the effectiveness of internal control over financial reporting did not include the internal controls of Photop Technologies, Inc. which is included in the 2010 consolidated financial statements of II-VI Incorporated and Subsidiaries and constituted $134.9 million of total assets and $46.9 million of revenues, respectively, for the year then ended. Our audit of internal control over financial reporting of II-VI Incorporated and Subsidiaries also did not include an evaluation of the internal control over financial reporting of Photop Technologies, Inc.
In our opinion, II-VI Incorporated and Subsidiaries maintained, in all material respects, effective internal control over financial reporting as of June 30, 2010, based on the COSO criteria.
We also have audited, in accordance with the standards of the Public Company Accounting Oversight Board (United States), the consolidated balance sheets of II-VI Incorporated and Subsidiaries as of June 30, 2010 and 2009, and the related consolidated statements of earnings, shareholders’ equity, comprehensive income, and cash flows for each of the three years in the period ended June 30, 2010 of II-VI Incorporated and Subsidiaries and our report dated August 27, 2010, expressed an unqualified opinion thereon.
/s/ Ernst & Young LLP
Pittsburgh, Pennsylvania
August 27, 2010
46
Report of Independent Registered Public Accounting Firm
The Board of Directors and Shareholders of II-VI Incorporated and Subsidiaries:
We have audited the accompanying consolidated balance sheets of II-VI Incorporated and Subsidiaries as of June 30, 2010 and 2009, and the related consolidated statements of earnings, shareholders’ equity, comprehensive income, and cash flows for each of the three years in the period ended June 30, 2010. Our audits also included the financial statement schedule listed in the Index at Item 15(a). These financial statements and schedule are the responsibility of the Company’s management. Our responsibility is to express an opinion on these financial statements and schedule based on our audits.
We conducted our audits in accordance with the standards of the Public Company Accounting Oversight Board (United States). Those standards require that we plan and perform the audit to obtain reasonable assurance about whether the financial statements are free of material misstatement. An audit includes examining, on a test basis, evidence supporting the amounts and disclosures in the financial statements. An audit also includes assessing the accounting principles used and significant estimates made by management, as well as evaluating the overall financial statement presentation. We believe that our audits provide a reasonable basis for our opinion.
In our opinion, the financial statements referred to above present fairly, in all material respects, the consolidated financial position of II-VI Incorporated and Subsidiaries at June 30, 2010 and 2009, and the consolidated results of their operations and their cash flows for each of the three years in the period ended June 30, 2010, in conformity with U.S. generally accepted accounting principles. Also, in our opinion, the related financial statement schedule, when considered in relation to the basic consolidated financial statements taken as a whole, presents fairly in all material respects the information set forth therein.
We also have audited, in accordance with the standards of the Public Company Accounting Oversight Board (United States), II-VI Incorporated and Subsidiaries’ internal control over financial reporting as of June 30, 2010, based on criteria established in Internal Control-Integrated Framework issued by the Committee of Sponsoring Organizations of the Treadway Commission and our report dated August 27, 2010 expressed an unqualified opinion thereon.
/s/ Ernst & Young LLP
Pittsburgh, Pennsylvania
August 27, 2010
47
II-VI INCORPORATED AND SUBSIDIARIES
CONSOLIDATED BALANCE SHEETS
| June 30, | 2010 | 2009 | ||||
| ($000) |
||||||
| Current Assets |
||||||
| Cash and cash equivalents |
$ | 108,026 | $ | 95,930 | ||
| Accounts receivable – less allowance for doubtful accounts of $1,081 and $1,029, respectively |
78,624 | 43,109 | ||||
| Inventories |
81,397 | 76,620 | ||||
| Deferred income taxes |
5,382 | 6,022 | ||||
| Prepaid and refundable income taxes |
4,294 | 3,780 | ||||
| Prepaid and other current assets |
10,547 | 4,943 | ||||
| Total Current Assets |
288,270 | 230,404 | ||||
| Property, plant and equipment, net |
117,937 | 86,413 | ||||
| Goodwill |
56,088 | 26,141 | ||||
| Other intangible assets, net |
24,995 | 12,271 | ||||
| Investments |
15,269 | 9,548 | ||||
| Deferred income taxes |
3,029 | 37 | ||||
| Other assets |
3,393 | 3,602 | ||||
| Total Assets |
$ | 508,981 | $ | 368,416 | ||
| Current Liabilities |
||||||
| Accounts payable |
$ | 21,347 | $ | 9,242 | ||
| Accrued salaries and wages |
10,429 | 5,510 | ||||
| Accrued bonuses |
11,210 | 5,925 | ||||
| Accrued profit sharing contribution |
2,946 | 2,985 | ||||
| Accrued income tax payable |
7,510 | 1,109 | ||||
| Deferred income taxes |
83 | 97 | ||||
| Other accrued liabilities |
19,660 | 7,292 | ||||
| Total Current Liabilities |
73,185 | 32,160 | ||||
| Long-term debt |
3,384 | 3,665 | ||||
| Deferred income taxes |
6,195 | 1,947 | ||||
| Unrecognized tax benefits |
4,530 | 2,818 | ||||
| Other liabilities |
10,827 | 4,955 | ||||
| Total Liabilities |
98,121 | 45,545 | ||||
| Commitments and Contingencies |
||||||
| Shareholders’ Equity |
||||||
| Preferred stock, no par value; authorized – 5,000,000 shares; none issued |
— | — | ||||
| Common Stock, no par value; authorized – 100,000,000 shares; issued – 34,121,281 shares and 32,764,874 shares, respectively |
139,311 | 89,700 | ||||
| Accumulated other comprehensive income |
4,008 | 3,862 | ||||
| Retained earnings |
295,683 | 257,106 | ||||
| 439,002 | 350,668 | |||||
| Treasury stock at cost, 3,242,470 shares and 3,228,962 shares, respectively |
28,649 | 28,292 | ||||
| Total II-VI Incorporated Shareholders’ Equity |
410,353 | 322,376 | ||||
| Noncontrolling Interests |
507 | 495 | ||||
| Total Shareholders’ Equity |
410,860 | 322,871 | ||||
| Total Liabilities and Shareholders’ Equity |
$ | 508,981 | $ | 368,416 | ||
See Notes to Consolidated Financial Statements.
48
II-VI INCORPORATED AND SUBSIDIARIES
CONSOLIDATED STATEMENTS OF EARNINGS
| Year Ended June 30, | 2010 | 2009 | 2008 | ||||||||
| ($000 except per share data) |
|||||||||||
| Revenues Net sales: |
|||||||||||
| Domestic |
$ | 165,518 | $ | 153,830 | $ | 154,980 | |||||
| International |
169,730 | 127,928 | 148,922 | ||||||||
| Contract research and development |
9,843 | 10,464 | 12,289 | ||||||||
| Total Revenues |
345,091 | 292,222 | 316,191 | ||||||||
| Costs, Expenses and Other Expense (Income) |
|||||||||||
| Cost of goods sold |
203,535 | 168,615 | 176,541 | ||||||||
| Contract research and development |
6,957 | 7,489 | 9,444 | ||||||||
| Internal research and development |
11,806 | 10,205 | 7,734 | ||||||||
| Selling, general and administrative |
71,112 | 58,068 | 60,810 | ||||||||
| Interest expense |
87 | 178 | 242 | ||||||||
| Other expense (income), net |
277 | 1,349 | (2,759 | ) | |||||||
| Gain on sale of equity investment |
— | — | (26,455 | ) | |||||||
| Total Costs, Expenses and Other Expense (Income) |
293,774 | 245,904 | 225,557 | ||||||||
| Earnings from Continuing Operations Before Income Taxes |
51,317 | 46,318 | 90,634 | ||||||||
| Income taxes |
12,582 | 7,407 | 24,936 | ||||||||
| Earnings from Continuing Operations |
38,735 | 38,911 | 65,698 | ||||||||
| Loss from Discontinued Operation, Net of Income Tax Benefit |
— | (2,077 | ) | (1,425 | ) | ||||||
| Net Earnings |
38,735 | 36,834 | 64,273 | ||||||||
| Less: Net Earnings Attributable to Noncontrolling Interests |
158 | 53 | 5 | ||||||||
| Net Earnings Attributable to II-VI Incorporated |
$ | 38,577 | $ | 36,781 | $ | 64,268 | |||||
| Net Earnings (Loss) Attributable to II-VI Incorporated: Basic |
|||||||||||
| Continuing operations |
$ | 1.28 | $ | 1.31 | $ | 2.21 | |||||
| Discontinued operation |
$ | — | $ | (0.07 | ) | $ | (0.05 | ) | |||
| Consolidated |
$ | 1.28 | $ | 1.24 | $ | 2.16 | |||||
| Net Earnings (Loss) Attributable to II-VI Incorporated: Diluted Earnings (Loss) Per Share: |
|||||||||||
| Continuing operations |
$ | 1.25 | $ | 1.29 | $ | 2.16 | |||||
| Discontinued operation |
$ | — | $ | (0.07 | ) | $ | (0.05 | ) | |||
| Consolidated |
$ | 1.25 | $ | 1.22 | $ | 2.11 | |||||
See Notes to Consolidated Financial Statements.
49
II-VI INCORPORATED AND SUBSIDIARIES
CONSOLIDATED STATEMENTS OF SHAREHOLDERS’ EQUITY
| Common Stock | Accumulated Other Comprehensive Income |
Retained Earnings |
Treasury Stock | Non-controlling Interest |
Total | |||||||||||||||||||||||
| Shares | Amount | Shares | Amount | |||||||||||||||||||||||||
| Balance – July 1, 2007 |
32,092 | $ | 68,670 | $ | 939 | $ | 158,287 | (2,509 | ) | $ | (8,456 | ) | $ | — | $ | 219,440 | ||||||||||||
| Cumulative effect of adoption of FIN48 |
— | — | — | (2,230 | ) | — | — | — | (2,230 | ) | ||||||||||||||||||
| Shares issued under stock incentive plans |
514 | 3,764 | — | — | — | — | — | 3,764 | ||||||||||||||||||||
| Net earnings |
— | — | — | 64,268 | — | — | 5 | 64,273 | ||||||||||||||||||||
| Purchase of treasury stock |
— | — | — | — | (187 | ) | (5,865 | ) | — | (5,865 | ) | |||||||||||||||||
| Treasury stock in deferred compensation plan |
— | 1,039 | — | — | (32 | ) | (1,039 | ) | — | — | ||||||||||||||||||
| Other comprehensive income, net of tax |
— | — | 2,671 | — | — | — | — | 2,671 | ||||||||||||||||||||
| Share-based compensation expense |
— | 3,980 | — | — | — | — | — | 3,980 | ||||||||||||||||||||
| Excess tax benefit under |
— | 4,132 | — | — | — | — | — | 4,132 | ||||||||||||||||||||
| Noncontrolling interest acquired |
— | — | — | — | — | — | 466 | 466 | ||||||||||||||||||||
| Other comprehensive income (loss), Noncontrolling interest |
— | — | (34 | ) | — | — | — | 34 | — | |||||||||||||||||||
| Balance – June 30, 2008 |
32,606 | $ | 81,585 | $ | 3,576 | $ | 220,325 | (2,728 | ) | $ | (15,360 | ) | $ | 505 | $ | 290,631 | ||||||||||||
| Shares issued under stock incentive plans |
159 | 1,798 | — | — | — | — | — | 1,798 | ||||||||||||||||||||
| Net earnings |
— | — | — | 36,781 | — | — | 53 | 36,834 | ||||||||||||||||||||
| Purchase of treasury stock |
— | — | — | — | (500 | ) | (12,880 | ) | — | (12,880 | ) | |||||||||||||||||
| Treasury stock in deferred compensation plan |
— | 52 | — | — | (1 | ) | (52 | ) | — | — | ||||||||||||||||||
| Other comprehensive income, net of tax |
— | — | 223 | — | — | — | — | 223 | ||||||||||||||||||||
| Share-based compensation expense |
— | 4,951 | — | — | — | — | — | 4,951 | ||||||||||||||||||||
| Excess tax benefit under |
— | 1,314 | — | — | — | — | — | 1,314 | ||||||||||||||||||||
| Other comprehensive income (loss), Noncontrolling interest |
— | — | 63 | — | — | — | (63 | ) | — | |||||||||||||||||||
| Balance – June 30, 2009 |
32,765 | $ | 89,700 | $ | 3,862 | $ | 257,106 | (3,229 | ) | $ | (28,292 | ) | $ | 495 | $ | 322,871 | ||||||||||||
| Shares issued under stock incentive plans |
210 | 2,637 | — | — | — | — | — | 2,637 | ||||||||||||||||||||
| Net earnings |
— | — | — | 38,577 | — | — | 158 | 38,735 | ||||||||||||||||||||
| Shares issued for acquisition of business |
1,146 | 36,851 | — | — | — | — | — | 36,851 | ||||||||||||||||||||
| Treasury stock in deferred compensation plan |
— | 357 | — | — | (13 | ) | (357 | ) | — | — | ||||||||||||||||||
| Other comprehensive income, net of tax |
— | — | 126 | — | — | — | — | 126 | ||||||||||||||||||||
| Share-based compensation expense |
— | 8,790 | — | — | — | — | — | 8,790 | ||||||||||||||||||||
| Excess tax benefit under |
— | 976 | — | — | — | — | — | 976 | ||||||||||||||||||||
| Distribution of Noncontrolling interest |
— | — | — | — | — | — | (126 | ) | (126 | ) | ||||||||||||||||||
| Other comprehensive income, Noncontrolling interest |
— | — | 20 | — | — | — | (20 | ) | — | |||||||||||||||||||
| Balance – June 30, 2010 |
34,121 | $ | 139,311 | $ | 4,008 | $ | 295,683 | (3,242 | ) | $ | (28,649 | ) | $ | 507 | $ | 410,860 | ||||||||||||
See Notes to Consolidated Financial Statements.
50
II-VI INCORPORATED AND SUBSIDIARIES
CONSOLIDATED STATEMENTS OF COMPREHENSIVE INCOME
| Year Ended June 30, | 2010 | 2009 | 2008 | ||||||
| ($000) Net earnings attributable to II-VI Incorporated |
$ | 38,577 | $ | 36,781 | $ | 64,268 | |||
| Other comprehensive income: |
|||||||||
| Foreign currency translation adjustments, net of income taxes of $47, $47 and $985, respectively |
126 | 223 | 2,671 | ||||||
| Comprehensive Income |
$ | 38,703 | $ | 37,004 | $ | 66,939 | |||
See Notes to Consolidated Financial Statements.
51
II-VI INCORPORATED AND SUBSIDIARIES
CONSOLIDATED STATEMENTS OF CASH FLOWS
| Year Ended June 30, | 2010 | 2009 | 2008 | |||||||||
| Cash Flows from Operating Activities |
||||||||||||
| Net earnings |
$ | 38,735 | $ | 36,834 | $ | 64,273 | ||||||
| Adjustments to reconcile net earnings to net cash provided by operating activities: |
||||||||||||
| Loss from discontinued operation, net of tax |
— | 2,077 | 1,425 | |||||||||
| Depreciation |
19,127 | 14,068 | 14,157 | |||||||||
| Amortization |
1,912 | 1,286 | 1,367 | |||||||||
| Share-based compensation expense |
8,790 | 4,951 | 3,980 | |||||||||
| Gain on sale of equity investment |
— | — | (26,455 | ) | ||||||||
| Loss (gain) on foreign currency remeasurements and transactions |
2,951 | 2,693 | (1,089 | ) | ||||||||
| Net loss on disposals of property, plant and equipment |
576 | 927 | 696 | |||||||||
| Deferred income taxes |
(951 | ) | (3,851 | ) | (292 | ) | ||||||
| Excess tax benefits from share-based compensation expense |
(976 | ) | (1,314 | ) | (4,132 | ) | ||||||
| Earnings from equity investments |
(375 | ) | (1,031 | ) | — | |||||||
| Dividends from equity investments |
462 | — | 366 | |||||||||
| Increase (decrease) in cash from changes in: |
||||||||||||
| Accounts receivable |
(23,447 | ) | 9,355 | (6,487 | ) | |||||||
| Inventories |
2,657 | (7,106 | ) | (7,170 | ) | |||||||
| Accounts payable |
6,488 | (7,269 | ) | 234 | ||||||||
| Income taxes payable |
6,459 | 2,381 | (547 | ) | ||||||||
| Accrued other current liabilities |
10,294 | (6,719 | ) | 3,183 | ||||||||
| Other operating net assets |
(282 | ) | 1,553 | 2,313 | ||||||||
| Net cash provided by operating activities: |
||||||||||||
| Continuing operations |
72,420 | 48,835 | 45,822 | |||||||||
| Discontinued operation |
— | 78 | 460 | |||||||||
| Net cash provided by operating activities |
72,420 | 48,913 | 46,282 | |||||||||
| Cash Flows from Investing Activities |
||||||||||||
| Proceeds from sale of equity investment |
— | — | 30,236 | |||||||||
| Proceeds from sales of property, plant and equipment |
186 | 45 | 53 | |||||||||
| Additions to property, plant and equipment |
(13,837 | ) | (15,557 | ) | (17,855 | ) | ||||||
| Purchases of businesses, net of cash acquired |
(45,600 | ) | — | (2,387 | ) | |||||||
| Investments in unconsolidated businesses |
(4,814 | ) | (4,853 | ) | — | |||||||
| Redemptions of (investments in) marketable securities |
— | 3,000 | (3,000 | ) | ||||||||
| Payments on deferred purchase price of businesses |
(997 | ) | (913 | ) | (295 | ) | ||||||
| Net cash (used in) provided by investing activities: |
||||||||||||
| Continuing operations |
(65,062 | ) | (18,278 | ) | 6,752 | |||||||
| Discontinued operation |
— | 3,018 | (1,527 | ) | ||||||||
| Net cash (used in) provided by investing activities |
(65,062 | ) | (15,260 | ) | 5,225 | |||||||
| Cash Flows from Financing Activities |
||||||||||||
| Proceeds on long-term borrowings |
— | 7,000 | 3,000 | |||||||||
| Payments on long-term borrowings |
(558 | ) | (7,509 | ) | (14,749 | ) | ||||||
| Proceeds from exercise of stock options |
2,611 | 1,798 | 3,764 | |||||||||
| Excess tax benefits from share-based compensation expense |
976 | 1,314 | 4,132 | |||||||||
| Purchases of treasury stock |
— | (12,880 | ) | (5,865 | ) | |||||||
| Net cash provided by (used in) financing activities |
3,029 | (10,277 | ) | (9,718 | ) | |||||||
| Effect of exchange rate changes on cash and cash equivalents |
1,709 | 2,719 | (4,572 | ) | ||||||||
| Net increase in cash and cash equivalents |
12,096 | 26,095 | 37,217 | |||||||||
| Cash and Cash Equivalents at Beginning of Period |
95,930 | 69,835 | 32,618 | |||||||||
| Cash and Cash Equivalents at End of Period |
$ | 108,026 | $ | 95,930 | $ | 69,835 | ||||||
| Non-cash transactions: |
||||||||||||
| Purchase of business by issuing Common Stock of the Company |
$ | 36,851 | $ | — | $ | — | ||||||
| Purchases of businesses utilizing earnout consideration recorded in current and long-term liabilities |
$ | 11,900 | $ | — | $ | 1,419 | ||||||
See Notes to Consolidated Financial Statements.
52
NOTES TO CONSOLIDATED FINANCIAL STATEMENTS
| Note A | NATURE OF BUSINESS AND SUMMARY OF SIGNIFICANT ACCOUNTING POLICIES |
NATURE OF BUSINESS II-VI Incorporated and subsidiaries (the “Company”), a worldwide leader in crystal growth technology, is a vertically-integrated manufacturing company that creates and markets products for a diversified customer base including industrial manufacturing, military and aerospace, high-power electronics, telecommunications and thermoelectronics applications. The Company markets its products through its direct sales force and through distributors and agents.
The Company uses certain uncommon materials and compounds to manufacture its products. Some of these materials are available from only one proven outside source. The continued high quality of these materials is critical to the stability of the Company’s manufacturing yields. The Company has not experienced significant production delays due to a shortage of materials. However, the Company does occasionally experience problems associated with vendor-supplied materials not meeting specifications for quality or purity. A significant failure of the Company’s suppliers to deliver sufficient quantities of necessary high-quality materials on a timely basis could have a material adverse effect on the Company’s results of operations.
In June 2009, the Company sold its x-ray and gamma-ray radiation business, eV PRODUCTS, Inc. eV PRODUCTS was previously reported in the Compound Semiconductor Group business segment. Financial and operational data included herein for fiscal years 2009 and earlier have been presented to reflect the presentation of eV PRODUCTS as a discontinued operation.
PRINCIPLES OF CONSOLIDATION The consolidated financial statements include the accounts of the Company. All significant intercompany transactions and balances have been eliminated.
FOREIGN CURRENCY TRANSLATION For II-VI Singapore Pte., Ltd. and its subsidiaries, II-VI Suisse S.a.r.l. and Pacific Rare Specialty Metals & Chemicals, Inc., the functional currency is the U.S. dollar. Gains and losses on the remeasurement of the local currency financial statements are included in net earnings. Foreign currency translation (losses) gains were $(0.2) million, $0.5 million and $1.0 million for the years ended June 30, 2010, 2009 and 2008, respectively.
For all other foreign subsidiaries, the functional currency is the local currency. Assets and liabilities of those operations are translated into U.S. dollars using period-end exchange rates while income and expenses are translated using the average exchange rates for the reporting period. Translation adjustments are recorded as accumulated other comprehensive income within shareholders’ equity in the accompanying consolidated balance sheets.
CASH AND CASH EQUIVALENTS The Company considers highly liquid investment instruments with an original maturity of three months or less to be cash equivalents. The majority of cash and cash equivalents is invested in investment grade money market type instruments. We place our cash and cash equivalents with high-credit quality financial institutions and to date we have not experienced credit losses in these instruments. Cash of foreign subsidiaries is on deposit at banks in China, Singapore, Vietnam, Japan, Switzerland, the Netherlands, Germany, the Philippines, Belgium, Italy, Hong Kong and the U.K.
ACCOUNTS RECEIVABLE AND WARRANTY RESERVE The Company establishes an allowance for doubtful accounts based on historical experience.
The Company factored a portion of the accounts receivable due to its Japan subsidiary during each of the years ended June 30, 2010 and 2009. Factoring is done with large banks in Japan. During the years ended June 30, 2010 and 2009, $3.9 million and $7.1 million respectively, of accounts receivable had been factored. As of June 30, 2010 and 2009, $0.2 million was included in Other accrued liabilities representing the Company’s obligation to the bank for these receivables factored with recourse.
53
The Company records a warranty reserve as a charge against earnings based on a percentage of revenues utilizing actual returns over a period that approximates historical warranty experience. The following table summarizes the change in the carrying value of the Company’s warranty reserve as of and for the years ended June 30, 2010, 2009 and 2008.
| Year Ended June 30, | 2010 | 2009 | 2008 | |||||||
| ($000) | ||||||||||
| Balance – Beginning of Year |
$ | 861 | $ | 777 | $ | 926 | ||||
| Expense (credit) and write-offs, net |
176 | 84 | (149 | ) | ||||||
| Balance – End of Year |
$ | 1,037 | $ | 861 | $ | 777 | ||||
INVENTORIES Inventories are valued at the lower of cost or market, with cost determined on the first-in, first-out basis. Inventory costs include material, labor and manufacturing overhead. The Company records an inventory reserve as a charge against earnings for all products on hand more than twelve months to eighteen months depending on the products that have not been sold to customers or cannot be further manufactured for sale to alternative customers. An additional reserve is recorded for product on hand that is in excess of product sold to customers over the same periods noted above. Inventories are presented net of reserves. The reserves totaled $3.6 million and $3.3 million at June 30, 2010 and 2009, respectively.
PROPERTY, PLANT AND EQUIPMENT Property, plant and equipment are carried at cost or fair market value upon acquisition. Major improvements are capitalized, while maintenance and repairs are generally expensed as incurred. The Company reviews its property, plant and equipment and other long-lived assets for impairment whenever events or circumstances indicate that the carrying amounts may not be recoverable. Depreciation for financial reporting purposes is computed primarily by the straight-line method over the estimated useful lives for building, building improvements and land improvements of 10 to 20 years and 2 to 12 years for machinery and equipment.
GOODWILL The excess purchase price over the fair market value allocated to identifiable tangible and intangible net assets of businesses acquired is reported as goodwill in the accompanying consolidated balance sheets. In accordance with Generally Accepted Accounting Principles (“GAAP”), the Company tests goodwill for impairment at least annually as of April 1,or when events or changes in circumstances indicate that goodwill might be impaired. The evaluation of impairment involves comparing the current fair value of the business to the recorded value (including goodwill). The Company uses a discounted cash flow model (“DCF model”) and a market analysis to determine the current fair value of the business. A number of significant assumptions and estimates are involved in the application of the DCF model to forecasted operating cash flows, including markets and market shares, sales volume and pricing, costs to produce, working capital changes and income tax rates. Management considers historical experience and all available information at the time the fair values of the business are estimated. However, actual fair value that could be realized could differ from those used to evaluate the impairment of goodwill.
INVESTMENTS In July 2009, the Company acquired a 40% non-controlling minority interest in Langfang Haobo Diamond Co., Ltd., a joint venture based in Beijing, China. The total purchase price of the investment was $5.9 million of which $4.8 million was paid in cash and the remaining amount was recorded in Other accrued liabilities in the Consolidated Balance Sheet at June 30, 2010 and will be paid within the next twelve months. This investment is accounted for under the equity method of accounting. The Company’s pro-rata share of the loss from this investment was $0.3 million for the year ended June 30, 2010. The total carrying value of the investment recorded as of June 30, 2010 was $5.6 million.
In March 2007, the Company acquired for $3.6 million a 10% non-controlling minority interest in Guangdong Fuxin Electronic Technology (Fuxin) based in Guangdong Province, China. In July 2008, the Company completed an additional non-controlling investment of 10.2% of the equity interests of Fuxin for
54
approximately $4.9 million. As a result, the Company has a total equity investment in Fuxin of 20.2%. This investment is accounted for under the equity method of accounting commencing with the period beginning July 1, 2008. Prior to July 1, 2008, this investment was accounted for under the cost method of accounting. During the years ended June 30, 2010 and 2009, the Company’s pro-rata share of earnings from this investment was $0.7 million and $1.1 million, respectively, and is recorded in other expense (income), net in the Consolidated Statements of Earnings. During the year ended June 30, 2010, the Company recorded distributions from this equity investment of $0.6 million of which $0.4 million was received in cash and the balance recorded in Prepaid and other current assets in the Consolidated Balance Sheets at June 30, 2010. The total carrying value of the investment recorded as of June 30, 2010 and 2009 was $9.6 million and $9.5 million, respectively.
During the year ended June 30, 2008, the Company sold its entire 36% equity investment in 5N Plus, Inc., a Canadian company, for $30.2 million in cash on which it recorded an after-tax gain of $15.9 million. The Company’s pro rata share of the earnings from this investment were approximately $0.7 million for the year ended June 30 2008.
INTANGIBLES Intangible assets are carried at cost or fair market value upon acquisition. Finite-lived intangible assets are amortized for financial reporting purposes using the straight-line method over the estimated useful lives of the assets ranging from three years to twenty years. Indefinite-lived intangible assets are not amortized but tested annually for impairment in the fourth quarter of the fiscal year, or when events or changes in circumstances indicate that indefinite-lived intangible assets might be impaired.
PREPAID AND OTHER CURRENT ASSETS In April 2005, the Company entered into a $2.0 million note purchase agreement with SemiSouth Laboratories, Inc. (“SemiSouth”), a customer and supplier of the Company. Under the current terms of the agreement, the note receivable accrues interest at 10% per annum. The note receivable and the accrued interest mature in January 2011.
ACCRUED BONUSES AND PROFIT SHARING CONTRIBUTION The Company records bonus and profit sharing estimates as a charge against earnings. These estimates are adjusted to actual based on final results of operations achieved during the fiscal year. Certain partial bonus amounts may be paid on an interim basis, and the remainder is paid after the fiscal year end after the final determination of the applicable percentage or amounts. Other bonuses are paid annually.
INCOME TAXES Deferred income tax assets and liabilities are determined based on the differences between the consolidated financial statement and tax basis of assets and liabilities using enacted tax rates in effect in the years in which the differences are expected to reverse. Valuation allowances are established when necessary to reduce deferred income tax assets to the amount more likely than not to be realized. The Company adopted ASC 740 Income Taxes. This Standard clarifies the financial statement recognition threshold and measurement attribute of a tax position taken or expected to be taken in a tax return. This interpretation also provides guidance on de-recognition, classification, interest and penalties, accounting in interim periods, disclosures and transition. The Company applies a more-likely-than-not recognition threshold for all tax uncertainties. The Standard only allows the recognition of those tax benefits that have a greater than 50% likelihood of being sustained upon examination by the taxing authorities. The Company classifies interest and penalties as an element of income tax expense.
REVENUE RECOGNITION The Company recognizes revenues when the criteria of SEC Staff Accounting Bulletin: No. 104 – Revenue Recognition in Financial Statements (“SAB 104”) are met. Revenues for product shipments are realizable when the Company has persuasive evidence of a sales arrangement, the product has been shipped or delivered, the sale price is fixed or determinable and collectability is reasonably assured. Title and risk of loss passes from the Company to its customer at the time of shipment in most cases with the exception of certain customers. For these customers, which represent less than 5% of our consolidated revenues, title does not pass and revenue is not recognized until the customer has received the product at its physical location.
55
We establish an allowance for doubtful accounts and a warranty reserve based on historical experience and believe the collection of revenues, net of these reserves, is reasonably assured. Our allowance for doubtful accounts and warranty reserve balances at June 30, 2010 was approximately $1.1 million and $1.0 million, respectively. Our reserve estimates have historically been proven to be materially correct based upon actual charges incurred.
The Company’s revenue recognition policy is consistently applied across the Company’s segments, product lines and geographical locations. Further, we do not have post shipment obligations such as training or installation, customer acceptance provisions, credits and discounts, rebates and price protection, or other similar privileges. Our distributors and agents are not granted price protection. Our distributors and agents, who comprise less than 10% of consolidated revenue, have no additional product return rights beyond the right to return defective products that are covered by our warranty policy. We believe our revenue recognition practices are consistent with SAB 104 and that we have adequately considered the requirements of ASC 605 Revenue Recognition.
Revenues generated from transactions other than product shipments are contract related and have historically accounted for approximately 5% or less of the Company’s consolidated revenues. For this portion of revenues, the Company follows the guidelines of ASC 910 Contractors – Construction for these contracts which are related to research and development.
SHIPPING AND HANDLING COSTS Shipping and handling costs billed to customers are included in revenues. Shipping and handling costs incurred by the Company are included in selling, general and administrative expenses in the accompanying Consolidated Statements of Earnings. Total shipping and handling revenue and costs included in revenues and in selling, general and administrative expenses were $0.2 million, $0.3 million and $0.6 million for the years ended June 30, 2010, 2009 and 2008, respectively.
RESEARCH AND DEVELOPMENT Internal research and development costs and costs not related to customer and government funded research and development contracts are expensed as incurred.
SHARE-BASED COMPENSATION The Company adopted ASCASC 718 “Compensation-Stock Compensation” (formerly SFAS No. 123 (revised 2004), (“SFAS 123(R)”) “Share-Based Payment,” effective July 1, 2005. ASC 718 requires the recognition of the fair value of stock compensation in net earnings. The Company recognizes the share-based compensation expense over the requisite service period of the individual grantees, which generally equals the vesting period.
The Company recorded $10.1 million, $5.0 million and $4.0 million in share-based compensation expense in its Consolidated Statements of Earnings for the fiscal years ended June 30, 2010, 2009 and 2008, respectively. The share-based compensation expense is allocated approximately 25% to cost of goods sold and 75% to selling, general and administrative expense in the Consolidated Statements of Earnings based upon the employee classification of the grantees. The Company utilized the Black-Scholes valuation model for estimating the fair value of stock option expense. During the fiscal years ended June 30, 2010, 2009 and 2008, the weighted-average fair value of options granted under the stock option plan was $13.27, $17.71 and $13.31, respectively, per option using the following assumptions:
| Year Ended June 30, 2010 |
Year Ended June 30, 2009 |
Year Ended June 30, 2008 | ||||
| Risk free interest rate |
3.22% | 2.91% | 3.79% | |||
| Expected volatility |
49% | 41% | 39% | |||
| Expected life of options |
7.00 years | 5.84 years | 5.86 years | |||
| Dividend yield |
None | None | None |
56
The risk-free interest rate is derived from the average U.S. Treasury Note rate during the period, which approximates the rate in effect at the time of grant related to the expected life of the options. The risk free interest rate shown above is the weighted average rate for all options granted during the fiscal year. Expected volatility is based on the historical volatility of the Company’s Common Stock over the period commensurate with the expected life of the options. The expected life calculation is based on the observed time to post-vesting exercise and/or forfeitures of options by our employees. The dividend yield of zero is based on the fact the Company has never paid cash dividends and has no intention to pay cash dividends in the future. The estimated annualized forfeitures are based on the Company’s historical experience of option pre-vesting cancellations and are estimated at a rate of 16%. The Company will record additional expense in future periods if the actual forfeiture rate is lower than estimated, and will record a recovery of expense in future periods if the actual forfeitures are higher than estimated.
WORKERS’ COMPENSATION The Company is self-insured for certain losses related to workers’ compensation for its U.S. employees. Additionally, third-party insurance is obtained to limit our exposure to these claims in excess of $0.4 million per occurrence and $1.0 million in the aggregate per policy year. When estimating the self-insurance liability, the Company considers a number of factors, including historical claims experience, demographic and severity factors and valuations provided by independent third party consultants. Periodically, management reviews its assumptions and the valuations to determine the adequacy of the self-insurance liability.
COMPREHENSIVE INCOME Comprehensive income is a measure of all changes in shareholders’ equity that result from transactions and other economic events of the period other than transactions with owners. Accumulated other comprehensive income is a component of shareholders’ equity and consists of accumulated foreign currency translation adjustments of $4.0 million and $3.9 million, net of income taxes of $1.4 million and $0.6 million, as of June 30, 2010 and 2009, respectively.
FAIR VALUE MEASUREMENTS The Company adopted FASB ASC 820 (ASC 820), Fair Value Measurements and Disclosures (formerly referenced as FASB Statement of Financial Accounting Standard No. 157, Fair Value Measurements), which defines fair value, establishes guidelines for measuring fair value and expands disclosures regarding fair value measurements with respect to the Company’s financial assets and liabilities. The Company applies fair value accounting for all financial assets and liabilities that are recognized or disclosed at fair value in the financial statements. The Company defines fair value as the price that would be received from selling an asset or paid to transfer a liability in an orderly transaction between market participants at the measurement date. When determining the fair value measurements for assets and liabilities, the Company considers the principal or most advantageous market in which the Company would transact and the market-based risk measurements or assumptions that market participants would use in pricing the asset or liability, such as inherent risk, transfer restrictions and credit risk.
ESTIMATES The preparation of financial statements in conformity with accounting principles generally accepted in the United States of America requires management to make estimates and assumptions that affect the reported amounts of assets and liabilities and disclosure of contingent assets and liabilities at the date of the financial statements and the reported amounts of revenues and expenses during the reporting period. Actual results could differ from those estimates.
RECLASSIFICATIONS Certain amounts from prior year periods have been reclassified to conform to the current year presentation.
RECENTLY ISSUED FINANCIAL ACCOUNTING STANDARDS The Company adopted new U.S. GAAP guidance related to business combinations beginning in its first quarter of fiscal 2010. Under the new guidance, an entity is required to recognize the assets acquired, liabilities assumed, contractual contingencies, and contingent consideration at their fair value on the acquisition date. It further requires that acquisition-related costs be recognized separately from the acquisition and expensed as incurred; that restructuring costs generally
57
be expensed in periods subsequent to the acquisition date; and that changes in accounting for deferred tax asset valuation allowances and acquired income tax uncertainties after the measurement period be recognized as a component of the provision for income taxes. In addition, acquired in-process research and development is capitalized as an intangible asset and tested for impairment in a manner consistent with goodwill.
The Company adopted new U.S. GAAP guidance related to non-controlling interests in consolidated financial statements beginning in its first quarter of fiscal 2010. The Company’s adoption of this guidance did not have a significant impact on its consolidated financial statements. The provision of these standards was applied prospectively, except for the presentation and disclosure requirements, which were applied retrospectively to all periods presented. The guidance revises accounting and reporting standards for the non-controlling interest in a subsidiary and the accounting for the deconsolidation of a subsidiary. It also clarifies that changes in a parent’s ownership interest in a subsidiary that does not result in deconsolidation are equity transactions if the parent retains its controlling financial interest and requires that a parent recognize a gain or loss in net income when a subsidiary is deconsolidated. The gain or loss is measured using the fair value of the non-controlling equity investment on the deconsolidation date. The guidance also requires expanded disclosures regarding the interest of the parent and the non-controlling interest.
In January 2010, the Financial Accounting Standards Bulletin (“FASB”) issued amended standards requiring additional fair value disclosures. The amended standards require disclosures of transfers in and out of Levels 1 and 2 of the fair value hierarchy, as well as requiring gross basis disclosures for purchases, sales, issuances and settlements within the Level 3 reconciliation. Additionally, the update clarifies the requirement to determine the level of disaggregation for fair value measurement disclosures and to disclose valuation techniques and inputs used for both recurring and nonrecurring fair value measurements in either Level 2 or Level 3. The Company adopted the new guidance in the third quarter of fiscal 2010, except for the disclosures related to purchases, sales, issuance and settlements, which will be effective for the Company beginning in the first quarter of fiscal 2012. Because these new standards are related primarily to disclosures, their adoption has not had and is not expected to have a significant impact on the Company’s consolidated financial statements.
In October 2009, the FASB issued Accounting Standards Update 2009-13, “Multiple-Deliverable Revenue Arrangements,” codified in ASC Topic 605. This update provides application guidance on whether multiple deliverables exist, how the deliverables should be separated and how the consideration should be allocated to one or more units of accounting. This guidance establishes a selling price hierarchy for determining the selling price of a deliverable. The selling price used for each deliverable will be based on vendor-specific objective evidence, if available, third-party evidence if vendor-specific objective evidence is not available, or estimated selling price if neither vendor-specific or third-party evidence is available. The Company will be required to apply this guidance prospectively for revenue arrangements entered into or materially modified in the fiscal year beginning on or after June 15, 2010. The Company is currently evaluating the impact that adoption of this guidance will have on the determination or reporting of the company’s financial results for fiscal 2011 and prospectively.
In June 2009, the FASB issued new guidance concerning the determination of the primary beneficiary of a variable interest entity (“VIE”). This new guidance amends current U.S. GAAP by: requiring ongoing reassessments of whether an enterprise is the primary beneficiary of a VIE; amending the quantitative approach previously required for determining the primary beneficiary of the VIE; modifying the guidance used to determine whether an entity is a VIE; adding an additional reconsideration event (e.g. troubled debt restructurings) for determining whether an entity is a VIE; and requiring enhanced disclosures regarding an entity’s involvement with a VIE. This new guidance will be effective for the Company beginning in its first quarter of fiscal 2011, with earlier adoption prohibited. The Company does not expect the impact of this new guidance to be material to its consolidated financial statements.
58
| Note B | DISCONTINUED OPERATION |
In June 2009, the Company sold its x-ray and gamma-ray radiation business, eV PRODUCTS, Inc. for approximately $5.2 million in cash The Company recognized a $2.0 million loss on the sale of the business net of $1.2 million in income tax benefits. Included in the loss are total transaction costs of approximately $2.1 million associated with the sale. The Company believes that the sale of this non-strategic business allows the Company to focus its financial resources and devote greater attention to the Company’s core businesses.
This business was previously reported within the Compound Semiconductor Group for segment reporting. Financial and operational data included herein for the fiscal years 2009 and earlier reflect the presentation of eV PRODUCTS as a discontinued operation. The revenue and loss before income taxes for eV PRODUCTS included in discontinued operation are as follows:
| Year Ended June 30, | 2009 | 2008 | ||||||
| ($000) |
||||||||
| Revenues |
$ | 8,782 | $ | 7,202 | ||||
| Loss before income taxes |
$ | (3,377 | ) | $ | (2,321 | ) | ||
| Note C | ACQUISITIONS |
Photop Technologies, Inc.
In January 2010, the Company acquired all the outstanding shares of Photop Technologies, Inc. (“Photop”), a privately held company based in Fuzhou, China. The results of Photop have been included in the consolidated financial statements since that date. Photop is a vertically integrated manufacturer of crystal materials, optics, microchip lasers for display applications and optical modules for use in fiber optic communication networks and other diverse consumer and commercial applications. As a result of the acquisition, the companies will combine efforts and enhance the collective expertise in crystal materials and optics. The Company expects to achieve synergies by utilizing the Company’s worldwide distribution network to distribute Photop’s products as well as enhancing crystal growth processes.
Under the terms of the agreement, the initial consideration was $45.6 million in cash and 1,145,852 shares of II-VI Incorporated Common Stock valued at $36.9 million. The fair value of the shares of II-VI Incorporated’s Common Stock used for the transaction was determined based on the closing market price of the Company’s common stock on the acquisition date. In addition, the agreement provides up to $12.0 million of additional cash earnout opportunities based upon Photop achieving certain agreed upon financial targets in calendar years 2010 and 2011. The final purchase price was subject to customary closing adjustments, including working capital adjustments. During the quarter ended March 31, 2010, the Company completed the working capital review of Photop and, in accordance with the Merger Agreement, determined that there was no amount due to or from the selling shareholders. The purchase price is summarized as follows ($000):
| Amount of cash paid |
$ | 45,600 | |
| Fair value of Common Stock issued by the Company |
36,851 | ||
| Fair value of cash earnout arrangements |
11,900 | ||
| Total purchase price |
$ | 94,351 | |
The cash earnout arrangements require the Company to pay $12.0 million of additional consideration to Photop’s former shareholders if Photop’s earnings and revenues for calendar years 2010 and 2011 exceed established targets. The fair value of the cash earnout arrangement at the acquisition date was $11.9 million of which $6.0 million of the amount was recorded in other current accrued liabilities and $5.9 million was recorded in other long-term liabilities in the Company’s Consolidated Balance Sheets at June 30, 2010. The Company
59
estimated the fair value of the cash earnout arrangements using a probability-weighted discount model and employing present value techniques. The fair value of the earnout arrangement was based on significant inputs not observable in the market and represents a Level 3 measurement as defined in ASC 820 “Fair Value Measurements and Disclosures.” The key assumptions in applying the income approach are as follows: 0.41% and 0.93% discount rates for the calendar years 2011 and 2012 earnouts, respectively, and the assumed 100% probability of achieving the financial targets under the earnout arrangements.
This acquisition was accounted for in accordance with ASCTopic 805: Business Combinations formerly Statement of Financial Accounting Standards No. 141R. The following table presents the allocation of the purchase price of the assets acquired and liabilities assumed at the date of acquisition. ($000).
| Assets |
|||
| Accounts receivable, net |
$ | 15,784 | |
| Inventories |
7,988 | ||
| Prepaid and other current assets |
2,671 | ||
| Deferred income taxes |
2,204 | ||
| Property, plant and equipment |
37,899 | ||
| Intangible assets |
14,730 | ||
| Goodwill |
30,408 | ||
| Total assets acquired |
$ | 111,684 | |
| Liabilities |
|||
| Accounts payable |
$ | 5,649 | |
| Deferred income taxes |
5,345 | ||
| Other accrued liabilities |
6,339 | ||
| Total liabilities assumed |
$ | 17,333 | |
| Net assets acquired |
$ | 94,351 | |
The goodwill of Photop of $30.4 million was included in the Near-Infrared Optics segment. The goodwill recognized is attributed to the expected synergies and the assembled workforce of Photop. None of the goodwill is expected to be deductible for income tax purposes. The tangible and intangible assets’ fair values were established based upon third party appraisals.
The fair value of accounts receivable acquired was $15.8 million with the gross contractual amount being $16.1 million. The Company expects $0.3 million to be uncollectible.
The amount of revenues of Photop included in the Company’s Consolidated Statements of Earnings for the year ended June 30, 2010 was $46.9 million.
The Company recorded $1.9 million, of pre-tax transaction related expenses attributable to the acquisition of Photop that were expensed in selling, general and administrative expense in the Consolidated Statements of Earnings for the year ended June 30, 2010.
60
The following unaudited pro-forma consolidated results of operations have been prepared as if the acquisition of Photop had occurred July 1, 2007, the beginning of the Company’s fiscal year 2008 ($000 except per share data).
| Year Ended June 30, | |||||||||
| 2010 | 2009 | 2008 | |||||||
| Net revenues |
$ | 377,894 | $ | 346,906 | $ | 385,470 | |||
| Net earnings attributable to II-VI Incorporated |
$ | 39,350 | $ | 31,129 | $ | 63,325 | |||
| Basic earnings per share |
$ | 1.30 | $ | 1.05 | $ | 2.13 | |||
| Diluted earnings per share |
$ | 1.28 | $ | 1.03 | $ | 2.08 | |||
The pro-forma results are not necessarily indicative of what actually would have occurred if the transaction had taken place at the beginning of the period, are not intended to be a projection of future results and do not reflect any cost savings that might be achieved from the combined operations.
HIGHYAG Lasertechnologie GmbH
In January 2008, the Company acquired a 74.9% equity interest in HIGHYAG for approximately $3.8 million net of cash acquired of $2.8 million and including transaction costs of approximately $0.4 million. HIGHYAG designs and manufactures automated equipment to deliver high-power one micron laser light for cutting, drilling and welding in automotive, semiconductor and other material processing applications.
This acquisition was accounted for using the purchase method in accordance with ASC 805 Business Combinations. Accordingly, the Company recorded the net assets at their estimated fair values. Fixed and contingent payments are due for the remaining purchase price and are estimated to be approximately $0.9 million at June 30, 2010 and will be paid in Euros through fiscal year ending 2013. The following table presents the allocation of the purchase price to the assets acquired and liabilities assumed at the date of acquisition ($000).
| Assets |
|||
| Accounts receivable, net |
$ | 2,205 | |
| Inventories |
2,259 | ||
| Prepaid and other current assets |
57 | ||
| Property, plant and equipment |
702 | ||
| Intangible assets |
493 | ||
| Goodwill |
1,580 | ||
| Other assets |
125 | ||
| Total assets acquired |
$ | 7,421 | |
| Liabilities |
|||
| Accounts payable |
$ | 289 | |
| Other accrued liabilities |
1,292 | ||
| Other liabilities |
1,416 | ||
| Deferred income taxes |
152 | ||
| Minority interest |
466 | ||
| Total liabilities assumed |
$ | 3,615 | |
| Net assets acquired |
$ | 3,806 | |
61
| Note D | CONTRACT RECEIVABLES |
The components of contract receivables, which are a component of accounts receivable, net, were as follows:
| June 30, | 2010 | 2009 | ||||
| ($000) |
||||||
| Billed |
||||||
| Completed contracts |
$ | 209 | $ | — | ||
| Contracts in progress |
2,161 | 1,495 | ||||
| 2,370 | 1,495 | |||||
| Unbilled |
1,037 | 1,698 | ||||
| $ | 3,407 | $ | 3,193 | |||
| Note E | INVENTORIES |
The components of inventories were as follows:
| June 30, | 2010 | 2009 | ||||
| ($000) |
||||||
| Raw materials |
$ | 32,376 | $ | 31,227 | ||
| Work in process |
27,412 | 25,463 | ||||
| Finished goods |
21,609 | 19,930 | ||||
| $ | 81,397 | $ | 76,620 | |||
| Note F | PROPERTY, PLANT AND EQUIPMENT |
Property, plant and equipment at cost or valuation consist of the following:
| June 30, | 2010 | 2009 | ||||||
| ($000) |
||||||||
| Land and land improvements |
$ | 2,017 | $ | 1,997 | ||||
| Buildings and improvements |
61,013 | 53,053 | ||||||
| Machinery and equipment |
173,022 | 134,454 | ||||||
| Construction in progress |
5,003 | 4,059 | ||||||
| 241,055 | 193,563 | |||||||
| Less accumulated depreciation |
(123,118 | ) | (107,150 | ) | ||||
| $ | 117,937 | $ | 86,413 | |||||
Depreciation expense was $19.1 million, $14.1 million and $14.2 million for the years ended June 30, 2010, 2009 and 2008, respectively.
Capitalized interest expense associated with the construction of buildings and improvements was $0.1 million for the year ended June 30, 2008. There was no capitalized interest expense for the years ended June 30, 2010 and 2009.
| Note G | GOODWILL AND INTANGIBLE ASSETS |
Goodwill represents the excess of the cost over the net tangible and identifiable intangible assets of acquired businesses. Identifiable intangible assets acquired in business combinations are recorded based upon fair market value at the date of acquisition.
62
Changes in the carrying amount of goodwill are as follows:
| Year Ended June 30, | 2010 | 2009 | ||||||
| ($000) |
||||||||
| Balance – Beginning of Year |
$ | 26,141 | $ | 26,531 | ||||
| Goodwill acquired – Photop Technologies, Inc. |
30,408 | — | ||||||
| Foreign currency translation |
(461 | ) | (390 | ) | ||||
| Balance – End of Year |
$ | 56,088 | $ | 26,141 | ||||
In connection with the acquisition of Photop Technologies, Inc. in January 2010, the Company recorded the excess purchase price over the net assets of the business acquired as goodwill in the accompanying Consolidated Balance Sheets based on the purchase price allocation.
In accordance with U.S. GAAP, the Company reviews the recoverability of goodwill at least annually and any time business conditions indicate a potential change in recoverability. The evaluation of impairment involves comparing the current fair value of the business to the recorded value (including goodwill). The Company uses a DCF model and a market analysis to determine the current fair value of the business. A number of significant assumptions and estimates are involved in the application of the DCF model to forecasted operating cash flows, including markets and market shares, sales volume and pricing, costs to produce, working capital changes and income tax rates. Management considers historical experience and all available information at the time the fair values of the business are estimated. However, actual fair value that could be realized could differ from those used to evaluate the impairment of goodwill. On April 1 of fiscal 2010 and 2009, the Company completed its annual impairment tests of its reporting units. Based on the results of these analyses, the Company’s goodwill of $56.1 million as of June 30, 2010 and $26.1 million as of June 30, 2009 was not impaired.
The gross carrying amount and accumulated amortization of the Company’s intangible assets other than goodwill as of June 30, 2010 and 2009 were as follows:
| June 30, 2010 | June 30, 2009 | |||||||||||||||||||
| ($000) | Gross Carrying Amount |
Accumulated Amortization |
Net Book Value |
Gross Carrying Amount |
Accumulated Amortization |
Net Book Value | ||||||||||||||
| Patents |
$ | 12,250 | $ | (4,451 | ) | $ | 7,799 | $ | 6,229 | $ | (3,534 | ) | $ | 2,695 | ||||||
| Trademark |
10,641 | (739 | ) | 9,902 | 7,491 | (665 | ) | 6,826 | ||||||||||||
| Customer Lists |
11,704 | (4,410 | ) | 7,294 | 6,515 | (3,770 | ) | 2,745 | ||||||||||||
| Other |
1,371 | (1,371 | ) | — | 1,382 | (1,377 | ) | 5 | ||||||||||||
| Total |
$ | 35,966 | $ | (10,971 | ) | $ | 24,995 | $ | 21,617 | $ | (9,346 | ) | $ | 12,271 | ||||||
Amortization expense recorded on the intangible assets for the years ended June 30, 2010, 2009 and 2008 was $1.9 million, $1.3 million and $1.4 million, respectively. In connection with the acquisition of Photop, the Company completed its valuation of certain identifiable intangible assets during the recently completed year ended June 30, 2010. The Company recognized approximately $14.7 million of identifiable intangibles of Photop as a result of the valuation. The components of the identifiable intangible assets were $6.1 million for patents, $5.5 million for customer lists and $3.2 million for trade name. The patents and the customer lists are being amortized to expense over 120 months. The trade name was determined to have an indefinite life and is not amortized but tested annually for impairment.
In connection with the acquisition of Marlow, the Company acquired a trade name with an indefinite life. The carrying amount of $6.0 million is not amortized but tested annually for impairment. The Company
63
completed its impairment test of the Marlow acquired trade name with an indefinite life in the fourth quarter of fiscal 2010 and 2009. Based on the results of these tests, the trade name was not impaired at either June 30, 2010 or 2009. Included in the gross carrying amount and accumulated amortization of the Company’s patents, customer list and other component of intangible assets and goodwill is the effect of the foreign currency translation of the portion relating to the Company’s German subsidiaries and Photop. The estimated amortization expense for existing intangible assets for each of the five succeeding years is as follows:
| Year Ending June 30, | |||
| ($000) |
|||
| 2011 |
$ | 2,412 | |
| 2012 |
2,285 | ||
| 2013 |
2,073 | ||
| 2014 |
1,653 | ||
| 2015 |
1,397 | ||
| Note H | DEBT |
The components of debt were as follows:
| June 30 | 2010 | 2009 | ||||
| ($000’s) Line of credit, interest at the LIBOR Rate, as defined, plus 0.50% to 1.25% |
$ | — | $ | — | ||
| Yen denominated term note, interest at the Japanese Yen Base Rate, as defined, plus 1.49%, principal payable in full in June 2012 |
3,384 | 3,665 | ||||
| Total debt |
3,384 | 3,665 | ||||
| Current portion of long-term debt |
— | — | ||||
| Long-term debt |
$ | 3,384 | $ | 3,665 | ||
The Company’s credit facility is a $60.0 million unsecured line of credit which, under certain conditions, may be expanded to $100.0 million. The credit facility has a five-year term through October 2011 and has interest rates ranging from LIBOR plus 0.50% to LIBOR plus 1.25% based upon the Company’s consolidated leverage ratio. Additionally, the facility is subject to certain covenants, including those relating to minimum interest coverage and maximum leverage ratios.
The weighted average interest rate of borrowings was 2.2% for the years ended June 30, 2010 and 2009, respectively. The Company had available $59.1 million and $59.3 million under its line of credit as of June 30, 2010 and 2009, respectively. The amounts available under the Company’s line of credit are reduced by outstanding letters of credit. At June 30, 2010 and 2009, total outstanding letters of credit supported by the credit facilities were $0.9 million and $0.7 million, respectively.
The Company has a Yen loan which allows for borrowings up to 600 million Yen ($6.8 million as of June 30, 2010). The Yen loan has a term through June 2012. At June 30, 2010 and 2009, the Company had 300 million Yen and 350 million Yen borrowed under the loan, respectively. Interest is at a rate equal to the Japanese Yen Base Rate, as defined in the loan agreement, plus 1.49%. The Japanese Yen Base Rate was 0.90% at June 30, 2010 and 0.78% at June 30, 2009.
The Company has a line of credit facility with a Singapore bank which permits maximum borrowings in the local currency of approximately $0.4 million for the fiscal years ended June 30, 2010 and 2009. Borrowings are payable upon demand with interest charged at the rate of 1.00% above the bank’s prevailing prime lending rate. The interest rate was 5.25% at June 30, 2010 and June 30, 2009. At June 30, 2010 and 2009, there were no outstanding borrowings under this facility.
64
The Company has a line of credit facility with a Fuzhou, China bank which permits maximum borrowings in the local currency of approximately $4.5 million for the fiscal year ended June 30, 2010. Borrowings are payable upon demand with interest at the bank’s prevailing prime lending rate. At June 30, 2010, there were no outstanding borrowings under this facility.
The aggregate annual amounts of principal payments required on the long-term debt are as follows:
| Year Ending June 30, | |||
| ($000) |
|||
| 2011 |
$ | — | |
| 2012 |
3,384 | ||
Interest and commitment fees paid during the fiscal years ended June 30, 2010, 2009 and 2008 totaled approximately $0.2 million, $0.2 million and $0.3 million, respectively.
| Note I | INCOME TAXES |
The components of income tax expense (benefit) were as follows:
| Year Ended June 30, | 2010 | 2009 | 2008 | |||||||||
| ($000) Current: |
||||||||||||
| Federal |
$ | 5,031 | $ | 5,045 | $ | 19,858 | ||||||
| State |
219 | 1,299 | 1,693 | |||||||||
| Foreign |
8,283 | 4,914 | 3,677 | |||||||||
| Total Current |
$ | 13,533 | $ | 11,258 | $ | 25,228 | ||||||
| ($000) Deferred: |
||||||||||||
| Federal |
$ | (978 | ) | $ | (3,837 | ) | $ | (609 | ) | |||
| State |
(509 | ) | (3 | ) | 21 | |||||||
| Foreign |
536 | (11 | ) | 296 | ||||||||
| Total Deferred |
$ | (951 | ) | $ | (3,851 | ) | $ | (292 | ) | |||
| Total Income Tax Expense |
$ | 12,582 | $ | 7,407 | $ | 24,936 | ||||||
65
Principal items comprising deferred income taxes were as follows:
| June 30, | 2010 | 2009 | ||||||
| ($000) Deferred income tax assets |
||||||||
| Inventory capitalization |
$ | 1,864 | $ | 2,040 | ||||
| Non-deductible accruals |
1,493 | 813 | ||||||
| Accrued employee benefits |
4,079 | 2,652 | ||||||
| Net-operating loss and credit carryforwards |
4,149 | 4,198 | ||||||
| Share-based compensation expense |
7,292 | 5,208 | ||||||
| Other |
609 | 445 | ||||||
| Valuation allowance |
(1,176 | ) | (384 | ) | ||||
| Total deferred income tax assets |
$ | 18,310 | $ | 14,972 | ||||
| Deferred income tax liabilities |
||||||||
| Tax over book accumulated depreciation |
$ | (8,336 | ) | $ | (6,823 | ) | ||
| Intangible assets |
(6,854 | ) | (3,772 | ) | ||||
| Other |
(987 | ) | (362 | ) | ||||
| Total deferred income tax liabilities |
$ | (16,177 | ) | $ | (10,957 | ) | ||
| Net deferred income taxes |
$ | 2,133 | $ | 4,015 | ||||
The reconciliation of income tax expense at the statutory federal rate to the reported income tax expense is as follows:
| Year Ended June 30, | 2010 | % | 2009 | % | 2008 | % | |||||||||||||||
| ($000) |
|||||||||||||||||||||
| Taxes at statutory rate |
$ | 17,961 | 35 | $ | 16,192 | 35 | $ | 31,803 | 35 | ||||||||||||
| Increase (decrease) in taxes resulting from: |
|||||||||||||||||||||
| State income taxes – net of federal benefit |
(180 | ) | — | 907 | 2 | 1,091 | 1 | ||||||||||||||
| Taxes n non U.S. earnings |
(6,225 | ) | (12 | ) | (4,061 | ) | (9 | ) | (8,411 | ) | (9 | ) | |||||||||
| Settlement of unrecognized tax benefits |
— | — | (4,731 | ) | (10 | ) | — | — | |||||||||||||
| Reversal of foreign tax credit valuation allowance |
— | — | (1,107 | ) | (3 | ) | — | — | |||||||||||||
| Other |
1,026 | 2 | 207 | 1 | 453 | 1 | |||||||||||||||
| $ | 12,582 | 25 | $ | 7,407 | 16 | $ | 24,936 | 28 | |||||||||||||
During the year ended June 30, 2009, the Company adopted a tax planning strategy which enabled the utilization of foreign tax credit carryforwards. As a result, a deferred tax valuation allowance of $1.1 million was reversed to income and the Company recorded the benefit of foreign tax credits generated during the year ended June 30, 2009. During the fiscal year ended June 30, 2010, $0.5 million of foreign tax credit carryforwards were utilized to offset current income taxes payable. These foreign tax credits expire between 2012 and 2019.
In July 2008, the Internal Revenue Service completed its examination of the Company’s income tax returns for fiscal years 2005 and 2006. As a result, during the fiscal year ended June 30, 2009 the Company reversed certain unrecognized tax benefits from those fiscal years and recognized an income tax benefit of approximately $4.7 million.
During the fiscal years ended June 30, 2010, 2009, and 2008, net cash paid by the Company for income taxes was $5.8 million, $8.9 million, and $24.6 million, respectively.
Earnings before income taxes of our non-U.S. operations for June 30, 2010, 2009 and 2008 were $41.4 million, $22.4 million and $36.0 million, respectively. The Company has not recorded deferred income taxes
66
applicable to undistributed earnings of foreign subsidiaries that are indefinitely reinvested outside the U.S. If the earnings of such foreign subsidiaries were not indefinitely reinvested, an additional deferred tax liability of approximately $57 million and $41 million would have been required as of June 30, 2010 and 2009, respectively. It is the Company’s intention to permanently reinvest undistributed earnings of its foreign subsidiaries; therefore, no provision has been made for future income taxes on the undistributed earnings of foreign subsidiaries, as they are considered indefinitely reinvested.
The Company’s Vietnam subsidiary operated under a tax holiday and did not pay income taxes. This subsidiary was tax exempted through fiscal year 2010. Effective July 1, 2010 Vietnam’s incentive tax rate will be approximately 5%.
The sources of differences resulting in deferred income tax expense (benefit) from continuing operations and the related tax effect of each were as follows:
| Year Ended June 30, | 2010 | 2009 | 2008 | |||||||||
| ($000) |
||||||||||||
| Depreciation and amortization |
$ | (818 | ) | $ | 1,433 | $ | 381 | |||||
| Inventory capitalization |
985 | (680 | ) | 690 | ||||||||
| Net operating loss and credit carryforwards net of valuation allowances |
744 | (3,658 | ) | (23 | ) | |||||||
| Share-based compensation expense |
(2,084 | ) | (1,241 | ) | (673 | ) | ||||||
| Other |
222 | 295 | (667 | ) | ||||||||
| $ | (951 | ) | $ | (3,851 | ) | $ | (292 | ) | ||||
As of June 30, 2010, the Company had $2.7 million of state net operating loss carryforwards expiring in 2028 and 2029. For the fiscal year ended June 30, 2010, the Company did not utilize state net operating loss carryforwards. For the fiscal years ended June 30, 2009 and 2008, the Company utilized $0.7 million, $0.6 million of state net operating losses, respectively, to reduce current taxable income.
In July 2007, the Company adopted ASC 740 Income Taxes. This Standard prescribes recognition and measurement standards for a tax position taken or expected to be taken in a tax return. The evaluation of a tax position is a two step process. The first step is the determination of whether a tax position should be recognized in the financial statements. The benefit of a tax position taken or expected to be taken in a tax return is to be recognized only if the Company determines that it is more-likely-than-not that the tax position will be sustained upon examination by the tax authorities based upon the technical merits of the position. In step two, for those tax positions which should be recognized, the measurement of a tax position is determined as being the largest amount of benefit that is greater than 50% likely of being realized upon ultimate settlement. This Standard was effective July 1, 2007 with adoption treated as a cumulative adjustment to retained earnings.
Changes in the liability for unrecognized tax benefits for the fiscal years ended June 30, 2010, 2009 and 2008 were as follows:
| ($000) | 2010 | 2009 | 2008 | |||||||||
| Balance at Beginning of Year |
$ | 2,575 | $ | 7,473 | $ | 6,732 | ||||||
| Increases in current year tax positions |
1,705 | 567 | 800 | |||||||||
| Increases in prior year tax positions |
— | — | 1,560 | |||||||||
| Decreases in prior year tax positions |
— | — | (439 | ) | ||||||||
| Settlements |
— | (5,449 | ) | — | ||||||||
| Expiration of statute of limitations |
(81 | ) | (16 | ) | (1,180 | ) | ||||||
| Balance at End of Year |
$ | 4,199 | $ | 2,575 | $ | 7,473 | ||||||
67
The Company classifies all estimated and actual interest and penalties as income tax expense. During the years ended June 30, 2010 and 2009, the Company recognized $0.1 million and $0.2 million, respectively, of interest and penalties within income tax expense. The Company had $0.3 million and $0.2 million of interest and penalties accrued at June 30, 2010 and 2009, respectively. The Company has classified the uncertain tax positions as non-current income tax liabilities as the amounts are not expected to be paid within one year. Including tax positions for which the Company determined that the tax position would not meet the more-likely-than-not recognition threshold upon examination by the tax authorities based upon the technical merits of the position, the total estimated unrecognized tax benefit that, if recognized, would affect our effective tax rate was approximately $3.1 million at June 30, 2010. The Company expects a decrease of approximately $1.2 million of unrecognized tax benefits as a result of the expiration of the statute of limitations relating to transfer pricing reserves during the next twelve months.
The fiscal years 2007 to 2010 remain open to examination by the United States Internal Revenue Service, fiscal years 2004 to 2010 remain open to examination by certain state jurisdictions, and fiscal years 2005 to 2010 remain open to examination by certain foreign taxing jurisdictions.
| Note J | EARNINGS PER SHARE |
The following table sets forth the computation of earnings per share for the periods indicated. Weighted average shares issuable upon the exercise of stock options that were not included in the calculation were approximately 499,000 and 298,000 for the years ended June 30, 2010 and 2009, respectively because they were anti-dilutive. Weighted average shares issuable upon the exercise of stock options were not included in the calculation because they were anti-dilutive and were immaterial for the year ended June 30, 2008.
| Year Ending June 30, | 2010 | 2009 | 2008 | ||||||||
| ($000 except per share) |
|||||||||||
| Earnings attributable to II-VI Incorporated |
$ | 38,577 | $ | 38,858 | $ | 65,693 | |||||
| Loss from discontinued operation |
— | (2,077 | ) | (1,425 | ) | ||||||
| Net earnings attributable to II-VI Incorporated |
38,577 | 36,781 | 64,268 | ||||||||
| Divided by: |
|||||||||||
| Weighted average shares |
30,152 | 29,667 | 29,691 | ||||||||
| Basic earnings attributable to II-VI Incorporated per common share |
$ | 1.28 | $ | 1.31 | $ | 2.21 | |||||
| Basic loss from discontinued operation per common share |
$ | — | $ | (0.07 | ) | $ | (0.05 | ) | |||
| Basic earnings attributable to II-VI Incorporated per common share |
$ | 1.28 | $ | 1.24 | $ | 2.16 | |||||
| Earnings attributable to II-VI Incorporated |
$ | 38,577 | $ | 38,858 | $ | 65,693 | |||||
| Loss from discontinued operation |
— | (2,077 | ) | (1,425 | ) | ||||||
| Net earnings attributable to II-VI Incorporated |
38,577 | 36,781 | 64,268 | ||||||||
| Divided by: |
|||||||||||
| Weighted average shares |
30,152 | 29,667 | 29,691 | ||||||||
| Dilutive effect of Common Stock equivalents |
600 | 415 | 798 | ||||||||
| Diluted weighted average common shares |
30,752 | 30,082 | 30,489 | ||||||||
| Diluted earnings attributable to II-VI Incorporated per common share |
$ | 1.25 | $ | 1.29 | $ | 2.16 | |||||
| Diluted loss from discontinued operation per common share |
$ | — | $ | (0.07 | ) | $ | (0.05 | ) | |||
| Diluted earnings attributable to II-VI Incorporated per common share |
$ | 1.25 | $ | 1.22 | $ | 2.11 | |||||
68
| Note K | OPERATING LEASES |
The Company leases certain property under operating leases that expire at various dates through the year ending June 30, 2056. Future rental commitments applicable to the operating leases at June 30, 2010 are as follows:
| Year Ending June 30, | |||
| ($000) |
|||
| 2011 |
$ | 4,547 | |
| 2012 |
3,203 | ||
| 2013 |
2,306 | ||
| 2014 |
2,062 | ||
| 2015 |
1,891 | ||
| Thereafter |
17,085 | ||
Rent expense was approximately $4.1 million, $3.2 million and $3.0 million for the fiscal years ended June 30, 2010, 2009 and 2008, respectively.
| Note L | SHARE-BASED COMPENSATION PLANS |
The Board of Directors adopted the II-VI Incorporated 2009 Omnibus Incentive Plan (the “Plan”). The Plan was approved by the shareholders of the Company on November 6, 2009. The Plan provides for the grant of non-qualified stock options, stock appreciation rights, restricted shares, deferred shares and performance units to employees, officers, directors and consultants of the Company. The maximum number of shares of the Company’s Common Stock authorized for issuance under the Plan shall not in the aggregate exceed 1,600,000 shares of Common Stock authorized plus any shares under the predecessor plan which was outstanding as of November 6, 2009, that expire or terminate without being exercised. All options to purchase shares of Common Stock granted under the Plan have been at market price at the date of grant. Generally, twenty percent of the options may be exercised one year from the date of grant with comparable annual increases on a cumulative basis each year thereafter. The stock option plan also has vesting provisions predicated upon the death, retirement or disability of the optionee. As of June 30, 2010, there were 1,721,701 shares available to be issued under the Plan.
The Compensation Committee of the Board of Directors of the Company granted certain named executive officers performance share awards under the Plan. During the fiscal year ended June 30, 2010, the Company had two outstanding performance share grants covering the periods July 1, 2008 to June 30, 2010 and July 1, 2009 to June 30, 2011. The awards are intended to provide continuing emphasis on specified financial performance goals that the Company considers important contributors to long-term shareholder value. The awards are payable only if the Company achieves specified levels of revenue and cash flows from operations for the performance periods. Included in the $10.1 million, $5.0 million and $4.0 million of share-based compensation expense for the fiscal years ended June 30, 2010, 2009 and 2008, respectively, was $1.0 million, $0.3 million and $0.7 million, respectively, for the same periods attributable to the performance share plans. The performance share compensation expense was calculated based upon the number of shares projected to be earned multiplied by the stock price at the date the performance share plan was established. At June 30, 2010, the Company had one outstanding performance share plan covering the 24-month performance period from July 1, 2009 to June 30, 2011. The projected target awards for this performance share plan are 53,326 shares at a fair market value per share at the grant date of $24.15. The projected share-based compensation expense attributable to this performance share plan to be recognized in the fiscal year ending June 30, 2011 is $0.6 million.
In August 2009, the Compensation Committee of the Board of Directors of the Company granted certain named executive officers and employees restricted share awards under the Plan. The restricted share awards have a three year cliff-vesting provision. The Company’s share-based compensation expense related to these restricted shares was $0.1 million for the year ended June 30, 2010.
69
In conjunction with the Company’s acquisition of Photop, the Compensation Committee established both a short-term and long-term performance and retention program under the Plan for certain Photop employees.
Under the short-term performance and retention program, the Company granted 37,693 restricted share units on January 4, 2010. The restricted share units are payable in cash and vested on July 2, 2010. The cash amount to be paid equals the number of restricted share units granted multiplied by the average closing trading price of the Company’s Common Stock for the 90 consecutive trading days ending on July 2, 2010. For the year ended June 30, 2010, the Company recorded $1.2 million of share-based compensation expense under this program and recorded a corresponding share-based compensation liability in the Company’s Consolidated Balance Sheets at June 30, 2010 in accordance with ASC 718 “Compensation – Stock Compensation.”
Under the long-term performance and retention program, the Company granted 150,773 performance shares awards to certain employees of Photop. The long-term performance and retention program covers the period from January 1, 2010 through December 31, 2012. Participants will be eligible to receive 25% of the performance shares following each of the calendar year 2010 and 2011 performance periods and 50% of the performance shares following the calendar year 2012 performance period. The awards are only payable if Photop achieves specified levels of revenue and earnings for each calendar year performance period as well as certain other non-financial performance targets for the performance periods. For the year ended June 30, 2010, the Company recorded $0.5 million of share-based compensation expense under this program. The performance shares compensation expense was calculated based on the estimated number of shares expected to be earned multiplied by the stock price at the date of grant. The projected share-based compensation expense attributable to this performance and retention program to be recognized in fiscal years ending June 30, 2011, 2012 and 2013 is $1.1 million, $1.6 million and $1.1 million, respectively.
Stock option activity relating to the plans during the years ended June 30, 2010, 2009 and 2008 was as follows:
| Options | Number of Shares Subject to Option |
Weighted Average Exercise Price | ||||
| Outstanding – June 30, 2007 |
2,028,305 | $ | 14.20 | |||
| Granted |
393,250 | $ | 30.59 | |||
| Exercised |
(482,150 | ) | $ | 7.83 | ||
| Forfeited |
(63,220 | ) | $ | 22.18 | ||
| Outstanding – July 1, 2008 |
1,876,185 | $ | 19.03 | |||
| Granted |
526,815 | $ | 41.40 | |||
| Exercised |
(159,370 | ) | $ | 11.29 | ||
| Forfeited |
(89,495 | ) | $ | 30.90 | ||
| Outstanding – July 1, 2009 |
2,154,135 | $ | 24.61 | |||
| Granted |
438,100 | $ | 24.74 | |||
| Exercised |
(190,910 | ) | $ | 13.78 | ||
| Forfeited |
(100,400 | ) | $ | 31.19 | ||
| Outstanding – June 30, 2010 |
2,300,925 | $ | 25.23 | |||
| Exercisable – June 30, 2010 |
1,280,249 | $ | 20.58 | |||
| Exercisable – June 30, 2009 |
1,049,000 | $ | 16.77 | |||
| Exercisable – June 30, 2008 |
906,405 | $ | 13.70 | |||
70
Outstanding and exercisable options at June 30, 2010 were as follows:
| Options Outstanding | Options Exercisable | |||||||||||
| Range of Exercise Prices |
Number of Shares |
Weighted Average Remaining Contractual Life in Years |
Weighted Average Exercise Price |
Number of Shares |
Weighted Average Exercise Price | |||||||
| $6.00-$17.00 |
494,345 | 3.15 | $ | 12.56 | 494,345 | $ | 12.56 | |||||
| $17.01-$22.00 |
582,340 | 5.35 | $ | 19.42 | 441,570 | $ | 19.32 | |||||
| $22.01-$26.00 |
424,000 | 8.65 | $ | 24.19 | 76,150 | $ | 24.23 | |||||
| $26.01-$40.00 |
435,270 | 7.36 | $ | 30.17 | 169,750 | $ | 30.27 | |||||
| $40.01-$47.00 |
364,970 | 7.98 | $ | 46.97 | 98,434 | $ | 46.98 | |||||
| 2,300,925 | 6.28 | $ | 25.23 | 1,280,249 | $ | 20.58 | ||||||
| Note M | SEGMENT AND GEOGRAPHIC REPORTING |
The Company reports its business segments using the “management approach” model for segment reporting. The Company determines its reportable business segments based on the way the chief operating decision maker organizes business segments within the Company for making operating decisions and assessing performance. To aggregate operating segments, the Company considers whether the operating segments have similar economic characteristics, and whether the operating segments are similar in each of the following areas:
| a. | The nature of the products and services |
| b. | The nature of the production processes |
| c. | The type of class of customer for their products and services |
| d. | The methods used to distribute their products or provide their services |
The Company has four reportable segments. The Company’s chief operating decision maker receives and reviews financial information in this format. The Company evaluates business segment performance based upon reported business segment earnings, which is defined as earnings before income taxes, interest and other income or expense. The segments are managed separately due to the production requirements and facilities that are unique to each segment. The Company has the following reportable segments at June 30, 2010: (i) Infrared Optics, which is the Company’s infrared optics and material products businesses, HIGHYAG Lasertechnologie GmbH (“HIGHYAG”) and remaining corporate activities, primarily corporate assets and capital expenditures; (ii) Near-Infrared Optics, which is the Company’s VLOC Incorporated subsidiary, the China and Vietnam near-infrared operations, and Photop Technologies, Inc. (“Photop”); (iii) Military & Materials, which is the Company’s Exotic Electro-Optics, Inc. (“EEO”) subsidiary and Pacific Rare Specialty Metals & Chemicals, Inc. subsidiary (“PRM”); and (iv) the Compound Semiconductor Group, which is the aggregation of the Company’s Marlow Industries, Inc. (“Marlow”) subsidiary, the Wide Bandgap Materials Group (“WBG”) and the Worldwide Materials Group (“WMG”), which is responsible for the corporate research and development activities.
The Infrared Optics segment is divided into geographic locations in the U.S., Singapore, China, Germany, Switzerland, Japan, Belgium, the U.K and Italy. The Infrared Optics segment is directed by a Corporate Executive Vice President, while each geographic location is directed by a general manager, and is further divided into production and administrative units that are directed by managers. The Infrared Optics segment designs, manufactures and markets optical and electro-optical components and materials sold under the II-VI brand name and used primarily in high-power CO2 lasers. The Infrared Optics segment also manufactures fiber-delivered beam delivery systems and processing tools for industrial lasers sold under the HIGHYAG brand name.
71
The Near-Infrared Optics segment is located in the U.S., China, Vietnam, Germany, Japan, the U.K and Italy. The Near-Infrared Optics segment is directed by a Corporate Executive Vice President. The Near-Infrared Optics segment is further divided into production and administrative units that are directed by managers. The Near-Infrared Optics segment manufactures crystal materials, optics, microchip lasers and optoelectronic modules for use in optical communication networks and other diverse consumer and commercial applications sold under the Photop brand name. The Near-Infrared Optics segment also designs, manufactures and markets near-infrared and visible-light products for industrial, scientific, military and medical instruments and laser gain material and products for solid-state YAG lasers, YLF lasers and UV Filter components and sold under the VLOC brand name.
The Military & Materials segment is located in the U.S. and the Philippines. The Military & Materials segment is directed by a Corporate Vice President, while each geographic location is directed by a general manager. The Military & Materials segment is further divided into production and administrative units that are directed by managers. The Military & Materials segment designs, manufactures and markets infrared products for military applications under the EEO brand name and refines specialty metals, primarily selenium and tellurium under the PRM brand name.
The Compound Semiconductor Group is located in the U.S., Japan, China, Vietnam and Germany. The Compound Semiconductor Group segment is directed by a Corporate Executive Vice President. In the Compound Semiconductor Group segment, Marlow designs and manufactures thermoelectric cooling and power generation solutions for use in defense and space, telecommunications, medical, consumer and industrial markets. The WBG Group manufactures and markets single crystal silicon carbide substrates for use in solid-state lighting, wireless infrastructure, radio frequency (“RF”) electronics and power switching industries. The WMG Group directs the corporate research and development initiatives.
The accounting policies of the segments are the same as those of the Company. All of the Company’s corporate expenses are allocated to the segments. The Company evaluates segment performance based upon reported segment earnings, which is defined as earnings before income taxes, interest and other income or expense. Inter-segment sales and transfers have been eliminated.
On January 4, 2010, the Company completed its acquisition of Photop. See “Note C-Acquisitions.” Photop is combined with the Company’s Near-Infrared Optics segment for financial reporting purposes. Segment earnings for the Near-Infrared Optics segment includes the operating results of Photop for six of the twelve months ended June 30, 2010. In addition, transaction-related expenses attributable to the acquisition of Photop of approximately $1.9 million, pre-tax were included in segment earnings for the Near-Infrared Optics segment for the year ended June 30, 2010.
The Company sold its x-ray and gamma-ray radiation business, eV PRODUCTS, Inc., in June 2009. This business operated within the Compound Semiconductor Group. Segment information for periods presented herein exclude eV PRODUCTS as this business is accounted for as a discontinued operation.
72
The following tables summarize selected financial information of the Company’s operations by segment:
| Infrared Optics |
Near- Optics |
Military & Materials |
Compound Semiconductor Group |
Eliminations | Total | |||||||||||||||
| ($000) |
||||||||||||||||||||
| 2010 |
||||||||||||||||||||
| Revenues |
$ | 135,063 | $ | 88,499 | $ | 65,674 | $ | 55,855 | $ | — | $ | 345,091 | ||||||||
| Inter-segment revenues |
2,021 | 303 | 2,137 | 4,209 | (8,670 | ) | — | |||||||||||||
| Segment earnings |
24,582 | 12,304 | 9,307 | 5,488 | 51,681 | |||||||||||||||
| Interest expense |
— | — | — | — | — | (87 | ) | |||||||||||||
| Other expense, net |
— | — | — | — | — | (277 | ) | |||||||||||||
| Earnings from continuing operations before income taxes |
— | — | — | — | — | 51,317 | ||||||||||||||
| Depreciation and amortization |
8,337 | 7,684 | 2,007 | 3,011 | — | 21,039 | ||||||||||||||
| Segment assets |
216,385 | 174,449 | 51,097 | 67,050 | — | 508,981 | ||||||||||||||
| Expenditures for property, plant and equipment |
1,817 | 4,115 | 4,706 | 3,199 | — | 13,837 | ||||||||||||||
| Equity investments |
9,599 | — | — | 5,670 | — | 15,269 | ||||||||||||||
| Goodwill |
9,525 | 32,335 | 3,914 | 10,314 | — | 56,088 | ||||||||||||||
| Infrared Optics |
Near- Optics |
Military & Materials |
Compound Semiconductor Group |
Eliminations | Total | |||||||||||||||
| ($000) |
||||||||||||||||||||
| 2009 |
||||||||||||||||||||
| Revenues |
$ | 130,949 | $ | 45,559 | $ | 57,016 | $ | 58,698 | $ | — | $ | 292,222 | ||||||||
| Inter-segment revenues |
1,482 | 225 | 2,217 | 4,758 | (8,682 | ) | — | |||||||||||||
| Segment earnings |
28,036 | 7,111 | 6,525 | 6,173 | — | 47,845 | ||||||||||||||
| Interest expense |
— | — | — | — | — | (178 | ) | |||||||||||||
| Other expense, net |
— | — | — | — | — | (1,349 | ) | |||||||||||||
| Earnings from continuing operations before income taxes |
— | — | — | — | — | 46,318 | ||||||||||||||
| Depreciation and amortization |
7,895 | 2,854 | 1,653 | 2,952 | — | 15,354 | ||||||||||||||
| Segment assets |
221,725 | 38,155 | 43,744 | 64,792 | — | 368,416 | ||||||||||||||
| Expenditures for property, plant and equipment |
6,178 | 1,876 | 4,325 | 3,178 | — | 15,557 | ||||||||||||||
| Equity investment |
9,548 | — | — | — | — | 9,548 | ||||||||||||||
| Goodwill |
9,986 | 1,927 | 3,914 | 10,314 | — | 26,141 | ||||||||||||||
73
| Infrared Optics |
Near- Optics |
Military & Materials |
Compound Semiconductor Group |
Eliminations | Total | |||||||||||||||
| ($000) |
||||||||||||||||||||
| 2008 |
||||||||||||||||||||
| Revenues |
$ | 151,911 | $ | 58,689 | $ | 50,507 | $ | 55,084 | $ | — | $ | 316,191 | ||||||||
| Inter-segment revenues |
1,542 | 436 | 184 | 7,731 | (9,893 | ) | — | |||||||||||||
| Segment earnings |
36,189 | 11,886 | 7,065 | 6,522 | — | 61,662 | ||||||||||||||
| Interest expense |
— | — | — | — | — | (242 | ) | |||||||||||||
| Other income, net |
— | — | — | — | — | 2,759 | ||||||||||||||
| Gain on sale of equity investment |
— | — | — | — | — | 26,455 | ||||||||||||||
| Earnings from continuing operations before income taxes |
— | — | — | — | — | 90,634 | ||||||||||||||
| Depreciation and amortization |
7,240 | 2,820 | 1,603 | 3,861 | — | 15,524 | ||||||||||||||
| Expenditures for property, plant and equipment |
10,164 | 1,771 | 2,760 | 3,160 | — | 17,855 | ||||||||||||||
Geographic information for revenues, based on country of origin, and long-lived assets which include property, plant and equipment, goodwill and other intangibles, net of related depreciation and amortization, investments and other assets, follows:
| Revenues | |||||||||
| Year Ended June 30, | 2010 | 2009 | 2008 | ||||||
| ($000) United States |
$ | 172,466 | $ | 177,916 | $ | 194,674 | |||
| Non-United States |
|||||||||
| China |
53,821 | 6,045 | 4,264 | ||||||
| Germany |
31,227 | 30,404 | 30,967 | ||||||
| Philippines |
24,940 | 21,285 | 20,514 | ||||||
| Japan |
19,543 | 19,253 | 25,411 | ||||||
| Vietnam |
15,402 | 15,093 | 8,826 | ||||||
| Switzerland |
7,425 | 7,691 | 13,139 | ||||||
| Singapore |
5,751 | 4,427 | 8,602 | ||||||
| Italy |
5,277 | 1,444 | — | ||||||
| United Kingdom |
4,827 | 3,888 | 3,918 | ||||||
| Belgium |
4,412 | 4,776 | 5,876 | ||||||
| Total Non-United States |
172,625 | 114,306 | 121,517 | ||||||
| $ | 345,091 | $ | $292,222 | $ | 316,191 | ||||
74
| Long- Lived Assets | ||||||
| June 30, | 2010 | 2009 | ||||
| ($000) |
||||||
| United States |
$ | 108,650 | $ | 113,605 | ||
| Non-United States |
||||||
| China |
84,803 | 3,152 | ||||
| Netherlands |
9,285 | 3,616 | ||||
| Vietnam |
5,525 | 3,883 | ||||
| Germany |
4,893 | 5,962 | ||||
| Philippines |
3,592 | 2,729 | ||||
| Singapore |
2,000 | 3,032 | ||||
| Switzerland |
1,384 | 1,489 | ||||
| Belgium |
274 | 277 | ||||
| Japan |
270 | 233 | ||||
| United Kingdom |
18 | 9 | ||||
| Italy |
17 | 25 | ||||
| Total Non - United States |
112,061 | 24,407 | ||||
| $ | 220,711 | $ | 138,012 | |||
| Note N | FAIR VALUE OF FINANCIAL INSTRUMENTS |
Fair value is defined as the exchange price that would be received for an asset or paid to transfer (an exit price) in the principal or most advantageous markets for the asset and liability in an orderly transaction between market participants at the measurement date. The Company estimates fair value of its financial instruments utilizing an established three-level hierarchy. The hierarchy is based upon the transparency of inputs to the valuation of an asset or liability as of the measurement date as follows:
| • | Level 1 – Valuation is based upon unadjusted quoted prices for identical assets or liabilities in active markets. |
| • | Level 2 – Valuation is based upon quoted prices for similar assets and liabilities in active markets, or other inputs that are observable for the asset or liability, either directly or indirectly, for substantially the full term of the financial instruments. |
| • | Level 3 – Valuation is based upon other unobservable inputs that are significant to the fair value measurements. |
The classification of fair value measurements within the hierarchy is based upon the lowest level of input that is significant to the measurement. At June 30, 2010 the Company had foreign currency forward contracts recorded at fair value. The fair values of these instruments were measured using valuations based upon quoted prices for similar assets and liabilities in active markets (Level 2) and are valued by reference to similar financial instruments, adjusted for credit risk and restrictions and other terms specific to the contracts. The following table provides a summary by level of the fair value of financial instruments that are measured on a recurring basis:
| Fair Value Measurements at June 30, 2010 Using: | ||||||||||||
| June 30, 2010 |
Quoted Prices in Active Markets for Identical Assets (Level 1) |
Significant Other Observable Inputs (Level 2) |
Significant Unobservable Inputs (Level 3) | |||||||||
| Liabilities: |
||||||||||||
| Contingent earnout arrangements |
$ | 11,900 | $ | — | $ | — | $ | 11,900 | ||||
| Foreign currency forward contracts |
$ | 228 | $ | — | $ | 228 | $ | — | ||||
75
The carrying value of Cash and cash equivalents, Accounts receivable and Accounts payable approximate fair value because of the short-term maturity of those instruments. The Company’s borrowing are at variable interest rates and accordingly their carrying amounts approximate fair value.
| Note O | DERIVATIVE INSTRUMENTS |
The Company, from time to time, purchases foreign currency forward exchange contracts, primarily in Japanese Yen, that permit it to sell specified amounts of these foreign currencies expected to be received from its export sales for pre-established U.S. dollar amounts at specified dates. These contracts are entered into to limit transactional exposure to changes in currency exchange rates of export sales transactions in which settlement will occur in future periods and which otherwise would expose the Company, on the basis of its aggregate net cash flows in respective currencies, to foreign currency risk.
The Company has recorded the difference in the fair market value and the contract value of these contracts on the statement of financial position. These contracts have a total contract value of $7.1 million at June 30, 2010. At June 30, 2009, the Company did not have any outstanding foreign currency forward exchange contracts. As of June 30, 2010, these forward contracts had expiration dates ranging from July 2, 2010 through October 4, 2010 with Japanese Yen denominations ranging from 150 million Yen to 180 million Yen. The Company does not account for these contracts as hedges as defined by U.S. GAAP and records the change in the fair value of these contracts in the results of operations as they occur. The fair value measurement takes into consideration foreign currency rates and the current creditworthiness of the counterparties of the Company, as applicable, and is based upon quoted prices for similar assets and liabilities in active markets, or other inputs that are observable for the asset or liability, either directly or indirectly, for substantially the full term of the financial instruments and thus represents a Level 2 measurement as defined in ASC820 “Fair Value Measurements and Disclosures.” These contracts are recorded in other current liabilities in the Consolidated Balance Sheet at June 30, 2010. The change in the fair value of these contracts decreased net earnings by $0.2 million for the year ended June 30, 2010 and is recorded in other expense (income), net in the Consolidated Statements of Earnings. The change in the fair value of these contracts for the years ended June 30, 2009 and 2008 was insignificant.
| Note P | EMPLOYEE BENEFIT PLANS |
Eligible U.S. employees of the Company participate in a profit sharing retirement plan. Contributions to the plan are made at the discretion of the Company’s board of directors and were $2.9 million, $3.0 million and $3.4 million for the years ended June 30, 2010, 2009 and 2008, respectively.
The Company has an employee stock purchase plan available for employees who have completed six months of continuous employment with the Company. The employee may purchase the Company’s Common Stock at 5% below the prevailing market price. The amount of shares which may be bought by an employee during each fiscal year is limited to 10% of the employee’s base pay. This plan, as amended, limits the number of shares of Common Stock available for purchase to 800,000 shares. There were 313,664 and 323,113 shares of Common Stock available for purchase under the plan at June 30, 2010 and 2009, respectively.
As a requirement of a collective bargaining agreement, PRM maintains a defined benefit plan for substantially all of its employees. The plan provides for retirement benefits based on a certain percentage of the latest monthly salary of an employee per year of service. The pension liability was $0.7 million as of June 30, 2010 and 2009, respectively.
The Company has no program for post-retirement health and welfare benefits.
The II-VI Incorporated Deferred Compensation Plan (the “Compensation Plan”) is designed to allow officers and key employees of the Company to defer receipt of compensation into a trust fund for retirement purposes. The Compensation Plan is a nonqualified, defined contribution employees’ retirement plan. At the Company’s discretion, the Compensation Plan may be funded by the Company making contributions based on
76
compensation deferrals, matching contributions and discretionary contributions. Compensation deferrals will be based on an election by the participant to defer a percentage of compensation under the Compensation Plan. All assets in the Compensation Plan are subject to claims of the Company’s creditors until such amounts are paid to the Compensation Plan participants. Employees of the Company made contributions to the Compensation Plan in the amount of approximately $1.0 million, $0.2 million and $0.4 million for the years ended June 30, 2010, 2009, and 2008, respectively. There were no employer contributions made to the Compensation Plan for the years ended June 30, 2010, 2009 and 2008.
| Note Q | COMMITMENTS AND CONTINGENCIES |
The Company has purchase commitments for materials and supplies as part of the ordinary conduct of business. A few of the commitments are long-term and are based on minimum purchase requirements. Due to the proprietary nature of some of the Company’s materials and processes, certain contracts may contain penalty provisions for early termination. The Company does not believe that a significant amount of penalties is reasonably likely to be incurred under these commitments based upon historical experience and current expectation. In addition, the Company has payment commitments relating to its acquisitions of HIGHYAG and Photop and investment in Haobo. Future commitments are as follows:
| Year Ending June 30, | |||
| ($000) |
|||
| 2011 |
$ | 20,540 | |
| 2012 |
8,109 | ||
| 2013 |
1,317 | ||
| Note R | STOCK REPURCHASE PROGRAM |
On October 23, 2008, the Board of Directors authorized the Company to purchase up to 500,000 shares of its Common Stock. The repurchase program called for shares to be purchased in the open market or in private transactions from time to time. Shares purchased by the Company are retained as treasury stock and available for general corporate purposes. During the quarter ended December 31, 2008, the Company completed this repurchase program by purchasing 500,000 shares of its Common Stock for $12.9 million.
On May 18, 2005, the Board of Directors authorized the Company to purchase up to 500,000 shares of its Common Stock. The repurchase program called for shares to be purchased in the open market or in private transactions from time to time. Shares purchased by the Company are retained as treasury stock and available for general corporate purposes. During the fiscal year ended June 30, 2008, the Company completed this repurchase program. During this program, the Company purchased 500,000 shares of its Common Stock for $11.8 million.
77
QUARTERLY FINANCIAL DATA (unaudited)
Quarterly information has been restated to reflect eV PRODUCTS as a discontinued operation for the fiscal year ended June 30, 2009.
FISCAL 2010
| QUARTER ENDED | September 30, 2009 |
December 31, 2009 |
March 31, 2010 |
June 30, 2010 | |||||||||||
| ($000 except per share data) |
|||||||||||||||
| Net revenues |
$ | 65,538 | $ | 68,785 | $ | 97,531 | $ | 113,237 | |||||||
| Cost of goods sold, including contract activity |
39,668 | 42,379 | 60,779 | 67,666 | |||||||||||
| Internal research and development |
2,435 | 2,287 | 3,238 | 3,846 | |||||||||||
| Selling, general and administrative |
14,939 | 16,921 | 18,985 | 20,267 | |||||||||||
| Interest expense |
24 | 19 | 1 | 43 | |||||||||||
| Other expense (income) – net |
73 | (205 | ) | 82 | 327 | ||||||||||
| Earnings from continuing operations before income taxes |
8,399 | 7,384 | 14,446 | 21,088 | |||||||||||
| Income taxes |
2,100 | 1,400 | 4,208 | 4,874 | |||||||||||
| Net Earnings |
$ | 6,299 | $ | 5,984 | $ | 10,238 | $ | 16,214 | |||||||
| Net Earnings (Loss) Attributable to Noncontrolling Interests |
$ | (7 | ) | $ | 3 | $ | (75 | ) | $ | 237 | |||||
| Net Earnings Attributable to II-VI Incorporated |
$ | 6,306 | $ | 5,981 | $ | 10,313 | $ | 15,977 | |||||||
| Net Earnings Attributable to II-VI Incorporated: Basic earnings per share: |
$ | 0.21 | $ | 0.20 | $ | 0.34 | $ | 0.52 | |||||||
| Net Earnings Attributable to II-VI Incorporated: Diluted earnings per share: |
$ | 0.21 | $ | 0.20 | $ | 0.33 | $ | 0.51 | |||||||
78
FISCAL 2009
| QUARTER ENDED | September 30, 2008 |
December 31, 2008 |
March 31, 2009 |
June 30, 2009 |
|||||||||||
| ($000 except per share data) |
|||||||||||||||
| Net revenues |
$ | 87,766 | $ | 74,278 | $ | 64,111 | $ | 66,067 | |||||||
| Cost of goods sold, including contract activity |
50,405 | 42,908 | 41,424 | 41,367 | |||||||||||
| Internal research and development |
3,191 | 3,116 | 1,612 | 2,286 | |||||||||||
| Selling, general and administrative |
16,548 | 14,199 | 13,554 | 13,767 | |||||||||||
| Interest expense |
25 | 57 | 68 | 28 | |||||||||||
| Other expense (income) – net |
(235 | ) | 2,837 | (1,534 | ) | 281 | |||||||||
| Earnings from continuing operations before income taxes |
17,832 | 11,161 | 8,987 | 8,338 | |||||||||||
| Income taxes |
281 | 2,782 | 2,177 | 2,167 | |||||||||||
| Earnings from continuing operations |
$ | 17,551 | $ | 8,379 | $ | 6,810 | $ | 6,171 | |||||||
| Income (loss) from discontinued operation, net of income tax benefit |
$ | (23 | ) | $ | 20 | $ | (1,926 | ) | $ | (148 | ) | ||||
| Net Earnings |
$ | 17,528 | $ | 8,399 | $ | 4,884 | $ | 6,023 | |||||||
| Net Earnings (Loss) Attributable to Noncontrolling Interests |
33 | 40 | 74 | (94 | ) | ||||||||||
| Net Earnings Attributable to II-VI Incorporated |
$ | 17,495 | $ | 8,359 | $ | 4,810 | $ | 6,117 | |||||||
| Net Earnings Attributable to II-VI Incorporated: Basic earnings per share: |
|||||||||||||||
| Continuing operations |
$ | 0.59 | $ | 0.28 | $ | 0.23 | $ | 0.21 | |||||||
| Discontinued operation |
$ | (0.00 | ) | $ | — | $ | (0.07 | ) | $ | (0.00 | ) | ||||
| Consolidated |
$ | 0.58 | $ | 0.28 | $ | 0.16 | $ | 0.21 | |||||||
| Net Earnings Attributable to II-VI Incorporated: Diluted earnings per share: |
|||||||||||||||
| Continuing operations |
$ | 0.57 | $ | 0.28 | $ | 0.23 | $ | 0.21 | |||||||
| Discontinued operation |
$ | (0.00 | ) | $ | — | $ | (0.06 | ) | $ | (0.01 | ) | ||||
| Consolidated |
$ | 0.57 | $ | 0.28 | $ | 0.16 | $ | 0.21 | |||||||
79
SCHEDULE II
II-VI INCORPORATED AND SUBSIDIARIES
VALUATION AND QUALIFYING ACCOUNTS
YEARS ENDED JUNE 30, 2010, 2009, AND 2008
(IN THOUSANDS OF DOLLARS)
| Balance at Beginning of Year |
Additions | Additions
to (Deduction) from Reserves |
Balance at End of Year | |||||||||||||||
| Charged to Expense |
Charged to Other Accounts |
|||||||||||||||||
| YEAR ENDED JUNE 30, 2010: |
||||||||||||||||||
| Allowance for doubtful accounts |
$ | 1,029 | $ | 115 | $ | 102 | 1 | $ | (165 | )2 | $ | 1,081 | ||||||
| Warranty reserves |
$ | 861 | $ | 176 | $ | — | $ | — | $ | 1,037 | ||||||||
| YEAR ENDED JUNE 30, 2009: |
||||||||||||||||||
| Allowance for doubtful accounts |
$ | 1,170 | $ | (312 | ) | $ | — | $ | 171 | 3 | $ | 1,029 | ||||||
| Warranty reserves |
$ | 777 | $ | 8 | $ | — | $ | 76 | 3 | $ | 861 | |||||||
| YEAR ENDED JUNE 30, 2008: |
||||||||||||||||||
| Allowance for doubtful accounts |
$ | 1,121 | $ | (14 | ) | $ | 92 | 4 | $ | (29 | ) | $ | 1,170 | |||||
| Warranty reserves |
$ | 926 | $ | (149 | ) | $ | — | $ | — | $ | 777 | |||||||
| 1 | Primarily relates to allowance for doubtful accounts from the acquisition of Photop, ($297) offset by foreign currency translations and transfers to other accounts. |
| 2 | Primarily relates to write-offs of accounts receivable. |
| 3 | Primarily relates to allowance for doubtful accounts and warranty reserve transferred from eV PRODUCTS Inc. as the Company retained the accounts receivable, related allowance for doubtful accounts and warranty obligation as part of the sale of eV PRODUCTS Inc. |
| 4 | Primarily relates to the allowance for doubtful accounts from the acquisition of Pacific Rare Specialty Metals & Chemicals, Inc. and HIGHYAG Lasertechnologie, GmbH. |
80
| ITEM 9. | CHANGES IN AND DISAGREEMENTS WITH ACCOUNTANTS ON ACCOUNTING AND FINANCIAL DISCLOSURE |
None.
| ITEM 9A. | CONTROLS AND PROCEDURES |
Evaluation of Disclosure Controls and Procedures
The Company’s management evaluated, with the participation of Francis J. Kramer, the Company’s Chief Executive Officer and Craig A. Creaturo, the Company’s Chief Financial Officer and Treasurer, the effectiveness of the Company’s disclosure controls and procedures (as defined in Rules 13a-15(e) and 15d-15(e) of the Securities Exchange Act of 1934, as amended) as of the end of the period covered by this annual report on Form 10-K. The Company’s disclosure controls were designed to provide reasonable assurance that information required to be disclosed in reports that we file or submit under the Securities Exchange Act of 1934 is recorded, processed, summarized and reported within the time periods specified in the rules and forms of the Securities and Exchange Commission. It should be noted that the design of any system of controls is based in part upon certain assumptions about the likelihood of future events, and there can be no assurance that any design will succeed in achieving its stated goals under all potential future conditions, regardless of how remote. However, the controls have been designed to provide reasonable assurance of achieving the controls’ stated goals. Based on that evaluation, Messrs. Kramer and Creaturo concluded that the Company’s disclosure controls and procedures are effective at the reasonable assurance level.
The Securities and Exchange Commission’s general guidance permits the exclusion of an assessment of the effectiveness of a registrant’s disclosure controls and procedures as they relate to its internal controls over financial reporting for an acquired business during the first year following such acquisition if, among other circumstances and factors, there is not adequate time between the acquisition date and the date of assessment. As previously noted in this Form 10-K, the Company completed the acquisition of Photop on January 4, 2010. Photop represents $134.9 million of total assets as of June 30, 2010 and $46.9 million of revenues for the year then ended. Management’s assessment and conclusion on the effectiveness of the Company’s disclosure controls and procedures as of June 30, 2010 excludes an assessment of the internal controls over financial reporting of Photop.
Management’s Report on Internal Control Over Financial Reporting
Our management is responsible for establishing and maintaining adequate internal control over financial reporting, as such term is defined in Rule 13a-15(f) and 15d-15(f) under the Securities Exchange Act of 1934. Under the supervision and with the participation of our management, including our Chief Executive Officer and Chief Financial Officer, we conducted an evaluation of the effectiveness of our internal control over financial reporting based on the “Internal Control-Integrated Framework” issued by the Committee of Sponsoring Organizations (COSO) of the Treadway Commission. See the “Report of Management” which is set forth under Item 8 above and is incorporated herein by reference.
Report of the Registered Public Accounting Firm
The report of Ernst & Young LLP, an independent registered public accounting firm with respect to our internal control over financial reporting is included in Item 8.
Changes in Internal Control over Financial Reporting
There have been no changes in the Company’s internal controls over financial reporting that occurred during our most recent quarter that has materially affected, or is reasonably likely to materially affect, our internal control over financial reporting.
| ITEM 9B. | OTHER INFORMATION |
None.
81
PART III
| ITEM 10. | DIRECTORS AND EXECUTIVE OFFICERS OF THE REGISTRANT |
The information set forth above in Part I under the caption “Executive Officers of the Registrant” is incorporated herein by reference. The other information required by this item is incorporated herein by reference to the information set forth under the captions “Election of Directors,” “Meetings and Committees of the Board of Directors” and “Other Information – Section 16(a) Beneficial Ownership Reporting Compliance” in the Company’s definitive proxy statement for the 2010 Annual Meeting of Shareholders to be filed pursuant to Regulation 14A of the Securities Exchange Act of 1934, as amended (the “Proxy Statement”).
Audit Committee Financial Expert
The information as to the Audit Committee and the Audit Committee Financial Expert is incorporated herein by reference to the information set forth under the caption “Meetings and Committees of the Board of Directors-Audit Committee” in the Company’s Proxy Statement.
Code of Ethics
The Company has adopted its Code of Business Conduct and Ethics for all of its employees and its Code of Ethics for Senior Financial Officers including the principal executive officer and principal financial officer. The Code of Business Conduct and Ethics and Code of Ethics for Senior Financial Officers can be found on the Company’s internet web site at www.ii-vi.com under “Investors Information – Corporate Governance Documents.” Any person may also obtain a copy of the Code of Business Conduct and/or the Code of Ethics for Senior Financial Officer without charge by submitting their request to the Chief Financial Officer and Treasurer of II-VI Incorporated, 375 Saxonburg Boulevard, Saxonburg, Pennsylvania 16056 or by calling (724) 352-4455.
The web site and information contained on it or incorporated in it are not intended to be incorporated in this Annual Report on Form 10-K or other filings with the Securities and Exchange Commission.
| ITEM 11. | EXECUTIVE COMPENSATION |
The information required by this item is incorporated herein by reference to the information set forth under the caption “Executive Compensation” in the Company’s Proxy Statement.
| ITEM 12. | SECURITY OWNERSHIP OF CERTAIN BENEFICIAL OWNERS AND MANAGEMENT AND RELATED STOCKHOLDER MATTERS |
The information required by this item is incorporated herein by reference to the information set forth under the captions “Equity Compensation Plan Information” and “Principal Shareholders” in the Company’s Proxy Statement.
| ITEM 13. | CERTAIN RELATIONSHIPS AND RELATED TRANSACTIONS AND DIRECTOR INDEPENDENCE |
The information required by this item is incorporated herein by reference to the information set forth under the caption “Director Independence and Corporate Governance” in the Proxy Statement.
| ITEM 14. | PRINCIPAL ACCOUNTANT FEES AND SERVICES |
The information required by this item is incorporated herein by reference to the information set forth under the caption “Ratification of Selection of Independent Registered Public Accounting Firm” in the Company’s Proxy Statement.
82
PART IV
| ITEM 15. | EXHIBITS AND FINANCIAL STATEMENT SCHEDULES |
| (a) |
(1) Financial Statements |
The financial statements are set forth under Item 8 of this annual report on Form 10-K.
(2) Schedules
Schedule II – Valuation and Qualifying Accounts for each of the three years in the period ended June 30, 2010 is set forth under Item 8 of this annual report on Form 10-K.
Financial statements, financial statement schedules and exhibits not listed have been omitted where the required information is included in the consolidated financial statements or notes thereto, or is not applicable or required.
(3) Exhibits.
| Exhibit Number |
Description of Exhibit |
|||
| 2.01 | Merger Agreement by and among II-VI Incorporated, II-VI Holdings B.V., II-VI Cayman, Inc. Photop Technologies, Inc. And the Shareholder Representative named Therein, dated as of December 28, 2009 |
Incorporated herein by reference is Exhibit 2.1 to II-VI’s Current Report on Form 8-K filed on January 4, 2010. | ||
| 3.01 | Amended and Restated Articles of Incorporation of II-VI Incorporated |
Incorporated herein by reference is Exhibit 3.1 to II-VI’s Current Report on Form 8-K filed on November 12, 2004. | ||
| 3.02 | Amended and Restated By-Laws of II-VI Incorporated |
Incorporated herein by reference is Exhibit 3.2 to II-VI’s Annual Report on Form 10-K for the fiscal year ended June 30, 2009. | ||
| 10.01 | II-VI Incorporated Amended and Restated Employees’ Stock Purchase Plan | Incorporated herein by reference is Exhibit 10.04 to II-VI’s Registration Statement No. 33-16389 on Form S-1. | ||
| 10.02 | First Amendment to the II-VI Incorporated Amended and Restated Employees’ Stock Purchase Plan | Incorporated herein by reference is Exhibit 10.01 to II-VI’s Quarterly Report on Form 10-Q for the Quarter Ended March 31, 1996. | ||
| 10.03 | II-VI Incorporated Amended and Restated Employees’ Profit-Sharing Plan and Trust Agreement, as amended | Incorporated herein by reference is Exhibit 10.05 to II-VI’s Registration Statement No. 33-16389 on Form S-1. | ||
| 10.04 | Form of Representative Agreement between II-VI and its foreign representatives |
Incorporated herein by reference is Exhibit 10.15 to II-VI’s Registration Statement No. 33-16389 on Form S-1. | ||
83
| Exhibit Number |
Description of Exhibit |
|||
| 10.05 | Form of Employment Agreement* | Incorporated herein by reference is Exhibit 10.16 to II-VI’s Registration Statement No. 33-16389 on Form S-1. | ||
| 10.06 | Description of Management-By-Objective Plan* | Incorporated herein by reference is Exhibit 10.09 to II-VI’s Annual Report on Form 10-K for the fiscal year ended June 30, 1993. | ||
| 10.07 | Trust Under the II-VI Incorporated Deferred Compensation Plan* | Incorporated herein by reference is Exhibit 10.13 to II-VI’s Annual Report on Form 10-K for the fiscal year ended June 30, 1996. | ||
| 10.08 | Description of Bonus Incentive Plan* | Incorporated herein by reference is Exhibit 10.14 to II-VI’s Annual Report on Form 10-K for the fiscal year ended June 30, 1996. | ||
| 10.09 | Amended and Restated II-VI Incorporated Deferred Compensation Plan* | Incorporated herein by reference is Exhibit 10.01 to II-VI’s Quarterly Report on Form 10-Q for the Quarter Ended December 31, 1996. | ||
| 10.10 | II-VI Incorporated Stock Option Plan of 2001* | Incorporated herein by reference is Exhibit 4.1 to II-VI’s Registration Statement No. 333-74682 on Form S-8. | ||
| 10.11 | Example Form of Stock Option Agreement under the II-VI Incorporated Stock Option Plan of 2001* | Incorporated herein by reference is Exhibit 10.17 to II-VI’s Annual Report on Form 10-K for the fiscal year ended June 30, 2004. | ||
| 10.12 | II-VI Incorporated Arrangement for Director Compensation* | Incorporated herein by reference is Exhibit 10.12 to II-VI’s Annual Report on Form 10-K for the year ended June 30, 2009. | ||
| 10.13 | II-VI Incorporated 2005 Omnibus Incentive Plan* | Incorporated herein by reference is Exhibit A to II-VI’s Definitive Proxy Statement on Schedule 14A filed on September 26, 2005. | ||
| 10.14 | Form of Nonqualified Stock Option under the II-VI Incorporated 2005 Omnibus Incentive Plan* | Incorporated herein by reference is Exhibit 10.01 to II-VI’s Quarterly Report on Form 10-Q for the Quarter Ended December 31, 2005. | ||
| 10.15 | Form of Restricted Share Award under the II-VI Incorporated 2005 Omnibus Incentive Plan* | Incorporated herein by reference is Exhibit 10.02 to II-VI’s Quarterly Report on Form 10-Q for the Quarter Ended December 31, 2005. | ||
84
| Exhibit Number |
Description of Exhibit |
|||
| 10.16 | Form of Deferred Share Award under the II-VI Incorporated 2005 Omnibus Incentive Plan* | Incorporated herein by reference is Exhibit 10.03 to II-VI’s Quarterly Report on Form 10-Q for the Quarter Ended December 31, 2005. | ||
| 10.17 | Form of Performance Unit Award under the II-VI Incorporated 2005 Omnibus Incentive Plan* |
Incorporated herein by reference is Exhibit 10.04 to II-VI’s Quarterly Report on Form 10-Q for the Quarter Ended December 31, 2005. | ||
| 10.18 | Form of Stock Appreciation Rights Award under the II-VI Incorporated 2005 Omnibus Incentive Plan* |
Incorporated herein by reference is Exhibit 10.05 to II-VI’s Quarterly Report on Form 10-Q for the Quarter Ended December 31, 2005. | ||
| 10.19 | Form of Performance Share Award under the II-VI Incorporated 2005 Omnibus Incentive Plan* |
Incorporated herein by reference is Exhibit 10.19 to II-VI’s Annual Report on Form 10-K for the fiscal year ended June 30, 2007. | ||
| 10.20 | $60,000,000 Revolving Credit Facility Credit Agreement by and among II-VI Incorporated, guarantors party, various lenders and PNC Bank, National Association dated October 23, 2006. | Incorporated herein by reference is Exhibit 10.1 to II-VI’s Current Report on Form 8-K filed on October 26, 2006. | ||
| 10.21 | 300,000,000 Japanese Yen Term Loan Second Amendment to Second Amended and Restated Letter Agreement by and among II-VI Japan Incorporated and PNC Bank, National Association dated October 23, 2006. | Incorporated herein by reference is Exhibit 10.2 to II-VI’s Current Report on Form 8-K filed on October 26, 2006. | ||
| 10.22 | Second Allonge to Rate Protection Term Note by and among II-VI Japan Incorporated in favor of PNC Bank, National Association dated October 23, 2006. | Incorporated here by reference is Exhibit 10.3 to II-VI’s Current Report on Form 8-K filed on October 26, 2006. | ||
| 10.23 | First Amendment to Credit Agreement | Incorporated herein by reference is Exhibit 10.23 to II-VI’s Annual Report on Form 10-K for the fiscal year ended June 30, 2007. | ||
| 10.24 | Second Amendment to Credit Agreement | Incorporated herein by reference is Exhibit 10.24 to II-VI’s Annual Report on Form 10-K for the fiscal year ended June 30, 2007. | ||
85
| Exhibit Number |
Description of Exhibit |
|||
| 10.25 | Amended and Restated Employment Agreement by and between II-VI and Francis J. Kramer | Incorporated herein by reference to Exhibit 10.1 to II-VI’s Current Report on Form 8-K filed on September 24, 2008. | ||
| 10.26 | Amended and Restated Employment Agreement by and between II-VI and Vincent D. Mattera, Jr. | Incorporated herein by reference to Exhibit 10.1 to II-VI’s Current Report on Form 8-K filed on September 24, 2008. | ||
| 10.27 | Description of Discretionary Incentive Plan* | Incorporated herein by reference is Exhibit 10.27 to II- VI’s Annual Report on Form 10-K for the fiscal year ended June 30, 2009. | ||
| 10.28 | II-VI Incorporated 2009 Omnibus Incentive Plan* | Incorporated herein by reference is Exhibit A to II-VI’s Definitive Proxy Statement on Schedule 14A filed on September 25, 2009. | ||
| 21.01 | List of Subsidiaries of II-VI Incorporated | Filed herewith. | ||
| 23.01 | Consent of Ernst & Young LLP | Filed herewith. | ||
| 31.01 | Certification of the Chief Executive Officer pursuant to Rule 13a-14(a) of the Securities Exchange Act of 1934, as amended, and Section 302 of the Sarbanes-Oxley Act of 2002 | Filed herewith. | ||
| 31.02 | Certification of the Chief Financial Officer pursuant to Rule 13a-14(a) of the Securities Exchange Act of 1934, as amended, and Section 302 of the Sarbanes-Oxley Act of 2002 | Filed herewith. | ||
| 32.01 | Certification of the Chief Executive Officer pursuant to Rule 13a-14(b) of the Securities Exchange Act of 1934, as amended, and 18 U.S.C. § 1350 as adopted pursuant to Section 906 of the Sarbanes-Oxley Act of 2002 | Filed herewith. | ||
| 32.02 | Certification of the Chief Financial Officer pursuant to Rule 13a-14(b) of the Securities Exchange Act of 1934, as amended, and 18 U.S.C. § 1350 as adopted pursuant to Section 906 of the Sarbanes-Oxley Act of 2002 | Filed herewith. | ||
| * | Denotes management contract or compensatory plan, contract or arrangement. |
The Registrant will furnish to the Commission upon request copies of any instruments not filed herewith which authorize the issuance of long-term obligations of the Registrant not in excess of 10% of the Registrant’s total assets on a consolidated basis.
86
SIGNATURES
Pursuant to the requirements of Section 13 or 15(d) of the Securities Exchange Act of 1934, the registrant has duly caused this report to be signed on its behalf by the undersigned, thereunto duly authorized.
| II-VI INCORPORATED | ||||||
| Date: August 27, 2010 | By: |
/s/ Francis J. Kramer | ||||
| Francis J. Kramer | ||||||
| President, Chief Executive Officer and Director | ||||||
Pursuant to the requirements of the Securities Exchange Act of 1934, this report has been signed below by the following persons on behalf of the registrant and in the capacities and on the dates indicated.
| Principal Executive Officer: | ||||
| Date: August 27, 2010 |
By: | /s/ Francis J. Kramer | ||
| Francis J. Kramer | ||||
| President, Chief Executive Officer and Director | ||||
| Principal Financial and Accounting Officer: | ||||
| Date: August 27, 2010 |
By: | /s/ Craig A. Creaturo | ||
| Craig A. Creaturo | ||||
| Chief Financial Officer and Treasurer | ||||
| Date: August 27, 2010 |
By: | /s/ Carl J. Johnson | ||
| Carl J. Johnson | ||||
| Director | ||||
| Date: August 27, 2010 |
By: | /s/ Joseph J. Corasanti | ||
| Joseph J. Corasanti | ||||
| Director | ||||
| Date: August 27, 2010 |
By: | /s/ Wendy F. DiCicco | ||
| Wendy F. DiCicco | ||||
| Director | ||||
| Date: August 27, 2010 |
By: | /s/ Thomas E. Mistler | ||
| Thomas E. Mistler | ||||
| Director | ||||
| Date: August 27, 2010 |
By: | /s/ RADM Marc Y. E. Pelaez (retired) | ||
| RADM Marc Y. E. Pelaez (retired) | ||||
| Director | ||||
| Date: August 27, 2010 |
By: | /s/ Peter W. Sognefest | ||
| Peter W. Sognefest | ||||
| Director | ||||
87
EXHIBIT INDEX
| 2.01 | Merger Agreement by and among II-VI Incorporated, II-VI Holdings B.V., II-VI Cayman, Inc. Photop Technologies, Inc. And the Shareholder Representative named Therein, dated as of December 28, 2009 | Incorporated herein by reference is Exhibit 2.1 to II-VI’s Current Report on Form 8-K filed on January 4, 2010. | ||
| 3.01 | Amended and Restated Articles of Incorporation of II-VI Incorporated | Incorporated herein by reference is Exhibit 3.1 to II-VI’s Current Report on Form 8-K filed on November 12, 2004. | ||
| 3.02 | Amended and Restated By-Laws of II-VI Incorporated | Incorporated herein by reference is Exhibit 3.2 to II-VI’s Annual Report on Form 10-K for the fiscal year ended June 30, 2009. | ||
| 10.01 | II-VI Incorporated Amended and Restated Employees’ Stock Purchase Plan | Incorporated herein by reference is Exhibit 10.04 to II-VI’s Registration Statement No. 33-16389 on Form S-1. | ||
| 10.02 | First Amendment to the II-VI Incorporated Amended and Restated Employees’ Stock Purchase Plan | Incorporated herein by reference is Exhibit 10.01 to II-VI’s Quarterly Report on Form 10-Q for the Quarter Ended March 31, 1996. | ||
| 10.03 | II-VI Incorporated Amended and Restated Employees’ Profit-Sharing Plan and Trust Agreement, as amended | Incorporated herein by reference is Exhibit 10.05 to II-VI’s Registration Statement No. 33-16389 on Form S-1. | ||
| 10.04 | Form of Representative Agreement between II-VI and its foreign representatives | Incorporated herein by reference is Exhibit 10.15 to II-VI’s Registration Statement No. 33-16389 on Form S-1. | ||
| 10.05 | Form of Employment Agreement* | Incorporated herein by reference is Exhibit 10.16 to II-VI’s Registration Statement No. 33-16389 on Form S-1. | ||
| 10.06 | Description of Management-By- Objective Plan* | Incorporated herein by reference is Exhibit 10.09 to II-VI’s Annual Report on Form 10-K for the fiscal year ended June 30, 1993. | ||
| 10.07 | Trust Under the II-VI Incorporated Deferred Compensation Plan* | Incorporated herein by reference is Exhibit 10.13 to II-VI’s Annual Report on Form 10-K for the fiscal year ended June 30, 1996. | ||
| 10.08 | Description of Bonus Incentive Plan* | Incorporated herein by reference is Exhibit 10.14 to II-VI’s Annual Report on Form 10-K for the fiscal year ended June 30, 1996. | ||
| 10.09 | Amended and Restated II-VI Incorporated Deferred Compensation Plan* | Incorporated herein by reference is Exhibit 10.01 to II-VI’s Quarterly Report on Form 10-Q for the Quarter Ended December 31, 1996. | ||
88
| 10.10 | II-VI Incorporated Stock Option Plan of 2001* | Incorporated herein by reference is Exhibit 4.1 to II-VI’s Registration Statement No. 333-74682 on Form S-8. | ||
| 10.11 | Example Form of Stock Option Agreement under the II-VI Incorporated Stock Option Plan of 2001* | Incorporated herein by reference is Exhibit 10.17 to II-VI’s Annual Report on Form 10-K for the fiscal year ended June 30, 2004. | ||
| 10.12 | II-VI Incorporated Arrangement for Director Compensation* | Incorporated herein by reference is Exhibit 10.12 to II-VI’s Annual Report on Form 10-K for the year ended June 30, 2009. | ||
| 10.13 | II-VI Incorporated 2005 Omnibus Incentive Plan* | Incorporated herein by reference is Exhibit A to II-VI’s Definitive Proxy Statement on Schedule 14A filed on September 26, 2005. | ||
| 10.14 | Form of Nonqualified Stock Option under the II-VI Incorporated 2005 Omnibus Incentive Plan* |
Incorporated herein by reference is Exhibit 10.01 to II-VI’s Quarterly Report on Form 10-Q for the Quarter Ended December 31, 2005. | ||
| 10.15 | Form of Restricted Share Award under the II-VI Incorporated 2005 Omnibus Incentive Plan* | Incorporated herein by reference is Exhibit 10.02 to II-VI’s Quarterly Report on Form 10-Q for the Quarter Ended December 31, 2005. | ||
| 10.16 | Form of Deferred Share Award under the II-VI Incorporated 2005 Omnibus Incentive Plan* | Incorporated herein by reference is Exhibit 10.03 to II-VI’s Quarterly Report on Form 10-Q for the Quarter Ended December 31, 2005. | ||
| 10.17 | Form of Performance Unit Award under the II-VI Incorporated 2005 Omnibus Incentive Plan* | Incorporated herein by reference is Exhibit 10.04 to II-VI’s Quarterly Report on Form 10-Q for the Quarter Ended December 31, 2005. | ||
| 10.18 | Form of Stock Appreciation Rights Award under the II-VI Incorporated 2005 Omnibus Incentive Plan* | Incorporated herein by reference is Exhibit 10.05 to II-VI’s Quarterly Report on Form 10-Q for the Quarter Ended December 31, 2005. | ||
| 10.19 | Form of Performance Share Award under the II-VI Incorporated 2005 Omnibus Incentive Plan* |
Incorporated herein by reference is Exhibit 10.19 to II-VI’s Annual Report on Form 10-K for the fiscal year ended June 30, 2007. | ||
| 10.20 | $60,000,000 Revolving Credit Facility Credit Agreement by and among II-VI Incorporated, guarantors party, various lenders and PNC Bank, National Association dated October 23, 2006. | Incorporated herein by reference is Exhibit 10.1 to II-VI’s Current Report on Form 8-K filed on October 26, 2006. | ||
| 10.21 | 300,000,000 Japanese Yen Term Loan Second Amendment to Second Amended and Restated Letter Agreement by and among II-VI Japan Incorporated and PNC Bank, National Association dated October 23, 2006. | Incorporated herein by reference is Exhibit 10.2 to II-VI’s Current Report on Form 8-K filed on October 26, 2006. | ||
89
| 10.22 | Second Allonge to Rate Protection Term Note by and among II-VI Japan Incorporated in favor of PNC Bank, National Association dated October 23, 2006. | Incorporated here by reference is Exhibit 10.3 to II-VI’s Current Report on Form 8-K filed on October 26, 2006. | ||
| 10.23 | First Amendment to Credit Agreement | Incorporated herein by reference is Exhibit 10.23 to II-VI’s Annual Report on Form 10-K for the fiscal year ended June 30, 2007. | ||
| 10.24 | Second Amendment to Credit Agreement | Incorporated herein by reference is Exhibit 10.24 to II-VI’s Annual Report on Form 10-K for the fiscal year ended June 30, 2007. | ||
| 10.25 | Amended and Restated Employment Agreement by and between II-VI and Francis J. Kramer | Incorporated herein by reference to Exhibit 10.1 to II-VI’s Current Report on Form 8-K filed on September 24, 2008. | ||
| 10.26 | Amended and Restated Employment Agreement by and between II-VI and Vincent D. Mattera, Jr. | Incorporated herein by reference to Exhibit 10.1 to II-VI’s Current Report on Form 8-K filed on September 24, 2008. | ||
| 10.27 | Description of Discretionary Incentive Plan* | Incorporated herein by reference is Exhibit 10.27 to II-VI’s Annual Report on Form 10-K for the fiscal year ended June 30, 2009. | ||
| 10.28 | II-VI Incorporated 2009 Omnibus Incentive Plan* | Incorporated herein by reference is Exhibit A to II-VI’s Definitive Proxy Statement on Schedule 14A filed on September 25, 2009. | ||
| 21.01 | List of Subsidiaries of II-VI Incorporated | Filed herewith. | ||
| 23.01 | Consent of Ernst & Young LLP | Filed herewith. | ||
| 31.01 | Certification of the Chief Executive Officer pursuant to Rule 13a-14(a) of the Securities Exchange Act of 1934, as amended, and Section 302 of the Sarbanes-Oxley Act of 2002 | Filed herewith. | ||
| 31.02 | Certification of the Chief Financial Officer pursuant to Rule 13a-14(a) of the Securities Exchange Act of 1934, as amended, and Section 302 of the Sarbanes-Oxley Act of 2002 | Filed herewith. | ||
| 32.01 | Certification of the Chief Executive Officer pursuant to Rule 13a-14(b) of the Securities Exchange Act of 1934, as amended, and 18 U.S.C. § 1350 as adopted pursuant to Section 906 of the Sarbanes-Oxley Act of 2002 | Filed herewith. | ||
| 32.02 | Certification of the Chief Financial Officer pursuant to Rule 13a-14(b) of the Securities Exchange Act of 1934, as amended, and 18 U.S.C. § 1350 as adopted pursuant to Section 906 of the Sarbanes-Oxley Act of 2002 | Filed herewith. | ||
| * | Denotes management contract or compensatory plan, contract or arrangement. |
The Registrant will furnish to the Commission upon request copies of any instruments not filed herewith which authorize the issuance of long-term obligations of the Registrant not in excess of 10% of the Registrant’s total assets on a consolidated basis.
90