Attached files
| file | filename |
|---|---|
| EX-31.2 - EX-31.2 - CSW INDUSTRIALS, INC. | d179685dex312.htm |
| EX-32.2 - EX-32.2 - CSW INDUSTRIALS, INC. | d179685dex322.htm |
| EX-32.1 - EX-32.1 - CSW INDUSTRIALS, INC. | d179685dex321.htm |
| EX-31.1 - EX-31.1 - CSW INDUSTRIALS, INC. | d179685dex311.htm |
| EX-23.1 - EX-23.1 - CSW INDUSTRIALS, INC. | d179685dex231.htm |
| EX-21.1 - EX-21.1 - CSW INDUSTRIALS, INC. | d179685dex211.htm |
| EX-10.16 - EX-10.16 - CSW INDUSTRIALS, INC. | d179685dex1016.htm |
| EX-10.15 - EX-10.15 - CSW INDUSTRIALS, INC. | d179685dex1015.htm |
Table of Contents
UNITED STATES
SECURITIES AND EXCHANGE COMMISSION
Washington, D.C. 20549
FORM 10-K
| x | ANNUAL REPORT PURSUANT TO SECTION 13 OR 15(d) OF THE SECURITIES EXCHANGE ACT OF 1934 |
For the fiscal year ended March 31, 2016
OR
| ¨ | TRANSITION REPORT PURSUANT TO SECTION 13 OR 15(d) OF THE SECURITIES EXCHANGE ACT OF 1934 |
For the transition period from to
Commission file number 001-37454
CSW INDUSTRIALS, INC.
(Exact name of registrant as specified in its charter)
| Delaware | 47-2266942 | |
| (state or other jurisdiction of incorporation or organization) |
(I.R.S. Employer Identification No.) | |
| 5420 Lyndon B. Johnson Freeway, Suite 500, Dallas, Texas | 75240 | |
| (Address of principal executive offices) | (zip code) | |
(214) 884-3777
Registrant’s telephone number, including area code:
Securities registered pursuant to Section 12(b) of the Act:
| Title of each class |
Name of each exchange on which registered | |
| Common Stock, par value $0.01 per share | Nasdaq Stock Market LLC |
Securities registered pursuant to section 12(g) of the Act: None
Indicate by check mark if the registrant is a well-known seasoned issuer, as defined in Rule 405 of the Securities Act. Yes ¨ No x
Indicate by check mark if the registrant is not required to file reports pursuant to Section 13 or Section 15(d) of the Act. Yes ¨ No x
Indicate by check mark whether the registrant (1) has filed all reports required to be filed by Section 13 or 15(d) of the Securities Exchange Act of 1934 during the preceding 12 months (or for such shorter period that the registrant was required to file such reports) and (2) has been subject to such filing requirements for the past 90 days. Yes x No ¨
Indicate by check mark whether the registrant has submitted electronically and posted on its corporate Web site, if any, every Interactive Data File required to be submitted and posted pursuant to Rule 405 of Regulation S-T (§232.405 of this chapter) during the preceding 12 months (or for such shorter period that the registrant was required to submit and post such files). Yes x No ¨
Indicate by check mark if disclosure of delinquent filers pursuant to Item 405 of Regulation S-K (§229.405) is not contained herein, and will not be contained, to the best of the registrant’s knowledge, in definitive proxy or information statements incorporated by reference in Part III of this Form 10-K or any amendment to this Form 10-K. ¨
Indicate by check mark whether the registrant is a large accelerated filer, an accelerated filer, a non-accelerated filer, or a smaller reporting company. See the definitions of “large accelerated filer,” “accelerated filer” and “smaller reporting company” in Rule 12b-2 of the Exchange Act. (Check one):
| Large accelerated filer | ¨ | Accelerated filer | ¨ | |||
| Non-accelerated filer | x (do not check if smaller reporting company) | Smaller reporting company | ¨ | |||
Indicate by check mark whether the registrant is a shell company (as defined in Rule 12b-2 of the Exchange Act). Yes ¨ No x
The aggregate market value of the registrant’s common stock held by non-affiliates as of September 30, 2015 was approximately $480.8 million, based upon the “when issued” trading price of the registrant’s common stock as of such date. As of September 30, 2015 (the last business day of our most recently completed second fiscal quarter), the registrant’s common stock only traded on a “when issued” basis. The registrant’s common stock did not start trading “regular way” on the Nasdaq Global Select Market until October 1, 2015.
As of June 2, 2016, the latest practicable date, 15,718,188 shares of the registrant’s common stock, par value $0.01 per share, were issued and outstanding.
DOCUMENTS INCORPORATED BY REFERENCE
Certain information contained in the definitive proxy statement for the registrant’s 2016 Annual Meeting of Stockholders scheduled to be held on August 8, 2016 is incorporated by reference into Part III hereof.
Table of Contents
EX-23.1
EX-101 INSTANCE DOCUMENT
EX-101 SCHEMA DOCUMENT
EX-101 CALCULATION LINKBASE DOCUMENT
EX-101 LABELS LINKBASE DOCUMENT
EX-101 PRESENTATION LINKBASE DOCUMENT
EX-101 DEFINITION LINKBASE DOCUMENT
Table of Contents
PART I
Unless otherwise specified, or the context otherwise requires, the references in this Annual Report on Form 10-K for the year ended March 31, 2016 (“Annual Report”) to “our company,” “the Company,” “we,” “us,” “our” or “CSWI” refer to CSW Industrials, Inc. together with our operating subsidiaries, which includes The RectorSeal Corporation (“RectorSeal”), The Whitmore Manufacturing Company (“Whitmore”), Jet-Lube, Inc. (“Jet-Lube”), Balco, Inc. (“Balco”), Strathmore Holdings, LLC (“Strathmore”), Smoke Guard, Inc. (“Smoke Guard” and all of the Company’s operating subsidiaries collectively, the “Operating Subsidiaries”).
Overview
We were incorporated in the State of Delaware on November 6, 2014 as a wholly owned subsidiary of Capital Southwest Corporation (“Capital Southwest”). We were formed solely for the purpose of effecting the distribution of our outstanding shares of common stock on a pro rata basis to holders of Capital Southwest common stock (the “Share Distribution”) and to become the holding company for a group of manufacturing companies that were owned by Capital Southwest prior to the Share Distribution. The Share Distribution was completed on September 30, 2015, resulted in CSWI becoming a standalone, publicly-traded company with sole ownership of the Operating Subsidiaries.
Our Company
We are a diversified industrial growth company with well-established, scalable platforms and domain expertise across three business segments: Industrial Products; Coatings, Sealants & Adhesives; and Specialty Chemicals. Our broad portfolio of leading products provides performance optimizing solutions to our customers. Our products include mechanical products for heating, ventilation and air conditioning (“HVAC”) and refrigeration applications, coatings and sealants and high performance specialty lubricants. Markets that we serve include HVAC, industrial, rail, plumbing, architecturally-specified building products, energy, mining and other general industrial markets.
Drawing on our innovative and proven technologies, we seek to deliver solutions to our professional customers that require superior performance and reliability. We believe our industrial brands, such as RectorSeal No. 5® and KOPR-KOTE®, are well known in the specific industries we serve and have a reputation for high quality and reliability. Through organic growth and acquisitions, we believe we are well positioned to offer our customers an increasingly broad portfolio of performance optimizing solutions. We have a successful record of making accretive acquisitions – in the last five fiscal years, we completed 13 acquisitions for an aggregate purchase price of $187.3 million. We believe there are further attractive acquisition opportunities available within the markets in which we operate.
We have a long history of providing high quality specialty chemicals, coatings, sealants and other products, accompanied by dependable service and attention to customer satisfaction. Our specialty lubricants were used on the excavation equipment for the Panama Canal in the late 1800s. We also have a long history of innovation. We believe that we were the first to develop a method for removing internal acid from air conditioning and refrigeration systems, pioneering the market for acid neutralizers. We partner with our customers to solve specific challenges, such as environment-friendly lubricants, which were specifically developed to provide high performance in rail applications combined with biodegradability and no eco-toxicity to satisfy strict environmental requirements.
Prior to the Share Distribution, our Operating Subsidiaries operated as separate businesses, which are discussed below:
| • | RectorSeal. RectorSeal formulates specialty chemical products including pipe thread sealants, firestop sealants, plastic solvent cements and other formulations for plumbing, HVAC, electrical and industrial |
1
Table of Contents
| applications, electrical control and mechanical devices, and accessories for ductless mini-split HVAC systems. RectorSeal also makes innovative products for tradesmen and innovative systems for containing flames and smoke from building fires. These products are distributed both domestically and internationally through an extensive distribution network serving the plumbing, industrial, HVAC, refrigeration, construction, electrical and hardware markets. |
RectorSeal was established in 1937 and acquired by Capital Southwest in 1969. It has facilities in Houston, Texas; Fall River, Massachusetts; and Brisbane, Australia. Portions of RectorSeal’s operating results are included in each of our three business segments.
| • | Whitmore. Whitmore manufactures high performance, specialty lubricants for heavy equipment used in surface mining, railroad and other industries. Whitmore also manufactures lubrication equipment, specifically for rail applications, and reliability solutions for a wide variety of industries, including manufacturing, steel, sugar and power. In addition, Whitmore produces water-based coatings for the automotive and primary metals industries. |
Whitmore products and services are sold in over 100 countries around the world through a service intensive distribution network committed to technical support and customer satisfaction. Whitmore’s primary customer base is located in Australia, Brazil, Canada, China, Colombia, the Netherlands, Russia, South Africa, Sweden, the United Kingdom (“U.K.”) and the United States (“U.S.”).
Whitmore was established in 1893 and acquired by Capital Southwest in 1979. It has facilities in Rockwall, Texas and in the U.K. Portions of Whitmore’s operating results are included in each of our three business segments.
| • | Jet-Lube. Jet-Lube is a leading manufacturer of anti-seize compounds, thread sealants and specialty lubrication products and greases. Jet-Lube serves customers worldwide in a wide variety of industries, including energy, water well, mining, manufacturing, electric utility, food processing and agriculture, construction, transportation, valve maintenance, forestry, military, HVAC and plumbing. |
Jet-Lube products are available worldwide through an extensive distribution network with a combination of factory representatives and warehouses in key locations. Portions of Jet-Lube’s operating results are included in our Coatings, Sealants & Adhesives and Specialty Chemicals business segments.
Jet-Lube was established in 1949 and acquired by Capital Southwest in 1973. It has operations in the U.S., Canada and the U.K.
| • | Strathmore. Strathmore manufactures custom designed coatings for customers in various industries, including the rail, mining and industrial sectors. Strathmore markets and sells its products worldwide through a direct sales force. |
Strathmore was founded in 1942 in Syracuse, New York and acquired by Capital Southwest in April 2015. In addition to its facility in New York, Strathmore has facilities in Longview, Texas; Acworth, Georgia; and Houston, Texas. Strathmore’s operating results are included in our Coatings, Sealants & Adhesives segment.
| • | Smoke Guard. Smoke Guard manufactures certified custom safety products for the commercial construction market and other markets requiring smoke and fire protection. Smoke Guard’s proprietary technologies control the movement of smoke and are sold through exclusive distributors primarily in the U.S. Smoke Guard’s operating results are included in our Industrial Products segment. |
Smoke Guard was founded in 1991 and operates in Boise, Idaho and Concord, California. It was acquired by Capital Southwest in 2004.
| • | Balco. Balco is engaged in the fabrication of aluminum and plastic extrusions and products related to safety, slip resistance and emergency egress used by the commercial building industry worldwide. |
2
Table of Contents
Balco was founded in Wichita, Kansas in 1958 and was acquired by Capital Southwest in 1989. It also has a facility in Oklahoma City, Oklahoma. Balco’s operating results are included in our Industrial Products segment.
Our Competitive Strengths
We believe we have the following competitive strengths:
Broad Portfolio of Industry Leading Products and Solutions
We have a broad portfolio of products with leading industry positions in the specific end markets in which we operate. We believe our products and solutions are differentiated from those of our competitors by superior performance, quality and total value delivered to customers. For example, our RectorSeal No. 5® product is widely regarded as an industry standard for thread sealants for HVAC, plumbing and electrical configurations. Additionally, we believe our KOPR-KOTE® product is recognized as the anti-seize compound of choice for use in oil and gas drilling operations, where it is asked for by name.
Sustainable Organic Revenue Growth and Operating Performance
We focus on end markets with strong growth trends, such as HVAC, rail and construction. We also have a loyal customer base that recognizes the performance and quality of our products and solutions, including continuously evaluating the potential uses of existing products to broaden our market penetration. Further, our customer base is diverse – for the fiscal year ended March 31, 2016, no single customer represented more than 10% of our net revenues.
These factors have enabled us to generate strong margin performance. We continue to improve our profitability through targeted investments to further optimize our manufacturing processes. For example, in the Specialty Chemicals segment, we are in the process of consolidating the manufacturing of some of our lubricant and grease products into our Rockwall, Texas facility in order to optimize capacity, improve efficiency and leverage technologies while enhancing product quality and internal environmental, health and safety standards. Further, we continue to refine our manufacturing processes in all of our manufacturing facilities to lower manufacturing costs, increase production capacity and improve product quality.
Stable Platform for Acquisitions with Proven Track Record
We believe our experience in identifying, completing and integrating acquisitions is one of our core competitive strengths, as evidenced by the 34 acquisitions we have successfully completed since 1991. Since April 1, 2011, we have invested $187.3 million in acquisitions that either (1) added new products designed to service our existing end markets or (2) provided an entry into new, complementary end markets where we can drive revenue growth and improved profitability. Historically, our acquisitions have been relatively small, lower-risk acquisitions of a product that we have identified as having the potential to benefit from our extensive distribution network and manufacturing efficiencies. We have also consummated larger acquisitions that complement our business model.
We completed three acquisitions during the fiscal year ended March 31, 2016. Effective April 1, 2015, we acquired substantially all of the assets of Strathmore, a leading participant in the coatings market. Strathmore also has a history of successfully integrating acquisitions, having completed five acquisitions since 1993. Effective October 1, 2015, we acquired substantially all of the assets of Deacon Industries, Inc., a leading manufacturer of high temperature sealants and injectable packings. Effective December 15, 2015, we acquired substantially all of the assets of AC Leak Freeze, a leading manufacturer of original equipment manufacturer-safe air conditioning and refrigerant leak repair solutions.
3
Table of Contents
Culture of Product Enhancement and Customer Centric Solutions
We have a long history of serving our customers with high quality products and solutions. We work closely with our customers, industry experts and research partners to continuously improve our existing products to meet evolving customer and market requirements. Our highly trained and specialized personnel work directly with our current and prospective customers to enhance our product offerings by expanding the use and markets for our existing products. We focus on product enhancements and product line extensions that are designed to meet the specific application needs of our customers. We believe this focus has helped us build strong industrial brands and develop a reputation for high quality, in turn leading us to realize improved customer retention and loyalty. Further, our ability to meet the needs of high-value niche end markets with customized solutions that leverage our existing products has enabled us to differentiate ourselves from our larger competitors that may not have the flexibility or interest in responding quickly to evolving customer demands in these smaller, niche markets.
Diverse Sales and Distribution Channels
Many of our products are sold through service-intensive distribution networks committed to technical support and customer satisfaction. We primarily market through an international network of independent manufacturer representatives and agents calling on our wholesale distributors, contractors and direct customers. The strong, long-term relationships we have developed with our wholesale distribution partners allow us to introduce new products, including both newly developed and acquired products. In addition, our extensive distribution network allows us to reach and serve niche end markets that provide organic growth opportunities and form a key component of our acquisition strategy.
With certain of our products, we also market through a direct sales force focused on specific customer needs. For example, we sell products in our Coatings, Sealants & Adhesive segment directly to rail car and locomotive manufacturers.
Experienced Management Team
Our management team is highly regarded in each of our business segments. Collectively, our management team, including our executive officers, has an average of 25 years of experience in the industrial manufacturing and specialty chemicals industries. They have a successful track record of recognizing and capitalizing upon attractive opportunities in the key markets we serve, and our executive management team has a strong record of effectively managing capital and delivering operating efficiencies over time. In addition, our management team has demonstrated strong capabilities in sourcing and executing strategic and accretive acquisitions.
Our Growth Strategy
We are focused on creating significant stockholder value over the long term by increasing our revenue, profitability and free cash flow by (1) expanding the markets and uses for our existing products and (2) growing the portfolio of products we manufacture, market and sell through targeted acquisitions. We believe the key drivers of our growth include:
Benefits Resulting from the Share Distribution
Historically, we operated as separate independent companies with discrete strategies and capital structures. The Share Distribution has allowed us, as an independent, standalone company, to pursue a strategy focused on rationalizing our organizational structure and management around our three business segments. We expect this strategy to enable us to realize cost and operational synergies, implement best practices across our operations, cross-sell product offerings and, as a result, grow our market share and increase our profitability.
Additionally, we believe our standalone company structure will allow us to more effectively allocate capital across our three business segments, enabling more efficient financing of operations and planned growth.
4
Table of Contents
Leveraging Existing Customer Relationships and Products and Solutions
We expect to continue to increase revenue by leveraging our reputation for providing high quality products to our long-standing customer base. Our team of sales representatives, engineers and other technical personnel continues to proactively collaborate with our distributors and end users to enhance and adapt existing products and solutions to meet evolving customer needs. In addition, we expect to leverage our existing customer base to cross-sell our products and solutions across our three business segments, thereby growing organically.
Focused Acquisitions that Leverage our Distribution Channels
While we are focused on improving our existing products and penetrating new markets with these products, we expect to continue to identify and execute acquisitions that will broaden our portfolio of products and offer attractive risk-adjusted returns. We primarily focus on commercially proven products and solutions that currently have limited distribution, but would benefit from a broader distribution network and be attractive to our customers in target end markets. Once acquired, our intent is to utilize our extensive distribution networks to increase revenue by selling those products to our diversified customer base.
Operational Excellence
We focus on operational excellence in all aspects of our business, with the end goals of improved efficiencies and increased profitability. We will continue to expand improvement initiatives and information sharing across our entire platform, promoting best practices. For example, to accelerate the process of leveraging best practices across our business segments, we recently organized an operations summit among the manufacturing and procurement leaders of our three business segments, which is expected to generate approximately $2 million in annual procurement savings across the business once it is fully implemented. Manufacturing footprint optimization, including the integration of Jet-Lube and Whitmore that is expected to be completed during the fiscal year ended March 31, 2017, is expected to generate approximately $5 million in annual savings in our Specialty Chemicals segment. The majority of these savings will begin to be realized during the fiscal year ending March 31, 2017 with full run-rate savings expected by the end of the fiscal year ending March 31, 2017. We expect to benefit from exploiting new synergy opportunities by applying our best practices when integrating acquisitions. See Note 2 to our consolidated financial statements included in “Item 8. Financial Statements and Supplementary Data” (“Item 8”) of this Annual Report for financial and other information regarding our operations.
Raw Materials and Suppliers
Our products are manufactured using various raw materials, including base oils, copper flake, aluminum, polyvinyl chloride and tetra-hydrofuran. These raw materials are available from numerous sources and we do not anticipate significant shortages of such materials in the future. We generally purchase these raw materials and components as needed. We do not depend on a single source of supply for any significant raw materials.
Intellectual Property
We own a number of trademarks and patents relating to the names and designs of our products. We consider our trademarks and patents to be valuable assets of our business. In addition, our pool of proprietary information, consisting of know-how and trade secrets related to the design, manufacture and operation of our products, is considered particularly valuable. Accordingly, we take proactive measures to protect such proprietary information. We generally own the rights to the products that we manufacture and sell and are not materially encumbered by licensing or franchise agreements. Our trademarks can typically be renewed indefinitely as long as they remain in use, whereas our existing patents generally expire 10 to 20 years from the dates they were filed, which has occurred at various times in the past. We do not believe that the expiration of any individual patent will have a material adverse impact on our business, financial condition or results of operations.
5
Table of Contents
Export Regulations
We are subject to export control regulations in countries from which we export products and services. These controls may apply by virtue of the country in which the products are located or by virtue of the origin of the content contained in the products. If the controls of a particular country apply, the level of control generally depends on the nature of the goods and services in question. Where controls apply, the export of our products generally requires an export license or authorization (either on a per-product or per transaction basis) or that the transaction qualify for a license exception or the equivalent, and may also be subject to corresponding reporting requirements. See Note 16 to our consolidated financial statements included in Item 8 of this Annual Report for financial and other information regarding our operations.
Environmental Regulations
Our operations are subject to certain foreign, federal, state and local regulatory requirements relating to environmental, waste management, labor and health and safety matters. Management believes that our business is operated in material compliance with all such regulations. To date, the cost of such compliance has not had a material impact on our capital expenditures, earnings or competitive position or that of our operating subsidiaries. However, violations may occur in the future as a result of human error, equipment failure or other causes. Further, we cannot predict the nature, scope or effect of environmental legislation or regulatory requirements that could be imposed or how existing or future laws or regulations will be administered or interpreted. Compliance with more stringent laws or regulations, as well as more vigorous enforcement policies of regulatory agencies, could require substantial expenditures by us and could have a material impact on our business, financial condition and results of operations.
Employees
As of March 31, 2016, we employed approximately 725 individuals. Of these employees, 14 are represented by unions. We believe relations with our employees throughout our operations are generally satisfactory, including those employees represented by unions. No unionized facility accounted for more than 10% of our consolidated revenues for the year ended March 31, 2016.
Available Information
We maintain an Internet web site at www.cswindustrials.com. Our Annual Reports on Form 10-K, Quarterly Reports on Form 10-Q, Current Reports on Form 8-K and any amendments to those reports filed or furnished pursuant to Section 13(a) of the Securities Exchange Act of 1934 (the “Exchange Act”) are made available free of charge through the “Investors” section of our Internet web site as soon as reasonably practicable after we electronically file the reports with, or furnish the reports to, the U.S. Securities and Exchange Commission (“SEC”).
We also make available free of charge on our website our Corporate Governance Guidelines and Code of Business Conduct and Ethics, as well as the charters of our Audit Committee, our Compensation and Talent Development Committee and our Nominating and Corporate Governance Committee. You may access these documents in the “Corporate Governance” section on the “Investors” page of our website.
6
Table of Contents
Business Segments
We operate in three business segments: Industrial Products; Coatings, Sealants & Adhesives; and Specialty Chemicals. The table below provides an overview of these business segments. For financial information regarding our segments, see Note 16 to our consolidated financial statements included in Item 8 of this Annual Report.
| Business Segment |
Principal Product Categories |
Key End Use Markets | Representative Industrial Brands | |||
| Industrial Products |
• Specialty mechanical products • Fire and smoke protection products • Architecturally- specified building products • Storage, filtration and application equipment for use with our specialty chemicals and other products |
• Plumbing • HVAC • Refrigeration • Electrical • Commercial construction • Rail car and locomotive • General industrial |
| |||
| Coatings, Sealants & Adhesives |
• Coatings and penetrants • Pipe thread sealants • Firestopping sealants and caulks • Adhesives/solvent cements |
• Rail car and locomotive • Oil and gas • Commercial construction • Plumbing • HVAC • Refrigeration • Electrical • General industrial
|

| |||
| Specialty Chemicals |
• Lubricants and greases • Drilling compounds • Anti-seize compounds • Chemical formulations • Degreasers and cleaners |
• Energy • Drilling and boring • Water well drilling • Mining • Rail car and locomotive • Steel • Power generation • Cement • Aviation • Plumbing • HVAC • Electrical • General industrial
|

| |||

Industrial Products
Our Industrial Products business consists of: specialty mechanical products; fire and smoke protection products; architecturally-specified building products; and storage, filtration and application equipment for use with our specialty chemicals and other products for general industrial applications. These industrial products are primarily manufactured internally, although we strategically engage third-party manufacturers for certain
7
Table of Contents
products. We ensure the quality of internally- and externally-manufactured products through our stringent quality control review procedures. Our building products are eco-friendly, enabling them to be easily incorporated into the “Green Building” market.
| Products Types |
Brand Names | |
| Specialty Mechanical Products • condensate switches, traps and pans • line set covers • condensate removal pumps and equipment mounting brackets • air diffusers for use by professional air conditioning contractors • tamper resistant locking refrigerant caps; • ductless mini-split systems installation support tools • drain waste and vent systems mechanical products • decorative roof drain downspout nozzles • wire pulling head tools. |
• Airtec® • Clean Check® • EZ Trap® • Fortress® • Goliath® Pans • G-O-N® • Hubsett™ • Magic Vent® • Mighty Bracket™ • Novent® • Safe-T-Switch® • Slim Duct™ • SureSeal® • Titan™ Pans • Wire Grabber™ | |
| Fire and Smoke Protection Products | ||
| • fire-rated and smoke-rated opening protective systems |
• Smoke Guard® | |
| Architecturally-Specified Building Products | ||
| • expansion joint covers |
• Balco® | |
| • fire barriers |
• DuraFlex™ | |
| • specialty silicone seals |
• llumiTread™ | |
| • stair nosings |
• MetaBlock™ | |
| • partition closure systems |
• MetaFlex™ | |
| • entrance mats and grids |
• MetaGrate™ | |
| • photoluminescent egress markings and signage |
• MetaMat™ | |
| • trench and access covers |
• Michael Rizza™ | |
| • architectural grating |
• UltraGrid™ | |
| Storage, Filtration and Application Equipment | ||
| • lubrication application and management systems |
• Air Sentry® | |
| • storage and filtration devices |
• Guardian® | |
| • Oil Safe® | ||
| • Whitmore Rail™ | ||
New Product Development – Customer intimacy is a core competency in our Industrial Products segment. We gather the voice of the customer market research through organized focus groups and online surveys, as well as through less formal channels. Ideas for new products or enhancements to existing products are also generated by our relationships with end users, independent sales representatives, distributors and our internal sales and marketing team. We also actively monitor our competitors’ products through websites, tradeshows and patent applications. We develop new products and modify existing products in our research and development (“R&D”) labs in Houston, Texas; Rockwall, Texas; Boise, Idaho; and Wichita, Kansas.
Competition – Our competition in the Industrial Products segment is varied. Competitors range from small entrepreneurial companies with a single product, to large multinational original equipment manufacturers (“OEMs”). In the specialty mechanical products category, we compete with Diversitech, Supco, Little Giant, Mitsubishi, Cherne, Mainline and JR Smith. Most of these products are sold through distribution channels, and we compete based on breadth of product line, customer service and pricing. In the fire and smoke protection
8
Table of Contents
category we compete with Won Door, Stoebich, McKeon and others, typically on the basis of product innovation, knowledge of building codes and customer service. In the architecturally-specified building products category, we compete primarily with Emseal, Inpro, and MM Systems on the basis of product innovation, price and driving architectural specifications. In the lubricant storage, filtration and transfer space, we compete with Des-Case, Hy-Pro, IFH and others on the basis of superior performance, brand strength and breadth of product line.
Customers – Our primary customers for specialty mechanical products are plumbing, HVAC and electrical wholesalers and distributors. Some of these are local single location distributors, but many are regional or national in scope with hundreds of locations. The majority of this business is sold domestically; however, a small portion is sold internationally through similar channels, and a small number of OEMs purchase these products directly. Fire and smoke protection products are sold through local building products distributors who also perform installations and service. Architecturally-specified building products are sold through a network of distributors. Storage, filtration and application products are marketed and sold worldwide through a service-intensive distribution network.
Seasonality – A significant portion of our products are sold into the HVAC market, which is seasonal by nature. While products are sold throughout the year, sales tend to peak during summer months.
Coatings, Sealants & Adhesives
Our Coatings, Sealants & Adhesives segment is comprised of coatings and penetrants, pipe thread sealants, firestopping sealants and caulks and adhesives/solvent cements, which are primarily manufactured internally. We are dedicated to adding value to our customers through focused industry application expertise, diverse industrial coatings technologies, manufacturing excellence and quick response services.
| Products Types |
Brand Names | |
| • High performance coatings designed to increase the reliability, performance and lifespan of industrial equipment • Engineered specialty thread sealants designed to seal and secure metal • Specialty sealants for high temperature applications • Solvent cements and fire stop caulks |
• Bio Fireshield™ • Deacon® • KATS® Coatings • Metacaulk® • Railplex® • RectorSeal No. 5® • Stratholiner™ • T plus 2® • Tru-Blu™ |
New Product Development – We generate new ideas for products or enhancements to existing products through our strong customer and industry knowledge and focus on delivering value to our customers. We develop new and modified products and services that improve the performance of our products, the application of our products, or make it easier for our customers to operate more efficiently. We also actively monitor our competitors’ products through websites, tradeshows and patent applications. New products are developed and existing products are modified in our R&D labs in Syracuse, New York; Houston, Texas; and Rockwall, Texas.
Competition – The competitive environment for products in our Coatings, Sealants & Adhesives segment is varied. For coatings, competitors include the industrial paint divisions of Sherwin Williams, PPG Industries, Valspar Corporation and Akzo Nobel, as well as other coatings companies such as Carboline, Hempel, Jotun and smaller regional coatings producers. Competitors of our sealants and adhesives products include Dow Corning Corporation, Henkel, 3M Company, Specified Technologies Inc and Hilti. We compete primarily on the basis of product differentiation, superior performance, quality and customer centric service.
Customers – For coatings, we primarily serve OEMs and end users in rail, energy, general industrial, power generation and marine markets through our direct sales force and internationally through a distribution network.
9
Table of Contents
Customers include rail car and locomotive manufacturers, petrochemical facilities, industrial manufacturers, construction, utilities and plant maintenance customers. We serve sealants and adhesives customers primarily through our distribution network.
Specialty Chemicals
Our Specialty Chemicals segment manufactures and supplies highly specialized consumables that impart or enhance properties such as lubricity, anti-seize qualities, friction and heat control. These materials are typically used in harsh operating conditions, including extreme heat and pressure and chemical exposure, where commodity lubrication products would fail. These products protect and extend the working life of large capital equipment such as cranes, rail systems, mining equipment, oil rigs and rotating and grinding equipment found in various industrial segments such as steel mills, canning and bottling, milling and cement. Additionally, our Specialty Chemicals segment manufactures and supplies specialty products used in the HVAC and refrigeration market. These products enhance, repair or condition the internal working systems of both industrial and residential systems and are critical to ensuring safe, efficient and effective long-term operational integrity. The Specialty Chemicals segment also supplies products and services into the water well treatment space, which includes testing services and diagnosis of current conditions, coupled with consumable solutions to resolve any problems that have been defined.
| Products Types |
Brand Names | |
| • Railroad track lubricants, conditioners and positive friction consumables • Oil field anti-seize products for drilling and conveyance piping • Open gear specialty lubricants for heavy equipment • Specialty lubricants for various industrial applications • Water well treatment products and services • Chemical sealants to stop air-conditioning refrigerant leaks |
• AC Leak Freeze® • Biorail® • Decathlon™ • Envirolube® • Gearmate® • KOPR-KOTE® • Medallion™ • Paragon™ • Rail Armor® • Run-N-Seal® • Sterilene™ • Surtac® • TOR Armor® • Unicid™ • Well-Guard® • Whitcam® |
New Product Development – We develop relationships with end users and channel partners to understand existing and new operating conditions where technical innovation or enhancement is needed. For example, these relationships have generated innovation in the areas of modifying existing lubrication products to operate in arctic conditions or modifying an existing product for use in an application where salt water may be present. The development teams located in Rockwall, Texas and Houston, Texas are also actively defining new end markets for product use and penetration.
Competition – As our products are specialty, rather than commodity, competitors tend to be varied and include global, regional and local companies that may be large or small. The product sales cycle is long when compared to many consumables, resulting in verifiable and repeatable product performance being the key driver of choice, rather than price. As these products protect and enhance the operation of large capital equipment, qualification is based on the proof of value in application, resulting in a high changeover risk barrier. Typical competitors include Shell, Castrol, Fuchs and Exxon-Mobil.
10
Table of Contents
Customers – Specialty Chemicals products are primarily sold through value-added distribution partners, as well as maintenance and repair operations or catalog channels. Specialty Chemicals provides both market-specific and product line-specific training to both the distribution partners and potential end users. Our specialists often visit end users with our distribution partners to advise on critical application issues, which enhances our ability to both “pull” demand from the end user and “push” demand to the distributor partner.
11
Table of Contents
Consider carefully the following risk factors, which we believe are the principal risks that we face and of which we are currently aware, and the other information in this Annual Report, including our consolidated financial statements and related notes to those financial statements. If any of the risks described below occur, our business, financial results, financial condition and stock price could be materially adversely affected. While we believe the risks disclosed below are the principal risks we face and of which we are currently aware, additional risks and uncertainties not presently known to us, or that we currently deem immaterial, may also impair our business operations.
Risks Relating to Our Business and Industry
The industries in which we operate are highly competitive, and many of our products are in highly competitive markets, particularly certain specialty chemicals products. We may lose market share to producers of other products that can be substituted for our products.
The industries in which we operate are highly competitive, and we face significant competition from both large international producers and from smaller regional competitors. Our competitors may improve their competitive position in our core markets by successfully introducing new products, improving their manufacturing processes or expanding their capacity or manufacturing facilities. Further, some of our competitors benefit from advantageous cost positions that could make it increasingly difficult for us to compete in markets for less-differentiated applications. If we are unable to keep pace with our competitors’ product and manufacturing process innovations or cost position, our financial condition and results of operations could be materially adversely affected.
In addition, competition among producers of certain specialty chemicals products is intense. Increased competition from existing or newly developed chemical products may reduce demand for our products in the future, and our customers may decide on alternate sources to meet their requirements. If we are unable to successfully compete with other producers or if other products can be successfully substituted for our products, our sales may decline.
Difficult and volatile conditions in the overall economy, particularly in the U.S. but also globally, and in the capital, credit and commodities markets could materially adversely affect our financial position, results of operations and cash flows.
Our financial position, results of operations and cash flows could be materially adversely affected by difficult global economic conditions and significant volatility in the capital, credit and commodities markets and in the overall economy. Difficult and volatile conditions in the U.S. and globally could affect our business in a number of ways. For example:
| • | weak economic conditions, especially in our key end markets, including the energy industry, could reduce demand for our products, impacting our revenues and margins; |
| • | as a result of volatility in commodity prices, we may encounter difficulty in achieving sustained market acceptance of past or future price increases, which could have a material adverse effect on our financial position, results of operations and cash flows; |
| • | under difficult market conditions, there can be no assurance that access to credit or the capital markets would be available or sufficient, and in such a case, we may not be able to successfully obtain additional financing on reasonable terms, or at all; and |
| • | market conditions could result in our key customers experiencing financial difficulties and/or electing to limit spending, which in turn could result in decreased sales and earnings for us. |
12
Table of Contents
Our attempts to address evolving customer needs requires that we continually enhance our products. Our efforts to enhance our products may not be commercially viable and failure to develop commercially successful products or keep pace with our competitors could harm our business and results of operations.
The enhancement and extension of our existing products to broaden the market and uses of our existing products is a key driver of our growth, particularly in our Coatings, Sealants & Adhesives segment. However, developing those product enhancements and extensions can be a costly, lengthy and uncertain process, and it is difficult to estimate the commercial success of those products.
A failure to develop commercially successful products or to identify additional uses for existing products could materially and adversely affect our financial results. If our attempts to develop or enhance products is unsuccessful, we may be unable to recover our development costs, which could have an adverse effect on our business and results of operations. In addition, our inability to enhance or develop products that are able to meet the evolving needs of our customers, including a failure to do so that results in our products lagging those of new or existing competitors, could reduce demand for our products and may have a material adverse effect on our business and results of operations.
The cyclical nature of certain industries in which our business operates can cause significant fluctuations in our results of operations and cash flows.
The cyclical nature of the supply and demand balance of the energy and mining industries poses risks to us that are beyond our control and can affect our operating results. These markets are highly competitive; are driven to a large extent by end-use markets; and may experience overcapacity, all of which may affect demand for and pricing of our products and result in volatile operating results and cash flows over our business cycle. Future growth in product demand may not be sufficient to utilize current or future capacity. Excess industry capacity may continue to depress our volumes and margins on some products. Our operating results, accordingly, may be volatile as a result of excess industry capacity, as well as from rising energy and raw materials costs.
Weakness in the energy industry may adversely affect certain segments of our end market customers and reduce our sales and results of operations.
Some of our customers are impacted by current weakness in the energy industry. This means our operations and earnings may be significantly affected by changes in oil, gas and petrochemical prices and drilling activities. Oil, gas, petrochemical and product prices and margins in turn depend on local, regional and global events or conditions that affect supply and demand for the relevant commodity.
We rely on independent distributors. Termination of one or more of our relationships with any of those parties or an increase in their sales of our competitors’ products could have a material adverse effect on our business, financial condition, results of operations or cash flows.
We depend on the services of independent distributors to sell our products and, in many cases, provide service and aftermarket support to end users of our products. Rather than serving as passive conduits for delivery of products, our distributors play a significant role in determining which of our products are available for purchase by contractors to service our customers. Almost all of the distributors with whom we transact business also offer competitors’ products and services to our customers. The loss of a substantial number of our distributors, or an increase in the distributors’ sales of our competitors’ products to our customers, could have a material adverse effect on our business, financial condition, results of operations or cash flows.
Growth of our business will depend in part on market awareness of our industrial brands, and any failure to develop, maintain, protect or enhance our industrial brands would hurt our ability to retain or attract customers.
We believe that building and maintaining market awareness, brand recognition and goodwill is critical to our success. This will depend largely on our ability to continue to provide high-quality products, and we may not be able to do so effectively. Our efforts in developing our industrial brands may be affected by the marketing
13
Table of Contents
efforts of our competitors and our reliance on our independent dealers, distributors and strategic partners to promote our industrial brands effectively. If we are unable to cost-effectively maintain and increase positive awareness of our industrial brands, our businesses, results of operations and financial condition could be harmed.
We are dependent on contract manufacturers for manufacturing of certain products that we sell.
We use third parties to manufacture certain of our products. To the extent that we rely on third parties to perform these functions, we will not be able to directly control product delivery schedules and quality assurance. This lack of control may result in product shortages or quality assurance problems that could delay shipments of products or increase manufacturing, assembly, testing or other costs. If a contractor experiences capacity constraints or financial difficulties, suffers damage to its facilities, experiences power outages, natural disasters, labor shortages or labor strikes, or any other disruption of assembly or testing capacity, we may not be able to obtain alternative manufacturing in a timely manner or on commercially acceptable terms.
We may not be able to consolidate our manufacturing facilities without incurring unanticipated costs and disruptions to our business.
As part of our efforts to streamline and rationalize our manufacturing processes, we are consolidating certain manufacturing facilities. For example, we are in the process of consolidating the production of all lubricant and grease products currently manufactured in one of our Houston, Texas facilities to our Rockwall, Texas facility in order to optimize capacity and efficiency. Because of unanticipated events, including the actions of governments, suppliers, employees or customers, we may not realize the synergies, cost reductions and other benefits of any consolidation to the extent we currently expect.
We may not be able to consummate acquisitions at our historical rate and at appropriate prices, which could negatively impact our growth rate and stock price.
As part of our business strategy, we acquire businesses in the ordinary course, some of which may be material; please see “Item 1. Business” and “Item 7. Management’s Discussion and Analysis of Financial Condition and Results of Operations” included in this Annual Report for additional information. Our ability to grow revenues, earnings and cash flow at or above our historic rates depends in part upon our ability to identify and successfully acquire and integrate businesses at accretive valuations and realize anticipated synergies. Our inability to do so could adversely impact our growth rate and our stock price. Our ability to implement our inorganic growth strategy will be limited by our ability to identify appropriate acquisition candidates, which are difficult to identify for a number of reasons, including high valuations and competition among prospective buyers. Covenants in our credit agreement and our financial resources, including available cash and borrowing capacity, will also limit our ability to consummate acquisitions, which may require additional debt financing, resulting in higher leverage and an increase in interest expense. Changes in accounting or regulatory requirements could also adversely impact our ability to consummate acquisitions.
Our acquisition and integration of businesses could negatively impact our financial statements.
Acquiring businesses involves a number of financial, accounting, managerial, operational, legal, compliance and other risks and challenges, including the following, any of which could adversely affect our financial statements:
| • | any acquired business, technology, service or product could under-perform relative to our expectations and the price that we paid for it, or not achieve cost savings or other synergies in accordance with our anticipated timetable; |
| • | we may incur or assume significant debt in connection with our acquisitions, which would increase our leverage and interest expense, thereby reducing funds available to us for purposes such as working capital, capital expenditures, research and development and other general corporate purposes; |
14
Table of Contents
| • | pre-closing and post-closing earnings charges could adversely impact operating results in any given period, and the impact may be substantially different from period to period; |
| • | the process of integrating acquired operations may create operating difficulties and may require significant financial and managerial resources that would otherwise be available for existing operations; |
| • | we could experience difficulty in integrating financial and other controls and systems; |
| • | we may lose key employees or customers of the acquired company; |
| • | we may assume unknown liabilities, or known or contingent liabilities may be greater than anticipated, and |
| • | conforming the acquired company’s standards, process, procedures and controls, including accounting systems and controls, with our operations could cause internal control deficiencies related to our internal control over financial reporting or exposure to regulatory sanctions resulting from the acquired company’s activities; and |
The indemnification provisions of acquisition agreements by which we have acquired companies may not fully protect us and as a result we may face unexpected liabilities.
Certain of the acquisition agreements by which we have acquired companies require the former owners to indemnify us against certain liabilities related to the operation of the company before we acquired it. In most of these agreements, however, the liability of the former owners is limited and certain former owners may be unable to meet their indemnification responsibilities. We cannot assure you that these indemnification provisions will protect us fully or at all, and, as a result, we may face unexpected liabilities that adversely affect our financial statements.
Our relationships with our employees could deteriorate, which could adversely affect our operations.
As a manufacturing company, we rely on our employees and good relations with our employees to produce our products and maintain our production processes and productivity. As of March 31, 2016, we had approximately 725 full-time employees, of which 14 were subject to collective bargaining agreements. If our workers were to engage in a strike, work stoppage or other slowdown, our operations could be disrupted, or we could experience higher labor costs. In addition, if significant portions of our employees were to become unionized, we could experience significant operating disruptions and higher ongoing labor costs, which could adversely affect our business, financial condition and results of operations.
Loss of key personnel or our inability to attract and retain new qualified personnel could hurt our business and inhibit our ability to operate and grow successfully.
Our success in the highly competitive end markets in which we operate will continue to depend to a significant extent on our key employees, and we are dependent on the expertise of our executive officers and other key employees. Loss of the services of any of these individuals could have an adverse effect on our business. Further, we may not be able to retain or recruit qualified individuals to join our company. The loss of executive officers or other key employees could result in high transition costs and could disrupt our operations.
Chemical processing is inherently hazardous, which could result in accidents that disrupt our operations or expose us to significant losses or liabilities.
Hazards associated with chemical processing and the related storage and transportation of raw materials, products and wastes exist in our operations and the operations of other occupants with whom we share manufacturing sites. These hazards could lead to an interruption or suspension of operations and have an adverse
15
Table of Contents
effect on the productivity and profitability of a particular manufacturing facility or on us as a whole. These potential risks include, but are not necessarily limited to chemical spills and other discharges or releases of toxic or hazardous substances or gases, pipeline and storage tank leaks and ruptures, explosions and fires and mechanical failure. These hazards may result in personal injury and loss of life, damage to property and contamination of the environment, which may result in a suspension of operations and the imposition of civil or criminal penalties, including governmental fines, expenses for remediation and claims brought by governmental entities or third parties. The loss or shutdown of operations over an extended period at any of our major operating facilities could have a material adverse effect on our financial condition and results of operations. Our property, business interruption and casualty insurance may not fully insure us against all potential hazards incidental to our business.
Regulation of our employees’ exposure to certain chemicals or other hazardous products could require material expenditures or changes in our operations.
Certain chemicals that we use in the manufacture of our products may have adverse health effects. The Occupational Safety and Health Administration limits the permissible employee exposure to some of those chemicals. Future studies on the health effects of certain chemicals may result in additional regulations or new regulations in foreign countries that further restrict or prohibit the use of, and exposure to, certain chemicals. Additional regulation of certain chemicals could require us to change our operations, and these changes could affect the quality of our products and materially increase our costs.
Regulatory and statutory changes applicable to us or our customers could adversely affect our financial condition and results of operations.
We and many of our customers are subject to various national and local laws, rules and regulations. Changes in any of these areas could result in additional compliance costs, seizures, confiscations, recall or monetary fines, any of which could prevent or inhibit the development, distribution and sale of our products.
In addition, we benefit from certain regulations, including building code regulations that require the use of products that we and other manufacturers sell. For example, certain environmental regulations may encourage the use of more environmentally friendly products, such as some of the lubricants and greases that we manufacture. If these regulations were to change, our results of operations could be adversely affected.
Compliance with extensive environmental, health and safety laws could require material expenditures, changes in our operations or site remediation.
Our operations and properties are subject to regulation under environmental laws, which can impose substantial sanctions for violations. We must conform our operations to applicable regulatory requirements and adapt to changes in such requirements in all jurisdictions in which we operate. Certain materials we use in the manufacture of our products can represent potentially significant health and safety concerns. We use large quantities of hazardous substances and generate hazardous wastes in our manufacturing operations. Consequently, our operations are subject to extensive environmental, health and safety laws and regulations at the international, national, state and local level in multiple jurisdictions. These laws and regulations govern, among other things, air emissions, wastewater discharges, solid and hazardous waste management, site remediation programs and chemical use and management. Many of these laws and regulations have become more stringent over time, and the costs of compliance with these requirements may increase, including costs associated with any necessary capital investments. In addition, our production facilities require operating permits that are subject to renewal and, in some circumstances, revocation. The necessary permits may not be issued or continue in effect, and renewals of any issued permits may contain significant new requirements or restrictions. The nature of the chemical industry exposes us to risks of liability due to the use, production, management, storage, transportation and sale of materials that may be hazardous and can cause contamination or personal injury or damage if released into the environment.
16
Table of Contents
Compliance with environmental laws and regulations generally increases the costs of transportation and storage of raw materials and finished products, as well as the costs of storage and disposal of wastes. We may incur substantial costs, including fines, damages, criminal or civil sanctions and remediation costs, or experience interruptions in our operations for violations arising under environmental laws, regulations or permit requirements.
Our permits, licenses, registrations or authorizations and those of our customers or distributors may be modified, suspended, terminated or revoked before their expiration or we and/or they may be unable to renew them upon their expiration. We may bear liability for failure to obtain, maintain or comply with required authorizations.
We are required to obtain and maintain, and may be required to obtain and maintain in the future, various permits, licenses, registrations and authorizations for the ownership or operation of our business, including the manufacturing, distribution, sale and marketing of our products and importing of raw materials. These permits, licenses, registrations and authorizations could be modified, suspended, terminated or revoked or we may be unable to renew them upon their expiration for various reasons, including for non-compliance. These permits, licenses, registrations and authorizations can be difficult, costly and time consuming to obtain and could contain conditions that limit our operations. Our failure to obtain, maintain and comply with necessary permits, licenses, registrations or authorizations for the conduct of our business could result in fines or penalties, which may be significant. Additionally, any such failure could restrict or otherwise prohibit certain aspects of our operations, which could have a material adverse effect on our business, financial condition and results of operations.
Many of our customers and distributors require similar permits, licenses, registrations and authorizations to operate. If a significant customer, distributor or group thereof were to have an important permit, license, registration or authorization revoked or such permit, license, registration or authorization was not renewed, forcing them to cease or reduce their business, our sales could decrease, which would have a material adverse effect on our business, financial condition and results of operations.
Failure to design, implement and maintain effective internal controls could have a material adverse effect on our business and stock price.
As a public company, we have significant requirements for enhanced financial reporting and internal controls. The process of designing and implementing effective internal controls is a continuous effort that requires us to anticipate and react to changes in our business and the economic and regulatory environments and to expend significant resources to maintain a system of internal controls that is adequate to satisfy our reporting obligations as a public company. If we are unable to maintain appropriate internal financial reporting controls and procedures, it could cause us to fail to meet our reporting obligations on a timely basis, result in material misstatements in our financial statements and harm our operating results. In addition, we will be required to furnish a report by management on, among other things, the effectiveness of our internal control over financial reporting.
This assessment includes disclosure of any material weaknesses identified by our management in our internal control over financial reporting, as well as a statement that our auditors have issued an attestation report on effectiveness of our internal controls. Testing and maintaining internal controls may divert our management’s attention from other matters that are important to our business. We may not be able to conclude on an ongoing basis that we have effective internal control over financial reporting or our independent registered public accounting firm may not issue a favorable assessment. If we are unable to conclude that we have effective internal control over financial reporting or our independent registered public accounting firm is unable to provide us with an unqualified report, investors could lose confidence in our reported financial information, which could have a material adverse effect on the trading price of our stock.
17
Table of Contents
Our insurance policies may not cover, or fully cover, us against natural disasters, global conflicts or environmental risk.
We currently have insurance policies for certain operating risks, which include certain property damage, including certain aspects of business interruption for certain sites, operational and product liability, transit, directors’ and officers’ liability, industrial accident insurance and other risks customary in the industries in which we operate. However, we may become subject to liability (including in relation to pollution, occupational illnesses, injury resulting from tampering, product contamination or degeneration or other hazards) against which we have not insured or cannot fully insure.
For example, hurricanes may affect our facilities or the failure of our information systems as a result of breakdown, malicious attacks, unauthorized access, viruses or other factors could severely impair several aspects of operations, including, but not limited to, logistics, sales, customer service and administration. In addition, in the event that a product liability or third-party liability claim is brought against us, we may be required to recall our products in certain jurisdictions if they fail to meet relevant quality or safety standards, and we cannot guarantee that we will be successful in making an insurance claim under our policies or that the claimed proceeds will be sufficient to compensate the actual damages suffered.
Should we suffer a major uninsured loss, a product liability judgment against us or a product recall, future earnings could be materially adversely affected. We could be required to increase our debt or divert resources from other investments in our business to discharge product related claims. In addition, adverse publicity in relation to our products could have a significant effect on future sales, and insurance may not continue to be available at economically acceptable premiums. As a result, our insurance coverage may not cover the full scope and extent of claims against us or losses that we incur, including, but not limited to, claims for environmental or industrial accidents, occupational illnesses, pollution and product liability and business interruption.
Our business relies heavily on trademarks, trade secrets, other intellectual property and proprietary information, and our failure to protect our rights could harm our competitive advantages with respect to the manufacturing of some of our products.
Our ability to protect and preserve our trademarks, trade secrets and other intellectual property and proprietary information relating to our business is an important factor to our success. However, we may be unable to prevent third parties from using our intellectual property and other proprietary information without our authorization or from independently developing intellectual property and other proprietary information that is similar to ours, particularly in those countries where the laws do not protect our proprietary rights to the same degree as in the U.S. In addition, because certain of our products are manufactured by third parties, we have shared some of our intellectual property with those third parties. There can be no guarantee that those third parties, some of whom are located in jurisdictions where intellectual property risks may be more pronounced, will preserve our intellectual property.
The use of our intellectual property and other proprietary information by others could reduce or eliminate any competitive advantage we have developed, potentially causing us to lose sales or otherwise harm our business. If it becomes necessary for us to litigate to protect these rights, any proceedings could be burdensome and costly, and we may not prevail.
Our intellectual property may not provide us with any competitive advantage and may be challenged by third parties. Moreover, our competitors may already hold or in the future may hold intellectual property rights in the U.S. or abroad that, if enforced or issued, could possibly prevail over our rights or otherwise limit our ability to manufacture or sell one or more of our products in the U.S. or internationally.
Adequate remedies may not be available in the event of an unauthorized use or disclosure of our trade secrets and manufacturing expertise. The loss of employees who have specialized knowledge and expertise could
18
Table of Contents
harm our competitive position and cause our sales and operating results to decline as a result of increased competition. In addition, others may obtain knowledge of our trade secrets through independent development or other access by legal means.
The failure to protect our intellectual property and other proprietary information, including our processes, apparatuses, technology, trade secrets, trade names and proprietary manufacturing expertise, methods and compounds, could have a material adverse effect on our businesses and results of operations.
Security breaches and other disruptions to our information technology systems could compromise our information, disrupt our operations, and expose us to liability, which may adversely impact our operations.
In the ordinary course of our business, we store sensitive data, including our proprietary business information and that of our customers, suppliers and business partners, and personally identifiable information of our employees in our information technology systems, including in our data centers and on our networks. The secure processing, maintenance and transmission of this data is critical to our operations. Despite our security measures, our information technology systems may be vulnerable to attacks by hackers or breached or disrupted due to employee error, malfeasance or other disruptions. Any such attack, breach or disruption could compromise our information technology systems and the information stored in them could be accessed, publicly disclosed, lost or stolen and our business operations could be disrupted. Additionally, any significant disruption or slowdown of our systems could cause customers to cancel orders or cause standard business processes to become inefficient or ineffective, which could adversely affect our financial position, results of operations or cash flows. Any such access, disclosure or other loss of information or business disruption could result in legal claims or proceedings, liability under laws that protect the privacy of personal information, and damage to our reputation, which could adversely impact our operations.
We are subject to the U.S. Foreign Corrupt Practices Act and other anti-corruption laws, as well as other laws governing our operations. If we fail to comply with these laws, we could be subject to civil or criminal penalties, other remedial measures, and legal expenses, which could adversely affect our business, financial condition and results of operations.
Our operations are subject to anti-corruption laws, including the U.S. Foreign Corrupt Practices Act (“FCPA”), and other anti-corruption laws that apply in countries where we do business. The FCPA and these other laws generally prohibit us and our employees and intermediaries from bribing, being bribed or making other prohibited payments to government officials or other persons to obtain or retain business or gain some other business advantage. We conduct business in a number of jurisdictions that pose a high risk of potential FCPA violations, and we participate in relationships with third parties whose actions could potentially subject us to liability under the FCPA or other anti-corruption laws. In addition, we cannot predict the nature, scope or effect of future regulatory requirements to which our international operations might be subject or the manner in which existing laws might be administered or interpreted.
We are also subject to other laws and regulations governing our international operations, including regulations administered by the U.S. Department of Commerce’s Bureau of Industry and Security, the U.S. Department of Treasury’s Office of Foreign Asset Control and various non-U.S. government entities, including applicable export control regulations, economic sanctions on countries and persons, customs requirements, currency exchange regulations and transfer pricing regulations (collectively, the “Trade Control Laws”).
However, despite our compliance programs, there is no assurance that we will be completely effective in ensuring our compliance with all applicable anti-corruption laws, including the FCPA or other legal requirements, or Trade Control Laws. If we are not in compliance with the FCPA and other anti-corruption laws or Trade Control Laws, we may be subject to criminal and civil penalties, disgorgement and other sanctions and remedial measures, and legal expenses, which could have an adverse impact on our business, financial condition, results of operations and liquidity.
19
Table of Contents
Likewise, any investigation of any potential violations of the FCPA, other anti-corruption laws or Trade Control Laws by the U.S. or foreign authorities could also have an adverse impact on our reputation, business, financial condition and results of operations.
Our outstanding indebtedness and the restrictive covenants in the agreements governing our indebtedness limit our operating and financial flexibility.
We are required to make scheduled repayments and, under certain events of default, mandatory repayments on our outstanding indebtedness, which may require us to dedicate a substantial portion of our cash flows from operations to payments on our indebtedness, thereby reducing the availability of our cash flows to fund working capital, capital expenditures, R&D efforts and other general corporate purposes, and could generally limit our flexibility in planning for, or reacting to, changes in our business and industry.
In addition, the agreements governing our indebtedness impose certain operating and financial restrictions on us and somewhat limit management’s discretion in operating our businesses. These agreements limit or restrict our ability, among other things, to: incur additional debt; pay dividends and make other distributions; make investments and other restricted payments; create liens; sell assets; and enter into transactions with affiliates.
We are also required to comply with leverage and interest coverage financial covenants and deliver to our lenders audited annual and unaudited quarterly financial statements. Our ability to comply with these covenants may be affected by events beyond our control. Failure to comply with these covenants could result in an event of default which, if not cured or waived, may have a material adverse effect on our business, financial condition, results of operations and cash flows.
We may acquire various structured financial instruments for purposes of hedging or reducing our risks, which may be costly and ineffective.
We may seek to hedge against commodity price fluctuations and credit risk by using structured financial instruments such as futures, options, swaps and forward contracts. Use of structured financial instruments for hedging purposes may present significant risks, including the risk of loss of the amounts invested. Defaults by the other party to a hedging transaction can result in losses in the hedging transaction. Hedging activities also involve the risk of an imperfect correlation between the hedging instrument and the asset being hedged, which could result in losses both on the hedging transaction and on the instrument being hedged. Use of hedging activities may not prevent significant losses and could increase our losses.
Fluctuations in currency exchange rates may significantly impact our results of operations and may significantly affect the comparability of our results between financial periods.
Our operations are conducted in many countries. The results of the operations and the financial position of these subsidiaries are reported in the relevant foreign currencies and then translated into U.S. dollars at the applicable exchange rates for inclusion in our consolidated financial statements. The main currencies to which we are exposed, besides the U.S. dollar, are primarily the Canadian dollar, the British pound and the Australian dollar. The exchange rates between these currencies and the U.S. dollar in recent years have fluctuated significantly and may continue to do so in the future. A depreciation of these currencies against the U.S. dollar will decrease the U.S. dollar equivalent of the amounts derived from these operations reported in our consolidated financial statements and an appreciation of these currencies will result in a corresponding increase in such amounts. Because many of our raw material costs are determined with respect to the U.S. dollar rather than these currencies, depreciation of these currencies may have an adverse effect on our profit margins or our reported results of operations. Conversely, to the extent that we are required to pay for goods or services in foreign currencies, the appreciation of such currencies against the U.S. dollar will tend to negatively impact our results of operations. In addition, currency fluctuations may affect the comparability of our results of operations between financial periods.
20
Table of Contents
We incur currency transaction risk whenever we enter into either a purchase or sale transaction using a currency other than the local currency of the transacting entity. Given the volatility of exchange rates, there can be no assurance that we will be able to effectively manage our currency transaction risks, that our hedging activities will be effective or that any volatility in currency exchange rates will not have a material adverse effect on our financial condition or results of operations.
Risks Relating to our Recent Separation from Capital Southwest
The historical combined financial information included in this Annual Report is not necessarily representative of the results we would have achieved as a standalone, publicly traded company and may not be a reliable indicator of our future results.
The Company began operating as a standalone, publicly traded Company on October 1, 2015. The historical combined financial information included in this Annual Report, as well as our Information Statement on Form 10 filed with the SEC, for periods prior to October 1, 2015 reflects historical financial information of our Operating Subsidiaries and does not necessarily reflect the financial condition, results of operations or cash flows we would have achieved as a standalone, publicly traded company during the periods presented or that we may achieve in the future. For example, historical combined financial information reflects allocations of expenses for services historically provided by Capital Southwest, and those allocations may be different than the comparable expenses we would have incurred as a standalone company. Additionally, the historical combined financial information does not reflect the changes that have and will occur in our cost structure, management, financing arrangements and business operations related to being an independent, publicly traded company, as well as other changes as we transition to an integrated industrial manufacturing company.
We may not be able to successfully integrate our operations in a timely manner or at all.
Prior to the Share Distribution, we operated as independent companies. Our management is in process of integrating the separate businesses, technologies, organizations, procedures, policies and operations of our subsidiaries into an integrated industrial manufacturing company, which is necessary to fully realize the expected results of the Share Distribution. The integration process may prove to be more complex and time-consuming and require substantially more resources and effort than currently anticipated, which could have a material adverse effect on us and our operations, relationships with market participants, employees, regulators and others.
The requirements of being a public company, including compliance with the reporting requirements of the Exchange Act and the requirements of the Sarbanes-Oxley Act of 2002 (the “Sarbanes-Oxley Act”), may strain our resources, increase our costs and distract management, and we may be unable to comply with these requirements in a timely or cost-effective manner.
As a public company with listed equity securities, we are required to comply with laws, regulations and requirements, certain corporate governance provisions of the Sarbanes-Oxley Act, related regulations of the SEC, including compliance with the reporting requirements of the Exchange Act and the requirements of the NASDAQ Marketplace Rules not applicable to private companies. Complying with these statutes, regulations and requirements is expected to occupy a significant amount of time of our Board and management and is expected to significantly increase our administrative costs and expenses, which could adversely affect our profitability.
We may be unable to achieve some or all of the benefits that we expect to achieve as an independent, publicly traded company.
As a standalone, publicly traded company, we believe that our business will benefit from, among other things, more focused management and an enhanced ability to pursue our business strategy, which we expect as a result of the Share Distribution. However, we may be more susceptible to market fluctuations and other adverse events than we would have been were we still a part of Capital Southwest. In addition, we may not be able to achieve some or all of the benefits that we expect to achieve as a standalone company in the time we expect, if at all.
21
Table of Contents
Potential indemnification obligations pursuant to agreements related to the Share Distribution could materially adversely affect us.
Agreements between Capital Southwest and us provide for, among other things, the principal corporate transactions required to effect the separation, the conditions to the Share Distribution and provisions governing the relationship between Capital Southwest and us with respect to and resulting from the Share Distribution.
Among other things, we have indemnification obligations designed to make us financially responsible for liabilities that may exist relating to or arising out of our business activities, whether incurred prior to or after the Share Distribution. In addition, after the Share Distribution, there are several significant areas where the liabilities of Capital Southwest became our obligations, including Capital Southwest defined benefit obligations. If we are required to indemnify Capital Southwest under the circumstances set forth in such agreements, we may be subject to substantial liabilities that could adversely affect our financial condition.
If the Share Distribution were to fail to qualify as a tax-free transaction for U.S. federal income tax purposes, then we and our stockholders could incur significant U.S. federal income tax liabilities.
In connection with the Share Distribution, Capital Southwest received an opinion from a nationally recognized accounting firm substantially to the effect that the Share Distribution should qualify as tax free under Sections 355 and 368(a)(1)(D) of the Internal Revenue Code (“the Code”), except with respect to any cash received in lieu of fractional shares of CSWI common stock. An opinion of an accounting firm is not binding on the Internal Revenue Service (“IRS”). Accordingly, the IRS may reach conclusions with respect to the Share Distribution that are different from the conclusions reached in the opinion. The opinion relied on certain facts, assumptions, representations and undertakings from Capital Southwest and us regarding the past and future conduct of the companies’ respective businesses and other matters, which, if incomplete, incorrect or not satisfied, could alter that accounting firm’s conclusions.
If the Share Distribution ultimately is determined to be taxable, it could expose Capital Southwest and its shareholders to significant U.S. federal income tax liabilities. We have agreed not to enter into any transaction that could cause any portion of the Share Distribution to be taxable to Capital Southwest, including under Section 355 of the Code. Pursuant to the Tax Matters Agreement, we have also agreed to indemnify Capital Southwest for any tax liabilities resulting from such transactions, and Capital Southwest has agreed to indemnify us for any tax liabilities resulting from such transactions entered into by them. These obligations may discourage, delay or prevent a change of control of our Company
Our ability to engage in certain corporate transactions is limited.
Our ability to engage in significant equity transactions is restricted in order to preserve the tax-free status of the Share Distribution to Capital Southwest for U.S. federal income purposes. Even if the Share Distribution otherwise qualifies for tax-free treatment to Capital Southwest’s shareholders under the Code, it may be taxable to Capital Southwest if 50% or more, by vote or value, of the shares of our common stock or Capital Southwest’s common stock are acquired or issued as part of a plan or series of related transactions that includes the Share Distribution. For this purpose, any acquisitions or issuances of Capital Southwest’s common stock within two years before the Share Distribution, and any acquisitions or issuances of our common stock or Capital Southwest’s common stock within two years after the Share Distribution, generally are presumed to be part of such a plan, although we or Capital Southwest may be able to rebut that presumption. If an acquisition or issuance of shares of our common stock or Capital Southwest’s common stock triggers the application of the Code, Capital Southwest would recognize a taxable gain as a result of the Share Distribution to the extent the fair market value of our common stock exceeds Capital Southwest’s tax basis in our common stock at the time of the Share Distribution.
Under a Tax Matters Agreement that was entered into by Capital Southwest and us, there are restrictions on our ability to take actions that could cause the Share Distribution to fail to qualify for favorable treatment under
22
Table of Contents
the Code, and we will be required to indemnify Capital Southwest against any tax liabilities arising as a result of the Share Distribution that are attributable to any actions taken by us or with respect to us or any of our affiliates. As a result, we may be limited or restricted from entering into strategic, capital raising or other transactions which might be advantageous to us or our stockholders.
In connection with our separation from Capital Southwest, Capital Southwest will indemnify us for certain liabilities. However, there can be no assurance that these indemnities will be sufficient to insure us against the full amount of such liabilities or that Capital Southwest’s ability to satisfy its indemnification obligation will not be impaired in the future.
Following the Share Distribution, Capital Southwest has agreed to indemnify us for certain liabilities, including certain tax liabilities. However, third parties could seek to hold us responsible for any of the liabilities that Capital Southwest will agree to retain, and there can be no assurance that Capital Southwest will be able to fully satisfy its indemnification obligations. Moreover, even if we ultimately succeed in recovering from Capital Southwest any amounts for which we are held liable, we may be temporarily required to bear these losses while seeking recovery from Capital Southwest.
Potential liabilities may arise due to fraudulent transfer considerations, which would adversely affect our financial condition and our results of operations.
In connection with the Share Distribution, Capital Southwest undertook several corporate restructuring transactions which, along with the Spin-off, may be subject to federal and state fraudulent conveyance and transfer laws. If, under these laws, a court were to determine that, at the time of the Share Distribution, any entity involved in these restructuring transactions or the Share Distribution: (1) was insolvent; (2) was rendered insolvent by reason of the Share Distribution; (3) had remaining assets constituting unreasonably small capital; or (4) intended to incur, or believed it would incur, debts beyond its ability to pay these debts as they matured, then the court could void the Share Distribution, in whole or in part, as a fraudulent conveyance or transfer. The court could then require our stockholders to return to Capital Southwest some or all of the shares of our common stock issued in the Share Distribution, or require Capital Southwest or us, as the case may be, to fund liabilities of the other company for the benefit of creditors.
Forward-Looking Statements
This Annual Report contains forward-looking statements within the meaning of the Private Securities Litigation Reform Act of 1995. These statements reflect the current views of our senior management with respect to future events and our financial performance. These statements include forward-looking statements with respect to our business and industry in general. Statements that include the words “may,” “expects,” “plans,” “anticipates,” “estimates,” “believes,” “potential,” “projects,” “forecasts,” “intends,” or the negative thereof or other comparable terminology and similar statements of a future or forward-looking nature identify forward-looking statements for purposes of the federal securities laws or otherwise.
Forward-looking statements include, but are not limited to, statements that relate to, or statements that are subject to risks, contingencies or uncertainties that relate to:
| • | our business strategy; |
| • | future levels of revenues, operating margins, income from operations, net income or earnings per share; |
| • | anticipated levels of demand for our products and services; |
| • | future levels of research and development, capital, environmental or maintenance expenditures; |
| • | our beliefs regarding the timing and effects on our business of health and safety, tax, environmental or other legislation, rules and regulations; |
23
Table of Contents
| • | the success or timing of completion of ongoing or anticipated capital, restructuring or maintenance projects; |
| • | expectations regarding the acquisition or divestiture of assets and businesses; |
| • | our ability to obtain appropriate insurance and indemnities; |
| • | the potential effects of judicial or other proceedings, including tax audits, on our business, financial condition, results of operations and cash flows; |
| • | the anticipated effects of actions of third parties such as competitors, or federal, foreign, state or local regulatory authorities, or plaintiffs in litigation; |
| • | the expected impact of accounting pronouncements; |
| • | the expected benefits of being a standalone publicly-traded company; and |
| • | the other factors listed above under “Risk Factors.” |
Although we believe that the expectations reflected in the forward-looking statements are reasonable based on our current knowledge of our business and operations, we cannot guarantee future results, levels of activity, performance or achievements. The foregoing factors should not be construed as exhaustive. If one or more of these or other risks or uncertainties materialize, or if our underlying assumptions prove to be incorrect, actual results may differ materially from what we anticipate. Any forward-looking statements you read in this Annual Report reflect our views as of the date of this Annual Report with respect to future events and are subject to these and other risks, uncertainties and assumptions relating to our operations, results of operations, growth strategy and liquidity. You should not place undue reliance on these forward-looking statements and you should carefully consider all of the factors identified in this Annual Report that could cause actual results to differ. We assume no obligation to update these forward looking statements, except as required by law.
ITEM 1B: UNRESOLVED STAFF COMMENTS
Not applicable.
24
Table of Contents
Properties
Our principal executive offices are located at 5420 Lyndon B. Johnson Freeway, Suite 500, Dallas, Texas 75240. Our headquarters is a leased facility, which we began to occupy on March 7, 2016. The lease term expires August 31, 2026.
We consider the many offices, manufacturing and research and development facilities, warehouses, and other properties that we own or lease to be in good condition and generally suitable for the purposes for which they are used. The following table presents our principal manufacturing locations by segment.
| Location |
Use |
Segment |
Square Footage | Owned/Leased | ||||||
| Boise, Idaho |
Manufacturing, Office and R&D | Industrial Products | 40,800 | Leased | ||||||
| Fall River, Massachusetts |
Manufacturing | All | 140,200 | Leased | ||||||
| Houston, Texas |
Manufacturing, office, R&D | Coatings, Sealants & Adhesives | 36,000 | Leased | ||||||
| Houston, Texas |
Manufacturing and Office | All | 253,900 | Owned | ||||||
| Houston, Texas |
Manufacturing | Coatings, Sealants & Adhesives and Specialty Chemicals | 146,000 | Leased | ||||||
| Longview, Texas |
Manufacturing | Coatings, Sealants & Adhesives | 53,200 | Owned | ||||||
| Oklahoma City, Oklahoma |
Manufacturing | Industrial Products | 30,600 | Owned | ||||||
| Rockwall, Texas |
Manufacturing, Office, R&D and Warehouse | All | 227,600 | Owned | ||||||
| Syracuse, New York |
Manufacturing | Coatings, Sealants & Adhesives | 20,900 | Owned | ||||||
| Wichita, Kansas |
Manufacturing | Industrial Products | 42,800 | Owned | ||||||
We believe that our facilities are adequate for our current operations. We may endeavor to selectively reduce or expand our existing lease commitments as circumstances warrant. See Note 7 to our consolidated financial statements included in Item 8 of this Annual Report for additional information regarding our operating lease obligations.
We may, from time to time, be involved in litigation arising out of our operations in the normal course of business or otherwise. Furthermore, third parties may try to seek to impose liability on us in connection with the activities of our portfolio companies. We are not currently a party to any legal proceedings that, individually or in the aggregate, are expected to have a material effect on our business, financial condition, results of operations or financial statements, taken as a whole.
ITEM 4: MINE SAFETY DISCLOSURES
Not applicable.
25
Table of Contents
PART II
ITEM 5: MARKET FOR REGISTRANT’S COMMON EQUITY, RELATED STOCKHOLDER MATTERS AND ISSUER PURCHASES OF EQUITY SECURITIES
Market Information
Our common shares began “when issued” trading on the Nasdaq Global Select Market on September 16, 2015. “Regular way” trading on the Nasdaq Global Select Market began on October 1, 2015. The following table sets forth, for the periods indicated, the high and low sales prices of our common stock, as reported by Nasdaq:
| High | Low | |||||||
| Second Quarter of FY 2016 (September 16, 2015 – September 30, 2015) |
$ | 38.00 | $ | 23.20 | ||||
| Third Quarter of FY 2016 (October 1, 2015 – December 31, 2015) |
$ | 39.96 | $ | 30.25 | ||||
| Fourth Quarter of FY 2016 (January 1, 2016 – March 31, 2016) |
$ | 37.75 | $ | 27.84 | ||||
On June 2, 2016, the closing price of our common stock on the Nasdaq Global Select Market was $33.84 per share.
Holders
As of June 2, 2016, there were approximately 548 holders of record of our common stock. The number of holders of record is based upon the actual numbers of holders registered at such date and does not include holders of shares in “street name” or persons, partnerships, associates, corporations or other entities in security position listings maintained by depositories.
Dividend Policy
Any payment of dividends will be at the discretion of our Board of Directors and will depend upon various factors then existing, including earnings, financial condition, results of operations, capital requirements, level of indebtedness, any contractual restrictions with respect to payment of dividends, restrictions imposed by applicable law, general business conditions and other factors that our Board of Directors may deem relevant. We do not currently expect to pay dividends on our common stock for the foreseeable future.
Issuer Purchases of Equity Securities
None.
Stock Performance Chart
The following graph compares the cumulative total shareholder return on our common stock from October 1, 2015 through March 31, 2016 compared with the Standard & Poor’s (“S&P”) Small Cap 600 index and a composite custom peer group, selected on an industry basis. The graph assumes that $100 was invested at the market close on October 1, 2015 and that all dividends were reinvested. The stock price performance of the following graph is not necessarily indicative of future stock price performance. The custom peer group consists of the following:
| Astec Industries |
Futurefuel Corp. | Landec Corp | Omnova Solutions | |||
| Chase Corp. |
Gorman-Rupp Company | Littelfuse, Inc. | Orbotech Ltd. | |||
| Columbus McKinnon Corp |
Innospec Inc. | LSB Industries | Quaker Chemical | |||
| CTS Corp. |
Koppers Holdings | Methode Electronics, Inc. | Tredegar Corp. | |||
| Flotek Industries, Inc. |
Kraton Performance Polymers | NN, Inc. | WD-40 Company |
26
Table of Contents
This graph is furnished and not filed with the SEC. Notwithstanding anything to the contrary set forth in any of our pervious filings made under the Securities Act of 1933 or the Exchange Act that incorporate future filings made by us under those statutes, the above stock performance graph is not to be incorporated by reference in any prior filings, nor shall it be incorporated by reference into any future filings made by us under those statutes.
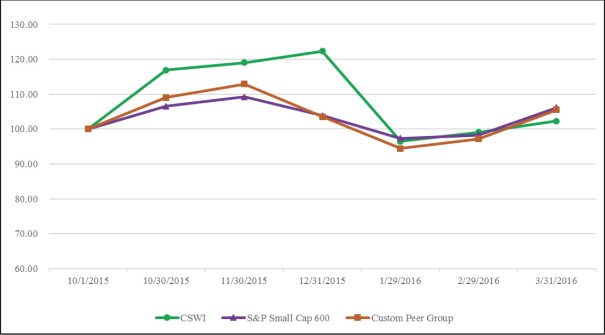
ITEM 6: SELECTED FINANCIAL DATA
| (Amounts in thousands, except per share data) |
Fiscal Years ended March 31, | |||||||||||||||||||
| 2016 (a) | 2015 (a) | 2014 (a) | 2013 (a) | 2012 (a) | ||||||||||||||||
| RESULTS OF OPERATIONS |
||||||||||||||||||||
| Revenues, net |
$ | 319,831 | $ | 261,834 | $ | 231,713 | $ | 199,094 | $ | 171,035 | ||||||||||
| Gross profit |
147,864 | 126,425 | 112,086 | 94,582 | 78,389 | |||||||||||||||
| Operating expenses |
(100,378 | ) | (82,391 | ) | (74,173 | ) | (62,335 | ) | (53,743 | ) | ||||||||||
| Operating income |
47,486 | 44,034 | 37,913 | 32,247 | 24,646 | |||||||||||||||
| Interest (expense) income, net |
(3,035 | ) | (611 | ) | (131 | ) | 74 | 523 | ||||||||||||
| Provision for income taxes |
(18,754 | ) | (15,223 | ) | (12,794 | ) | (10,707 | ) | (7,755 | ) | ||||||||||
| Net income from continuing operations |
25,471 | 29,705 | 24,732 | 22,513 | 16,829 | |||||||||||||||
| Net income per diluted share |
1.62 | 1.90 | 1.58 | 1.44 | 1.08 | |||||||||||||||
| FINANCIAL CONDITION |
||||||||||||||||||||
| Working capital |
123,958 | 93,774 | 90,884 | 77,196 | 85,688 | |||||||||||||||
| Total assets |
392,260 | 286,521 | 277,820 | 236,521 | 195,957 | |||||||||||||||
| Total debt |
89,682 | 26,704 | 45,097 | 23,348 | 6,100 | |||||||||||||||
| Retirement obligations and other liabilities |
13,566 | 30,255 | 12,233 | 12,070 | 12,531 | |||||||||||||||
| Total equity |
258,010 | 204,601 | 196,186 | 176,522 | 160,029 | |||||||||||||||
27
Table of Contents
| (a) | We began operations on September 30, 2015 as a result of the Share Distribution discussed in Note 1 to our consolidated financial statements included in Item 8 of this Annual Report. The financial position, results of operations and cash flows for periods prior to September 30, 2015 represent the combined financial information of the Operating Subsidiaries contributed to us as a result of the Share Distribution. The financial statements for periods prior to the Share Distribution may not include all of the expenses that would have been incurred had the Operating Subsidiaries been operating as separate publicly-traded (“standalone”) companies during those periods and may not reflect the consolidated results of operations, financial position, and cash flows as a standalone company during all periods presented. |
28
Table of Contents
ITEM 7: MANAGEMENT’S DISCUSSION AND ANALYSIS OF FINANCIAL CONDITION AND RESULTS OF OPERATIONS
The following discussion and analysis is provided to increase the understanding of, and should be read in conjunction with, the accompanying consolidated financial statements and notes. See “Item 1A. Risk Factors” and the “Forward-Looking Statements” included in this Annual Report on Form 10-K for the year ended March 31, 2016 (“Annual Report”) for a discussion of the risks, uncertainties and assumptions associated with these statements. Unless otherwise noted, all amounts discussed herein are consolidated.
EXECUTIVE OVERVIEW
The Share Distribution
On December 2, 2014, Capital Southwest announced its plan to spin-off certain of its industrial products, coatings, sealants and adhesives and specialty chemicals businesses by means of a distribution of the outstanding shares of common stock of CSWI on a pro rata basis to holders of Capital Southwest common stock. The Share Distribution occurred on September 30, 2015, and CSWI became an independent, publicly traded company. Prior to the Share Distribution, Capital Southwest contributed to CSWI all of the outstanding capital stock of the entities described below:
| • | RectorSeal formulates and manufactures specialty chemical products including pipe thread sealants, firestop sealants, plastic solvent cements and other formulations. RectorSeal also makes specialty tools for tradesmen and innovative systems for containing flames and smoke from building fires. RectorSeal’s operating results are divided amongst each of our three business segments. |
| • | Whitmore manufactures high performance, specialty lubricants for heavy equipment used in surface mining, railroad and other industries. Whitmore also manufactures lubrication equipment, specifically for rail applications, and lubrication-centric reliability solutions for a wide variety of industries, and produces water-based coatings for the automotive and primary metals industries. Whitmore’s operating results are divided amongst each of our three business segments. |
| • | Jet-Lube is a world leader in anti-seize compounds, thread sealants and specialty lubrication products and greases for the energy industry. Jet-Lube’s operating results are divided amongst our Coatings, Sealants & Adhesives and Specialty Chemicals segments. |
| • | Strathmore is engaged in the manufacturing of paint for sale to industrial clients and is a leading manufacturer of specialized industrial coating products including urethanes, epoxies, acrylics and alkyds. Strathmore’s operating results are included in the Coatings, Sealants & Adhesives segment. |
| • | Balco is engaged in the fabrication of aluminum and plastic extrusions and other materials related to safety, slip resistance and emergency egress. Balco’s operating results are included in the Industrials Products segment. |
| • | Smoke Guard manufactures certified custom safety products for the commercial construction market and other markets requiring smoke and fire protection. Smoke Guard’s operating results are included in the Industrials Products segment. |
Additionally, prior to the Share Distribution, Capital Southwest contributed to CSWI $13.0 million in cash and pension assets of $10.4 million (CSWI assumed both the pension plan assets and obligations associated with the defined benefit pension plan).
Our Company
We are a diversified industrial growth company with well-established, scalable platforms and domain expertise across three segments: Industrial Products; Coatings, Sealants & Adhesives; and Specialty Chemicals. Our broad portfolio of leading products provides performance optimizing solutions to our customers. Our products include mechanical products for heating, ventilation and air conditioning (“HVAC”) and refrigeration applications, coatings and sealants and high performance specialty lubricants. Markets that we serve include HVAC, industrial, rail, plumbing, architecturally-specified building products, energy, mining, and other general
29
Table of Contents
industrial markets. Our operations are concentrated in the U.S., but we also have operations in Australia, Canada and the United Kingdom, and our products are sold directly or through designated channels both domestically and internationally.
Many of our products are used to protect the capital assets of our customers that are expensive to repair or replace and are critical to their operations. The maintenance, repair and overhaul and consumable nature of many of our products is a source of recurring revenue for us. We also provide some custom and semi-custom products, which enhance our customer relationships. Our diverse product portfolio includes more than 100 highly respected industrial brands including RectorSeal No. 5 ™ thread sealants, KOPR KOTE™ anti-seize lubricants, Safe-T-Switch® condensate overflow shutoff devices, KATS® coatings, and Air Sentry® breathers. Our products are well known in the specific industries we serve and have a reputation for high quality and reliability. We use contract manufacturers to manufacture certain products, but the majority of these products are either privately-labeled or manufactured exclusively for us. Third party-manufactured products accounted for approximately 53%, 21% and 4% of the net revenues of the Industrial Products, Coatings, Sealants & Adhesives and Specialty Chemicals segments, respectively, for the fiscal year ended March 31, 2016. The use of third party manufacturers resulted in an increase of approximately 11% in operating margins when compared to the operating margins of internally-manufactured products for the fiscal year ended March 31, 2016.
Prior to the Share Distribution, we operated as separate entities. The consolidated financial statements included in this Annual Report include all revenues, costs, assets, and liabilities directly attributable to the businesses discussed above. However, the consolidated financial statements for periods prior to the Share Distribution may not include all of the expenses that would have been incurred had the businesses been standalone companies during those periods and may not reflect the consolidated results of operations, financial position, and cash flows as standalone companies during all periods presented. Based on our initial projections and current activity level, we expect recurring corporate overhead to be at least $1.5 million per quarter. We expect to incur capital costs in the next few years to integrate our operations, including the consolidation of some of our manufacturing facilities. As a result of these efforts, we expect to operate more efficiently and effectively. We also expect to incur additional costs as a result of being a public company, such as additional employee-related costs, costs to start up certain standalone corporate functions, information systems costs and other organizational-related costs. We expect the synergies that may be achieved through our integration efforts to offset the additional costs in the longer term.
We believe that our broad portfolio of products and markets served and our brand recognition will continue to provide opportunities; however, we face ongoing challenges affecting many companies, such as environmental and other regulatory compliance and overall global economic uncertainty. During the year ended March 31, 2016, we experienced spending declines at many of our customers in the energy and mining end markets as they addressed market issues related to lower market prices for crude oil, gas and other natural resources. To a lesser extent, these spending declines also indirectly impacted other end markets that we serve including rail and industrial. We expect that certain challenges relating to the current energy environment will persist throughout 2016. During the fiscal year ended March 31, 2016, we saw strong sales growth in other key end markets such as HVAC, where our innovative mechanical products and chemicals have increased market penetration, and architecturally specified building products, which is currently benefitting from a robust commercial construction cycle.
Our Markets
The following discussion should be read in conjunction with the “Outlook for Fiscal Year 2017” section included below.
HVAC
The HVAC market is our largest market served and it represented approximately 22% and 24% of our net sales in the fiscal years ended March 31, 2016 and 2015, respectively. We provide an extensive array of products
30
Table of Contents
for repair and maintenance of HVAC systems that includes our largest product family, condensate switches, as well as condensate pans, air diffusers, condensate pumps, refrigerant caps, line set covers and other mechanical products. The industry is driven by new construction projects, as well as replacement and repair of existing HVAC systems. New HVAC systems are heavily influenced by macro trends in building construction. HVAC tends to be seasonal with the peak sales season beginning in March and continuing through August. Construction and repair is typically performed by contractors, and we utilize our global distribution network to drive sales of our brands to such contractors. For the fiscal year ending March 31, 2017, we anticipate growth in the HVAC market to be stronger than the gross domestic product, but lower than recent historical growth due to the slowdown in the installation of new HVAC units in the U.S.
Industrial
The industrial end market represented approximately 19% and 18% of our net sales in the fiscal years ended March 31, 2016 and 2015, respectively. The industrial end market includes customers who manufacture chemicals, steel equipment and a wide variety of materials. We include sales of industrial coatings, lubricants and breathers, as well as various other industrial products in the industrial end market. We serve this market primarily through a network of industrial distributors. We expect our sales into this market in the next fiscal year to grow slightly higher than the gross domestic product due to our innovative technologies and recent acquisitions.
Rail
The rail market represented approximately 16% and 5% of our net sales in the fiscal years ended March 31, 2016 and 2015, respectively. We provide an array of products into the rail industry, including lubricants and lubricating devices for rail lines, which increase efficiency and reduce noise for and extend the life of rail cars, and coating of tank cars and locomotives. We leverage our technical expertise to build relationships with key decision-makers to ensure that our products meet required specifications. The rail industry is driven by the transportation of natural resources, including coal and petrochemical products, and has experienced slowdowns as a result of declines in the mining and energy markets, which in turn, has resulted in a reduction in rail miles traveled and reduced production of new tank cars. For the fiscal year ending March 31, 2017, we anticipate ongoing challenges in the rail coatings industry as it continues to be impacted by the mining and energy markets and due to the increased use of natural gas, which is transported by pipeline, for domestic power generation.
Plumbing
The plumbing market represented approximately 15% and 16% of our net sales in the fiscal years ended March 31, 2016 and 2015, respectively. We provide many products to the plumbing industry including thread sealants, solvent cements, fire-stopping products, condensate switches and traps, as well as other mechanical products. Installation is typically performed by contractors, and we utilize our global distribution network to drive sales of our brands to contractors. We are not anticipating any significant changes in the overall plumbing industry in the fiscal year ending March 31, 2017.
Architecturally-Specified Building Products
Architecturally-specified building products represented approximately 14% and 15% of our net sales in the fiscal years ended March 31, 2016 and 2015, respectively. We manufacture and sell products such as expansion joints, stair nosings and smoke and fire protection systems for large commercial buildings and parking garages. Sales of these products are driven by architectural specifications and safety codes, and the sales process is typically long as these are multi-year construction projects. International expansion is driving revenues in this end market as larger buildings are being designed and built. The construction market is a key driver for sales of architecturally-specified building products and our outlook for growth in new construction is stronger than the gross domestic product in the fiscal year ending March 31, 2017.
31
Table of Contents
Energy
The energy market represented approximately 7% and 13% of our net sales in the fiscal years ended March 31, 2016 and 2015, respectively. We provide market-leading lubricants and anti-seize compounds, as well as greases, for use in maintenance of oilfield drilling equipment. We also provide coatings to the energy industry for storage tanks, drum containers and general refinery maintenance. The outlook for the energy industry is heavily dependent on the demand growth from both mature markets and developing geographies. We believe increased crude oil supply resulted in the significant decline in the price of oil beginning in the fourth quarter of 2014, and we believe the lower oil prices will continue to negatively impact energy upstream investment most acutely and impact mid-stream and downstream investment to a lesser extent. We expect this will negatively impact the demand for our products used in oil and gas drilling applications in the fiscal year ending March 31, 2017.
Mining
The mining market represented approximately 4% and 7% of our net sales in the fiscal years ended March 31, 2016 and 2015, respectively. We provide market-leading lubricants to open gear boxes used in large mining excavation equipment, primarily through our distribution network. The mining industry has experienced headwinds recently due to reduced coal prices, which is caused by lower oil and gas prices. We are not anticipating any significant improvement in the mining industry in the fiscal year ending March 31, 2017.
RESULTS OF OPERATIONS
The following discussion provides an analysis of our consolidated results of operations and results for each of our segments. Currency effects included in the discussion below are calculated by translating current fiscal year results on a monthly basis at prior fiscal year exchange rates for the same periods.
The acquisitions listed below impact comparability:
| Acquisition |
Effective Date | Segment | ||
| Leak Freeze |
December 16, 2015 | Specialty Chemicals | ||
| Deacon |
October 1, 2015 | Coatings, Sealants & Adhesives | ||
| Strathmore |
April 1, 2015 | Coatings, Sealants & Adhesives | ||
| SureSeal |
January 2, 2015 | Industrial Products | ||
| Evo-Crete, Polyslab |
August 15, 2014 | Industrial Products | ||
| Fluid Defense |
January 31, 2014 | Industrial Products | ||
| Resource Conservation Technologies, Inc. |
January 2, 2014 | Industrial Products |
The operations of each acquired business have been included in the applicable segment since the effective date of the acquisition. All acquisitions are described in Note 2 to our consolidated financial statements included in Item 8 of this Annual Report.
| (Amounts in thousands, except percent and per share data) | Fiscal Years Ended March 31, | Change | ||||||||||||||
| 2016 | 2015 | Amount | Percent | |||||||||||||
| Revenues, net |
$ | 319,831 | $ | 261,834 | $ | 57,997 | 22.2 | % | ||||||||
| Gross profit |
147,864 | 126,425 | 21,439 | 17.0 | % | |||||||||||
| Gross profit margin |
46.2 | % | 48.3 | % | ||||||||||||
| Selling, general and administrative expense |
(100,378 | ) | (82,391 | ) | 17,987 | 21.8 | % | |||||||||
| Operating income |
47,486 | 44,034 | 3,452 | 7.8 | % | |||||||||||
| Operating margin |
14.8 | % | 16.8 | % | ||||||||||||
| Interest expense, net |
(3,035 | ) | (611 | ) | 2,424 | 396.7 | % | |||||||||
| Other (expense) income, net |
(226 | ) | 1,505 | (1,731 | ) | -115.0 | % | |||||||||
| Provision for income taxes |
(18,754 | ) | (15,223 | ) | 3,531 | 23.2 | % | |||||||||
| Effective tax rate |
42.4 | % | 33.9 | % | ||||||||||||
| Net income |
25,471 | 29,705 | (4,234 | ) | -14.3 | % | ||||||||||
| Earnings per share, diluted |
1.62 | 1.90 | (0.28 | ) | ||||||||||||
32
Table of Contents
| (Amounts in thousands, except percent and per share data) | Fiscal Years Ended March 31, | Change | ||||||||||||||
| 2015 | 2014 | Amount | Percent | |||||||||||||
| Revenues, net |
$ | 261,834 | $ | 231,713 | $ | 30,121 | 13.0 | % | ||||||||
| Gross profit |
126,425 | 112,086 | 14,339 | 12.8 | % | |||||||||||
| Gross profit margin |
48.3 | % | 48.4 | % | ||||||||||||
| Selling, general and administrative expense |
(82,391 | ) | (74,173 | ) | 8,218 | 11.1 | % | |||||||||
| Operating income |
44,034 | 37,913 | 6,121 | 16.1 | % | |||||||||||
| Operating margin |
16.8 | % | 16.4 | % | ||||||||||||
| Interest expense, net |
(611 | ) | (131 | ) | 480 | 366.4 | % | |||||||||
| Other income (expense), net |
1,505 | (256 | ) | 1,761 | -687.9 | % | ||||||||||
| Provision for income taxes |
(15,223 | ) | (12,794 | ) | 2,429 | 19.0 | % | |||||||||
| Effective tax rate |
33.9 | % | 34.1 | % | ||||||||||||
| Net income |
29,705 | 24,732 | 4,973 | 20.1 | % | |||||||||||
| Earnings per share, diluted |
1.90 | 1.58 | 0.32 | |||||||||||||
Net Revenues
Net revenues for the fiscal year ended March 31, 2016 increased $58.0 million, or 22.2%, as compared with the fiscal year ended March 31, 2015, including $58.9 million related to acquisitions. Excluding the impact of acquisitions, decreased sales volumes into the energy and mining industries were mostly offset by higher sales volumes of both existing products and new products, particularly into the HVAC and architecturally-specified building products markets.
Net revenues for the fiscal year ended March 31, 2015 increased $30.1 million, or 13.0%, as compared with the fiscal year ended March 31, 2014, including $15.2 million related to acquisitions. The remaining increase was primarily attributable to an increase in sales volumes in the Industrial Products segment due to HVAC products, and to a lesser degree, in the Coatings, Sealants & Adhesives segment due to caulking products, partially offset by a decrease in sales volumes in the Specialty Chemicals segment due largely to a slowdown in global mining activity.
Net revenues into the Americas, Europe, Middle East and Africa, and Asia Pacific represented approximately 89%, 7%, and 4% of net revenues, respectively, for the fiscal year ended March 31, 2016, 84%, 9%, and 7% of net revenues, respectively, for the fiscal year ended March 31, 2015 and 82%, 11%, and 7% of net revenues, respectively, for the fiscal year ended March 31, 2014. The increase in net revenue into the Americas for the fiscal year ended March 31, 2016 as compared with the prior periods is attributable to the acquisition of Strathmore, whose customers are generally U.S.-based. The presentation of net revenues by geographic region is based on the location of the customer. For additional information regarding net revenues by geographic region, see Note 16 to our consolidated financial statements included in “Item 8. Financial Statements and Supplementary Data” (“Item 8”) of this Annual Report.
Gross Profit and Gross Profit Margin
Gross profit for the fiscal year ended March 31, 2016 increased $21.4 million, or 17.0%, as compared with the fiscal year ended March 31, 2015, including $15.9 million related to acquisitions. Gross profit margin for the fiscal year ended March 31, 2016 of 46.2% decreased from 48.3% for the fiscal year ended March 31, 2015. The decrease was caused primarily by the addition of the lower gross margin associated with Strathmore products, partially offset by a pension plan curtailment benefit ($2.7 million), changes in product mix and lower materials costs for certain products.
Gross profit for the fiscal year ended March 31, 2015 increased $14.3 million, or 12.8%, as compared with the fiscal year ended March 31, 2014, including $7.4 million related to acquisitions. Gross profit margin for the fiscal year ended March 31, 2015 of 48.3% was comparable to the fiscal year ended March 31, 2014. The impact
33
Table of Contents
of increased sales in the Industrial Products and Coatings, Sealants & Adhesives segments, which positively impacted absorption of fixed manufacturing costs, was offset by higher raw materials and packaging unit costs for certain products in the Specialty Chemicals segment due to decreased manufacturing volumes.
Selling, General and Administrative Expense
Selling, general and administrative expense for the fiscal year ended March 31, 2016 increased $18.0 million, or 21.8%, as compared with the fiscal year ended March 31, 2015. The increase was attributable to acquired operations ($17.5 million, which includes $3.4 million of transaction costs) and organizational start-up costs incurred in connection with the Share Distribution ($3.7 million), as well as increased sales and distribution expenses consistent with increased sales volumes and increased personnel-related expenses and professional fees. These increases were partially offset by a pension plan curtailment benefit ($5.3 million) and the reversal of the liability for the earn-out related to the Strathmore acquisition ($2.0 million), as well as expenses recorded in the prior year that did not recur, including retention and severance costs associated with the consolidation of selected manufacturing activities ($1.3 million), bad debt related to one non-U.S. customer ($1.2 million), research and development expenses related to a project for the development of certain fire and smoke prevention products and an impairment loss ($0.7 million) recognized on a patent and a trademark.
Selling, general and administrative expense for the fiscal year ended March 31, 2015 increased $8.2 million, or 11.1%, as compared with the fiscal year ended March 31, 2014. The increase was attributable to higher costs in the Specialty Chemicals segment caused by the reserve for a bad debt related to one non-U.S. customer ($1.2 million), retention and severance costs associated with the consolidation of selected manufacturing activities ($1.3 million) and an increase in sales volumes consistent with the growth in net revenues in the Industrial Products segment, and to a lesser degree, in the Coatings, Sealants & Adhesives segment. These increases were slightly offset by a reduction in intangible asset impairment losses recognized in the current year as compared with the prior year.
Operating Income
Operating income for the fiscal year ended March 31, 2016 increased by $3.5 million, or 7.8%, as compared with the fiscal year ended March 31, 2015. The increase was primarily a result of the $21.4 million increase in gross profit, partially offset by the $18.0 million increase in selling, general and administrative expense as discussed above.
Operating income for the fiscal year ended March 31, 2015 increased by $6.1 million, or 16.1%, as compared with the fiscal year ended March 31, 2014. The increase was primarily a result of the $14.3 million increase in gross profit, partially offset by the $8.2 million increase in selling, general and administrative expense, as discussed above.
Interest Expense, net
Interest expense, net for the fiscal year ended March 31, 2016 increased $2.4 million as compared with the fiscal year ended March 31, 2015, primarily due to interest expense recognized on the loan related to the acquisition of Strathmore and interest expense recognized on our new Revolving Credit Facility (described in Note 7 to our consolidated financial statements included in Item 8 included in this Annual Report) entered into in December 2015. Interest expense, net for the fiscal year ended March 31, 2015 increased $0.5 million as compared with the fiscal year ended March 31, 2014.
Other (Expense) Income, net
Other (expense) income, net decreased by $1.7 million for the fiscal year ended March 31, 2016 to a loss of $0.2 million as compared with the fiscal year ended March 31, 2015. The decline is primarily due to a $0.9 million gain on the sale of real estate in the prior year that did not recur. Other (expense) income, net increased $1.8 million for the fiscal year ended March 31, 2015 to income of $1.5 million as compared with the fiscal year ended March 31, 2014. The improvement was primarily attributable to a $0.9 million gain on the sale of real estate.
34
Table of Contents
Provision for Income Taxes and Effective Tax Rate
The provision for income taxes for the fiscal year ended March 31, 2016 was $18.8 million, representing an effective tax rate of 42.4%, as compared with the provision of $15.2 million, representing an effective tax rate of 33.9%, for the fiscal year ended March 31, 2015 and the provision of $12.8 million, representing an effective tax rate of 34.1%, for the fiscal year ended March 31, 2014. The provision for income taxes was impacted by $3.0 million, relating to a reserve for uncertain tax positions, acquisition-related costs and start-up and organizational costs incurred in connection with the Share Distribution that are not deductible for tax purposes, which increased the effective tax rate by 6.7% for the fiscal year ended March 31, 2016. Other items impacting the effective tax rate include foreign operations activity in countries with lower statutory rates and domestic operations activity in states with higher statutory rates.
We accrue interest and penalties on uncertain tax positions as a component of our provision for income taxes. We have accrued interest and penalties on uncertain tax positions of $0.2 million and $0.2 million, respectively, for the fiscal year ended March 31, 2016. We did not recognize any interest and penalties for uncertain tax positions for the years ended March 31, 2015 or 2014.
As of March 31, 2016, we had $0.2 million in tax effected net operating loss carryforwards. Net operating loss carryforwards will expire in periods beyond the next five years.
Net Income and Earnings Per Share
Net income for the fiscal year ended March 31, 2016 decreased by $4.2 million to $25.5 million, or to $1.62 per diluted share, as compared with the fiscal year ended March 31, 2015. The decrease was primarily attributable to the $3.5 million increase in provision for income taxes.
Net income for the fiscal year ended March 31, 2015 increased by $5.0 million to $29.7 million, or to $1.90 per diluted share, as compared with the fiscal year ended March 31, 2014. The increase was attributable to the $6.1 million increase in operating income and the $1.8 million increase in other income (expense), net, partially offset by the $2.4 million increase in tax expense.
Business Segments
We conduct our operations through three business segments based on type of product and how we manage the business. We evaluate segment performance and allocate resources based on each segment’s operating income. The key operating results for our three business segments are discussed below.
Industrial Products Segment Results
Industrial Products includes specialty mechanical products, fire and smoke protection products, architecturally-specified building products and storage, filtration and application equipment for use with our specialty chemicals and other products for general industrial application.
| Fiscal Years Ended March 31, | Change | |||||||||||||||
| (Amounts in thousands, except percent data) | 2016 | 2015 | Amount | Percent | ||||||||||||
| Revenues, net |
$ | 138,594 | $ | 118,422 | $ | 20,172 | 17.0 | % | ||||||||
| Operating income |
31,075 | 19,711 | 11,364 | 57.7 | % | |||||||||||
| Operating margin |
22.4 | % | 16.6 | % | ||||||||||||
| Fiscal Years Ended March 31, | Change | |||||||||||||||
| (Amounts in thousands, except percent data) | 2015 | 2014 | Amount | Percent | ||||||||||||
| Revenues, net |
$ | 118,422 | $ | 93,043 | $ | 25,379 | 27.3 | % | ||||||||
| Operating income |
19,711 | 12,593 | 7,118 | 56.5 | % | |||||||||||
| Operating margin |
16.6 | % | 13.5 | % | ||||||||||||
35
Table of Contents
Net revenues for the fiscal year ended March 31, 2016 increased $20.2 million, or 17.0%, as compared with the fiscal year ended March 31, 2015. The increase was primarily attributable to increased sales volumes, as well as a slight improvement in pricing and $2.9 million attributable to acquisitions. Excluding the impact of acquisitions, increases in sales volumes and prices accounted for approximately 94% and 6%, respectively, of the increase in net revenues, and the increase in sales volumes resulted mainly from increased sales of existing products ($13.0 million), reflecting greater demand in the HVAC and the architecturally-specified building products markets, and sales of fire and smoke prevention products related to projects that were expected to begin in the prior fiscal year, but were started or completed in the first quarter because of customer delays ($2.5 million).
Net revenues for the fiscal year ended March 31, 2015 increased $25.4 million, or 27.3%, as compared with the fiscal year ended March 31, 2014. The increase was primarily attributable to higher sales volumes for the fiscal year ended March 31, 2015. The increase in sales volumes resulted from greater demand for HVAC products ($5.6 million), sales of new products from acquisitions ($15.1 million), and sales of newly developed fire and smoke prevention products ($0.7 million).
Operating income for the fiscal year ended March 31, 2016 increased $11.4 million, or 57.7%, as compared with the fiscal year ended March 31, 2015. The increase was primarily attributable to increased net revenues, as well as the decrease in expenses due to a pension plan curtailment benefit ($3.2 million) and an impairment loss ($0.7 million) recognized on a patent and trademark in the prior period that did not recur. These improvements were partially offset by increases in selling, general and administrative expenses due to personnel-related expenses and higher freight and commission expenses associated with increased sales volumes.
Operating income for the fiscal year ended March 31, 2015 increased $7.1 million, or 56.5%, as compared with the fiscal year ended March 31, 2014, supported by an increase in sales volumes, partially offset by modest increases in selling, general and administrative expenses relative to the increase in net revenues.
Coatings, Sealants & Adhesives Segment Results
Coatings, Sealants & Adhesives is comprised of coatings and penetrants, pipe thread sealants, firestopping sealants and caulks and adhesives/solvent cements.
| Fiscal Years Ended March 31, | Change | |||||||||||||||
| (Amounts in thousands, except percent data) | 2016 | 2015 | Amount | Percent | ||||||||||||
| Revenues, net |
$ | 106,035 | $ | 52,119 | $ | 53,916 | 103.4 | % | ||||||||
| Operating income |
10,911 | 11,420 | (509 | ) | -4.5 | % | ||||||||||
| Operating margin |
10.3 | % | 21.9 | % | ||||||||||||
| Fiscal Years Ended March 31, | Change | |||||||||||||||
| (Amounts in thousands, except percent data) | 2015 | 2014 | Amount | Percent | ||||||||||||
| Revenues, net |
$ | 52,119 | $ | 46,950 | $ | 5,169 | 11.0 | % | ||||||||
| Operating income |
11,420 | 9,360 | 2,060 | 22.0 | % | |||||||||||
| Operating margin |
21.9 | % | 19.9 | % | ||||||||||||
Net revenues for the fiscal year ended March 31, 2016 increased $53.9 million, or 103.4%, as compared with the fiscal year ended March 31, 2015. The increase was attributable to $54.6 million from acquisitions. Excluding the impact of acquisitions, sales into the energy industry declined, which were partially offset by increased sales into plumbing and general industrial markets.
Net revenues for the fiscal year ended March 31, 2015 increased $5.2 million, or 11.0%, as compared with the fiscal year ended March 31, 2014. The increase was primarily attributable to higher sales volumes, largely driven by sales of caulking products ($3.4 million), which were supported by recent acquisitions.
36
Table of Contents
Operating income for the fiscal year ended March 31, 2016 decreased $0.5 million, or 4.5%, as compared with the fiscal year ended March 31, 2015. The impact of increased net revenues, as well as the reversal of the liability for the earn-out related to the Strathmore acquisition ($2.0 million) and a decrease in expenses due to a pension plan curtailment benefit ($1.4 million) were offset by increases in selling, general and administrative expenses ($11.3 million) related to acquired operations, as well as Strathmore integration and transaction costs ($4.2 million) and personnel-related expenses and professional fees.
Operating income for the fiscal year ended March 31, 2015 increased $2.1 million, or 22.0%, as compared with the fiscal year ended March 31, 2014. The increase was due to an increase in sales volumes consistent with the growth in net revenues and modest increases in selling, general and administrative expenses consistent with the increase in net revenues.
Specialty Chemicals Segment Results
Specialty Chemicals includes lubricants and greases, drilling compounds, anti-seize compounds, chemical formulations and degreasers and cleaners.
| Fiscal Years Ended March 31, | Change | |||||||||||||||
| (Amounts in thousands, except percent data) | 2016 | 2015 | Amount | Percent | ||||||||||||
| Revenues, net |
$ | 74,930 | $ | 89,738 | $ | (14,808 | ) | -16.5 | % | |||||||
| Operating income |
12,490 | 13,016 | (526 | ) | -4.0 | % | ||||||||||
| Operating margin |
16.7 | % | 14.5 | % | ||||||||||||
| Fiscal Years Ended March 31, | Change | |||||||||||||||
| (Amounts in thousands, except percent data) | 2015 | 2014 | Amount | Percent | ||||||||||||
| Revenues, net |
$ | 89,738 | $ | 90,744 | $ | (1,006 | ) | -1.1 | % | |||||||
| Operating income |
13,016 | 15,877 | (2,861 | ) | -18.0 | % | ||||||||||
| Operating margin |
14.5 | % | 17.5 | % | ||||||||||||
Net revenues for the fiscal year ended March 31, 2016 decreased $14.8 million, or 16.5%, as compared with the fiscal year ended March 31, 2015, which is net of $1.4 million in net revenues provided by acquisitions. The decrease in net revenues was due to decreases in sales volumes related primarily to a slowdown in the energy industry ($14.5 million), which indirectly impacted other end markets, as well as a decrease in sales volumes into the mining and industrial markets ($5.7 million). These decreases were partially offset by an increase in sales volumes associated with both new and existing lubricant products offered to the rail industry ($4.0 million), and to a lesser extent, an increase in prices.
Net revenues for the fiscal year ended March 31, 2015 decreased $1.0 million, or 1.1%, as compared with the fiscal year ended March 31, 2014. The decrease was attributable to a decrease in sales volumes related primarily to a slowdown in global mining activity ($3.5 million). These decreases in sales volumes were partially offset by an increase in sales volumes associated with a new product offered to the rail industry ($1.0 million).
Operating income for the fiscal year ended March 31, 2016 decreased $0.5 million, or 4.0%, as compared with the fiscal year ended March 31, 2015. The improvement was primarily due to a decrease in expenses due to a pension plan curtailment benefit ($3.4 million) and lower freight and commissions expenses resulting from the decrease in sales volumes, as well as expenses recorded in the prior year that did not recur, including retention and severance costs associated with the consolidation of selected manufacturing activities ($1.3 million) and bad debt related to one non-U.S. customer ($1.2 million). These benefits were mostly offset by the impact of the decrease in net revenues, as well as transaction costs ($0.5 million) and increased system costs, personnel-related expenses and professional fees.
37
Table of Contents
Operating income for the fiscal year ended March 31, 2015 decreased $2.9 million, or 18.0%, as compared with the fiscal year ended March 31, 2014. The decline was a result of the decreases in sales volumes referenced above and increases in cost of revenues, due primarily to higher raw material and packaging costs for certain products, and operating expenses. The increase in operating expenses resulted from an increase in the reserve for bad debts ($1.2 million), retention and severance costs associated with the consolidation of selected manufacturing activities ($1.3 million), incentive plan accruals ($0.4 million) and ERP system implementation costs ($0.3 million), which were partially offset by lower commissions due to the decrease in sales volumes and lower travel and marketing costs ($0.8 million).
For additional information on segments, see Note 16 to our consolidated financial statements included in Item 8 of this Annual Report.
LIQUIDITY AND CAPITAL RESOURCES
Cash Flow Analysis
| Fiscal Years Ended March 31, | ||||||||||||
| (amounts in thousands) | 2016 | 2015 | 2014 | |||||||||
| Net cash provided by operating activities |
$ | 41,530 | $ | 35,468 | $ | 21,629 | ||||||
| Net cash used in investing activities |
(110,221 | ) | (2,625 | ) | (39,942 | ) | ||||||
| Net cash provided by (used in) financing activities |
74,694 | (26,893 | ) | 13,069 | ||||||||
Existing cash, cash generated by operations and borrowings available under our Revolving Credit Facility are our primary sources of short-term liquidity. We monitor the depository institutions that hold our cash and cash equivalents on a regular basis, and we believe that we have placed our deposits with creditworthy financial institutions. Our sources of operating cash generally include the sale of our products and services and the conversion of our working capital, particularly accounts receivable and inventories. Our cash balance (including cash and equivalents, restricted cash and bank time deposits) at March 31, 2016 was $39.3 million, as compared with $32.1 million at March 31, 2015.
For the fiscal year ended March 31, 2016, our cash provided by operating activities was $41.5 million, as compared with $35.5 million and $21.6 million for the fiscal years ended March 31, 2015 and 2014, respectively. Cash flows from working capital increased for the fiscal year ended March 31, 2016, due primarily to lower inventories ($5.1 million), lower accounts receivable ($2.5 million) and higher accounts payable and other current liabilities ($0.9 million), partially offset by higher prepaid expenses and other current assets ($4.9 million). Cash flows from working capital decreased for the fiscal year ended March 31, 2015, due primarily to higher inventories ($6.7 million), mostly offset by lower prepaid expenses and other current assets ($4.4 million) and higher accounts payable and other current liabilities ($1.1 million). Cash flows from working capital decreased for the fiscal year ended March 31, 2014, due primarily to higher accounts receivable ($10.0 million), higher inventories ($6.8 million) and lower accounts payable and other current liabilities ($0.9 million).
Cash flows used by investing activities during the fiscal year ended March 31, 2016 were $110.2 million as compared with $2.6 million and $39.9 million for the fiscal years ended March 31, 2015 and 2014, respectively. Capital expenditures during the fiscal years ended March 31, 2016, 2015 and 2014 were $11.1 million, $8.7 million and $15.0 million, respectively. Our capital expenditures are focused on capacity expansion, consolidation of manufacturing facilities, continuous improvement and automation. We are in the process of streamlining some manufacturing operations, including the consolidation of most of our lubricant and grease production into our Rockwall, Texas facility. Our total capital expenditure requirements related to this consolidation are currently expected to be approximately $3 million during the fiscal year ending March 31, 2017, and may require additional capital expenditures in later periods. As discussed in Note 2 to our consolidated financial statements included in Item 8 of this Annual Report, we acquired Strathmore for $68.8 million, Deacon
38
Table of Contents
for $12.6 million and Leak Freeze for $16.3 million during the fiscal year ended March 31, 2016. During the fiscal year ended March 31, 2015, we received total proceeds of $9.9 million from the sale of assets, and used $4.5 million to acquire the Evo-Crete and Polyslab product lines. During the fiscal year ended March 31, 2014, we used $18.5 million to acquire Resource Conservation Technologies, Inc. and $5.6 million to acquire Fluid Defense.
Cash flows provided by financing activities during the fiscal year ended March 31, 2016 were $74.7 million as compared with a use of $26.9 million and $13.1 million provided for the fiscal years ended March 31, 2015 and 2014, respectively. Cash inflows during the fiscal year ended March 31, 2016 resulted primarily from borrowings on our new revolving credit agreement (as discussed in Note 7 to our consolidated financial statements included in Item 8 of this Annual Report), which were used to repay amounts outstanding under the Strathmore Acquisition Term Loan and the RectorSeal Line of Credit and fund the acquisition of Leak Freeze, and a contribution of $13.0 million from Capital Southwest. We had net (repayments) borrowings on outstanding lines of credit of $(18.4) million and $21.8 million during the fiscal years ended March 31, 2015 and 2014, respectively. We paid dividends to Capital Southwest of $8.3 million and $8.7 million during the fiscal years ended March 31, 2015 and 2014, respectively.
We believe that available cash and cash equivalents, cash flows generated through operations and cash available under our Revolving Credit Facility will be sufficient to meet our liquidity needs, including capital expenditures, for at least the next 12 months.
Acquisitions and Dispositions
We regularly evaluate acquisition opportunities of various sizes. The cost and terms of any financing to be raised in conjunction with any acquisition, including our ability to raise capital, is a critical consideration in any such evaluation.
Note 2 to our consolidated financial statements included in Item 8 of this Annual Report contains a discussion of our acquisitions.
Financing
Credit Facilities
See Note 7 to our consolidated financial statements included in Item 8 of this Annual Report for a discussion of our indebtedness. We complied with all covenants through March 31, 2016.
We have entered into interest rate swap agreements to hedge our exposure to variable interest payments related to our indebtedness. These agreements are more fully described in Note 9 to our consolidated financial statements included in Item 8 of this Annual Report, and in “Item 7A. Quantitative and Qualitative Disclosures about Market Risk” below.
Off-Balance Sheet Arrangements
As of March 31, 2016, we did not have any off-balance sheet arrangements that we believe have or are reasonably likely to have a material adverse effect on our financial condition or results of operations.
OUTLOOK FOR FISCAL YEAR 2017
Consolidated revenue for the year ended March 31, 2016 was $319.8 million, an increase of $58.0 million or 22.2%, as compared with the year ended March 31, 2015. This included an increase of $58.9 million due to acquisitions.
39
Table of Contents
Looking ahead, the year ending March 31, 2017 (“Fiscal 2017”) is poised to be an important year as we remain focused on delivering our operational commitments and priorities while advancing our strategic initiatives as a standalone public company. We have a diverse product portfolio that serves an attractive and broad range of growing end markets, primarily in North America, and we have a stable platform for acquisitions with a proven track record of product enhancement and customer centric solutions. We expect to see revenue growth in the majority of our key end use markets during Fiscal 2017, including HVAC, plumbing, rail lubrication, architecturally-specified building products and industrial markets. This expected revenue growth will be driven by our innovative technologies, product differentiation, recent acquisitions and favorable industry trends. Other end markets, however, are anticipated to remain flat or slightly down during Fiscal 2017 due to ongoing effects of energy market weakness, driven by the decline in the price of oil, gas and coal. This includes our sales into energy and mining end markets where we do not expect to see meaningful recovery during Fiscal 2017.
We are focused on operational excellence in all aspects of our business, leading to improved efficiencies and increased profitability. We have established centers of excellence across our company to capture and leverage organizational synergies. Operational excellence is expected to generate approximately $5 million in annual run rate savings in our Specialty Chemicals segment following the completion of the integration of Jet-Lube and Whitmore. The majority of these savings will begin to be realized during Fiscal 2017 with full run-rate savings expected by the end of Fiscal 2017. We also expect to realize approximately $2 million in annual run-rate procurement savings across the business, which should begin to be realized in Fiscal 2017. Our Coatings, Sealants & Adhesives segment results are expected to improve as Strathmore’s integration plan progresses, including ongoing manufacturing footprint optimization efforts, margin remediation initiatives and revenue growth from recapturing lost market share and acceleration of product development for new applications.
In Fiscal 2017, we expect capital expenditures to be between $10 million and $12 million. Capital expenditures will be focused on consolidation of manufacturing facilities, continuous improvement and automation. Additionally, we will continue to evaluate acquisition opportunities of various sizes.
CONTRACTUAL OBLIGATIONS
The following table presents a summary of our contractual obligations at March 31, 2016 (in thousands):
| Payments due by Period (1) | ||||||||||||||||||||
| < 1 Year | 1-3 Years | 3-5 Years | > 5 Years | Total | ||||||||||||||||
| Long-term debt obligations, principal (2) |
$ | 561 | $ | 1,122 | $ | 77,661 | $ | 10,338 | $ | 89,682 | ||||||||||
| Long-term debt obligations, interest (2) |
2,733 | 5,385 | 4,666 | 3,262 | 16,046 | |||||||||||||||
| Operating lease obligations (3) |
2,364 | 3,200 | 2,642 | 4,648 | 12,854 | |||||||||||||||
| Purchase obligations (4) |
18,282 | 1,603 | 585 | — | 20,470 | |||||||||||||||
| Other long-term liabilities (5) |
85 | 6,841 | 316 | 452 | 7,694 | |||||||||||||||
|
|
|
|
|
|
|
|
|
|
|
|||||||||||
| Total (6) |
$ | 24,025 | $ | 18,151 | $ | 85,870 | $ | 18,700 | $ | 146,746 | ||||||||||
|
|
|
|
|
|
|
|
|
|
|
|||||||||||
| (1) | The less than one year category represents the fiscal year ended March 31, 2017, the 1-3 years category represents fiscal years ending March 31, 2018 and 2019, the 3-5 years category represents fiscal years ending March 31, 2020 and 2021 and the greater than five years category represents fiscal years ending March 31, 2022 and thereafter. |
| (2) | Amounts include principal and interest cash payments through the maturity of the outstanding debt obligations. See Note 7 to our consolidated financial statements included in Item 8 of this Annual Report. |
| (3) | Sales taxes, value added taxes, and goods and services taxes included as part of recurring lease payments are excluded from the amounts shown above. |
| (4) | Purchase obligations include agreements to purchase goods or services that are enforceable, legally binding, and specify all significant terms, including: fixed or minimum quantities to be purchased; fixed, minimum, or variable price provisions; and the approximate timing of the transaction. Purchase obligations exclude agreements that are cancelable without penalty, but include open purchase orders which represent amounts we anticipate will become payable for goods and services we have negotiated for delivery. |
40
Table of Contents
| (5) | Amounts primarily include settlement of the non-current portion of the liability recorded for the interest rate swap agreements, contingent consideration payable due to acquisitions and future payments required under outstanding incentive awards. See Notes 5, 6 and 9 to our consolidated financial statements included in Item 8 of this Annual Report. The liability for retirement benefits payable related to our defined benefit pension plans is excluded from the contractual obligations table as it does not represent expected liquidity requirements. |
| (6) | Operating lease and purchase obligations denominated in foreign currencies are projected based on the exchange rate in effect on March 31, 2016. Excludes amounts that have been eliminated in our consolidated financial statements. |
CRITICAL ACCOUNTING ESTIMATES
The process of preparing financial statements in conformity with U.S. GAAP requires the use of estimates and assumptions to determine reported amounts of certain assets, liabilities, revenues and expenses and the disclosure of related contingent assets and liabilities. These estimates and assumptions are based upon information available at the time of the estimates or assumptions, including our historical experience, where relevant. The most significant estimates made by management include: timing and amount of revenue recognition; deferred taxes and tax reserves; pension benefits; and valuation of goodwill and indefinite-lived intangible assets. The significant estimates are reviewed at least annually if not quarterly by management. Because of the uncertainty of factors surrounding the estimates, assumptions and judgments used in the preparation of our financial statements, actual results may differ from the estimates, and the difference may be material.
Our critical accounting policies are those policies that are both most important to our financial condition and results of operations and require the most difficult, subjective or complex judgments on the part of management in their application, often as a result of the need to make estimates about the effect of matters that are inherently uncertain. We believe that the following represent our critical accounting policies. For a summary of all of our significant accounting policies, see Note 1 to our consolidated financial statements included in Item 8 of this Annual Report. Management and our external auditors have discussed our critical accounting estimates and policies with the Audit Committee of our Board of Directors.
Revenue Recognition
We generally recognize revenue upon shipment of product, at which time title and risk of loss passes to the customer. Additionally, we require that all of the following circumstances are satisfied: (a) persuasive evidence of an arrangement exists, (b) price is fixed or determinable, (c) collectability is reasonably assured and (d) delivery has occurred or services have been rendered. Net revenues represent gross revenues invoiced to customers less certain related charges for contractual discounts or rebates. Discounts provided to customers at the point of sale are recognized as reductions in revenue as the products are sold. Rebate amounts are recorded as reduction of revenue on a monthly basis using estimates of customer participation and performance. Freight charges billed to customers are included in net revenues and the related shipping costs are included in cost of revenues in our consolidated statements of income.
Deferred Taxes and Tax Reserves
Deferred tax assets and liabilities are determined based on temporary differences between the financial statement carrying amounts and the tax basis of assets and liabilities, applying enacted tax rates expected to be in effect for the year in which the differences are expected to reverse. The effect on deferred tax assets and liabilities of a change in tax rates is recognized in income in the period that includes the enactment date. Based on the evaluation of available evidence, both positive and negative, we recognize future tax benefits, such as net operating loss carryforwards and tax credit carryforwards, to the extent that these benefits are more likely than not to be realized. We base our judgment of the recoverability of our deferred tax assets primarily on historical earnings, our estimate of current and expected future earnings using historical and projected future operating results, and prudent and feasible tax planning strategies.
41
Table of Contents
The amount of income taxes we pay is subject to ongoing audits by federal, state and foreign tax authorities, which may result in proposed assessments. Significant judgment is required in determining income tax provisions and evaluating tax positions. We establish reserves for open tax years for uncertain tax positions that may be subject to challenge by various taxing authorities. The consolidated tax provision and related accruals include the impact of such reasonably estimable losses and related interest and penalties as deemed appropriate. Tax benefits recognized in the financial statements from uncertain tax positions are measured based on the largest benefit that has a greater than 50% likelihood of being realized upon ultimate settlement. For the fiscal year ended March 31, 2016, we recognized an uncertain tax position related to state taxes in the amount of $0.9 million, and we recognized $0.4 million in interest and penalties in income tax expense. Our liability for uncertain tax positions contains uncertainties as management is required to make assumptions and apply judgments to estimate exposures associated with our tax positions. We did not recognize any uncertain tax positions or interest and penalties in income tax expense for the fiscal years ended March 31, 2015 or 2014.
We are currently not under examination for any of our U.S. federal income taxes or state income taxes.
In the fiscal year ended March 31, 2016, as a member of a controlled group, our subsidiaries were allocated certain federal tax brackets such that $10.0 million was taxed at 34%.
While we believe we have adequately provided for any reasonably foreseeable outcome related to these matters, our future results may include favorable or unfavorable adjustments to our estimated tax liabilities. To the extent that the expected tax outcome of these matters changes, such changes in estimate will impact the income tax provision in the period in which such determination is made.
Pension Benefits
Certain of our employees hired prior to January 1, 2015 participate in a qualified defined benefit pension plan (the “Qualified Plan”). The Qualified Plan is closed to any employees hired or re-hired on or after January 1, 2015. The Qualified Plan was amended to freeze benefit accruals and to modify certain ancillary benefits effective as of September 30, 2015. The assets, liabilities and expenses we recognize and disclosures we make about plan actuarial and financial information are dependent on the assumptions and estimates used in calculating such amounts. The assumptions include factors such as discount rates, health care cost trend rates, inflation, expected rates of return on plan assets, retirement rates, mortality rates, turnover, rates of compensation increases and other factors. We maintain an unfunded retirement restoration plan (the “Restoration Plan”) that is a non-qualified plan providing for the payment to participating employees, upon retirement, the difference between the maximum annual payment permissible under the Qualified Plan pursuant to federal limitations and the amount that would otherwise have been payable under the Qualified Plan. Consistent with the Qualified Plan, the Restoration Plan was amended effective September 30, 2015 to freeze benefit accruals and to modify certain ancillary benefits.
The assumptions utilized to compute expense and benefit obligations are shown in Note 11 to our consolidated financial statements included in Item 8 of this Annual Report. These assumptions are assessed at least annually in consultation with independent actuaries as of March 31 and adjustments are made as needed. We evaluate prevailing market conditions, including appropriate rates of return, interest rates and medical inflation (health care cost trend) rates. We ensure that our significant assumptions are within the reasonable range relative to market data. The methodology to set our significant assumptions includes:
| • | Discount rates are estimated using high quality corporate bond yields with a duration matching the expected benefit payments. The discount rate is obtained from a universe of Aa-rated non-callable bonds across the full maturity spectrum to establish a weighted average discount rate. Our discount rate assumptions are impacted by changes in general economic and market conditions that affect interest rates on long-term high-quality debt securities, as well as the duration of our plans’ liabilities. |
| • | The expected rates of return on plan assets are derived from reviews of asset allocation strategies, expected future experience for trust asset returns, risks and other factors adjusted for our specific |
42
Table of Contents
| investment strategy. These rates are impacted by changes in general market conditions, but because they are long-term in nature, short-term market changes do not significantly impact the rates. Changes to our target asset allocation also impact these rates. |
Depending on the assumptions used, pension expense could vary within a range of outcomes and have a material effect on reported earnings. In addition, the assumptions can materially affect benefit obligations and future cash funding. Actual results in any given year may differ from those estimated because of economic and other factors.
We evaluate the funded status of the Qualified Plan using current assumptions and determine the appropriate funding level considering applicable regulatory requirements, tax deductibility, reporting considerations, cash flow requirements and other factors.
Goodwill and Indefinite-Lived Intangible Assets
Goodwill represents the excess of the aggregate purchase price over the fair value of identifiable net assets acquired in a business combination. We test goodwill at least annually for impairment at the reporting unit level, which is an operating segment or one level below an operating segment. Goodwill is tested for impairment more frequently if conditions arise or events occur that indicate that the fair value of the reporting unit is lower than the carrying value of that reporting unit. Goodwill is recorded in three reporting units.
We first assess qualitative factors to determine whether it is more likely than not that the fair value of a reporting unit is less than its carrying amount as a basis for determining whether it is necessary to perform the two-step goodwill impairment test. Qualitative assessments use an evaluation of events and circumstances such as macroeconomic conditions, industry and market considerations, cost factors, financial performance factors, entity specific events, and changes in carrying value to determine whether it is more likely than not that the fair value of the reporting unit is less than its carrying amount, including goodwill.
If a reporting unit fails the qualitative assessment, then valuation models and other relevant data are used to estimate the reporting unit’s fair value. The valuation models require the input of subjective assumptions. We use an income approach for impairment testing of goodwill using a discounted cash flow method. Significant estimates include future revenue and expense projections, growth estimates made to calculate terminal value, and a discount rate that approximates our weighted average cost of capital. We perform qualitative and quantitative assessments to test asset carrying values for impairment at January 31, which is the annual impairment testing date.
For purposes of completing the annual goodwill impairment test for fiscal year 2016, a quantitative assessment was utilized to assess the recoverability of goodwill for all three reporting units. The estimated fair value was determined using a discounted cash flow technique, and the key inputs used in the evaluation are consistent with those inputs noted above. Management concluded that the fair value of the reporting units substantially exceeded the carrying value of the reporting unit as a result of completing step one of the quantitative assessment. There were no goodwill impairment losses recognized for the fiscal years ended March 31, 2016, 2015 or 2014.
We have indefinite-lived intangible assets in the form of trademarks and license agreements. We review these intangible assets at least annually for impairment, or whenever events or changes in circumstances indicate that the carrying amount may not be recoverable. Significant assumptions used in the impairment test include the discount rate, royalty rate, future projections and terminal value growth rate. These inputs are considered non-recurring level three inputs within the fair value hierarchy. An impairment loss would be recognized when estimated future cash flows are less than their carrying amount. We recorded impairment losses on intangible assets of $0, $0.7 million and $1.3 million for the fiscal years ended March 31, 2016, 2015 and 2014, respectively.
43
Table of Contents
ACCOUNTING DEVELOPMENTS
We have presented the information about accounting pronouncements not yet implemented in Note 1 to our consolidated financial statements included in Item 8 of this Annual Report.
ITEM 7A: QUANTITATIVE AND QUALITATIVE DISCLOSURES ABOUT MARKET RISK
We are exposed to market risk from changes in interest rates and foreign currency exchange rates, which may adversely affect our consolidated financial position and results of operations. We seek to minimize these risks through regular operating and financing activities, and when deemed appropriate, through the use of interest rate swaps. It is our policy to enter into interest rate swaps only to the extent considered necessary to meet our risk management objectives. We do not purchase, hold or sell derivative financial instruments for trading or speculative purposes.
Variable Rate Indebtedness
We are subject to interest rate risk on our variable rate indebtedness. Fluctuations in interest rates have a direct effect on interest expense associated with our outstanding indebtedness. As of March 31, 2016, we had outstanding variable rate indebtedness of $43.3 million, after consideration of interest rate swaps. We manage, or hedge, interest rate risks related to our borrowings by means of interest rate swap agreements. At March 31, 2016, we had interest rate swap agreements that covered $46.4 million of the $89.7 million of our total outstanding indebtedness. At March 31, 2016, unhedged variable rate indebtedness of $43.3 million had a weighted average interest rate of 2.18%. Each quarter point change in interest rates would result in a change of less than $0.2 million in our interest expense on an annual basis.
We may also be exposed to credit risk in derivative contracts we may use. Credit risk is the failure of the counterparty to perform under the terms of the derivative contract. If the fair value of a derivative contract is positive, the counterparty will owe us, which creates credit risk for us. If the fair value of a derivative contract is negative, we will owe the counterparty and, therefore, do not have credit risk. We have sought to minimize the credit risk in derivative instruments by entering into transactions with high-quality counterparties.
Foreign Currency Exchange Rate Risk
We conduct a small portion of our operations outside of the U.S. in currencies other than the U.S. dollar. Our non-U.S. operations are conducted primarily in their local currencies, which are also their functional currencies, and include the British pound, Canadian dollar and Australian dollar. Foreign currency exposures arise from translation of foreign-denominated assets and liabilities into U.S. dollars and from transactions denominated in a currency other than a non-U.S. operation’s functional currency. We realized net (losses) gains associated with foreign currency translation of $(1.4) million, $(5.3) million and $0.4 million for the fiscal years ended March 31, 2016, 2015 and 2014, respectively, which are included in other comprehensive income (loss). We recognized foreign currency transaction net losses of $0.1 million, $0.3 million and $0.2 million for the fiscal years ended March 31, 2016, 2015 and 2014, respectively, which are included in other (expense) income, net in the consolidated statements of income.
Based on a sensitivity analysis at March 31, 2016, a 10% change in the foreign currency exchange rates for the fiscal year ended March 31, 2016 would have impacted our net earnings by a negligible amount. This calculation assumes that all currencies change in the same direction and proportion relative to the U.S. dollar and that there are no indirect effects, such as changes in non-U.S. dollar sales volumes or prices.
44
Table of Contents
ITEM 8: FINANCIAL STATEMENTS AND SUPPLEMENTARY DATA
REPORT OF INDEPENDENT REGISTERED PUBLIC ACCOUNTING FIRM
Board of Directors and Shareholders
CSW Industrials, Inc.
We have audited the accompanying consolidated balance sheets of CSW Industrials, Inc. and subsidiaries (the “Company”) as of March 31, 2016 and 2015, and the related consolidated statements of income, comprehensive income, equity and cash flows for each of the three years in the period ended March 31, 2016. These financial statements are the responsibility of the Company’s management. Our responsibility is to express an opinion on these financial statements based on our audits.
We conducted our audits in accordance with the standards of the Public Company Accounting Oversight Board (United States). Those standards require that we plan and perform the audit to obtain reasonable assurance about whether the financial statements are free of material misstatement. We were not engaged to perform an audit of the Company’s internal control over financial reporting. Our audits included consideration of internal control over financial reporting as a basis for designing audit procedures that are appropriate in the circumstances, but not for the purpose of expressing an opinion on the effectiveness of the Company’s internal control over financial reporting. Accordingly, we express no such opinion. An audit also includes examining, on a test basis, evidence supporting the amounts and disclosures in the financial statements, assessing the accounting principles used and significant estimates made by management, as well as evaluating the overall financial statement presentation. We believe that our audits provide a reasonable basis for our opinion.
In our opinion, the consolidated financial statements referred to above present fairly, in all material respects, the financial position of CSW Industrials, Inc. and subsidiaries as of March 31, 2016 and 2015, and the results of their operations and their cash flows for each of the three years in the period ended March 31, 2016 in conformity with accounting principles generally accepted in the United States of America.
/s/ GRANT THORNTON LLP
Dallas, Texas
June 8, 2016
45
Table of Contents
CSW INDUSTRIALS, INC.
| March 31, | ||||||||
| (Amounts in thousands, except per share amounts) | 2016 | 2015 | ||||||
| ASSETS | ||||||||
| Current assets: |
||||||||
| Cash and cash equivalents |
$ | 25,987 | $ | 20,448 | ||||
| Restricted cash |
— | 2,385 | ||||||
| Bank time deposits |
13,278 | 9,248 | ||||||
| Accounts receivable, net |
52,637 | 48,941 | ||||||
| Inventories, net |
51,634 | 47,175 | ||||||
| Prepaid expenses and other current assets |
11,985 | 4,099 | ||||||
|
|
|
|
|
|||||
| Total current assets |
155,521 | 132,296 | ||||||
| Property, plant and equipment, net |
64,357 | 56,837 | ||||||
| Goodwill |
67,757 | 40,645 | ||||||
| Intangible assets, net |
88,727 | 40,997 | ||||||
| Other assets |
15,898 | 15,746 | ||||||
|
|
|
|
|
|||||
| Total assets |
$ | 392,260 | $ | 286,521 | ||||
|
|
|
|
|
|||||
| LIABILITIES AND EQUITY | ||||||||
| Current liabilities: |
||||||||
| Accounts payable |
$ | 9,912 | $ | 8,960 | ||||
| Accrued and other current liabilities |
21,090 | 16,001 | ||||||
| Current portion of long-term debt |
561 | 13,561 | ||||||
|
|
|
|
|
|||||
| Total current liabilities |
31,563 | 38,522 | ||||||
| Long-term debt |
89,121 | 13,143 | ||||||
| Retirement benefits payable |
1,746 | 22,545 | ||||||
| Other liabilities |
11,820 | 7,710 | ||||||
|
|
|
|
|
|||||
| Total liabilities |
134,250 | 81,920 | ||||||
| Equity: |
||||||||
| Common shares, $0.01 par value |
156 | 12 | ||||||
| Shares authorized – 50,000 |
||||||||
| Shares issued – 15,659 |
||||||||
| Preferred shares, $0.01 par value |
— | 1,000 | ||||||
| Shares authorized – 10,000 |
||||||||
| Shares issued – 0 |
||||||||
| Additional paid-in capital |
31,597 | 7,810 | ||||||
| Treasury shares, at cost |
— | (2,712 | ) | |||||
| Retained earnings |
233,955 | 208,784 | ||||||
| Accumulated other comprehensive loss |
(7,698 | ) | (10,293 | ) | ||||
|
|
|
|
|
|||||
| Total equity |
258,010 | 204,601 | ||||||
|
|
|
|
|
|||||
| Total liabilities and equity |
$ | 392,260 | $ | 286,521 | ||||
|
|
|
|
|
|||||
See accompanying notes to consolidated financial statements.
46
Table of Contents
CSW INDUSTRIALS, INC.
CONSOLIDATED STATEMENTS OF INCOME
| Fiscal Years Ended March 31, | ||||||||||||
| (Amounts in thousands, except per share amounts) | 2016 | 2015 | 2014 | |||||||||
| Revenues, net |
$ | 319,831 | $ | 261,834 | $ | 231,713 | ||||||
| Cost of revenues |
(171,967 | ) | (135,409 | ) | (119,627 | ) | ||||||
|
|
|
|
|
|
|
|||||||
| Gross profit |
147,864 | 126,425 | 112,086 | |||||||||
| Selling, general and administrative expense |
(100,378 | ) | (81,681 | ) | (72,864 | ) | ||||||
| Impairment loss |
— | (710 | ) | (1,309 | ) | |||||||
|
|
|
|
|
|
|
|||||||
| Operating income |
47,486 | 44,034 | 37,913 | |||||||||
| Interest expense, net |
(3,035 | ) | (611 | ) | (131 | ) | ||||||
| Other (expense) income, net |
(226 | ) | 1,505 | (256 | ) | |||||||
|
|
|
|
|
|
|
|||||||
| Income before income taxes |
44,225 | 44,928 | 37,526 | |||||||||
| Provision for income taxes |
(18,754 | ) | (15,223 | ) | (12,794 | ) | ||||||
|
|
|
|
|
|
|
|||||||
| Net income |
$ | 25,471 | $ | 29,705 | $ | 24,732 | ||||||
|
|
|
|
|
|
|
|||||||
| Net earnings per common share: |
||||||||||||
| Basic |
$ | 1.63 | $ | 1.91 | $ | 1.59 | ||||||
| Diluted |
1.62 | 1.90 | 1.58 | |||||||||
CONSOLIDATED STATEMENTS OF COMPREHENSIVE INCOME
| Fiscal Years Ended March 31, | ||||||||||||
| (Amounts in thousands) | 2016 | 2015 | 2014 | |||||||||
| Net income |
$ | 25,471 | $ | 29,705 | $ | 24,732 | ||||||
| Other comprehensive income (loss): |
||||||||||||
| Foreign currency translation adjustments |
(1,371 | ) | (5,277 | ) | 363 | |||||||
| Cash flow hedging activity, net of taxes of $8, $649 and $0, respectively |
(15 | ) | (1,206 | ) | — | |||||||
| Pension and other postretirement effects, net of taxes of $(2,145), $3,396 and $(1,734), respectively |
3,981 | (6,307 | ) | 3,220 | ||||||||
|
|
|
|
|
|
|
|||||||
| Other comprehensive income (loss) |
2,595 | (12,790 | ) | 3,583 | ||||||||
|
|
|
|
|
|
|
|||||||
| Comprehensive income |
$ | 28,066 | $ | 16,915 | $ | 28,315 | ||||||
|
|
|
|
|
|
|
|||||||
See accompanying notes to consolidated financial statements.
47
Table of Contents
CSW INDUSTRIALS, INC.
CONSOLIDATED STATEMENTS OF EQUITY
| (Amounts in thousands) | Common Stock |
Additional Paid-In Capital |
Retained Earnings |
Net Investment of Capital Southwest |
Accumulated Other Comprehensive Loss |
Total Equity |
||||||||||||||||||
| Balance at April 1, 2013 |
$ | — | $ | — | $ | 171,292 | $ | 6,316 | $ | (1,086 | ) | $ | 176,522 | |||||||||||
| Net income |
— | — | 24,732 | — | — | 24,732 | ||||||||||||||||||
| Dividends |
— | — | (8,651 | ) | — | — | (8,651 | ) | ||||||||||||||||
| Other comprehensive income, net of tax |
— | — | — | — | 3,583 | 3,583 | ||||||||||||||||||
|
|
|
|
|
|
|
|
|
|
|
|
|
|||||||||||||
| Balance at March 31, 2014 |
$ | — | $ | — | $ | 187,373 | $ | 6,316 | $ | 2,497 | $ | 196,186 | ||||||||||||
|
|
|
|
|
|
|
|
|
|
|
|
|
|||||||||||||
| Net income |
— | — | 29,705 | — | — | 29,705 | ||||||||||||||||||
| Dividends |
— | — | (8,294 | ) | — | — | (8,294 | ) | ||||||||||||||||
| Repurchases of common shares |
— | — | — | (206 | ) | — | (206 | ) | ||||||||||||||||
| Other comprehensive income, net of tax |
— | — | — | — | (12,790 | ) | (12,790 | ) | ||||||||||||||||
|
|
|
|
|
|
|
|
|
|
|
|
|
|||||||||||||
| Balance at March 31, 2015 |
$ | — | $ | — | $ | 208,784 | $ | 6,110 | $ | (10,293 | ) | $ | 204,601 | |||||||||||
|
|
|
|
|
|
|
|
|
|
|
|
|
|||||||||||||
| Share-based and other executive compensation |
— | 2,231 | — | — | — | 2,231 | ||||||||||||||||||
| Stock activity under stock plans |
— | 96 | — | — | — | 96 | ||||||||||||||||||
| Tax benefit associated with share-based compensation |
— | 212 | — | — | — | 212 | ||||||||||||||||||
| Net income |
— | — | 25,471 | — | — | 25,471 | ||||||||||||||||||
| Dividends |
— | — | (300 | ) | — | — | (300 | ) | ||||||||||||||||
| Other comprehensive income, net of tax |
— | — | — | — | 2,595 | 2,595 | ||||||||||||||||||
| Effects of Share Distribution and contributions from Capital Southwest |
156 | 29,058 | — | (6,110 | ) | — | 23,104 | |||||||||||||||||
|
|
|
|
|
|
|
|
|
|
|
|
|
|||||||||||||
| Balance at March 31, 2016 |
$ | 156 | $ | 31,597 | $ | 233,955 | $ | — | $ | (7,698 | ) | $ | 258,010 | |||||||||||
|
|
|
|
|
|
|
|
|
|
|
|
|
|||||||||||||
See accompanying notes to consolidated financial statements.
48
Table of Contents
CSW INDUSTRIALS, INC.
CONSOLIDATED STATEMENTS OF CASH FLOWS
| Fiscal Years Ended March 31, | ||||||||||||
| (Amounts in thousands) | 2016 | 2015 | 2014 | |||||||||
| Cash flows from operating activities: |
||||||||||||
| Net income |
$ | 25,471 | $ | 29,705 | $ | 24,732 | ||||||
| Adjustments to reconcile net income to net cash provided by operating activities: |
||||||||||||
| Depreciation |
7,032 | 5,922 | 5,225 | |||||||||
| Amortization of intangible and other assets |
7,129 | 4,593 | 3,888 | |||||||||
| Provision for doubtful accounts |
(282 | ) | 1,515 | 130 | ||||||||
| Share-based and other executive compensation |
2,231 | — | — | |||||||||
| Acquisition-related non-cash gain |
(1,950 | ) | — | — | ||||||||
| Net loss (gain) on sales of property, plant and equipment |
60 | (1,627 | ) | (251 | ) | |||||||
| Pension plan curtailment benefit |
(8,020 | ) | — | — | ||||||||
| Net pension expense |
3,506 | 3,392 | 3,616 | |||||||||
| Impairment of assets |
— | 710 | 1,309 | |||||||||
| Net deferred taxes |
7,262 | (7,887 | ) | (1,023 | ) | |||||||
| Changes in operating assets and liabilities: |
||||||||||||
| Accounts receivable, net |
2,522 | (37 | ) | (9,964 | ) | |||||||
| Inventories, net |
5,056 | (6,655 | ) | (6,764 | ) | |||||||
| Prepaid expenses and other current assets |
(4,945 | ) | 4,351 | (680 | ) | |||||||
| Other assets |
(3,275 | ) | 109 | 2,004 | ||||||||
| Accounts payable and other current liabilities |
910 | 1,086 | (850 | ) | ||||||||
| Retirement benefits payable and other liabilities |
(1,177 | ) | 291 | 257 | ||||||||
|
|
|
|
|
|
|
|||||||
| Net cash provided by operating activities |
41,530 | 35,468 | 21,629 | |||||||||
|
|
|
|
|
|
|
|||||||
| Cash flows from investing activities: |
||||||||||||
| Capital expenditures |
(11,053 | ) | (8,672 | ) | (15,042 | ) | ||||||
| Proceeds from sale of assets held for investment |
— | 3,494 | 1,740 | |||||||||
| Proceeds from sale of assets |
46 | 6,393 | 5 | |||||||||
| Net change in bank time deposits |
(1,978 | ) | 3,353 | (2,013 | ) | |||||||
| Cash paid for acquisitions |
(97,236 | ) | (7,193 | ) | (24,632 | ) | ||||||
|
|
|
|
|
|
|
|||||||
| Net cash used in investing activities |
(110,221 | ) | (2,625 | ) | (39,942 | ) | ||||||
|
|
|
|
|
|
|
|||||||
| Cash flows from financing activities: |
||||||||||||
| Borrowings on lines of credit |
81,000 | 12,229 | 37,217 | |||||||||
| Repayments on lines of credit |
(94,561 | ) | (30,622 | ) | (15,467 | ) | ||||||
| Borrowings on revolving credit agreement |
98,040 | — | — | |||||||||
| Payments on revolving line of credit agreement |
(21,500 | ) | — | — | ||||||||
| Payments of deferred loan costs |
(1,081 | ) | — | (30 | ) | |||||||
| Purchase of treasury shares |
— | (206 | ) | — | ||||||||
| Cash contribution from Capital Southwest |
13,000 | — | — | |||||||||
| Proceeds from stock option activity |
96 | — | — | |||||||||
| Dividends paid to Capital Southwest |
(300 | ) | (8,294 | ) | (8,651 | ) | ||||||
|
|
|
|
|
|
|
|||||||
| Net cash provided by (used in) financing activities |
74,694 | (26,893 | ) | 13,069 | ||||||||
|
|
|
|
|
|
|
|||||||
| Effect of exchange rate changes on cash and equivalents |
(464 | ) | (913 | ) | (704 | ) | ||||||
|
|
|
|
|
|
|
|||||||
| Net change in cash and cash equivalents |
5,539 | 5,037 | (5,948 | ) | ||||||||
| Cash and cash equivalents, beginning of period |
20,448 | 15,411 | 21,359 | |||||||||
|
|
|
|
|
|
|
|||||||
| Cash and cash equivalents, end of period |
$ | 25,987 | $ | 20,448 | $ | 15,411 | ||||||
|
|
|
|
|
|
|
|||||||
| Supplemental non-cash disclosure: |
||||||||||||
| Cash paid during the year for interest |
$ | 3,074 | $ | 1,053 | $ | 742 | ||||||
| Cash paid during the year for income taxes |
18,298 | 16,721 | 12,781 | |||||||||
| Pension plan assets contributed by Capital Southwest |
10,357 | — | — | |||||||||
See accompanying notes to consolidated financial statements.
49
Table of Contents
CSW INDUSTRIALS, INC
NOTES TO CONSOLIDATED FINANCIAL STATEMENTS
| 1. | ORGANIZATION AND OPERATIONS AND SUMMARY OF SIGNIFICANT ACCOUNTING POLICIES |
CSW Industrials, Inc. (“CSWI,” the “Company,” “we,” “our” or “us”) is a diversified industrial growth company with well-established, scalable platforms and domain expertise across three segments: Industrial Products; Coatings, Sealants & Adhesives; and Specialty Chemicals. Our broad portfolio of leading products provides performance optimizing solutions to our customers. Our products include mechanical products for heating, ventilating and air conditioning (“HVAC”) and refrigeration applications, coatings and sealants and high performance specialty lubricants. Drawing on our innovative and proven technologies, we seek to deliver solutions to our professional customers that require superior performance and reliability. Our diverse product portfolio includes more than 100 highly respected industrial brands including RectorSeal No. 5 ™ thread sealants, KOPR KOTE™ anti-seize lubricants, Safe-T-Switch® condensate overflow shutoff devices, KATS® coatings, Air Sentry® breathers, and RailPlex® tank car coatings. Additionally, we recently acquired Deacon® high temperature sealants and AC Leak Freeze® to stop refrigerant leaks. Our products are well known in the specific industries we serve and have a reputation for high quality and reliability. Markets that we serve include HVAC, industrial, rail, plumbing, architecturally-specified building products, energy, mining, and other general industrial markets.
The Share Distribution – On December 2, 2014, Capital Southwest Corporation (“Capital Southwest”) announced its plan to spin-off certain of its industrial products, coatings, sealants and adhesives and specialty chemicals businesses by means of a distribution of the outstanding shares of common stock of CSWI on a pro rata basis to holders of Capital Southwest common stock (the “Share Distribution”). The Share Distribution occurred on September 30, 2015, and CSWI became an independent, publicly traded company. Prior to the Share Distribution, Capital Southwest contributed to CSWI all of the outstanding capital stock of The RectorSeal Corporation (“RectorSeal”), The Whitmore Manufacturing Company (“Whitmore”), Jet-Lube, Inc. (“Jet-Lube”), Strathmore Holdings, LLC. (“Strathmore”), Balco, Inc. (“Balco”), Smoke Guard, Inc. (“Smoke Guard”) and CapStar Holdings Corporation (“CapStar”), $13.0 million in cash and pension assets of $10.4 million (CSWI assumed both the pension plan assets and obligations associated with the defined benefit pension plan), and net of $0.3 million in equity issuance costs. The following is a brief description of each business:
| • | RectorSeal formulates and manufactures specialty chemical products including pipe thread sealants, firestop sealants, plastic solvent cements and other formulations. RectorSeal also makes specialty tools for tradesmen and innovative systems for containing flames and smoke from building fires. |
| • | Whitmore manufactures high performance, specialty lubricants for heavy equipment used in surface mining, railroad and other industries. Whitmore also manufactures lubrication equipment, specifically for rail applications, and lubrication-centric reliability solutions for a wide variety of industries, and produces water-based coatings for the automotive and primary metals industries. |
| • | Jet-Lube is a world leader in anti-seize compounds, thread sealants and specialty lubrication products and greases for the energy industry. |
| • | Strathmore is engaged in the manufacturing of paint for sale to industrial clients and is a leading manufacturer of specialized industrial coating products including urethanes, epoxies, acrylics and alkyds. |
| • | Balco is engaged in the fabrication of aluminum and plastic extrusions and other materials related to safety, slip resistance and emergency egress. |
| • | Smoke Guard manufactures certified custom safety products for the commercial construction market and other markets requiring smoke and fire protection. |
50
Table of Contents
CSW INDUSTRIALS, INC
NOTES TO CONSOLIDATED FINANCIAL STATEMENTS
Basis of Presentation – CSWI began operations on September 30, 2015 as a result of the Share Distribution. With the exception of cash funded at inception and the contributed capital stock of the businesses discussed above, we did not own any material assets prior to the Share Distribution. The historical financial position, results of operations and cash flows included in this Annual Report on Form 10-K for the fiscal year ended March 31, 2016 (“Annual Report”) represent the consolidated financial statements of the businesses discussed above. As these businesses were under common control of Capital Southwest for all periods prior to September 30, 2015, the financial statements have been consolidated for all historical periods and equity accounts presented in the balance sheet as of March 31, 2015 represent the combined equity accounts of these businesses. Equity accounts presented in the balance sheet as of March 31, 2016 represent the equity of CSWI. The consolidated financial statements have been prepared on a standalone basis and are derived from the underlying accounting records of the underlying businesses in conformity with United States (“U.S.”) generally accepted accounting principles (“GAAP”).
The consolidated financial statements include all revenues, costs, assets and liabilities directly attributable to the businesses discussed above. However, the consolidated financial statements for periods prior to the Share Distribution may not include all of the expenses that would have been incurred had the businesses been operating as separate publicly-traded (“standalone”) companies during those periods and may not reflect the consolidated results of operations, financial position and cash flows as a standalone company during all periods presented. All significant intercompany balances and transactions have been eliminated in consolidation.
Certain prior period balances have been reclassified to conform to current period presentation with no effect on previously reported total assets, equity, net income or cash flows from operations.
Use of Estimates – The process of preparing financial statements in conformity with U.S. GAAP requires us to make estimates and assumptions that affect reported amounts of certain assets, liabilities, revenues and expenses. We believe our estimates and assumptions are reasonable; however, actual results may differ materially from such estimates. The most significant estimates and assumptions are used in determining:
| • | Timing and amount of revenue recognition; |
| • | Deferred taxes and tax reserves; |
| • | Pension benefits; and |
| • | Valuation of goodwill and indefinite-lived intangible assets. |
Cash and Cash Equivalents – We consider all highly liquid instruments purchased with original maturities of three months or less and money market accounts to be cash equivalents. We maintain our cash and cash equivalents at financial institutions for which the combined account balances in individual institutions may exceed Federal Deposit Insurance Corporation (“FDIC”) insurance coverage and, as a result, there is a concentration of credit risk related to amounts on deposit in excess of FDIC insurance coverage. We had deposits in domestic banks of $17.6 million and $10.3 million, of which $15.2 million and $8.3 million, at March 31, 2016 and 2015 respectively, were in excess of FDIC limits.
Cash and cash equivalent balances of $8.4 million and $10.1 million are held in foreign currencies in foreign banks at March 31, 2016 and 2015, respectively, of which $5.0 million and $3.0 million exceeded insurance limits at March 31, 2016 and 2015, respectively.
Restricted Cash – Restricted cash includes compensating cash balances related to certain credit facilities and cash held in escrowrelated to real estate sales.
51
Table of Contents
CSW INDUSTRIALS, INC
NOTES TO CONSOLIDATED FINANCIAL STATEMENTS
Bank Time Deposits – Bank time deposits include investments with maturities of over three months that are redeemable within one year of the fiscal year end without significant penalty. Our bank time deposits of $13.3 million and $9.2 million as of March 31, 2016 and 2015, respectively, are certificates of deposit. Of the $13.3 million and $9.2 million of bank time deposits held at March 31, 2016 and 2015, respectively, $10.4 million and $6.5 million, respectively, are fully insured by the province of Alberta, Canada or the Financial Services Compensation Scheme (U.K.).
Allowance for Doubtful Accounts – We estimate a bad debt reserve under the allowance method. Using payment history in light of current economic conditions, management examines the status of customer accounts on the aged accounts receivable report. With this information, management estimates an appropriate allowance for doubtful accounts. Accounts receivable are written off when it is determined that the receivable will not be collected.
Inventories and Related Reserves – Inventories are stated at the lower of cost or market and include raw materials, supplies, direct labor, and manufacturing overhead. Cost is determined using the last-in, first-out (“LIFO”) method for valuing inventories at our primary domestic operations. Our foreign subsidiaries use either the first-in, first out method or the weighted average cost method to value inventory. Foreign inventories represent approximately 8% and 10% of total inventories as of March 31, 2016 and March 31, 2015, respectively.
Reserves are provided for slow-moving or excess and obsolete inventory based on the difference between the cost of the inventory and its net realizable value and by reviewing quantities on hand in comparison to historical and expected future usage. In estimating the reserve for excess or slow moving inventory, management considers factors such as product aging, current and future customer demand and market conditions.
Property, Plant and Equipment – Property, plant and equipment are stated at cost and depreciated using the straight-line method over the estimated useful lives of the individual assets. When property, plant and equipment are retired or otherwise disposed of, the related cost and accumulated depreciation are removed from the accounts, and the resulting gain or loss is included in income from operations for the period. Generally, the estimated useful lives of assets are:
| Land improvements |
5 to 40 years | |||
| Buildings and improvements |
7 to 40 years | |||
| Plant, office and lab equipment |
5 to 40 years |
We review property, plant and equipment for impairment whenever events or changes in circumstances indicate the carrying amount of an asset may not be recoverable.
Repairs and maintenance costs are expensed as incurred, and significant improvements that either extend the useful life or increase the capacity or efficiency of property and equipment are capitalized and depreciated.
Valuation of Goodwill – Goodwill represents the excess of the aggregate purchase price over the fair value of identifiable net assets acquired in a business combination. We test goodwill at least annually for impairment. We first assess qualitative factors to determine whether it is more likely than not that the fair value of a reporting unit is less than its carrying amount as a basis for determining whether it is necessary to perform the two-step goodwill impairment test. Qualitative assessments use an evaluation of events and circumstances such as macroeconomic conditions, industry and market considerations, cost factors, financial performance factors, entity specific events, and changes in carrying value to determine whether it is more likely than not that the fair value of the reporting unit is less than its carrying amount, including goodwill.
52
Table of Contents
CSW INDUSTRIALS, INC
NOTES TO CONSOLIDATED FINANCIAL STATEMENTS
If a reporting unit fails the qualitative assessment, then valuation models and other relevant data are used to estimate the reporting unit’s fair value. The valuation models require the input of subjective assumptions. We use an income approach for impairment testing of goodwill and indefinite lived intangible assets, using a discounted cash flow method. Estimates of future revenue and expense are made for five years, growth estimates are made to calculate terminal value, and a discount rate is used that approximates our weighted average cost of capital. We perform qualitative or quantitative assessments to test asset carrying values for impairment at January 31, which is the annual impairment testing date. No impairment loss was recognized as a result of the impairment tests for the fiscal years ended March 31, 2016, 2015 or 2014.
Intangible Assets – We have intangible assets consisting of patents, trademarks, customer lists and non-compete agreements. Definite-lived intangible assets are assessed for impairment whenever events or changes in circumstances indicate the carrying amount may not be recoverable. In addition, we have other trademarks and license agreements that are considered to have indefinite lives. We review indefinite-lived intangible assets at least annually for impairment, or whenever events or changes in circumstances indicate that the carrying amount may not be recoverable. Significant assumptions used in the impairment test include the discount rate, royalty rate, future projections and terminal value growth rate. These inputs are considered non-recurring level three inputs within the fair value hierarchy. An impairment loss would be recognized when estimated future cash flows are less than their carrying amount. We recorded an impairment of intangible assets of $0, $0.7 million and $1.3 million for the fiscal years ended March 31, 2016, 2015 and 2014, respectively.
Property Held for Investment – Capstar holds and manages certain excess non-operating properties. Properties are disposed of as opportunities arise to maximize value. Properties are valued at lower of cost or market.
Deferred Loan Costs – Deferred loan costs, which are reported in other assets and consist of fees and other expenses associated with debt financing, are amortized over the term of the associated debt using the effective interest method.
Fair Values of Financial Instruments – Our financial instruments are presented at fair value in our consolidated balance sheets, with the exception of our long-term debt. Fair value is defined as the price that would be received to sell an asset or paid to transfer a liability in an orderly transaction between market participants at the measurement date. Where available, fair value is based on observable market prices or parameters or derived from such prices or parameters. Where observable prices or inputs are not available, valuation models may be applied.
Assets and liabilities recorded at fair value in our consolidated balance sheets are categorized based upon the level of judgment associated with the inputs used to measure their fair values. Hierarchical levels, as defined by Accounting Standards Codification (“ASC”) 820, “Fair Value Measurements and Disclosures,” are directly related to the amount of subjectivity associated with the inputs to fair valuation of these assets and liabilities. An asset or a liability’s categorization within the fair value hierarchy is based on the lowest level of significant input to its valuation. Hierarchical levels are as follows:
Level I – Inputs are unadjusted, quoted prices in active markets for identical assets or liabilities at the measurement date.
Level II – Inputs (other than quoted prices included in Level I) are either directly or indirectly observable for the asset or liability through correlation with market data at the measurement date and for the duration of the instrument’s anticipated life.
53
Table of Contents
CSW INDUSTRIALS, INC
NOTES TO CONSOLIDATED FINANCIAL STATEMENTS
Level III – Inputs reflect management’s best estimate of what market participants would use in pricing the asset or liability at the measurement date. Consideration is given to the risk inherent in the valuation technique and the risk inherent in the inputs to the model.
Recurring fair value measurements are limited to investments in derivative instruments and reserves for contingent consideration. The fair value measurements of our derivative instruments are determined using models that maximize the use of the observable market inputs including interest rate curves and both forward and spot prices for currencies, and are classified as Level II under the fair value hierarchy. The fair values of our derivative instruments are included in Note 9. The fair value measurements of our reserves for contingent consideration are classified as Level III and are generally determined using a weighted average probability model based primarily on projected net revenues, with the following exception: contingent consideration related to the acquisition of Strathmore utilized the Monte Carlo simulation methodology and employed 200,000 trials using a risk neutral Geometric Brownian Motion methodology. The volatility used in the Monte Carlo analysis was based on the observed equity volatility of comparable companies, and the risk free discount rate was the U.S. treasury rate corresponding to the respective term of each earn-out. The most significant factor in the valuation is Strathmore’s projected earnings before interest, taxes, depreciation and amortization.
Derivative Instruments and Hedge Accounting – We do not use derivative instruments for trading or speculative purposes. We enter into interest rate swap agreements for the purpose of hedging our cash flow exposure to floating interest rates on certain portions of our debt. All derivative instruments are recognized on the balance sheet at their fair values. Changes in the fair value of a designated interest rate swap are recorded in other comprehensive loss until earnings are affected by the underlying hedged item. Any ineffective portion of the gain or loss is immediately recognized in earnings. Upon settlement, realized gains and losses are recognized in interest expense in the consolidated statements of income. See Note 9 for further discussion of interest rate swaps.
We discontinue hedge accounting when (1) we deem the hedge to be ineffective and determine that the designation of the derivative as a hedging instrument is no longer appropriate; (2) the derivative matures, terminates or is sold; or (3) occurrence of the contracted or committed transaction is no longer probable or will not occur in the originally expected period. When hedge accounting is discontinued and the derivative remains outstanding, we carry the derivative at its estimated fair value on the balance sheet, recognizing changes in the fair value in current period earnings. If a cash flow hedge becomes ineffective, any deferred gains or losses remain in accumulated other comprehensive loss until the underlying hedged item is recognized. If it becomes probable that a hedged forecasted transaction will not occur, deferred gains or losses on the hedging instrument are recognized in earnings immediately.
We are exposed to risk from credit-related losses resulting from nonperformance by counterparties to our financial instruments. We perform credit evaluations of our counterparties under forward exchange contracts and interest rate swap agreements and expect all counterparties to meet their obligations. If necessary, we would adjust the values of our derivative contracts for our or our counterparties’ credit risk.
Pension Obligations – Determination of pension benefits obligations is based on estimates made by management in consultation with independent actuaries. Inherent in these valuations are assumptions including discount rates, expected rates of return on plan assets, retirement rates, mortality rates and rates of compensation increase and other factors all of which are reviewed annually and updated if necessary. Current market conditions, including changes in rates of return, interest rates and medical inflation rates, are considered in selecting these assumptions.
| • | Discount rates are estimated using high quality corporate bond yields with a duration matching the expected benefit payments. The discount rate is obtained from a universe of Aa-rated non-callable |
54
Table of Contents
CSW INDUSTRIALS, INC
NOTES TO CONSOLIDATED FINANCIAL STATEMENTS
| bonds across the full maturity spectrum to establish a weighted average discount rate. Our discount rate assumptions are impacted by changes in general economic and market conditions that affect interest rates on long-term high-quality debt securities, as well as the duration of our plans’ liabilities. |
| • | The expected rates of return on plan assets are derived from reviews of asset allocation strategies, expected future experience for trust asset returns, risks and other factors adjusted for our specific investment strategy. These rates are impacted by changes in general market conditions, but because they are long-term in nature, short-term market changes do not significantly impact the rates. Changes to our target asset allocation also impact these rates. |
Actuarial gains and losses and prior service costs are recognized in accumulated other comprehensive loss as they arise, and we amortize these costs into net pension expense over the remaining expected service period.
We used a measurement date of March 31 for all periods presented.
Revenue Recognition – We generally recognize revenue upon shipment of product, at which time title and risk of loss passes to the customer. Additionally, we require that all of the following circumstances are satisfied: a) persuasive evidence of an arrangement exists, b) price is fixed or determinable, c) collectability is reasonably assured and d) delivery has occurred or services have been rendered. Net revenues represent gross revenues invoiced to customers less certain related charges for contractual discounts or rebates. Discounts provided to customers at the point of sale are recognized as reductions in revenue as the products are sold. Rebate amounts are recorded as reduction of revenue on a monthly basis using estimates of customer participation and performance. Freight charges billed to customers are included in net revenues and the related shipping costs are included in cost of revenues in our consolidated statements of income.
Research and Development – Research and development costs are expensed as incurred. Costs incurred for research and development primarily include salaries and benefits and consumable supplies, as well as rent, professional fees, utilities and the depreciation of property and equipment used in research and development activities. Research and development costs included in selling, general and administrative expense were $4.5 million, $5.7 million and $5.5 million for the fiscal years ended March 31, 2016, 2015 and 2014, respectively.
Share-based Compensation – Share-based compensation is measured at the grant-date fair value. The exercise price of stock option awards and the fair value of restricted share awards are set at the closing price of our common stock on the NASDAQ Stock Market, LLC on the date of grant, which is the date such grants are authorized by our Board of Directors. The fair value of performance-based restricted share awards is determined using a Monte Carlo simulation model incorporating all possible outcomes against a defined peer group. The fair value of share-based payment arrangements is amortized on a straight-line basis to compensation expense over the period in which the restrictions lapse based on the expected number of shares that will vest. To cover the exercise of options and vesting of restricted shares, we generally issue new shares from our authorized but unissued share pool, although we may instead issue treasury shares in certain circumstances.
Income Taxes, Deferred Taxes, Tax Valuation Allowances and Tax Reserves – We apply the liability method in accounting and reporting for income taxes. Under the liability approach, deferred tax assets and liabilities are determined based upon the difference between the financial statement carrying amounts and the tax basis of assets and liabilities that will result in taxable or deductible amounts in the future based on enacted tax rates expected to be in effect when these differences are expected to reverse. The effect on deferred tax assets and liabilities resulting from a change in tax rates is recognized in the period that includes the enactment date. The deferred income tax assets are adjusted by a valuation allowance, if necessary, to recognize future tax benefits only to the extent, based on available evidence, that it is more likely than not to be realized. This analysis is
55
Table of Contents
CSW INDUSTRIALS, INC
NOTES TO CONSOLIDATED FINANCIAL STATEMENTS
performed on a jurisdictional basis and reflects our ability to utilize these deferred tax assets through a review of past, current and estimated future taxable income in addition to the establishment of viable tax strategies that will result in the utilization of the deferred assets. We recognize income tax related interest and penalties, if any, as a component of income tax expense.
Unremitted Earnings – We consider the earnings of non-U.S. subsidiaries to be indefinitely invested outside the United States on the basis of estimates that future domestic cash generation will be sufficient to meet future domestic cash needs and our specific plans for reinvestment of those subsidiary earnings. Should we decide to repatriate foreign earnings, a deferred tax liability will be recorded and our income tax provision will be adjusted in the period we determined that the earnings will no longer be indefinitely invested outside the U.S. We provide deferred taxes for the temporary differences associated with our investment in foreign subsidiaries that have a financial reporting basis that exceeds tax basis, unless we can assert permanent reinvestment in foreign jurisdictions. Financial reporting basis and tax basis differences in investments in foreign subsidiaries consist of both unremitted earnings and losses, as well as foreign currency translation adjustments.
Uncertain Tax Positions – We establish income tax liabilities to remove some or all of the income tax benefit of any of our income tax positions based upon one of the following: (1) the tax position is not “more likely than not” to be sustained, (2) the tax position is “more likely than not” to be sustained, but for a lesser amount or (3) the tax position is “more likely than not” to be sustained, but not in the financial period in which the tax position was originally taken. The amount of income taxes we pay is subject to ongoing audits by federal, state, and foreign taxing authorities, which often result in proposed assessments. We establish reserves for open tax years for uncertain tax positions that may be subject to challenge by various taxing authorities. The consolidated tax provision and related accruals include the impact of such reasonably estimable losses and related interest and penalties as deemed appropriate.
We recognize the tax benefit from an uncertain tax position only if it is more likely than not that the tax position will be sustained on examination by the taxing authorities. The determination is based on the technical merits of the position and presumes that each uncertain tax position will be examined by the relevant taxing authority that has full knowledge of all relevant information. The tax benefits recognized in the financial statements from such a position are measured based on the largest benefit that has a greater than 50% likelihood of being realized upon ultimate settlement. For the fiscal year ended March 31, 2016, we recognized an uncertain tax position related to state taxes in the amount of $0.9 million, and we recognized $0.4 million in interest and penalties in income tax expense. We did not recognize any uncertain tax positions or interest and penalties in income tax expense for the fiscal years ended March 31, 2015 or 2014.
Earnings Per Share – We use the two-class method of calculating earnings per share, which determines earnings per share for each class of common stock and participating security as if all earnings of the period had been distributed. As the holders of restricted stock are entitled to vote and receive dividends during the restriction period, unvested shares of restricted stock qualify as participating securities and, accordingly, are included in the basic computation of earnings per share. Our unvested restricted shares participate on an equal basis with common shares; therefore, there is no difference in undistributed earnings allocated to each participating security. Accordingly, the presentation in Note 8 is prepared on a combined basis and is presented as earnings per common share. Diluted earnings per share is based on the weighted average number of shares as determined for basic earnings per share plus shares potentially issuable in conjunction with stock options.
Foreign Currency Translation – Assets and liabilities of our foreign subsidiaries are translated to U.S. dollars at exchange rates prevailing at the balance sheet date, while income and expenses are translated at
56
Table of Contents
CSW INDUSTRIALS, INC
NOTES TO CONSOLIDATED FINANCIAL STATEMENTS
average rates for each month. Translation gains and losses are reported as a component of accumulated other comprehensive loss. Transactional currency gains and losses arising from transactions in currencies other than our sites’ functional currencies are included in our consolidated statements of income.
Transaction and translation gains and losses arising from intercompany balances are reported as a component of accumulated other comprehensive loss when the underlying transaction stems from a long-term equity investment or from debt designated as not due in the foreseeable future. Otherwise, we recognize transaction gains and losses arising from intercompany transactions as a component of income.
Segment Reporting – We conduct our operations through three business segments based on type of product and how we manage the business. The products for our segments are distributed both domestically and internationally. For decision-making purposes, our Chief Executive Officer and other members of senior executive management use financial information generated and reported at the reportable segment level. We evaluate segment performance and allocate resources based on each reportable segment’s operating income. Our reportable segments are as follows:
| • | Industrial Products includes specialty mechanical products, fire and smoke protection products, architecturally-specified building products and storage, filtration and application equipment for use with our specialty chemicals and other products for general industrial application. |
| • | Coatings, Sealants & Adhesives is comprised of coatings and penetrants, pipe thread sealants, firestopping sealants and caulks and adhesives/solvent cements. |
| • | Specialty Chemicals includes lubricants and greases, drilling compounds, anti-seize compounds, chemical formulations and degreasers and cleaners. |
Intersegment sales and transfers are recorded at cost plus a profit margin, with the sales and related margin on such sales eliminated in consolidation. We do not allocate interest expense, interest income or other (expense) income, net to our segments. Our corporate headquarters does not constitute a separate segment. The Eliminations and Other segment information is included to reconcile segment data to the consolidated financial statements and includes assets and expenses primarily related to CapStar and corporate functions.
Accounting Developments
In May 2014, the Financial Accounting Standards Board (“FASB”) issued Accounting Standards Update (“ASU”) No. 2014-09, “Revenue from Contracts with Customers (Topic 606),” which was subsequently amended by ASU No. 2016-08, “Revenue from Contracts with Customers (Topic 606): Principal versus Agent Considerations (Reporting Revenue Gross versus Net),” and ASU No. 2016-10, “Revenue from Contracts with Customers (Topic 606): Identifying Performance Obligations and Licensing.” ASU No. 2014-09, as amended, supersedes the revenue recognition requirements in “Revenue Recognition (Topic 605).” The standard is principle-based and provides a five-step model to determine when and how revenue is recognized. The core principle is that a company should recognize revenue when it transfers promised goods or services to customers in an amount that reflects the consideration to which the company expects to be entitled in exchange for those goods or services. There are also expanded disclosure requirements in this ASU. In July 2015, the FASB voted to delay the effective date of ASU 2014-09 by one year. As a result, public entities will apply the new standard for annual reporting periods beginning after December 15, 2017, including interim periods within those reporting periods. Early adoption as of the original public entity effective date is permitted. We are currently evaluating the impact of ASU No. 2014-09 on our consolidated financial condition and results of operations.
In April 2015, the FASB issued ASU No. 2015-03, “Interest – Imputation of Interest (Subtopic 835-30): Simplifying the Presentation of Debt Issuance Costs.” This ASU requires debt issuance costs be presented in the
57
Table of Contents
CSW INDUSTRIALS, INC
NOTES TO CONSOLIDATED FINANCIAL STATEMENTS
balance sheet as a direct deduction from the carrying value of the associated debt liability. Amortization of those costs should be reported as interest expense. This ASU is effective for financial statements issued for annual and interim periods beginning after December 15, 2015, and early adoption is permitted for financial statements that have not been previously issued. The new guidance should be applied on a retrospective basis for each period presented in the balance sheet. We do not believe that adoption of this ASU will have a material impact on our consolidated financial condition and results of operations.
In April 2015, the FASB issued ASU No. 2015-05, “Intangibles – Goodwill and Other – Internal-Use Software (Subtopic 350-40): Customer’s Accounting for Fees Paid in a Cloud Computing Arrangement.” This ASU provides guidance to customers about whether a cloud computing arrangement includes software. If a cloud computing arrangement includes a software license, the customer should account for the software license element of the arrangement consistent with the acquisition of other software licenses. If a cloud computing arrangement does not include a software license, the customer should account for the arrangement as a service contract. The new guidance does not change the accounting for a customer’s accounting for service contracts. This ASU is effective for annual periods, including interim periods within those annual periods, beginning after December 15, 2015, and early adoption is permitted. We adopted the amendments of this ASU for the year ended March 31, 2016, and it did not have a material impact on our consolidated financial condition and results of operations.
In September 2015, the FASB issued ASU No. 2015-16, “Simplifying the Accounting for Measurement Period Adjustments,” which eliminates the requirement to retrospectively account for measurement period adjustments related to a business combination. This ASU is effective for annual periods, including interim periods within those annual periods, beginning after December 15, 2015, and is to be applied prospectively. Early adoption is permitted. We adopted the amendments of this ASU for the year ended March 31, 2016, and it did not have an impact on our consolidated financial condition and results of operations.
In November 2015, the FASB issued ASU No. 2015-17, “Balance Sheet Classification of Deferred Taxes,” which requires that deferred tax liabilities and assets be classified as noncurrent in a classified statement of financial position. This ASU is effective for annual periods, including interim periods within those annual periods, beginning after December 15, 2016, and may be applied prospectively or retrospectively. Early adoption is permitted. We retrospectively adopted the amendments of this ASU as of March 31, 2016, and as a result, $2.7 million of current deferred tax assets that were included in prepaid expenses and other current assets at March 31, 2015 have been reclassified to noncurrent deferred tax assets, which are included in other assets in the consolidated balance sheet.
In February 2016, the FASB issued ASU No. 2016-02, “Leases (Topic 842),” to increase transparency and comparability among organizations by recognizing lease assets and lease liabilities on the balance sheet and disclosing key information about leasing arrangements. A lessee should recognize in the statement of financial position a liability to make lease payments (the lease liability) and a right-of-use asset representing its right to use the underlying asset for the lease term. The recognition, measurement, and presentation of expenses and cash flows arising from a lease by a lessee have not significantly changed from previous U.S. GAAP. This ASU is effective for annual periods, including interim periods within those annual periods, beginning after December 15, 2018. Modified retrospective application is permitted with certain practical expedients. Early adoption is permitted. We are currently evaluating the impact of ASU No. 2016-02 on our consolidated financial condition and results of operations.
In March 2016, the FASB issued ASU No. 2016-09, “Compensation – Stock Compensation (Topic 718),” which simplifies the accounting for share-based compensation. The areas for simplification in this ASU involve several aspects of the accounting for share-based payment transactions, including the income tax consequences,
58
Table of Contents
CSW INDUSTRIALS, INC
NOTES TO CONSOLIDATED FINANCIAL STATEMENTS
classification of awards as either equity or liabilities, and classification on the statement of cash flows. This ASU is effective for annual periods, including interim periods within those annual periods, beginning after December 15, 2016. Early adoption is permitted. We are currently evaluating the impact of ASU No. 2016-09 on our consolidated financial condition and results of operations.
| 2. | ACQUISITIONS |
AC Leak Freeze
On December 16, 2015, we acquired substantially all of the assets of AC Leak FreezeTM (“Leak Freeze”), based in Baltimore, Maryland for $16.3 million in cash funded by borrowings under CSWI’s Revolving Credit Facility (discussed in Note 7). Leak Freeze is a leading manufacturer of original equipment manufacturer-approved air conditioning and refrigerant leak repair solutions. The excess of the purchase price over the fair value of the identifiable assets acquired was $5.7 million and was allocated to goodwill, which will be deductible for income tax purposes. Goodwill represents the value expected to be obtained from a more extensive specialty chemical product portfolio for the HVAC market and leveraging our larger distributor network. The allocation of the fair value of the assets acquired included customer lists, trademarks and trade names and a non-compete agreement of $8.1 million, $1.4 million and $0.2 million, respectively, as well as inventory in the amount of $0.7 million. Customer lists and the non-compete agreement are being amortized over 10 years and five years, respectively, while trademarks and trade names and goodwill are not being amortized. Leak Freeze activity has been included in our Specialty Chemicals segment since the acquisition date. No pro forma information has been provided due to immateriality.
Deacon Industries, Inc.
On October 1, 2015, we acquired substantially all of the assets of Deacon Industries, Inc. (“Deacon”), based in Washington, Pennsylvania for $12.6 million. The acquisition was funded by $11.0 million of borrowings under the RectorSeal Line of Credit and $1.1 million cash on hand. The remaining $0.5 million of the purchase price represents a payment contingent upon the achievement of certain performance metrics during the fiscal year ending March 31, 2017. Deacon is a leading manufacturer of high temperature sealants and injectable packings with applications in a variety of industrial end markets, both on an emergency and maintenance basis. The excess of the purchase price over the fair value of the identifiable assets acquired was $4.1 million and was allocated to goodwill, which will be deductible for income tax purposes. Goodwill represents the value expected to be obtained from a more extensive sealant and injectable packing product portfolio and leveraging our larger distributor network. The allocation of the fair value of the assets acquired included customer lists, know-how, trademarks and trade names and a non-compete agreement of $2.9 million, $2.6 million, $1.1 million, and $0.1 million, respectively, as well as property, plant, and equipment and inventory in the amounts of $0.9 million and $0.5 million, respectively. Customer lists, know-how and the non-compete agreement are being amortized over 15 years, 10 years and five years, respectively, while trademarks and trade names and goodwill are not being amortized. Deacon activity has been included in our Coatings, Sealants & Adhesives segment since the acquisition date. No pro forma information has been provided due to immateriality.
Strathmore Products, Inc.
Effective April 1, 2015, we acquired the assets of Strathmore, a leading manufacturer of specialized industrial coating products including urethanes, epoxies, acrylics and alkyds, for $68.8 million, plus up to an additional $16.5 million within a prescribed period of time following March 31, 2017, depending on the achievement of certain performance metrics during the fiscal years ending March 31, 2016 and 2017. A liability
59
Table of Contents
CSW INDUSTRIALS, INC
NOTES TO CONSOLIDATED FINANCIAL STATEMENTS
of $2.0 million was recorded at acquisition based on the projected achievement of the performance metrics as estimated using the Monte Carlo simulation methodology. This liability was reduced to $0 during the quarter ended December 31, 2015 based on expected achievement of performance metrics. The acquisition was funded from borrowings of $70.0 million (as discussed in Note 7). Transaction costs incurred in connection with the acquisition were $2.7 million (including $0.2 million incurred during the fiscal year ended March 31, 2015) and are reported in selling, general and administrative expense in the accompanying consolidated statements of income. The preliminary excess of the purchase price over the fair value of the identifiable assets acquired was $15.1 million and was allocated to goodwill, which will be deductible for income tax purposes. Goodwill represents the value expected to be achieved from an increased market presence in the industrial coatings sector and a platform from which to grow through end-market and geographic expansion. During the quarter ended December 31, 2015, a measurement period adjustment was recorded to recognize $2.7 million in prepaid compensation cost, which reduced the preliminary estimate of goodwill to $12.4 million. Prepaid compensation is being amortized ratably to expense over the vesting period, which ends March 31, 2018. The preliminary fair value of the assets acquired included trade names and trademarks, customer relationships and non-compete agreements of $14.9 million, $27.4 million and $0.4 million, respectively. During the quarter ended March 31, 2016, we finalized our allocation of the purchase price and recorded a measurement period adjustment, which resulted in a change in the fair values of customer relationships and trade names and trademarks to $23.7 million and $13.6 million, respectively, which resulted in an increase of $5.0 million to goodwill. Customer relationships and the non-compete agreements are being amortized over 15 years and five years, respectively, while trade names, trademarks and goodwill are not being amortized.
The following table summarizes the fair values of assets acquired and liabilities assumed (in thousands):
| Accounts receivable |
$ | 4,902 | ||
| Inventory |
8,447 | |||
| Property, plant and equipment |
3,761 | |||
| Intangible assets |
37,650 | |||
| Other, net |
2,941 | |||
| Current liabilities |
(4,297 | ) | ||
|
|
|
|||
| Net tangible and intangible assets |
53,404 | |||
| Goodwill |
17,395 | |||
|
|
|
|||
| Purchase price |
$ | 70,799 | ||
|
|
|
Strathmore has been included in the Coatings, Sealants & Adhesives segment since its effective acquisition date. Net revenue attributable to Strathmore since the date of acquisition was $52.9 million. Pro forma information regarding Strathmore is provided below (in thousands, except per share amounts):
| Fiscal Years Ended March 31, | ||||||||
| 2016 | 2015 | |||||||
| Revenues, net |
$ | 319,831 | $ | 325,025 | ||||
| Operating income |
47,486 | 50,443 | ||||||
| Net income |
25,471 | 32,012 | ||||||
| Earnings per share – Basic |
1.63 | 2.05 | ||||||
| Earnings per share – Diluted |
1.62 | 2.05 | ||||||
SureSeal Manufacturing
On January 2, 2015, we acquired selected assets and the SureSeal brand from SureSeal Manufacturing in Tacoma, Washington, a producer and distributor of waterless floor drain trap seals for an initial purchase price of
60
Table of Contents
CSW INDUSTRIALS, INC
NOTES TO CONSOLIDATED FINANCIAL STATEMENTS
$8.1 million. Of the total purchase price, $3.2 million has been paid using $2.9 million funded from borrowings and $0.3 million from available cash. The remaining purchase price is contingent upon SureSeal achieving certain performance metrics during the three- and six-year periods following the acquisition, and is based on a multiple of the lesser of gross margin or 67% of net sales during the final 12 months of the measurement period. A liability of $4.9 million was originally recorded based on the achievement of the performance metrics as estimated using a weighted average probability model. The excess of the purchase price over the fair value of the identifiable assets acquired was $4.5 million and was allocated to goodwill, which will be deductible for income tax purposes. Goodwill represents the value expected to be obtained from a more extensive product portfolio and leveraging our larger distributor network. The identifiable tangible and intangible assets included customer lists, trademarks and names, patents and a non-compete agreement of $1.8 million, $0.9 million, $0.6 million, and $0.1 million, respectively, as well as equipment of $0.2 million. Patents, customer lists and the non-compete agreement are being amortized over 15 years, 10 years and five years, respectively, while trademarks and goodwill are not being amortized. The SureSeal product line activity has been included in the Industrial Products segment since its acquisition date. No pro forma information has been provided due to immateriality.
Evo-Crete and Polyslab product lines
On August 15, 2014, we acquired the Evo-Crete and Polyslab product lines for $4.5 million from the Evolve Group located in Brisbane, Queensland and formed a new entity, RectorSeal Australia, Pty. Ltd. RectorSeal Australia focuses on the plumbing, HVAC and irrigation markets. Evo-Crete and Polyslab continue to be manufactured in Australia. The purchase was funded from borrowings of $3.0 million with the remainder funded from internal working capital. The excess of the purchase price over the fair value of the identifiable assets acquired was $1.5 million and was allocated to goodwill, which will be deductible for income tax purposes. Goodwill represents the value expected to be obtained from a more extensive HVAC product portfolio, especially in the condensate management niche, and expansion of existing RectorSeal product sales into the Australian market. The fair value of the assets acquired included customer lists, patents, trademarks and a non-compete agreement of $1.2 million, $0.7 million, $0.4 million, and $0.1 million, respectively, as well as property, plant, and equipment in the amount of $0.7 million. Customer lists, patents and the non-compete agreement are being amortized over 15 years, 10 years and five years, respectively, while trademarks and goodwill are not being amortized. The RectorSeal Australia activity has been included in the Industrial Products segment since the acquisition date. No pro forma information has been provided due to immateriality.
Fluid Defense Systems, LLC.
On January 31, 2014, we acquired the assets of Fluid Defense Systems, LLC (“Fluid Defense”), a manufacturer of fully integrated lubricant storage and handling solutions sold under the Oil Safe® brand, for $5.6 million. The purchase was funded from borrowings of $5.0 million with the remainder funded from available cash. The excess of the purchase price over the fair value of the identifiable assets acquired was $1.7 million and was allocated to goodwill, which will be deductible for income tax purposes. Goodwill represents the value expected to be obtained from a more extensive lubrication solution product portfolio and leveraging our larger distributor network. The fair value of the assets acquired included customer lists, trademarks and patents and technology of $1.1 million, $1.0 million and $0.1 million, respectively, as well as working capital and property, plant, and equipment in the amounts of $1.4 million and $0.3 million, respectively. Trademarks, customer lists and patents and technology are being amortized over 20 years, 10 years and five to seven years, respectively, while goodwill is not being amortized. Fluid Defense activity has been included in the Industrial Products segment since the acquisition date. No pro forma information has been provided due to immateriality.
61
Table of Contents
CSW INDUSTRIALS, INC
NOTES TO CONSOLIDATED FINANCIAL STATEMENTS
Resource Conservation Technologies, Inc.
On January 2, 2014, we acquired the assets of Resource Conservation Technologies, Inc. (“RCT”) for $18.5 million to enhance product offerings to the HVAC market. The purchase was funded from borrowings of $18.3 million with the remainder funded from available cash. The excess of the purchase price over the fair value of the identifiable assets acquired was $8.5 million and was allocated to goodwill, which will be deductible for income tax purposes. Goodwill represents the value expected to be obtained from a more extensive HVAC product portfolio and leveraging our larger distributor network. The fair value of the assets acquired included customer lists, patents, trademarks and a non-compete agreement of $5.8 million, $2.3 million, $1.7 million, and $0.1 million, respectively, as well as property, plant, and equipment in the amount of $0.1 million. Customer lists, patents and the non-compete agreement are being amortized over 10 years, five to 16 years and five years, respectively, while trademarks and goodwill are not being amortized. RCT activity has been included in the Industrial Products segment since the acquisition date. No pro forma information has been provided due to immateriality.
| 3. | GOODWILL AND INTANGIBLE ASSETS |
The changes in the carrying amount of goodwill for the fiscal years ended March 31, 2016 and 2015 were as follows (in thousands):
| Industrial Products |
Coatings, Sealants and Adhesives |
Specialty Chemicals |
Total | |||||||||||||
| Balance at April 1, 2014 |
$ | 30,996 | $ | 920 | $ | 3,402 | $ | 35,318 | ||||||||
| Acquisition of SureSeal |
4,502 | — | — | 4,502 | ||||||||||||
| Currency translation and other |
825 | — | — | 825 | ||||||||||||
|
|
|
|
|
|
|
|
|
|||||||||
| Balance at March 31, 2015 |
36,323 | 920 | 3,402 | 40,645 | ||||||||||||
|
|
|
|
|
|
|
|
|
|||||||||
| Acquisition of Strathmore |
— | 17,395 | — | 17,395 | ||||||||||||
| Acquisition of Deacon |
— | 4,105 | — | 4,105 | ||||||||||||
| Acquisition of Leak Freeze |
— | — | 5,741 | 5,741 | ||||||||||||
| Currency translation |
(129 | ) | — | — | (129 | ) | ||||||||||
|
|
|
|
|
|
|
|
|
|||||||||
| Balance at March 31, 2016 |
$ | 36,194 | $ | 22,420 | $ | 9,143 | $ | 67,757 | ||||||||
|
|
|
|
|
|
|
|
|
|||||||||
The following table provided information about out intangible assets for the fiscal years ended March 31, 2016 and 2015 (in thousands, except years):
| March 31, 2016 | March 31, 2015 | |||||||||||||||||||
| Wtd Avg Life (Years) |
Ending Gross Amount |
Accumulated Amortization |
Ending Gross Amount |
Accumulated Amortization |
||||||||||||||||
| Finite-lived intangible assets: |
||||||||||||||||||||
| Patents |
12 | $ | 14,458 | $ | (8,600 | ) | $ | 14,284 | $ | (7,608 | ) | |||||||||
| Customer lists and amortized trademarks |
12 | 71,475 | (17,080 | ) | 37,091 | (11,516 | ) | |||||||||||||
| Non-compete agreements (a) |
5 | 1,310 | (405 | ) | 2,877 | (2,458 | ) | |||||||||||||
| Other |
12 | 3,769 | (354 | ) | 412 | (137 | ) | |||||||||||||
|
|
|
|
|
|
|
|
|
|||||||||||||
| $ | 91,012 | $ | (26,439 | ) | $ | 54,664 | $ | (21,719 | ) | |||||||||||
|
|
|
|
|
|
|
|
|
|||||||||||||
| Trade names and trademarks not being amortized: |
$ | 24,154 | $ | — | $ | 8,052 | $ | — | ||||||||||||
|
|
|
|
|
|
|
|
|
|||||||||||||
62
Table of Contents
CSW INDUSTRIALS, INC
NOTES TO CONSOLIDATED FINANCIAL STATEMENTS
| (a) | During the fiscal year ended March 31, 2016, we wrote off $2.9 million of expired and fully amortized non-compete agreements. |
Amortization expense for the years ended March 31, 2016, 2015 and 2014 was $7.1 million, $4.6 million and $3.9 million, respectively. The following table presents the estimated future amortization of finite-lived intangible assets for the next five fiscal years ending March 31 (in thousands):
| 2017 |
$ | 7,363 | ||
| 2018 |
7,233 | |||
| 2019 |
6,385 | |||
| 2020 |
6,142 | |||
| 2021 |
5,919 |
| 4. | EXECUTIVE COMPENSATION |
On August 28, 2014, the board of directors of Capital Southwest adopted an executive compensation plan consisting of grants of nonqualified stock options, restricted stock and cash incentive awards to executive officers of Capital Southwest. The plan was intended to align the compensation of Capital Southwest’s executive officers with Capital Southwest’s key strategic objective of increasing the market value of Capital Southwest’s shares through a transformative transaction for the benefit of Capital Southwest’s shareholders. Under the plan, Joseph B. Armes, Kelly Tacke, and Bowen S. Diehl, receive an amount equal to 6.0% of the aggregate appreciation in Capital Southwest’s share price from August 28, 2014 (using a base price of $36.16 per share) to the Trigger Event Date (December 29, 2015). Effective immediately with the spin-off of CSWI, both Joseph B. Armes and Kelly Tacke became employees of CSWI and Bowen Diehl remained an employee of Capital Southwest. The initial plan component consists of nonqualified options awarded to purchase a total of 258,000 shares of common stock. The second plan component consists of total awards of 127,000 shares of restricted stock, which have voting rights, but do not have cash dividend rights. The final plan component consists of cash incentive payments awarded to each of Mr. Armes, Ms. Tacke and Mr. Diehl in an amount equal to the excess of each awardee’s allocable portion of the Total Payment Amount over the aggregate value as of the Trigger Event Date of the awardee’s restricted common stock and nonqualified option awards under the plan. The equity based awards vest or become exercisable, as applicable, as follows: (1) 1/3 on the Trigger Event Date; (2) 1/3 on the first anniversary of the Trigger Event Date; and (3) 1/3 on the second anniversary of the Trigger Event Date. Generally, entitlement to such awards is conditioned on the awardee remaining in the employment of the Capital Southwest or its subsidiaries on the vesting date, or in the event the employment of the awardee was transferred to CSWI, continuing employment by CSWI.
On September 8, 2015, the board of directors of Capital Southwest designated the Share Distribution as a transformative transaction for purposes of the executive compensation plan and amended the award agreements granted under the plan to provide for accelerated vesting of the awards held by an executive in the event of a termination of such executive’s service effected by the executive for good reason, by the employer without cause, or as a result of the disability or death of the executive. As a result of the Share Distribution completed on September 30, 2015, the Trigger Event Date was determined to be December 29, 2015.
As of December 29, 2015, the cash component of the executive compensation plan was calculated based on the volume weighted average price of Capital Southwest and CSWI common stock for the 20 trading days ended December 29, 2015. Effective with the Share Distribution, CSWI entered into an Employee Matters Agreement with Capital Southwest. Under this agreement, Capital Southwest will retain the obligation to fund the cash incentive awards granted under the Executive Compensation Plan, and all liabilities with respect to such cash
63
Table of Contents
CSW INDUSTRIALS, INC
NOTES TO CONSOLIDATED FINANCIAL STATEMENTS
incentive awards will remain liabilities of Capital Southwest. During the fiscal year ended March 31, 2016, we recorded total executive compensation expense for the cash incentive payments of $1.3 million for Mr. Armes and Ms. Tacke, and total stock compensation expense of $0.3 million. The remaining cash and stock compensation of $2.4 million and $1.2 million, respectively, will be recognized as compensation expense over the remaining vesting period.
| 5. | SHARE-BASED COMPENSATION |
In September 2015, in connection with the Share Distribution, we adopted our 2015 Equity and Incentive Compensation Plan (the “2015 Plan”), which provides for the issuance of up to 2,000,000 shares of CSWI common stock through the grant of stock options, stock appreciation rights, restricted shares, restricted stock units, performance shares, performance units or other share-based awards, to employees, officers and non-employee directors, as well as the issuance of awards in connection with the Share Distribution. As of March 31, 2016, 1,404,083 shares were available for issuance under the 2015 Plan, which includes the impact of 510,447 shares issued in connection with the Share Distribution and discussed below.
In connection with the Share Distribution, all stock option and restricted stock awards granted by Capital Southwest, including awards granted under the executive compensation plan discussed in Note 4, were adjusted and each holder of an award received both Capital Southwest and CSWI stock options and restricted stock awards.
| • | Each Capital Southwest stock option was converted into both a Capital Southwest stock option and a CSWI stock option, with adjustments made to the exercise prices and number of shares subject to each option in order to preserve the aggregate intrinsic value of the original Capital Southwest stock option as measured immediately before and immediately after the Share Distribution, subject to rounding. The adjusted Capital Southwest stock options and CSWI stock options are subject to substantially the same terms, vesting conditions, post-termination exercise rules and other restrictions that applied to the original Capital Southwest stock options immediately before the Share Distribution. Options generally expire 10 years from the date of grant and generally vest on or after the first anniversary of the date of grant in five annual installments. The fair value of stock options is determined using the Black-Scholes pricing model and such fair value is expensed on a straight-line basis over the requisite service period. |
| • | The Capital Southwest restricted stock awards will remain outstanding and the awardees additionally received one share of CSWI restricted stock for each share of Capital Southwest restricted stock held, which shares are subject to substantially the same terms, vesting conditions and other restrictions applicable to the Capital Southwest restricted stock award immediately before the Share Distribution. Restricted Stock awards generally have full voting and dividend rights, but are restricted with regard to sale or transfer. Unless otherwise specified in the award agreement, the restrictions do not expire for a minimum of one year and a maximum of five years and are subject to forfeiture during the restriction period. Typically, restricted share grants have staggered vesting periods over one to five years from the grant date. The fair value of restricted stock is based on the closing price of common stock on the date of grant and such fair value is expensed on a straight-line basis over the requisite service period. |
The issuance of share-based compensation awards discussed above occurred in conjunction with the Share Distribution after the market closed on September 30, 2015. We record compensation expense for share-based awards granted by CSWI to CSWI employees and share-based awards granted by Capital Southwest to employees who are now employed by CSWI.
64
Table of Contents
CSW INDUSTRIALS, INC
NOTES TO CONSOLIDATED FINANCIAL STATEMENTS
We recorded share-based compensation as follows for the fiscal year ended March 31, 2016 (in thousands):
| Fiscal Year Ended March 31, 2016 | ||||||||||||
| Stock Options | Restricted Stock | Total | ||||||||||
| Share-based compensation expense |
$ | 206 | $ | 750 | $ | 956 | ||||||
| Related income tax benefit |
(72 | ) | (263 | ) | (335 | ) | ||||||
|
|
|
|
|
|
|
|||||||
| Net share-based compensation expense |
$ | 134 | $ | 487 | $ | 621 | ||||||
|
|
|
|
|
|
|
|||||||
No share-based compensation expense was recorded prior to October 1, 2015.
Stock option activity, which represents outstanding CSWI awards, including awards held by Capital Southwest employees is as follows:
| Fiscal Year Ended March 31, 2016 | ||||||||||||||||
| Number of Shares |
Weighted Average Exercise Price |
Remaining Contractual Life (Years) |
Aggregate Intrinsic Value (in Millions) |
|||||||||||||
| Outstanding at April 1, 2015 |
— | $ | — | |||||||||||||
| Granted |
368,487 | 24.40 | ||||||||||||||
| Exercised |
(5,974 | ) | 16.11 | |||||||||||||
| Canceled |
— | — | ||||||||||||||
|
|
|
|
|
|||||||||||||
| Outstanding at March 31, 2016 |
362,513 | $ | 24.53 | 8.0 | $ | 2.7 | ||||||||||
|
|
|
|
|
|||||||||||||
| Exercisable at March 31, 2016 |
131,161 | $ | 23.67 | 7.5 | $ | 1.1 | ||||||||||
|
|
|
|
|
|||||||||||||
At March 31, 2016, we had unrecognized compensation cost related to non-vested stock options of $0.8 million, which will be amortized into net income over the remaining weighted average vesting period of approximately 1.9 years. The calculation of unrecognized compensation cost and weighted average periods include share-based awards granted by CSWI to CSWI employees and share-based awards granted by Capital Southwest to employees who are now employed by CSWI. Other than options granted in conjunction with the Share Distribution, which were granted at a weighted average fair value of $6.67 per share, no options were granted during the fiscal year ended March 31, 2016. No options were exercised during the fiscal year ended March 31, 2015. The total fair value of stock options vested during the fiscal year ended March 31, 2016 was $0.5 million.
Restricted stock activity, which represents outstanding CSWI awards, including awards held by Capital Southwest employees is as follows:
| Number of Shares |
Weighted Average Grant Date Fair Value |
|||||||
| Outstanding at April 1, 2015 |
— | $ | — | |||||
| Granted |
230,706 | 22.14 | ||||||
| Vested |
(45,453 | ) | 15.41 | |||||
| Canceled |
(3,276 | ) | 28.21 | |||||
|
|
|
|
|
|||||
| Outstanding at March 31, 2016 |
181,977 | $ | 23.72 | |||||
|
|
|
|
|
|||||
65
Table of Contents
CSW INDUSTRIALS, INC
NOTES TO CONSOLIDATED FINANCIAL STATEMENTS
During the restriction period, the holders of restricted stock are entitled to vote and receive dividends, except for restricted shares awarded under the executive compensation plan discussed in Note 4. At March 31, 2016, we had unrecognized compensation cost related to unvested restricted shares of $3.0 million, which will be amortized into net income over the remaining weighted average vesting period of approximately 2.0 years. The calculation of unrecognized compensation cost and weighted average periods include share-based awards granted by CSWI to CSWI employees and share-based awards granted by Capital Southwest to employees who are now employed by CSWI. The total fair value of restricted shares vested during the fiscal year ended March 31, 2016 was $0.7 million.
Restricted stock granted during the fiscal year ended March 31, 2016 includes 17,449 shares with market-based vesting provisions, and vesting ranges from 0-100% based on pre-defined performance targets. Market-based restricted stock is earned upon the achievement of performance targets and is payable in common shares. Compensation expense is recognized over a 36-month cliff vesting period.
| 6. | DETAILS OF CERTAIN CONSOLIDATED BALANCE SHEET CAPTIONS |
Accounts receivable, net consists of the following (in thousands):
| March 31, | ||||||||
| 2016 | 2015 | |||||||
| Accounts receivable trade |
$ | 53,423 | $ | 50,487 | ||||
| Other receivables |
422 | 146 | ||||||
|
|
|
|
|
|||||
| 53,845 | 50,633 | |||||||
| Less: Allowance for doubtful accounts |
(1,208 | ) | (1,692 | ) | ||||
|
|
|
|
|
|||||
| Accounts receivable, net |
$ | 52,637 | $ | 48,941 | ||||
|
|
|
|
|
|||||
Inventories, net consist of the following (in thousands):
| March 31, | ||||||||
| 2016 | 2015 | |||||||
| Raw materials and supplies |
$ | 26,019 | $ | 21,837 | ||||
| Work in process |
5,432 | 5,626 | ||||||
| Finished goods |
26,087 | 25,325 | ||||||
|
|
|
|
|
|||||
| Total inventories |
57,538 | 52,788 | ||||||
| Less: LIFO reserve |
(5,302 | ) | (5,456 | ) | ||||
| Less: Obsolescence reserve |
(602 | ) | (157 | ) | ||||
|
|
|
|
|
|||||
| Inventories, net |
$ | 51,634 | $ | 47,175 | ||||
|
|
|
|
|
|||||
66
Table of Contents
CSW INDUSTRIALS, INC
NOTES TO CONSOLIDATED FINANCIAL STATEMENTS
Property, plant and equipment, net, consist of the following (in thousands):
| March 31, | ||||||||
| 2016 | 2015 | |||||||
| Land improvements |
$ | 2,129 | $ | 2,129 | ||||
| Buildings and improvements |
46,004 | 42,191 | ||||||
| Plant, office and laboratory equipment |
65,732 | 62,358 | ||||||
|
|
|
|
|
|||||
| 113,865 | 106,678 | |||||||
| Less: Accumulated depreciation |
(59,035 | ) | (52,954 | ) | ||||
|
|
|
|
|
|||||
| 54,830 | 53,724 | |||||||
| Land |
2,610 | 1,242 | ||||||
| Construction in progress |
6,917 | 1,871 | ||||||
|
|
|
|
|
|||||
| Property, plant and equipment, net |
$ | 64,357 | $ | 56,837 | ||||
|
|
|
|
|
|||||
Depreciation of property, plant and equipment was $7.0 million, $5.9 million and $5.2 million for the fiscal years ended March 31, 2016, 2015 and 2014, respectively. Of these amounts, cost of revenues includes $4.6 million, $3.9 million and $3.2 million, respectively.
Other assets consists of the following (in thousands):
| March 31, | ||||||||
| 2016 | 2015 | |||||||
| Property held for investment (a) |
$ | 9,290 | $ | 9,300 | ||||
| Deferred income taxes |
— | 5,651 | ||||||
| Retirement assets in excess of benefit obligations |
2,063 | 338 | ||||||
| Other |
4,545 | 457 | ||||||
|
|
|
|
|
|||||
| Other assets |
$ | 15,898 | $ | 15,746 | ||||
|
|
|
|
|
|||||
| (a) As of March 31, 2016, $6.2 million in assets were held for sale. |
| |||||||
Accrued and other current expenses consist of the following (in thousands):
| March 31, | ||||||||
| 2016 | 2015 | |||||||
| Compensation and related benefits |
$ | 12,502 | $ | 9,212 | ||||
| Rebates and marketing agreements |
1,976 | 1,515 | ||||||
| Commissions |
1,378 | 1,157 | ||||||
| Sales and property taxes |
517 | 373 | ||||||
| Other accrued expenses |
4,717 | 3,744 | ||||||
|
|
|
|
|
|||||
| Accrued and other current liabilities |
$ | 21,090 | $ | 16,001 | ||||
|
|
|
|
|
|||||
67
Table of Contents
CSW INDUSTRIALS, INC
NOTES TO CONSOLIDATED FINANCIAL STATEMENTS
Other liabilities consists of the following (in thousands):
| March 31, | ||||||||
| 2016 | 2015 | |||||||
| Contingent consideration |
$ | 5,854 | $ | 5,115 | ||||
| Deferred income taxes |
3,793 | — | ||||||
| Other |
2,173 | 2,595 | ||||||
|
|
|
|
|
|||||
| Other liabilities |
$ | 11,820 | $ | 7,710 | ||||
|
|
|
|
|
|||||
| 7. | LONG-TERM DEBT |
Debt consists of the following (in thousands):
| March 31, | ||||||||
| 2016 | 2015 | |||||||
| Revolving Credit Facility, interest rate of 2.18% |
$ | 76,539 | $ | — | ||||
| RectorSeal line of credit, interest rate of 1.77% |
— | 13,000 | ||||||
| Whitmore term loan, interest rate of 2.43% and 2.17%, respectively |
13,143 | 13,704 | ||||||
|
|
|
|
|
|||||
| Total debt |
89,682 | 26,704 | ||||||
| Less: Current portion |
(561 | ) | (13,561 | ) | ||||
|
|
|
|
|
|||||
| Long-term debt |
$ | 89,121 | $ | 13,143 | ||||
|
|
|
|
|
|||||
Revolving Credit Facility Agreement
On December 11, 2015, we entered into a five-year $250.0 million revolving credit facility agreement (“Revolving Credit Facility”), with an additional $50.0 million accordion feature, with JPMorgan Chase Bank, N.A., as administrative agent. Borrowings under this facility bear interest at a rate of prime plus 0.75% or London Interbank Offered Rate (“LIBOR”) plus 1.75%, which may be adjusted based on our leverage ratio. We pay a commitment fee of 0.25% for the unutilized portion of the Revolving Credit Facility. Interest and commitment fees are payable at least quarterly and the outstanding principal balance is due at maturity. This facility is secured by substantially all of our assets. Borrowings under this facility were used as follows: (1) to repay the principal and interest outstanding under the RectorSeal Line of Credit and the Strathmore Acquisition Term Loan, (2) to pay fees incurred to enter into the agreement and (3) to acquire Leak Freeze. As of March 31, 2016, we had $76.5 million in outstanding borrowings under this facility. The agreement contains certain restrictive covenants, including requiring us to maintain a minimum fixed charge coverage of ratio of 1.25 to 1.00 and a maximum leverage ratio of EBITDA to Funded Debt (as defined in the agreement) of 3.00 to 1.00. Covenant compliance is tested quarterly and we were in compliance with all covenants as of March 31, 2016. Interest payments related to a portion of the outstanding balance under the Revolving Credit Facility are hedged under an interest rate swap agreement as described in Note 9.
During April 2016, we repaid $5.0 million of the amount that was outstanding at March 31, 2016 under this facility.
RectorSeal Line of Credit
RectorSeal had a $30.0 million secured line of credit with a bank available for acquisitions and general corporate purposes, which was scheduled to mature on July 31, 2016. Quarterly interest payments were required.
68
Table of Contents
CSW INDUSTRIALS, INC
NOTES TO CONSOLIDATED FINANCIAL STATEMENTS
Borrowings under the line of credit bore interest at a variable annual rate of either the one month LIBOR plus 1.5% or 0.75% less than the bank floating rate. The line of credit was secured by accounts receivable, inventory, equipment, investments, and other assets of RectorSeal (excluding its subsidiaries). As of March 31, 2015, RectorSeal had $13.0 million in outstanding borrowings under the line of credit. The remaining principal balance of $6.5 million was repaid on December 11, 2015 with borrowings under the Revolving Credit Facility, and the line of credit was terminated.
Strathmore Acquisition Term Loan
Whitmore had a $70.0 million secured term loan outstanding to support the acquisition of Strathmore. The term loan was scheduled to mature on April 27, 2020 and was secured by the assets of Whitmore and Strathmore, excluding certain real property. Borrowings under the term loan bore interest at a variable annual rate equal to one month LIBOR plus 3.0%. We made quarterly payments of $875,000 in both July 2015 and October 2015. The remaining principal balance of $68.3 million was repaid on December 11, 2015 with borrowings under the Revolving Credit Facility, and the term loan was terminated.
Whitmore Line of Credit
Whitmore had a $20.0 million secured line of credit with a syndicate of four commercial banks available for general corporate purposes, which was scheduled to mature on April 27, 2020. Borrowings under the line of credit bore interest at a variable annual rate of 0.5% less than the bank floating rate. Whitmore repaid the entire balance during the quarter ended December 31, 2014. This line of credit was terminated in conjunction with our Revolving Credit Facility.
Whitmore Term Loan
As of March 31, 2016, Whitmore had a secured term loan outstanding related to a newly constructed warehouse and corporate office building and the remodel of an existing manufacturing and research and development facility. The term loan matures on July 31, 2029, and Whitmore has quarterly payments of $140,000 due in each of the next four quarters. Borrowings under the term loan bear interest at a variable annual rate equal to one month LIBOR plus 2.0%. As of March 31, 2016 and 2015, Whitmore had $13.1 million and $13.7 million, respectively, in outstanding borrowings under the term loan. Interest payments under the Whitmore term loan are hedged under an interest rate swap agreement as described in Note 9.
Balco Line of Credit
Balco had a $1.5 million unsecured revolving line of credit with a bank available for working capital purposes that matured on October 29, 2015 and was not renewed. Borrowings under the line of credit bore interest at a variable annual rate of 0.5% less than the U.S. prime interest rate, with a floor of 3.75%. As of March 31, 2015, Balco had no outstanding borrowings under the line of credit.
69
Table of Contents
CSW INDUSTRIALS, INC
NOTES TO CONSOLIDATED FINANCIAL STATEMENTS
Future Minimum Debt Payments
Future minimum debt payments are as follows for fiscal years ending March 31 (in thousands):
| 2017 |
$ | 561 | ||
| 2018 |
561 | |||
| 2019 |
561 | |||
| 2020 |
561 | |||
| 2021 |
77,100 | |||
| Thereafter |
10,338 | |||
|
|
|
|||
| Total |
$ | 89,682 | ||
|
|
|
Operating Leases
We have entered into non-cancelable operating leases with initial terms in excess of one year for manufacturing and office facilities. The leases expire at various times through 2031. Future minimum lease payments under these leases for fiscal years ending March 31 are as follows (in thousands):
| 2017 |
$ | 2,364 | ||
| 2018 |
1,733 | |||
| 2019 |
1,467 | |||
| 2020 |
1,404 | |||
| 2021 |
1,238 | |||
| Thereafter |
4,648 | |||
|
|
|
|||
| Total |
$ | 12,854 | ||
|
|
|
Rental expense under operating leases was $2.6 million, $2.4 million and $2.1 million for the fiscal years ended March 31, 2016, 2015 and 2014, respectively.
| 8. | EARNINGS PER SHARE |
On September 30, 2015, 15.6 million CSWI common shares were distributed to Capital Southwest shareholders in connection with the Share Distribution. For comparative purposes, and to provide a more meaningful calculation for weighted average shares, this amount was assumed to be outstanding throughout all periods presented up to and including September 30, 2015 in the calculation of basic weighted average shares. In addition, for the dilutive weighted average share calculations, the dilutive securities outstanding at September 30, 2015 were also assumed to be outstanding throughout all periods presented up to and including September 30, 2015.
70
Table of Contents
CSW INDUSTRIALS, INC
NOTES TO CONSOLIDATED FINANCIAL STATEMENTS
The following table sets forth the reconciliation of the numerator and the denominator of basic and diluted earnings per share for the fiscal years ended March 31, 2016, 2015 and 2014 (amounts in thousands, except per share data):
| Fiscal Years Ended March 31, | ||||||||||||
| 2016 | 2015 | 2014 | ||||||||||
| Net income for basic and diluted earnings per share |
$ | 25,471 | $ | 29,705 | $ | 24,732 | ||||||
| Weighted average shares: |
||||||||||||
| Common stock |
15,443 | 15,441 | 15,441 | |||||||||
| Participating securities |
182 | 142 | 142 | |||||||||
|
|
|
|
|
|
|
|||||||
| Denominator for basic earnings per common share |
15,625 | 15,583 | 15,583 | |||||||||
| Potentially dilutive securities (a) |
50 | 41 | 41 | |||||||||
|
|
|
|
|
|
|
|||||||
| Denominator for diluted earnings per common share |
15,675 | 15,624 | 15,624 | |||||||||
|
|
|
|
|
|
|
|||||||
| Earnings per common share: |
||||||||||||
| Basic |
$ | 1.63 | $ | 1.91 | $ | 1.59 | ||||||
| Diluted |
1.62 | 1.90 | 1.58 | |||||||||
| (a) | No shares were excluded for anti-dilution for the fiscal year ended March 31, 2016. We have excluded 29,877 shares for each of the fiscal years ended March 31, 2015 and 2014 as their effect would have been anti-dilutive. |
| 9. | DERIVATIVE INSTRUMENTS AND HEDGE ACCOUNTING |
We enter into interest rate swap agreements to hedge exposure to floating interest rates on certain portions of our debt. As of March 31, 2016 and 2015, we had $46.4 million and $13.7 million, respectively, of notional amount in outstanding designated interest rate swaps with third parties. All interest rate swaps are highly effective. At March 31, 2016, the maximum remaining length of any interest rate swap contract in place was approximately 13.3 years.
We are exposed to risk from credit-related losses resulting from nonperformance by counterparties to our financial instruments. We perform credit evaluation of our counterparties under interest rate swap agreements and expect all counterparties to meet their obligations. We have not experienced credit losses from our counterparties.
The fair value of interest rate swaps designated as hedging instruments are summarized below (in thousands):
| March 31, | ||||||||
| 2016 | 2015 | |||||||
| Current derivative liabilities |
$ | 511 | $ | — | ||||
| Non-current derivative liabilities |
1,366 | 1,206 | ||||||
| 10. | FAIR VALUE MEASUREMENTS |
The fair value of interest rate swaps discussed in Note 9 are determined using Level 2 inputs. The carrying value of our debt, included in Note 7, approximates fair value as it bears interest at floating rates. The carrying amounts of other financial instruments (i.e., cash and cash equivalents, restricted cash, bank time deposits, accounts receivable, net, accounts payable) approximated their fair values at March 31, 2016 and 2015 due to their short-term nature.
71
Table of Contents
CSW INDUSTRIALS, INC
NOTES TO CONSOLIDATED FINANCIAL STATEMENTS
The fair value of contingent payments was $5.9 million, which includes the addition of a $0.4 million contingent payment for Deacon, and $5.1 million as of March 31, 2016 and 2015, respectively. During the fiscal year ended March 31, 2016, the fair value of the contingent payment related to the SureSeal acquisition increased by $0.4 million, net to $5.5 million due primarily to accretion. During the fiscal year ended March 31, 2016, the fair value of the contingent payment recorded related to the Strathmore acquisition was reduced by $2.0 million to $0 due to a decline in the probability that Strathmore would meet the minimum threshold for payment. All changes in the fair value of contingent payments are recorded in selling, general and administrative expense.
| 11. | RETIREMENT PLANS |
Defined Benefit Plans
We maintain a qualified defined benefit pension plan (the “Qualified Plan”) that covers substantially all of our U.S. employees. Benefits are based on years of service and an average of the highest five consecutive years of compensation during the last ten years of employment. The Qualified Plan is closed to any employees hired or re-hired on or after January 1, 2015. The Qualified Plan has been amended to freeze benefit accruals and to modify certain ancillary benefits provided under the Qualified Plan effective as of September 30, 2015. A remeasurement was performed at September 30, 2015 to reflect the amendment of the Qualified Plan that froze participation and all future benefit accruals. The freeze of the Qualified Plan as of September 30, 2015 required the immediate recognition of a curtailment gain due to the accelerated recognition of all remaining prior service costs (benefits) and the decrease in the projected benefit obligation. The freeze of the Qualified Plan will reduce net periodic pension expense for the remainder of the current year based on the remeasurement.
The funding policy of the plan is to contribute annual amounts that are currently deductible for federal income tax purposes. No contributions were made in the fiscal year ended March 31, 2016, 2015 or 2014.
The following are assumptions related to the Qualified Plan:
| Year ended March 31, | ||||||||||||
| 2016 | 2015 | 2014 | ||||||||||
| Assumptions used to determine benefit obligations: |
||||||||||||
| Discount rate |
4.50 | % | 4.25 | % | 5.00 | % | ||||||
| Rate of compensation increases |
(a | ) | 5.00 | % | 5.00 | % | ||||||
| Assumptions used to determine net pension expense: |
||||||||||||
| Discount rate |
4.25 | % | 5.00 | % | 4.50 | % | ||||||
| Expected return on plan assets |
7.00 | % | 7.00 | % | 7.00 | % | ||||||
| Rate of compensation increases |
(a | ) | 5.00 | % | 5.00 | % | ||||||
| (a) Rate of compensation increase is no longer relevant due to the freeze of the Qualified Plan. |
| |||||||||||
The factors used in determination of these assumptions are described in Note 1.
72
Table of Contents
CSW INDUSTRIALS, INC
NOTES TO CONSOLIDATED FINANCIAL STATEMENTS
Net pension expense for the Qualified Plan was (in thousands):
| For the year ended March 31, | ||||||||||||
| 2016 | 2015 | 2014 | ||||||||||
| Service cost – benefits earned during the year |
$ | 2,042 | $ | 3,039 | $ | 2,965 | ||||||
| Interest cost on projected benefit obligation |
2,666 | 2,513 | 2,066 | |||||||||
| Expected return on assets |
(3,226 | ) | (2,406 | ) | (2,115 | ) | ||||||
| Net amortization and deferral |
(27 | ) | 58 | 363 | ||||||||
| Curtailment benefit |
(8,051 | ) | — | — | ||||||||
|
|
|
|
|
|
|
|||||||
| Net pension (benefit) expense |
$ | (6,596 | ) | $ | 3,204 | $ | 3,279 | |||||
|
|
|
|
|
|
|
|||||||
The estimated prior service costs and the estimated net loss for the Qualified Plan that will be amortized from accumulated other comprehensive loss into pension expense in the fiscal year ended March 31, 2017 is $0 and $0, respectively.
The following is a summary of the changes in the Qualified Plan’s pension obligations (in thousands):
| March 31, | ||||||||
| 2016 | 2015 | |||||||
| Benefit obligation at beginning of year |
$ | 64,015 | $ | 50,344 | ||||
| Service cost |
2,042 | 3,039 | ||||||
| Interest cost |
2,666 | 2,513 | ||||||
| Actuarial loss |
(2,589 | ) | 9,033 | |||||
| Benefits paid |
(1,410 | ) | (914 | ) | ||||
| Curtailment impact |
(14,238 | ) | — | |||||
| Impact of Share Distribution (a) |
8,329 | — | ||||||
|
|
|
|
|
|||||
| Benefit obligation at end of year |
$ | 58,815 | $ | 64,015 | ||||
|
|
|
|
|
|||||
| Accumulated benefit obligation |
$ | 58,815 | $ | 50,081 | ||||
|
|
|
|
|
|||||
| (a) Additional obligations were included related to employees who transferred from Capital Southwest to CSWI upon completion of the Share Distribution. |
| |||||||
The following is a reconciliation of the Qualified Plan’s assets (in thousands):
| March 31, | ||||||||
| 2016 | 2015 | |||||||
| Fair value of plan assets at beginning of year |
$ | 43,087 | $ | 42,124 | ||||
| Actual return on plan assets |
578 | 1,877 | ||||||
| Benefits paid |
(1,410 | ) | (914 | ) | ||||
| Impact of Share Distribution (a) |
18,623 | — | ||||||
|
|
|
|
|
|||||
| Fair value of plan assets at end of year |
$ | 60,878 | $ | 43,087 | ||||
|
|
|
|
|
|||||
| (a) Assets previously held by Capital Southwest were contributed to CSWI in conjunction with the Share Distribution. |
| |||||||
73
Table of Contents
CSW INDUSTRIALS, INC
NOTES TO CONSOLIDATED FINANCIAL STATEMENTS
The following summarizes the net pension asset (liability) for the Qualified Plan (in thousands):
| March 31, | ||||||||
| 2016 | 2015 | |||||||
| Plan assets at fair value |
$ | 60,878 | $ | 43,087 | ||||
| Benefit obligation |
(58,815 | ) | (64,015 | ) | ||||
|
|
|
|
|
|||||
| Funded status |
$ | 2,063 | $ | (20,928 | ) | |||
|
|
|
|
|
|||||
The following summarizes amounts recognized in the balance sheet for the Qualified Plan (in thousands):
| March 31, | ||||||||
| 2016 | 2015 | |||||||
| Noncurrent assets |
$ | 2,063 | $ | — | ||||
| Noncurrent liabilities |
— | (20,928 | ) | |||||
|
|
|
|
|
|||||
| Funded status |
$ | 2,063 | $ | (20,928 | ) | |||
|
|
|
|
|
|||||
The following table presents the change in accumulated other comprehensive loss attributable to the components of the net cost and the change in the benefit obligation (in thousands):
| March 31, | ||||||||
| 2016 | 2015 | |||||||
| Accumulated other comprehensive (loss) income at beginning of year |
$ | (4,707 | ) | $ | 1,493 | |||
| Amortization of net loss |
— | 74 | ||||||
| Amortization of prior service credit |
(18 | ) | (36 | ) | ||||
| Curtailment impact |
5,233 | — | ||||||
| Impact of Share Distribution |
35 | — | ||||||
| Net loss arising during the year |
(1,433 | ) | (6,238 | ) | ||||
|
|
|
|
|
|||||
| Accumulated other comprehensive loss at end of year |
$ | (890 | ) | $ | (4,707 | ) | ||
|
|
|
|
|
|||||
Amounts recorded in accumulated other comprehensive loss consist of (in thousands):
| March 31, | ||||||||
| 2016 | 2015 | |||||||
| Net prior service cost |
$ | — | $ | 279 | ||||
| Net loss |
(890 | ) | (4,986 | ) | ||||
|
|
|
|
|
|||||
| Accumulated other comprehensive loss |
$ | (890 | ) | $ | (4,707 | ) | ||
|
|
|
|
|
|||||
74
Table of Contents
CSW INDUSTRIALS, INC
NOTES TO CONSOLIDATED FINANCIAL STATEMENTS
The current target allocations for managed plan assets are 25% – 43% equity securities, 40% – 65% for fixed income securities and 5% – 15% for alternatives. The actual asset allocations for the Qualified Plan are as follows:
| As of March 31, | ||||||||
| Asset category |
2016 | 2015 | ||||||
| Equity securities |
35 | % | 58 | % | ||||
| Fixed income securities |
59 | % | 36 | % | ||||
| Other |
2 | % | 3 | % | ||||
| Cash and cash equivalents |
4 | % | 3 | % | ||||
|
|
|
|
|
|||||
| Total |
100 | % | 100 | % | ||||
|
|
|
|
|
|||||
The Qualified Plan’s financial instruments, shown below, are presented at fair value, as described in Note 1. The fair values of our Qualified Plan assets were:
| As of March 31, 2016 | As of March 31, 2015 | |||||||||||||||||||||||||||||||
| Hierarchical Levels | Hierarchical Levels | |||||||||||||||||||||||||||||||
| Asset category |
Total | I | II | III | Total | I | II | III | ||||||||||||||||||||||||
| Equity securities (a) |
$ | 21,183 | $ | 2,455 | $ | 18,728 | $ | — | $ | 24,928 | $ | 13,647 | $ | 11,281 | $ | — | ||||||||||||||||
| Fixed income securities (b) |
35,719 | 3,979 | 31,740 | — | 15,400 | 1,488 | 13,912 | — | ||||||||||||||||||||||||
| Other (c) |
1,474 | 935 | 539 | — | 1,252 | 754 | 498 | — | ||||||||||||||||||||||||
| Cash and cash equivalents |
2,502 | 2,502 | — | — | 1,507 | 1,507 | — | — | ||||||||||||||||||||||||
|
|
|
|
|
|
|
|
|
|
|
|
|
|
|
|
|
|||||||||||||||||
| Total |
$ | 60,878 | $ | 9,871 | $ | 51,007 | $ | — | $ | 43,087 | $ | 17,396 | $ | 25,691 | $ | — | ||||||||||||||||
|
|
|
|
|
|
|
|
|
|
|
|
|
|
|
|
|
|||||||||||||||||
| (a) | This category includes investment in equity securities of large, medium and small companies and equity investments in foreign companies. Mutual funds included in this category are valued using the net asset value per unit as of the valuation date. These investments include shares of Capital Southwest common stock. As of March 31, 2016 and 2015, Capital Southwest common stock represented 1.2% and 17.7%, respectively, of the fair value of the plan assets and CSWI common stock represented 1.9% and 0%, respectively, of the fair value of the plan assets. |
| (b) | This category includes investments in investment grade fixed income instruments, primarily U.S. government obligations. |
| (c) | This category includes investments in commodity linked and real estate funds within the U.S. |
The following table summarizes the expected cash benefit payments for the Qualified Plan for fiscal years ending March 31 (in millions):
| 2017 |
$ | 2.1 | ||
| 2018 |
2.3 | |||
| 2019 |
2.5 | |||
| 2020 |
2.8 | |||
| 2021 |
2.9 | |||
| 2022-2026 |
16.9 |
One of our foreign subsidiaries has a defined benefit plan covering substantially all of its employees. Assets, liabilities and expenses related to this plan are immaterial to CSWI.
75
Table of Contents
CSW INDUSTRIALS, INC
NOTES TO CONSOLIDATED FINANCIAL STATEMENTS
Restoration Plan
We maintain an unfunded retirement restoration plan (the “Restoration Plan”) that is a non-qualified plan providing for the payment to participating employees, upon retirement, the difference between the maximum annual payment permissible under the Qualified Plan pursuant to federal limitations and the amount that would otherwise have been payable under the Qualified Plan.
The following are assumptions related to the Restoration Plan:
| Year ended March 31, | ||||||||||||
| 2016 | 2015 | 2014 | ||||||||||
| Assumptions used to determine benefit obligations: |
||||||||||||
| Discount rate |
4.50 | % | 4.25 | % | 5.00 | % | ||||||
| Rate of compensation increases |
(a | ) | 5.00 | % | 5.00 | % | ||||||
| Assumptions used to determine net pension expense: |
||||||||||||
| Discount rate |
4.25 | % | 5.00 | % | 4.50 | % | ||||||
| Rate of compensation increases |
(a | ) | 5.00 | % | 5.00 | % | ||||||
| (a) Rate of compensation increase is no longer relevant due to the freeze of the Qualified Plan. |
| |||||||||||
The factors used in determination of these assumptions are described in Note 1.
Net pension expense for the Restoration Plan was (in thousands):
| For the year ended March 31, | ||||||||||||
| 2016 | 2015 | 2014 | ||||||||||
| Service cost – benefits earned during the year |
$ | 27 | $ | 66 | $ | 65 | ||||||
| Interest cost on projected benefit obligation |
73 | 66 | 61 | |||||||||
| Net amortization and deferral |
36 | 63 | 66 | |||||||||
| Curtailment expense |
31 | — | — | |||||||||
|
|
|
|
|
|
|
|||||||
| Net pension expense |
$ | 167 | $ | 195 | $ | 192 | ||||||
|
|
|
|
|
|
|
|||||||
The estimated prior service costs and the estimated net loss for the Restoration Plan that will be amortized from accumulated other comprehensive loss into pension expense in the fiscal year ended March 31, 2017 is $0 and less than $0.1 million, respectively.
The following is a summary of the changes in the Restoration Plan’s pension obligations (in thousands):
| March 31, | ||||||||
| 2016 | 2015 | |||||||
| Benefit obligation at beginning of year |
$ | 1,616 | $ | 1,513 | ||||
| Service cost |
27 | 66 | ||||||
| Interest cost |
73 | 66 | ||||||
| Actuarial loss (gain) |
304 | (29 | ) | |||||
| Curtailment impact |
(555 | ) | — | |||||
| Benefits paid |
(6 | ) | — | |||||
| Impact of Share Distribution (a) |
287 | — | ||||||
|
|
|
|
|
|||||
| Benefit obligation at end of year |
$ | 1,746 | $ | 1,616 | ||||
|
|
|
|
|
|||||
| Accumulated benefit obligation |
$ | 1,746 | $ | 1,423 | ||||
|
|
|
|
|
|||||
76
Table of Contents
CSW INDUSTRIALS, INC
NOTES TO CONSOLIDATED FINANCIAL STATEMENTS
| (a) | Additional obligations were included related to employees who transferred from Capital Southwest to CSWI upon completion of the Share Distribution. |
The following summarizes amounts recognized in the balance sheet for the Restoration Plan (in thousands):
| March 31, | ||||||||
| 2016 | 2015 | |||||||
| Noncurrent liabilities |
$ | (1,746 | ) | $ | (1,616 | ) | ||
|
|
|
|
|
|||||
| Funded status |
$ | (1,746 | ) | $ | (1,616 | ) | ||
|
|
|
|
|
|||||
The following table presents the change in accumulated other comprehensive loss attributable to the components of the net cost and the change in the benefit obligation (in thousands):
| March 31, | ||||||||
| 2016 | 2015 | |||||||
| Accumulated other comprehensive loss at beginning of year |
$ | (503 | ) | $ | (396 | ) | ||
| Amortization of net loss |
20 | 14 | ||||||
| Amortization of prior service (credit) cost |
(3 | ) | 6 | |||||
| Curtailment impact |
(20 | ) | — | |||||
| Impact of Share Distribution (a) |
(502 | ) | — | |||||
| Net gain (loss) arising during the year |
669 | (127 | ) | |||||
|
|
|
|
|
|||||
| Accumulated other comprehensive loss at end of year |
$ | (339 | ) | $ | (503 | ) | ||
|
|
|
|
|
|||||
| (a) Deferred losses attributable to obligations related to employees who transferred from Capital Southwest to CSWI upon completion of the Share Distribution. |
| |||||||
Amounts recorded in accumulated other comprehensive loss consist of (in thousands):
| March 31, | ||||||||
| 2016 | 2015 | |||||||
| Net prior service credit |
$ | — | $ | (23 | ) | |||
| Net loss |
(339 | ) | (480 | ) | ||||
|
|
|
|
|
|||||
| Accumulated other comprehensive loss |
$ | (339 | ) | $ | (503 | ) | ||
|
|
|
|
|
|||||
The following table summarizes the expected cash benefit payments for the Restoration Plan for fiscal years ending March 31 (in millions):
| 2017 |
$ | 0.1 | ||
| 2018 |
0.1 | |||
| 2019 |
0.1 | |||
| 2020 |
0.1 | |||
| 2021 |
0.1 | |||
| 2022-2026 |
0.5 |
Defined Contribution Plan
Effective October 1, 2015, we began to sponsor a defined contribution plan covering substantially all of our U.S. employees. Employees may contribute to this plan, and these contributions are matched by us up to the first
77
Table of Contents
CSW INDUSTRIALS, INC
NOTES TO CONSOLIDATED FINANCIAL STATEMENTS
6.0% contributed by the employee. Additionally, we contribute 3.0% of eligible earnings to employees regardless of their level of participation in the plan, which is discretionary and subject to adjustment based on profitability. Contributions to the defined contribution plan were $1.7 million for the year ended March 31, 2016.
Employee Stock Ownership Plan
Prior to the Share Distribution, RectorSeal and Whitmore each sponsored qualified, non-leveraged employee stock ownership plans (“ESOP”) in which eligible domestic employees of RectorSeal, Jet-Lube, Smoke Guard and Whitmore were eligible to participate following the completion of one year of service. The ESOPs provided annual discretionary contributions of up to the maximum amount that is deductible under the Internal Revenue Code. Contributions to the ESOPs were invested in Capital Southwest common stock. A participant’s interest in contributions to the ESOPs fully vests after three years of credited service or upon retirement, permanent disability (each, as defined in the plan document) or death. RectorSeal and Whitmore recorded total contributions to the ESOPs of $1.6 million and $2.3 million during the fiscal years ended March 31, 2015 and 2014, respectively. The ESOPs held 929,600 and 898,177 shares of Capital Southwest common stock as of March 31, 2015 and 2014, respectively.
Effective with the Share Distribution, Whitmore’s ESOP was merged into RectorSeal’s ESOP, sponsorship of RectorSeal’s ESOP was transferred to CSWI and eligible domestic employees of CSWI and Balco were included. Employees of Strathmore will become eligible for participation in the fiscal year ending March 31, 2017. During the fiscal year ended March 31, 2016, $1.7 million was contributed to the ESOP based on performance in the fiscal year ended March 31, 2015. Future contributions to the ESOP will be invested in CSWI common stock. During the fiscal year ended March 31, 2016, $2.1 million was recorded to expense based on performance in the fiscal year ended March 31, 2016 and is expected to be contributed to the ESOP in the fiscal year ending March 31, 2017. The ESOP held 907,748 shares of both Capital Southwest and CSWI common stock as of March 31, 2016.
| 12. | INCOME TAXES |
Income before income taxes was comprised of the following (in thousands):
| Fiscal Years Ended March 31, | ||||||||||||
| 2016 | 2015 | 2014 | ||||||||||
| U.S. Federal |
$ | 40,981 | $ | 39,511 | $ | 31,241 | ||||||
| Foreign |
3,244 | 5,417 | 6,285 | |||||||||
|
|
|
|
|
|
|
|||||||
| Income before income taxes |
$ | 44,225 | $ | 44,928 | $ | 37,526 | ||||||
|
|
|
|
|
|
|
|||||||
78
Table of Contents
CSW INDUSTRIALS, INC
NOTES TO CONSOLIDATED FINANCIAL STATEMENTS
Income tax expense consists of the following (in thousands):
| Current | Deferred | Total | ||||||||||
| Fiscal year ended March 31, 2016: |
||||||||||||
| U.S. Federal |
$ | 9,210 | $ | 7,573 | $ | 16,783 | ||||||
| State and local |
1,368 | (136 | ) | 1,232 | ||||||||
| Foreign |
914 | (175 | ) | 739 | ||||||||
|
|
|
|
|
|
|
|||||||
| Provision for income taxes |
$ | 11,492 | $ | 7,262 | $ | 18,754 | ||||||
|
|
|
|
|
|
|
|||||||
| Fiscal year ended March 31, 2015: |
||||||||||||
| U.S. Federal |
$ | 14,920 | $ | (1,848 | ) | $ | 13,072 | |||||
| State and local |
933 | 3 | 936 | |||||||||
| Foreign |
1,637 | (422 | ) | 1,215 | ||||||||
|
|
|
|
|
|
|
|||||||
| Provision for income taxes |
$ | 17,490 | $ | (2,267 | ) | $ | 15,223 | |||||
|
|
|
|
|
|
|
|||||||
| Fiscal year ended March 31, 2014: |
||||||||||||
| U.S. Federal |
$ | 11,570 | $ | (567 | ) | $ | 11,003 | |||||
| State and local |
475 | (74 | ) | 401 | ||||||||
| Foreign |
1,374 | 16 | 1,390 | |||||||||
|
|
|
|
|
|
|
|||||||
| Provision for income taxes |
$ | 13,419 | $ | (625 | ) | $ | 12,794 | |||||
|
|
|
|
|
|
|
|||||||
Income tax expense differed from the amounts computed by applying the U.S. federal statutory income tax rate of 35% to income before income taxes as a result of the following (in thousands):
| Fiscal Years Ended March 31, | ||||||||||||
| 2016 | 2015 | 2014 | ||||||||||
| Computed tax expense at statutory rate |
$ | 15,479 | $ | 15,727 | $ | 13,225 | ||||||
| Increase (reduction) in income taxes resulting from: |
||||||||||||
| Permanent differences |
1,399 | 529 | 542 | |||||||||
| FIN 48 liability |
1,277 | — | — | |||||||||
| State and local income taxes, net of federal benefits |
1,055 | 569 | 205 | |||||||||
| Foreign rate differential |
(642 | ) | (75 | ) | (168 | ) | ||||||
| Domestic production activity deduction |
(420 | ) | (817 | ) | (719 | ) | ||||||
| Difference in U.S. rate |
(107 | ) | (45 | ) | 108 | |||||||
| Other, net |
713 | (665 | ) | (399 | ) | |||||||
|
|
|
|
|
|
|
|||||||
| Provision for income taxes |
$ | 18,754 | $ | 15,223 | $ | 12,794 | ||||||
|
|
|
|
|
|
|
|||||||
The effective tax rates for the fiscal years ended March 31, 2016, 2015 and 2014 were 42.4%, 33.9% and 34.1%, respectively. The current year tax rate was higher, compared to the prior years, as a result of transaction costs incurred with the Share Distribution that are not deductible for tax purposes, a reserve for uncertain tax positions and acquisition-related costs. Other items impacting the effective tax rate include foreign operations activities in countries with lower statutory rates and domestic operations activity in states with higher statutory rates.
79
Table of Contents
CSW INDUSTRIALS, INC
NOTES TO CONSOLIDATED FINANCIAL STATEMENTS
The tax effects of temporary differences that give rise to significant portions of the deferred tax assets and deferred tax liabilities at March 31 are presented below (in thousands):
| As of March 31, | ||||||||
| 2016 | 2015 | |||||||
| Deferred tax assets: |
||||||||
| Inventory reserves |
$ | 2,319 | $ | 1,540 | ||||
| Accrued compensation |
1,712 | 694 | ||||||
| Accrued expenses |
370 | 138 | ||||||
| Net operating loss carryforwards |
160 | — | ||||||
| Pension and other employee benefits |
38 | 8,370 | ||||||
| Other, net |
2,289 | 1,119 | ||||||
|
|
|
|
|
|||||
| Deferred tax assets |
6,888 | 11,861 | ||||||
| Valuation allowance |
(107 | ) | — | |||||
|
|
|
|
|
|||||
| Deferred tax assets, net of valuation allowance |
6,781 | 11,861 | ||||||
|
|
|
|
|
|||||
| Deferred tax liabilities: |
||||||||
| Property, plant and equipment |
(5,819 | ) | (4,239 | ) | ||||
| Goodwill and intangible assets |
(2,567 | ) | (1,473 | ) | ||||
| FIN 48 liability |
(1,277 | ) | — | |||||
| 1031 Exchanges |
(716 | ) | (460 | ) | ||||
| Other, net |
(195 | ) | (38 | ) | ||||
|
|
|
|
|
|||||
| Deferred tax liabilities |
(10,574 | ) | (6,210 | ) | ||||
|
|
|
|
|
|||||
| Net deferred tax (liabilities) assets |
$ | (3,793 | ) | $ | 5,651 | |||
|
|
|
|
|
|||||
As of March 31, 2016, we had $0.2 million in tax effected net operating loss carryforwards. Net operating loss carryforwards will expire in periods beyond the next five years. No provision is made for U.S. income and foreign withholding taxes applicable to undistributed earnings of certain foreign entities since these earnings are considered to be permanently reinvested.
A reconciliation of the beginning and ending amount of unrecognized tax benefits is as follows (in thousands):
| Balance at March 31, 2015 |
$ | — | ||
| Increases related to prior year tax positions |
900 | |||
|
|
|
|||
| Balance at March 31, 2016 |
$ | 900 | ||
|
|
|
We have accrued interest and penalties on uncertain tax positions of $0.2 million and $0.2 million, respectively for the year ended March 31, 2016. We did not recognize any interest and penalties for uncertain tax positions for the fiscal years ended March 31, 2015 or 2014. We are currently not under examination for any of our U.S. federal income taxes. For the fiscal year ended March 31, 2016, as a member of a controlled group, our subsidiaries were allocated certain federal tax brackets such that $10.0 million was taxed at 34%.
| 13. | RELATED PARTY TRANSACTIONS |
We paid $0.2 million, $0.5 million and $0.5 million in management fees for the fiscal years ended March 31, 2016, 2015 and 2014 to a management company subsidiary of Capital Southwest for services rendered
80
Table of Contents
CSW INDUSTRIALS, INC
NOTES TO CONSOLIDATED FINANCIAL STATEMENTS
during each respective fiscal year. These amounts are presented in Selling, general and administrative expenses in the consolidated income statements, and payments ceased in connection with the Share Distribution.
We paid $0.3 million, $8.3 million and $8.7 million in dividends to Capital Southwest during the fiscal years ended March 31, 2016, 2015 and 2014, respectively, as Capital Southwest was our sole shareholder until the Share Distribution.
As of March 31, 2016, 907,748 shares of Capital Southwest stock were held under the ESOP and 52,570 shares of Capital Southwest stock were held in the Qualified Plan.
Tax Matters Agreement – We entered into a tax matters agreement with Capital Southwest (the “Tax Matters Agreement”). The Tax Matters Agreement generally governs our and Capital Southwest’s respective rights, responsibilities and obligations with respect to taxes in connection with the Share Distribution. The Tax Matters Agreement provides that we will be liable for taxes incurred by Capital Southwest as a result of our taking or failing to take certain actions that result in the Share Distribution failing to meet the requirements of a tax-free distribution under the Internal Revenue Code. The Tax Matters Agreement also restricts our and Capital Southwest’s ability to take actions that could cause the Share Distribution to fail to meet the requirements of a tax-free distribution under the Code. These restrictions may prevent us and Capital Southwest from entering into transactions that might be advantageous to us or our stockholders. The term of the Tax Matters Agreement is perpetual, unless the agreement is terminated by mutual consent of both parties.
Employee Matters Agreement – We entered into an employee matters agreement with Capital Southwest prior to the Distribution Date (the “Employee Matters Agreement”). The Employee Matters Agreement allocates liabilities and responsibilities between us and Capital Southwest relating to employee compensation and benefit plans and programs, including the treatment of certain employment agreements, outstanding annual and long-term incentive awards, and health and welfare benefit obligations and provide for the cooperation between us and Capital Southwest in the sharing of employee information.
In general, following the Share Distribution, we will be responsible for all employment and benefit-related obligations and liabilities related to those individuals employed by Capital Southwest or one of the contributed businesses prior to the Share Distribution and whose employment was transferred to us in connection with the Share Distribution. In general, Capital Southwest will be responsible for any employment and benefit-related obligations and liabilities of any employees who continue to be employees of Capital Southwest following the Share Distribution. The term of the Employee Matters Agreement is perpetual, unless the agreement is terminated by mutual consent of both parties.
| 14. | CONTINGENCIES |
From time to time, we are involved in various claims and legal actions which arise in the ordinary course of business. There are not any matters pending that we currently believe are reasonably possible of having a material impact to our business, consolidated financial position, results of operations or cash flows.
81
Table of Contents
CSW INDUSTRIALS, INC
NOTES TO CONSOLIDATED FINANCIAL STATEMENTS
| 15. | OTHER COMPREHENSIVE INCOME |
The following table provides an analysis of the changes in accumulated other comprehensive income (loss) (in thousands).
| Fiscal Years Ended March 31, |
||||||||
| 2016 | 2015 | |||||||
| Currency translation adjustments: |
||||||||
| Balance at beginning of period |
$ | (3,877 | ) | $ | 1,400 | |||
| Adjustments for foreign currency translation |
(1,371 | ) | (5,277 | ) | ||||
|
|
|
|
|
|||||
| Balance at end of period |
$ | (5,248 | ) | $ | (3,877 | ) | ||
|
|
|
|
|
|||||
| Interest rate swaps: |
||||||||
| Balance at beginning of period |
$ | (1,206 | ) | $ | — | |||
| Unrealized gains, net of taxes of $219 and $649, respectively |
(407 | ) | (1,206 | ) | ||||
| Reclassification of losses included in interest expense, net, net of taxes of $(211) |
392 | — | ||||||
|
|
|
|
|
|||||
| Other comprehensive income (loss) |
(15 | ) | (1,206 | ) | ||||
|
|
|
|
|
|||||
| Balance at end of period |
$ | (1,221 | ) | $ | (1,206 | ) | ||
|
|
|
|
|
|||||
| Defined benefit plans: |
||||||||
| Balance at beginning of period |
$ | (5,210 | ) | $ | 1,097 | |||
| Amortization of net prior service benefit, net of taxes of $11 and $16, |
(21 | ) | (30 | ) | ||||
| Amortization of net loss, net of taxes of $(11) and $(47), respectively (a) |
20 | 88 | ||||||
| Net loss arising during the year, net of tax of $411 and $3,427, respectively |
(764 | ) | (6,365 | ) | ||||
| Impact of Share Distribution, net of tax of $251 |
(467 | ) | — | |||||
| Curtailment, net of taxes of $(2,807) |
5,213 | — | ||||||
|
|
|
|
|
|||||
| Other comprehensive income (loss) |
3,981 | (6,307 | ) | |||||
|
|
|
|
|
|||||
| Balance at end of period |
$ | (1,229 | ) | $ | (5,210 | ) | ||
|
|
|
|
|
|||||
| (a) | Amortization of prior service costs and actuarial losses out of accumulated other comprehensive loss are included in the computation of net periodic pension expenses. See Note 11 for additional information. |
| 16. | SEGMENTS |
As described in Note 1, we conduct our operations through three business segments:
| • | Industrial Products; |
| • | Coatings, Sealants & Adhesives; and |
| • | Specialty Chemicals. |
82
Table of Contents
CSW INDUSTRIALS, INC
NOTES TO CONSOLIDATED FINANCIAL STATEMENTS
The following is a summary of the financial information of our reporting segments reconciled to the amounts reported in the consolidated financial statements.
Year ended March 31, 2016
| (in thousands) | Industrial Products |
Coatings, Sealants and Adhesives |
Specialty Chemicals |
Subtotal – Reportable Segments |
Eliminations and Other |
Total | ||||||||||||||||||
| Revenues, net |
$ | 138,594 | $ | 106,035 | $ | 74,930 | $ | 319,559 | $ | 272 | $ | 319,831 | ||||||||||||
| Operating income |
31,075 | 10,911 | 12,490 | 54,476 | (6,990 | ) | 47,486 | |||||||||||||||||
Year ended March 31, 2015
| (in thousands) | Industrial Products |
Coatings, Sealants and Adhesives |
Specialty Chemicals |
Subtotal – Reportable Segments |
Eliminations and Other |
Total | ||||||||||||||||||
| Revenues, net |
$ | 118,422 | $ | 52,119 | $ | 89,738 | $ | 260,279 | $ | 1,555 | $ | 261,834 | ||||||||||||
| Operating income |
19,711 | 11,420 | 13,016 | 44,147 | (113 | ) | 44,034 | |||||||||||||||||
Year ended March 31, 2014
| (in thousands) | Industrial Products |
Coatings, Sealants and Adhesives |
Specialty Chemicals |
Subtotal – Reportable Segments |
Eliminations and Other |
Total | ||||||||||||||||||
| Revenues, net |
$ | 93,043 | $ | 46,950 | $ | 90,744 | $ | 230,737 | $ | 976 | $ | 231,713 | ||||||||||||
| Operating income |
12,593 | 9,360 | 15,877 | 37,830 | 83 | 37,913 | ||||||||||||||||||
Total Assets
| (in thousands) | Industrial Products |
Coatings, Sealants and Adhesives |
Specialty Chemicals |
Subtotal – Reportable Segments |
Eliminations and Other |
Total | ||||||||||||||||||
| March 31, 2016 |
$ | 154,583 | $ | 128,886 | $ | 97,539 | $ | 381,008 | $ | 11,252 | $ | 392,260 | ||||||||||||
| March 31, 2015 |
137,148 | 42,010 | 95,389 | 274,547 | 11,974 | 286,521 | ||||||||||||||||||
| March 31, 2014 |
121,925 | 40,986 | 90,213 | 253,124 | 24,696 | 277,820 | ||||||||||||||||||
Geographic information – We attribute sales to different geographic areas based on the destination of the product or service delivery. Long-lived assets are classified based on the geographic area in which the assets are located and exclude deferred taxes. No individual country, except for the U.S., accounted for more than 10% of consolidated net revenues or total long-lived assets.
Sales and long-lived assets by geographic area are as follows (in thousands, except percent data):
| For the Years Ended March 31, | ||||||||||||||||||||||||
| 2016 | 2015 | 2014 | ||||||||||||||||||||||
| U.S. |
$ | 257,941 | 80.6 | % | $ | 197,944 | 75.6 | % | $ | 168,473 | 72.7 | % | ||||||||||||
| Non-U.S. (a) |
61,890 | 19.4 | % | 63,890 | 24.4 | % | 63,240 | 27.3 | % | |||||||||||||||
|
|
|
|
|
|
|
|
|
|
|
|
|
|||||||||||||
| Revenues, net |
$ | 319,831 | 100.0 | % | $ | 261,834 | 100.0 | % | $ | 231,713 | 100.0 | % | ||||||||||||
|
|
|
|
|
|
|
|
|
|
|
|
|
|||||||||||||
83
Table of Contents
CSW INDUSTRIALS, INC
NOTES TO CONSOLIDATED FINANCIAL STATEMENTS
| (a) | No individual country within this group represents 10% or more of consolidated totals for any period presented. |
| As of March 31, | ||||||||||||||||||||||||
| 2016 | 2015 | 2014 | ||||||||||||||||||||||
| U.S. |
$ | 220,878 | 94.4 | % | $ | 134,117 | 90.3 | % | $ | 135,296 | 90.9 | % | ||||||||||||
| Non-U.S. |
12,990 | 5.6 | % | 14,457 | 9.7 | % | 13,572 | 9.1 | % | |||||||||||||||
|
|
|
|
|
|
|
|
|
|
|
|
|
|||||||||||||
| Long-lived assets (a) |
$ | 233,868 | 100.0 | % | $ | 148,574 | 100.0 | % | $ | 148,868 | 100.0 | % | ||||||||||||
|
|
|
|
|
|
|
|
|
|
|
|
|
|||||||||||||
| (a) | Long-lived assets consists primarily of property, plant and equipment, intangible assets, goodwill and other assets, net of deferred taxes. |
Major customer information – We have a large number of customers across our locations and do not believe that we have sales to any individual customer that represent 10% or more of consolidated net revenues for any of the fiscal years presented.
| 17. | QUARTERLY FINANCIAL DATA (UNAUDITED) |
The following presents a summary of the unaudited quarterly data for the fiscal years ending March 31, 2016 and 2015 (amounts in millions, except per share data):
| Fiscal Year ended March 31, 2016 | ||||||||||||||||
| Quarter |
4th | 3rd | 2nd | 1st | ||||||||||||
| Revenues, net |
$ | 76.3 | $ | 70.9 | $ | 83.7 | $ | 88.9 | ||||||||
| Gross profit |
34.6 | 32.1 | 40.8 | 40.4 | ||||||||||||
| Income before income taxes |
6.0 | 4.8 | 19.8 | 13.6 | ||||||||||||
| Net income |
1.8 | 2.0 | 13.0 | 8.7 | ||||||||||||
| Net earnings per common share (a)(b): |
||||||||||||||||
| Basic |
$ | 0.12 | $ | 0.13 | $ | 0.83 | $ | 0.56 | ||||||||
| Diluted |
0.12 | 0.13 | 0.83 | 0.55 | ||||||||||||
| Fiscal Year ended March 31, 2015 | ||||||||||||||||
| Quarter |
4th | 3rd | 2nd | 1st | ||||||||||||
| Revenues, net |
$ | 64.0 | $ | 60.9 | $ | 68.1 | $ | 68.8 | ||||||||
| Gross profit |
30.7 | 28.7 | 33.2 | 33.8 | ||||||||||||
| Income before income taxes |
8.0 | 9.8 | 12.6 | 14.5 | ||||||||||||
| Net income |
5.4 | 6.4 | 8.2 | 9.7 | ||||||||||||
| Net earnings per common share (a)(b): |
||||||||||||||||
| Basic |
$ | 0.34 | $ | 0.41 | $ | 0.53 | $ | 0.63 | ||||||||
| Diluted |
0.34 | 0.41 | 0.52 | 0.62 | ||||||||||||
| (a) | On September 30, 2015, 15.6 million CSWI common shares were distributed to Capital Southwest shareholders in connection with the Share Distribution. For comparative purposes, and to provide a more meaningful calculation for weighted average shares, this amount was assumed to be outstanding throughout all periods presented up to and including September 30, 2015 in the calculation of basic weighted average shares. In addition, for the dilutive weighted average share calculations, the dilutive securities outstanding at September 30, 2015 were also assumed to be outstanding throughout all periods presented up to and including September 30, 2015. |
| (b) | Net earnings per common share is computed independently for each of the quarters presented. The sum of the quarters may not equal the total year amount due to the impact of changes in weighted average quarterly shares outstanding. |
84
Table of Contents
ITEM 9: CHANGES IN AND DISAGREEMENTS WITH ACCOUNTANTS ON ACCOUNTING AND FINANCIAL DISCLOSURE
None
ITEM 9A: CONTROLS AND PROCEDURES
Disclosure Controls and Procedures
We carried out an evaluation, under the supervision and with the participation of our principal executive officer and principal financial officer, of the effectiveness of the design and operation of our disclosure controls and procedures (as defined in Rule 13a-15(e) of the Exchange Act) as of the end of the period covered by this Annual Report on Form 10-K for the year ended March 31, 2016 (“Annual Report”). Based on this evaluation, our principal executive officer and principal financial officer concluded that our disclosure controls and procedures were effective as of the end of the period covered by this Annual Report.
The design of any system of control is based upon certain assumptions about the likelihood of future events, and there can be no assurance that any design will succeed in achieving its stated objectives under all future events, no matter how remote, or that the degree of compliance with the policies or procedures may not deteriorate. Because of its inherent limitations, disclosure controls and procedures may not prevent or detect all misstatements. Accordingly, even effective disclosure controls and procedures can only provide reasonable assurance of achieving their control objectives.
Management’s Report on Internal Control Over Financial Reporting
This Annual Report does not include a report of management’s assessment regarding internal control over financial reporting (as defined in Rule 13a-l5(f) of the Exchange Act) or an attestation report of our independent registered public accounting firm due to a transition period established by the rules of the Securities and Exchange Commission (“SEC”) for newly public companies.
Changes in Internal Control over Financial Reporting
There have been no changes in our internal control over financial reporting that occurred during our most recent fiscal quarter that have materially affected, or are reasonably likely to materially affect, our internal control over financial reporting.
85
Table of Contents
PART III
ITEM 10: DIRECTORS, EXECUTIVE OFFICERS AND CORPORATE GOVERNANCE
The information required by this item is incorporated by reference to our Proxy Statement for the 2016 Annual Meeting of Stockholders to be filed with the SEC within 120 days after the fiscal year ended March 31, 2016.
ITEM 11: EXECUTIVE COMPENSATION
The information required by this item is incorporated by reference to our Proxy Statement for the 2016 Annual Meeting of Stockholders to be filed with the SEC within 120 days after the fiscal year ended March 31, 2016.
ITEM 12: SECURITY OWNERSHIP OF CERTAIN BENEFICIAL OWNERS AND MANAGEMENT AND RELATED STOCKHOLDER MATTERS
The information required by this item is incorporated by reference to our Proxy Statement for the 2016 Annual Meeting of Stockholders to be filed with the SEC within 120 days after the fiscal year ended March 31, 2016.
ITEM 13: CERTAIN RELATIONSHIPS AND RELATED TRANSACTIONS, AND DIRECTOR INDEPENDENCE
The information required by this item is incorporated by reference to our Proxy Statement for the 2016 Annual Meeting of Stockholders to be filed with the SEC within 120 days after the fiscal year ended March 31, 2016.
ITEM 14: PRINCIPAL ACCOUNTING FEES AND SERVICES
The information required by this item is incorporated by reference to our Proxy Statement for the 2016 Annual Meeting of Stockholders to be filed with the SEC within 120 days after the fiscal year ended March 31, 2016.
86
Table of Contents
PART IV
ITEM 15: EXHIBITS AND FINANCIAL STATEMENT SCHEDULES
The following documents are filed as a part of this Annual Report on Form 10-K:
| (1) Consolidated Financial Statements |
||||
| 45 | ||||
| CSW Industrials, Inc. Consolidated Financial Statements: |
||||
| 46 | ||||
| For each of the three years in the period ended March 31, 2016: |
||||
| 47 | ||||
| 47 | ||||
| 48 | ||||
| 49 | ||||
| 50 | ||||
| (2) | Financial Statement Schedules |
None.
| (3) | Exhibits |
The exhibits listed on the accompanying Exhibit Index are filed or incorporated by reference as part of this Annual Report on Form 10-K.
87
Table of Contents
Pursuant to the requirements of the Securities Exchange Act of 1934, this Annual Report on Form 10-K has been signed by the following persons in the capacities and on the dates indicated:
| Date: June 8, 2016 |
CSW INDUSTRIALS, INC. | |||||
| By: | /s/ Joseph B. Armes | |||||
| Joseph B. Armes | ||||||
| Chairman and Chief Executive Officer | ||||||
Pursuant to the requirements of the Securities Exchange Act of 1934, this Annual Report on Form 10-K has been signed by the following persons in the capacities and on the dates indicated:
| Name |
Title |
Date | ||
| /s/ Joseph B. Armes Joseph B. Armes |
Chairman and Chief Executive Officer (Principal Executive Officer) |
June 8, 2016 | ||
| /s/ Kelly Tacke Kelly Tacke |
Chief Financial Officer (Principal Financial and Accounting Officer) |
June 8, 2016 | ||
| /s/ Michael R. Gambrell Michael R. Gambrell |
Director |
June 8, 2016 | ||
| /s/ Linda A. Livingstone Linda A. Livingstone, Ph.D. |
Director |
June 8, 2016 | ||
| /s/ William F. Quinn William F. Quinn |
Director |
June 8, 2016 | ||
| /s/ Robert M. Swartz Robert M. Swartz |
Director |
June 8, 2016 | ||
88
Table of Contents
| EXHIBIT NUMBER |
DESCRIPTION | |
| 2.1 | Distribution Agreement (incorporated by reference to Exhibit 2.1 to the Company’s Registration Statement on Form 10, filed on September 9, 2015) | |
| 2.2 | Asset Purchase Agreement by and among Strathmore Holdings, LLC, Strathmore Products, Inc., Strathmore Products of Longview, LLC, Strathmore Products of Houston, LLC, SP Waller, LLC, Eric T. Burr and William M. Udovich and the Whitmore Manufacturing Company, effective as of April 1, 2015 (incorporated by reference to Exhibit 2.2 to the Company’s Registration Statement on Form 10, filed on July 21, 2015) | |
| 3.1 | Amended and Restated Certificate of Incorporation of the Company (incorporated by reference to Exhibit 3.1 to the Company’s Registration Statement on Form 10, filed on September 9, 2015) | |
| 3.2 | Amended and Restated Bylaws of the Company (incorporated by reference to Exhibit 3.2 to the Company’s Registration Statement on Form 10, filed on September 9, 2015) | |
| 10.1 | Tax Matters Agreement dated as of September 8, 2015 (incorporated by reference to Exhibit 10.1 to the Company’s Registration Statement on Form 10, filed on September 9, 2015) | |
| 10.2 | Amended and Restated Employment Matters Agreement, dated as of September 14, 2015, by and between Capital Southwest Corporation and CSW Industrials, Inc. (incorporated by reference to Exhibit 10.2 to the Company’s Quarterly Report on Form 10-Q, filed on November 16, 2015) | |
| 10.3 | Credit Agreement, dated as of December 11, 2015, among CSW Industrials, Inc., CSW Industrials Holdings, Inc. and The Whitmore Manufacturing Company and the lenders identified therein. (incorporated by reference to Exhibit 10.1 to the Company’s Current Report on Form 8-K, filed on December 17, 2015) | |
| 10.4 | Form of Director and Officer Indemnification Agreement (incorporated by reference to Exhibit 10.5 to Amendment No. 3 to the Company’s Registration Statement on Form 10, filed on August 28, 2015) | |
| 10.5 | CSW Industrials, Inc. 2015 Equity and Incentive Compensation Plan (incorporated by reference to Exhibit 10.6 to the Company’s Registration Statement on Form 10, filed on September 9, 2015) + | |
| 10.6 | Employment agreement by and between CSW Industrials, Inc. and Joseph Armes, dated October 1, 2015 (incorporated by reference to Exhibit 10.1 to the Company’s Quarterly Report on Form 10-Q, filed on February 16, 2016) + | |
| 10.7 | Form of Employee Restricted Stock Award Agreement (time vesting) (incorporated by reference to Exhibit 10.2 to the Company’s Quarterly Report on Form 10-Q, filed on February 16, 2016) + | |
| 10.8 | Form of Employee Restricted Stock Award Agreement (performance vesting) (incorporated by reference to Exhibit 10.3 to the Company’s Quarterly Report on Form 10-Q, filed on February 16, 2016) + | |
| 10.9 | Form of Non-Employee Director Restricted Stock Award (time vesting) (incorporated by reference to Exhibit 10.4 to the Company’s Quarterly Report on Form 10-Q, filed on February 16, 2016) + | |
| 10.10 | Form of Incentive Stock Option Right Award Agreement (replacement award agreement) (incorporated by reference to Exhibit 10.5 to the Company’s Quarterly Report on Form 10-Q, filed on February 16, 2016) + | |
| 10.11 | Form of Non-Qualified Stock Option Right Award Agreement (replacement award agreement) (incorporated by reference to Exhibit 10.6 to the Company’s Quarterly Report on Form 10-Q, filed on February 16, 2016) + | |
89
Table of Contents
| EXHIBIT NUMBER |
DESCRIPTION | |
| 10.12 | Form of Restricted Share Award Agreement (replacement award agreement) (incorporated by reference to Exhibit 10.7 to the Company’s Quarterly Report on Form 10-Q, filed on February 16, 2016) + | |
| 10.13 | Form of Non-Qualified Stock Option Right Award Agreement (executive compensation plan – replacement award agreement) (incorporated by reference to Exhibit 10.8 to the Company’s Quarterly Report on Form 10-Q, filed on February 16, 2016) + | |
| 10.14 | Form of Restricted Share Award Agreement (executive compensation plan – replacement award agreement) (incorporated by reference to Exhibit 10.9 to the Company’s Quarterly Report on Form 10-Q, filed on February 16, 2016) + | |
| 10.15* | Consulting Agreement between CSW Industrials, Inc. and GamCo, LLC. + | |
| 10.16* | Form of Executive Officer Severance Agreement + | |
| 21.1* | List of subsidiaries of the Company | |
| 23.1* | Consent of Grant Thornton LLP | |
| 31.1* | Certification of Principal Executive Officer pursuant to Exchange Act Rules 13a-14(a) and 15d-14(a), as adopted pursuant to Section 302 of the Sarbanes-Oxley Act of 2002. | |
| 31.2* | Certification of Principal Financial Officer pursuant to Exchange Act Rules 13a-14(a) and 15d-14(a), as adopted pursuant to Section 302 of the Sarbanes-Oxley Act of 2002. | |
| 32.1** | Certification of Principal Executive Officer pursuant to 18 U.S.C. Section 1350, as adopted pursuant to Section 906 of the Sarbanes-Oxley Act of 2002. | |
| 32.2** | Certification of Principal Financial Officer pursuant to 18 U.S.C. Section 1350, as adopted pursuant to Section 906 of the Sarbanes- Oxley Act of 2002 | |
| 101.INS | XBRL Instance Document | |
| 101.SCH | XBRL Taxonomy Extension Schema | |
| 101.CAL | XBRL Taxonomy Extension Calculation Linkbase Document | |
| 101.DEF | XBRL Taxonomy Extension Definition Linkbase Document | |
| 101.LAB | XBRL Taxonomy Extension Label Linkbase Document | |
| 101.PRE | XBRL Taxonomy Extension Presentation Linkbase Document | |
| * | Filed herewith |
| ** | Furnished herewith |
| + | Management contracts and compensatory plans required to be filed as exhibits to this Annual Report on Form 10-K. |
90