Attached files
| file | filename |
|---|---|
| EX-99.2 - EX-99.2 - CVR PARTNERS, LP | d203893dex992.htm |
| 8-K - 8-K - CVR PARTNERS, LP | d203893d8k.htm |
Exhibit 99.1
Unless the context otherwise requires, references to the “Issuers” refer to CVR Partners, LP and CVR Nitrogen Finance Corporation and references to “we,” “our,” “us,” and the “Partnership” refer to CVR Partners and its subsidiaries, except as specifically noted otherwise.
Our Company
Overview
We are a master limited partnership formed by CVR Energy (NYSE: CVI) to own, operate and grow our nitrogen fertilizer business. Our common units are listed on the New York Stock Exchange (NYSE: UAN) and we had an equity market capitalization of $1,039 million as of May 27, 2016. We are structured as a variable distribution master limited partnership and as such we do not have a targeted minimum quarterly cash distribution. Instead, the amount of our quarterly cash distributions vary both quarterly and annually based upon the performance of our business. We principally produce ammonia and urea ammonium nitrate (UAN), an aqueous solution of urea and ammonium nitrate. Our products are used by farmers to improve the yield and quality of their crops, primarily corn and wheat.
We produce our nitrogen fertilizer products at two manufacturing facilities located in Coffeyville, Kansas and East Dubuque, Illinois. We acquired the East Dubuque, Illinois facility in April 2016 through our acquisition of Rentech Nitrogen Partners, L.P. The acquisition has substantially increased our scale, reduced single facility risk and geographically diversified our operations and marketing footprint to include the Mid Corn Belt, the largest market in the United States for direct application of nitrogen fertilizer products. On a pro forma basis, after giving effect to the acquisition of our East Dubuque Facility, for the twelve months ended March 31, 2016, we would have generated net sales, net income, Adjusted EBITDA and Adjusted EBITDA minus capital expenditures of $468.7 million, $49.4 million, $195.9 million and $147.7 million. Adjusted EBITDA including the impacts of the anticipated $12.0 million of synergies from the Merger would have been $207.9 million. For a reconciliation of Adjusted EBITDA to net income, see “—Summary Historical and Pro Forma Consolidated Financial Data—CVR Partners.”
We are a leading North American producer and distributor of nitrogen fertilizers, with a presence extending from the Southern Plains to the Mid Corn Belt regions of the United States. These farming regions have some of the best growing conditions in the world for corn and wheat and the proximity of our manufacturing facilities to these regions provides us with a cost advantage compared to certain of our competitors. Our products are delivered to customers primarily by rail or truck, which allows us to maximize our geographic footprint and provides flexibility to sell product at the highest available netback pricing. In 2015, our facilities delivered a combined total of approximately 1.5 million tons of nitrogen fertilizer, primarily to retailers and distributors.
Our presence in the Southern Plains region will be enhanced through the recent agreement with LSB Industries that will allow us to market UAN from its Pryor, Oklahoma facility, commencing on June 1, 2016. The ability to offer product from three production facilities to a broad geographic area will allow us to create value for our customers, particularly large retailers and distributors that prefer to buy in scale for delivery throughout their network.
Coffeyville Facility
Our Coffeyville Facility is the only fertilizer facility in North America that utilizes a gasification process to convert petroleum coke, or pet coke, to hydrogen for subsequent conversion to ammonia and UAN. The pet coke used is a byproduct of the crude oil refining process. We currently purchase most of our pet coke from CVR Refining (NYSE: CVRR), which owns the Coffeyville refinery adjacent to our fertilizer plant. During the past five years, over 70% of the pet coke consumed by our plant was produced and supplied by CVR Refining pursuant to a long-term agreement. We believe our relationship with CVR Refining provides us with the benefit of a stable and secure raw material supply and there are other Midwestern refineries and pet coke brokers with ample supply available in proximity to the Coffeyville Facility. The Coffeyville Facility includes a 1,300 ton-per-day ammonia unit, a 3,000 ton-per-day UAN unit and a gasifier complex having a capacity of 89 million standard cubic feet per day of hydrogen.
1
In February 2013 we completed a significant two-year expansion at the Coffeyville Facility that increased our annual UAN production capacity by 400,000 tons, or approximately 50%. Subsequent to this expansion, we upgrade substantially all of the ammonia we produce at our Coffeyville Facility to UAN fertilizer, which has historically commanded a premium price over ammonia on a nutrient ton basis. In 2015, our Coffeyville Facility produced 385,400 tons of ammonia, of which approximately 96% was upgraded to produce 928,600 tons of UAN. Typically, approximately 0.41 tons of ammonia is required to produce one ton of UAN.
The largest raw material expense used in the production of ammonia at the Coffeyville Facility is pet coke. For the year ended December 31, 2015, we incurred approximately $11.9 million for pet coke, which represented 6.9% of the operating costs and expenses of our Coffeyville Facility. Major fixed costs include electrical energy, employee labor, maintenance (including contract labor) and outside services. Consistent, safe and reliable operations are critical to our financial performance. Over the past five years, the average on-stream factors of the gasification, ammonia and UAN plants at our Coffeyville Facility have been greater than 90%. The plant requires a scheduled maintenance turnaround approximately every two to three years, which generally lasts 14 to 21 days. The plant underwent a full facility turnaround in the third quarter of 2015 and the next scheduled turnaround is in the second half of 2017.
The primary geographic markets for our Coffeyville Facility fertilizer products are Kansas, Missouri, Nebraska, Iowa and Illinois in the Mid Corn Belt and Texas in the Southern Plains. The close proximity of our Coffeyville Facility to the Union Pacific mainline provides a cost advantage over certain of our competitors by reducing the costs of distributing our products to customers. The majority of the products we manufacture at our Coffeyville Facility (approximately 80% in 2015) are delivered by rail to destinations located principally on the Union Pacific railroad.
East Dubuque Facility
Our recently acquired East Dubuque Facility uses low-cost, North American natural gas to produce nitrogen fertilizer, primarily ammonia and UAN. The plant includes a 1,025 ton-per-day ammonia unit and a 1,100 ton-per-day UAN unit. The facility is located on a 210-acre, 140-foot bluff above the Mississippi River, with access to the river for loading certain products. We are able to purchase natural gas at competitive prices due to the plant’s connection to the Northern Natural Gas interstate pipeline system, which is within one mile of the facility, and the ANR Pipeline Company pipeline. Over the last five years, U.S. natural gas reserves have increased significantly due to, among other factors, advances in extracting shale gas, which have reduced and stabilized natural gas prices, significantly lowering our production costs.
The East Dubuque Facility has the flexibility to significantly vary its product mix. This enables us to upgrade our ammonia production into varying amounts of UAN, nitric acid and liquid and granulated urea each season, depending on market demand, pricing and storage availability. Product sales are heavily weighted toward sales of ammonia and UAN, which together made up 80% or more of the plant’s total revenues for the years ended December 31, 2015, 2014 and 2013. In 2015, the plant produced 340,300 tons of ammonia, of which approximately 34% was upgraded to produce 279,000 tons of UAN.
The principal raw material utilized by our East Dubuque Facility is natural gas. For the year ended December 31, 2015, the East Dubuque Facility incurred expenses of approximately $43.5 million for natural gas, which represented approximately 47% of the operating costs and expenses (excluding depreciation and amortization) of our East Dubuque Facility. Historically, the plant has required a planned maintenance turnaround every two to three years. Turnarounds generally last between 15 and 30 days. We began the 2016 turnaround on May 21, 2016. The turnaround coincides with the completion of the ammonia converter project, which is expected to add approximately 50 tons per day of ammonia production capacity, and is expected to be completed before the end of the second quarter of 2016.
The East Dubuque Facility is located in northwest Illinois, in the Mid Corn Belt. The plant primarily sells its product to customers located within 200 miles of the facility, as Illinois and Iowa have been the two largest corn producing and nitrogen fertilizer consuming states for the last 20 years, according to the USDA. In most instances, customers take delivery of nitrogen products at the plant and arrange and pay to transport them to their final destinations by truck. Our East Dubuque Facility has
2
on-site storage capacity of 60,000 tons of ammonia and 80,000 tons of UAN. The combination of the plant’s proximity to customers and storage capacity allows for better timing of the pick-up and application of products, as shipments from more distant locations have a greater risk of missing the short periods of favorable weather conditions during which the application of nitrogen fertilizer may occur. The plant also benefits from its location on the Mississippi River, with direct access to a barge dock as well as a nearby rail spur serviced by the Canadian National Railway Company.
Our Competitive Strengths
Strategically Located Assets. Our nitrogen fertilizer plants, located in Coffeyville, Kansas and East Dubuque, Illinois, provide geographical advantages in that we are located in the Mid Corn Belt and close to the Southern Plains. According to the USDA, Iowa, Illinois, Kansas and Nebraska accounted for approximately 50% of total U.S. corn production in 2015. Together these states represented 75% of total delivered tons from the Coffeyville and East Dubuque plants for 2015. Both regions consume more nitrogen fertilizer than they produce, requiring product to be imported from the U.S. Gulf Coast and international producers. The plants’ markets are highly attractive because of their strong and growing demand for nitrogen fertilizer. Nitrogen fertilizer prices in these regions factor in the transportation costs of out-of-region producers. As a result of our close proximity to these agricultural markets, our transportation cost advantage allows us to cost-effectively sell substantially all of our products at a high margin. In addition, our on-site storage facilities allow for better timing of product pickup and application by customers across both regions.
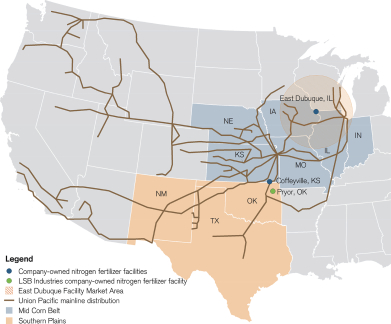
The following map shows the location of our two production facilities and LSB Industries’ Pryor, OK facility where we have a UAN marketing arrangement. It also shows the broad distribution footprint of these facilities, accessible either by rail or truck. The ability to offer product from three production facilities to this broad geographic area will allow us to create additional value for our customers going forward, particularly large retailers and distributors that prefer to buy in scale for delivery throughout their network.
Map of Operations
3
Leading North American producer and distributor of nitrogen fertilizer products. We are a leading North American producer and distributor of nitrogen fertilizers. We derive substantially all of our revenue from the production and sale of nitrogen fertilizers, primarily in the agricultural market, whereas many of our competitors are meaningfully diversified into other crop nutrients, such as phosphate and potassium, and make significant sales into the lower-margin industrial market. Nitrogen is an essential element for plant growth as it is the primary determinant of crop yield. Nitrogen fertilizer production is a higher margin, growing business with more stable demand compared to the production of the two other essential crop nutrients, potassium and phosphate, because nitrogen must be reapplied annually. From 2004 to 2013, US nitrogen fertilizer consumption grew at a Compound Annual Growth Rate of 0.91%, compared to 0.30% and 0.10% for potassium and phosphate, respectively.
Historical U.S. Fertilizer Consumption by Product
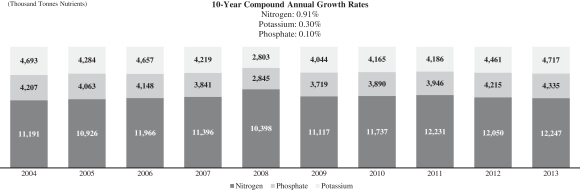
Source: International Fertilizer Industry Association database. Product categories include both straight and compound products.
Asset Diversification Enhances Flexibility and Reduces Operational Risk. We produce nitrogen fertilizer products out of strategically located assets located in Coffeyville, Kansas and East Dubuque, Illinois. We believe that the acquisition of the East Dubuque facility significantly enhances our business profile through:
| • | substantially increased scale with the addition of a second manufacturing facility that approximately doubles our production capacity and eliminates single facility risk, |
| • | greater geographic diversification with access to the attractive Mid Corn Belt market that typically experiences a pricing premium compared to other regions and, |
| • | feedstock diversification through the addition of a natural gas feedstock plant to our existing pet coke feedstock facility, |
History of High Average Net Sales Prices in the Mid Corn Belt and Southern Plains Regions. The locations of our East Dubuque and Coffeyville facilities generally enable us to realize higher average net sales prices per ton of UAN and ammonia than plants in other regions, because the prevailing prices in our markets reflect the cost to transport product into our market.
4
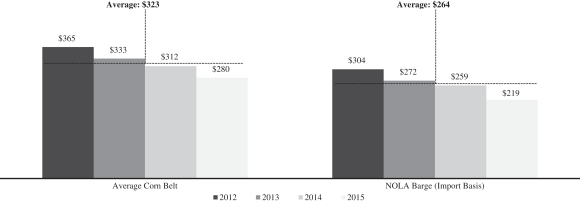
The chart below represents historical UAN prices (spot, UAN 32 equivalent basis) in the Corn Belt and Gulf Coast Region (NOLA Barge), according to data compiled by Blue Johnson.
The chart below represents historical ammonia spot prices in the Corn Belt and the Gulf Coast Region market (NOLA barge), according to data compiled by Blue Johnson.
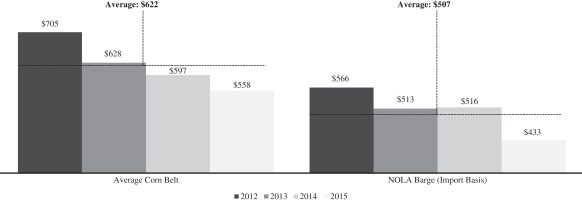
According to Blue Johnson, during the four years ended December 31, 2015, ammonia sold for a premium in the Corn Belt compared to the Gulf Coast Region. Over the four years ended December 31, 2015, the average Corn Belt spot price for ammonia was $622 per ton fob compared to $507 per ton fob in the Gulf Coast Region (NOLA Barge) market. UAN prices in the Corn Belt have also experienced a pricing premium compared to the Gulf Coast Region (NOLA Barge). For example, over the four years ended December 31, 2015, the average Corn Belt price for UAN was $323 per ton compared to $264 per ton in the Gulf Coast Region (NOLA Barge). Given the location of our Coffeyville and East Dubuque facilities, we typically realize pricing premiums for UAN and ammonia similar to the premiums in the Corn Belt and Southern Plains regions.
Favorable Long Term Industry Trends. According to a study funded by the FAO, global fertilizer demand is projected to increase by 45% between 2005 and 2030, primarily driven by population growth, decrease in farmland per capita, increased bio-fuel consumption and the continued evolution to more protein-based diets in developing countries. We believe that these trends are positive for nitrogen fertilizer products as nitrogen represents approximately 61% of total global fertilizer consumption. Nitrogen, along with phosphate and potash, are the primary crop nutrients utilized by producers to enhance the quality and yield of crops. Nutrients are depleted in soil over time and therefore must be replenished through fertilizer use. Nitrogen is the most quickly depleted nutrient and as a result must be replenished every year, whereas phosphate and potassium can be retained in
5
soil for up to three years. Given that nitrogen fertilizers must be applied annually and are generally the most important determinant of plant growth and crop yield, we believe demand for nitrogen fertilizers are more stable in nature. The United States has generally been a net importer of nitrogen products in order to meet fertilizer, industrial and other demand requirements. Although new capacity will continue to come online over the next several years, we believe that the additional capacity will be insufficient to fully displace imports, which will still be needed to meet domestic demand.
Experienced Management Team. We are managed by a highly experienced management team. Mark Pytosh, our President and Chief Executive Officer, has extensive industry experience having served in senior management roles in the energy, renewable energy and waste industries. Susan Ball, our Treasurer and Chief Financial Officer, has over 30 years of experience in finance and accounting and also serves the same roles at CVR Energy, Inc. and CVR Refining, LP. William White, Executive Vice President of Marketing and Operations, has nearly 40 years of experience in the chemical industry, including over 10 years with CVR Partners. John Lipinski, our Executive Chairman, has over 40 years of experience in the refining and chemicals industries and also serves as Chief Executive Officer, President and a Director of the general partner of CVR Refining, LP and Chief Executive Officer, President and a Director of CVR Energy, Inc. In addition, both our Coffeyville and East Dubuque facilities have very experienced senior operations and marketing teams which collectively have an average of over 35 years of experience in the fertilizer industry.
Our Business Strategy
Be a Low-Cost Producer. Our customers make their purchasing decisions principally on the basis of delivered price and availability of product. In order to deliver product in the most cost effective way for our customers, in an environment where price and raw material costs are largely market driven, we are focused on keeping our operating costs low. The critical focus area to minimize costs is to maximize on-stream rates. In recent years we have focused on preventative maintenance and critical spare parts to allow us to achieve high levels of online production.
Provide a High Level of Customer Service. We focus on providing our customers with the highest level of service. In addition to price, our customers value reliable on time deliveries. The recent acquisition of the East Dubuque Facility and our UAN marketing agreement with LSB Industries allow us to provide product in an expanded geographic area, which is important to our customers. Substantially all of our product shipments are targeted to freight advantaged destinations located in the Southern Plains and Mid Corn Belt, allowing us to quickly and reliably service customer demand. Furthermore, we maintain our own fleet of railcars, capable of safely transporting UAN and ammonia, which helps us ensure prompt delivery. We believe a continued focus on customer service will allow us to maintain relationships with existing customers and grow our business with new customers.
Continue to Focus on Safety and Training. We intend to continue our focus on safety and training in order to minimize accidents and injuries to our employees to improve the reliability and high on-stream availability of our plants. We have developed a series of comprehensive safety programs, involving active participation of employees at all levels of the organization, that are aimed at preventing recordable incidents.
Pursue Growth Opportunities. We intend to continue to expand our existing asset base and utilize the experience of our and CVR Energy’s management teams to expand production at existing facilities and acquire and build additional infrastructure and production assets.
| • | Organic Growth. Our facilities have undergone various expansion projects that have increased production and product upgrade capabilities. Our Coffeyville Facility completed a significant two-year plant expansion in 2013, designed to increase its UAN production capacity by 400,000 tons, or approximately 50% per year. Total capital expenditures associated with the UAN expansion were approximately $130 million. In December 2013, our East Dubuque Facility completed an ammonia production and storage capacity expansion project that increased the facility’s ammonia production capacity by 23%, or 190 tons per day and is in the process of installing a new ammonia converter that is expected to add approximately 50 tons per day of ammonia production capacity. Total capital expenditure associated |
6
| with these expansions is approximately $125 million. We intend to continue to evaluate additional opportunities to increase our profitability by expanding our production capabilities and product offerings. We expect to further increase our ammonia production in the second half of 2016 once the new hydrogen plant at CVR Refining’s adjacent refinery comes online. At that point, we expect to take enough hydrogen to allow for additional ammonia production of 50 to 75 tons per day. We expect the incremental ammonia will be sold into the fertilizer market and not upgraded to UAN because the plant is operating at or near its rated UAN capacity. |
| • | Selectively Pursue Accretive Acquisitions. The nitrogen fertilizer industry has undergone significant consolidation over the last decade as a result of mergers and acquisitions. We expect industry consolidation to continue, and intend to evaluate strategic acquisitions within the nitrogen fertilizer industry and to focus on disciplined and accretive investments that leverage our core strengths. |
Maintain a Conservative Financial Position. We intend to maintain a conservative total debt level. We are targeting a leverage multiple of 2.0x Adjusted EBITDA (mid-cycle) and believe that level is appropriate as a steady-state target debt level. We expect to reduce leverage from the level at closing of the notes offering through organic growth driven by improved operating efficiency and a recovery in nitrogen fertilizer prices. We plan to retain significant financial flexibility through our business cycles by maintaining liquidity through cash on hand and our anticipated ABL Credit Facility. Our policy is to distribute to our unitholders all of the cash available for distribution that we generate each quarter after debt service and maintenance capital needs, however as a variable distribution master limited partnership, we do not have a minimum quarterly distribution. Cash available for distribution is determined by the board of directors of our general partner and excludes reserves for future operating or capital needs, allowing us to maintain sufficient liquidity. Our conservative financial policy was demonstrated in the 2015 third quarter, when we did not pay a cash distribution as a result of unplanned plant downtime.
Recent Developments
The Merger
On April 1, 2016, we completed the merger whereby we acquired Rentech Nitrogen Partners, L.P. (“Rentech Nitrogen”) for total consideration of approximately $802 million exclusive of the fair value of noncontrolling interest (the “Merger”). Pursuant to the Merger we acquired our East Dubuque, Illinois nitrogen fertilizer facility. Rentech Nitrogen was required to sell or spin off its facility located in Pasadena, Texas (the “Pasadena Facility”) as a condition to closing of the Merger. On March 14, 2016, Rentech Nitrogen completed the sale of its subsidiary that owned the Pasadena Facility to a third party. The primary reasons for the Merger were to expand our geographic footprint, diversify our raw material feedstocks, widen our customer reach and increase our potential for cash-flow generation. We believe we can achieve annual run-rate synergies of at least $12 million, through reduced corporate overhead costs which includes associated public company costs and with expected improved production and overall enhanced efficiencies of marketing and related logistics efforts through the integration of the two standalone facilities and management teams.
Coffeyville Credit Facility
On April 1, 2016, in connection with the closing of the Merger, CVR Partners entered into the Coffeyville Credit Facility with Coffeyville, as the lender, which was used (i) to fund the repayment of amounts outstanding under the GE Credit Facility, (ii) to pay the cash consideration and fees and expenses in connection with the Merger and related transactions and (iii) to repay all of the loans outstanding under the previous CVR Partners credit agreement.
As of May 30, 2016, we had $300.0 million in outstanding borrowings under the Coffeyville Credit Facility. We intend to use a portion of the net proceeds from this offering of notes to repay in full and terminate the Coffeyville Credit Facility.
7
The 2021 Notes Tender Offer and Change of Control Offer
On April 29, 2016, we announced that our subsidiary, CVR Nitrogen, commenced a cash tender offer (the “Tender Offer”) to purchase any and all of the outstanding 2021 Notes. In connection with the Tender Offer, CVR Nitrogen is soliciting the consents (“Consents”) of holders of the 2021 Notes to certain proposed amendments (the “Consent Solicitation”) to the indenture governing the 2021 Notes (the “2021 Notes Indenture”) to eliminate or modify substantially all of the restrictive covenants relating to CVR Nitrogen and its subsidiaries, eliminate all events of default other than the failure to pay principal, premium or interest on the 2021 Notes, eliminate all conditions to satisfaction and discharge, and release the liens on the collateral securing the 2021 Notes (the “Proposed Amendments”). Concurrently with, but separate from the Tender Offer, CVR Nitrogen has commenced an offer to purchase for cash any and all of the 2021 Notes at a purchase price of 101% of the aggregate principal amount of the 2021 Notes (the “Change of Control Offer” and, together with the Tender Offer, the “Offers”).
According to information provided by Ipreo LLC, the Information and Tender Agent for the Tender Offer, as of 5:00 p.m., New York City time, on May 26, 2016, CVR Nitrogen had received tenders and Consents from holders of $315,245,000 in aggregate principal amount of the 2021 Notes, representing approximately 98.5% of the total outstanding principal amount of the 2021 Notes. CVR Nitrogen received the requisite consents in respect of the 2021 Notes in connection with the Consent Solicitation to the Proposed Amendments. As a result, CVR Nitrogen intends to execute a supplemental indenture relating to the 2021 Notes (the “Supplemental Indenture”) setting forth the Proposed Amendments. The Proposed Amendments will become operative upon payment for the tendered 2021 Notes pursuant to the terms of the Tender Offer and Consent Solicitation.
Any 2021 Notes that remain outstanding following the consummation of the Offers will continue to be obligations of CVR Nitrogen under the 2021 Notes Indenture. The 2021 Notes that remain outstanding will no longer have the benefit of restrictive covenants, reporting obligations and certain of the events of default and other provisions presently contained in the 2021 Notes Indenture and the liens on the collateral securing the 2021 Notes will be released. The Tender Offer will expire at 5:00 p.m., New York City time on June 8, 2016, unless extended or earlier terminated.
8
SUMMARY HISTORICAL AND PRO FORMA CONSOLIDATED FINANCIAL DATA—CVR PARTNERS
The following summary historical consolidated financial data as of and for each of the years ended December 31, 2013, 2014 and 2015 are derived from CVR Partners’ audited consolidated financial statements and the summary historical consolidated financial data as of and for the three months ended March 31, 2015 and 2016 are derived from CVR Partners’ unaudited condensed consolidated interim financial statements. You should read the following data in conjunction with “Management’s Discussion and Analysis of Financial Condition and Results of Operations” and the consolidated financial statements and the related notes thereto set forth in CVR Partners’ Annual Report on Form 10-K for the year ended December 31, 2015 and its Quarterly Report on Form 10-Q for the quarter ended March 31, 2016. You should not assume the results of operations for any past period indicate results for any future period.
The summary pro forma condensed combined balance sheet data as of March 31, 2016 has been prepared to give effect to the Merger as if it occurred on March 31, 2016. The summary unaudited pro forma condensed combined statements of operations data for the three months ended March 31, 2016, the year ended December 31, 2015 and the last twelve months ended March 31, 2016, has been prepared to give effect to the Merger as if it occurred on January 1, 2015. You should read the following pro forma data in conjunction with CVR Partners, LP unaudited pro forma financial statements included herein. The summary pro forma financial information was prepared using the acquisition method of accounting with the Partnership as the acquirer. Therefore, the historical basis of the Partnership’s assets and liabilities was not affected by the Merger. This pro forma financial information also gives effect to this offering and the intended use of proceeds therefrom (collectively with the Merger, the “transactions”).
For purposes of preparing the unaudited pro forma condensed combined balance sheet data as of March 31, 2016, CVR Nitrogen’s assets and liabilities have been recorded at their estimated fair values. The fair values assigned in these unaudited pro forma financial statements are preliminary and represent management’s estimate of fair value and are subject to revision. Pro forma adjustments are included only to the extent they are (i) directly attributable to the transactions, (ii) factually supportable, and (iii) with respect to the statement of operations, expected to have a continuing impact on the combined results. The accompanying summary pro forma financial information is presented for illustrative purposes only and is based on available information and assumptions the Partnership believes is reasonable. It does not purport to represent what the actual combined results of operations or the combined financial position of the Partnership would have been had the Merger occurred on the dates indicated, nor is it necessarily indicative of future combined results of operations or combined financial position. The actual financial position and results of operations will differ, perhaps significantly, from the pro forma amounts reflected herein due to a variety of factors, including access to additional information, final valuations and changes in operating results following the date of the pro forma financial statements.
9
| Historical | Pro Forma | |||||||||||||||||||||||||||||||||
| In millions, except as otherwise indicated | As of and for the Years Ended December 31, |
As of and for the Three Months Ended March 31, |
Year Ended December 31, |
Three Months Ended March 31, |
Last Twelve Months Ended March 31, |
|||||||||||||||||||||||||||||
| 2013 | 2014 | 2015 | 2015 | 2016 | 2015 | 2016 | 2016 | |||||||||||||||||||||||||||
| (unaudited) | (unaudited) | |||||||||||||||||||||||||||||||||
| Statement of Operations Data: |
||||||||||||||||||||||||||||||||||
| Net sales |
$ | 323.7 | $ | 298.7 | $ | 289.2 | $ | 93.1 | $ | 73.1 | $ | 490.5 | $ | 107.9 | $ | 468.7 | ||||||||||||||||||
| Cost of product sold |
58.1 | 72.0 | 65.2 | 25.8 | 16.3 | 95.3 | 19.1 | 86.3 | ||||||||||||||||||||||||||
| Direct operating expenses |
94.1 | 98.9 | 106.1 | 24.4 | 23.7 | 159.6 | 37.7 | 159.0 | ||||||||||||||||||||||||||
| Selling, general and administrative expenses |
21.0 | 17.7 | 20.8 | 4.6 | 6.4 | 35.4 | 8.2 | 35.4 | ||||||||||||||||||||||||||
| Depreciation and amortization |
25.6 | 27.3 | 28.4 | 6.8 | 7.0 | 78.5 | 19.0 | 84.5 | ||||||||||||||||||||||||||
|
|
|
|
|
|
|
|
|
|
|
|
|
|
|
|
|
|||||||||||||||||||
| Operating income |
124.9 | 82.8 | 68.7 | 31.5 | 19.7 | 121.7 | 23.9 | 103.5 | ||||||||||||||||||||||||||
|
|
|
|
|
|
|
|
|
|
|
|
|
|
|
|
|
|||||||||||||||||||
| Interest expense and other financing costs |
(6.3 | ) | (6.7 | ) | (7.0 | ) | (1.7 | ) | (1.7 | ) | (54.2 | ) | (13.4 | ) | (54.2 | ) | ||||||||||||||||||
| Other income (expense), net |
0.1 | — | 0.3 | — | — | 0.1 | 0.1 | 0.1 | ||||||||||||||||||||||||||
| Total other income (expense) |
(6.2 | ) | (6.7 | ) | (6.7 | ) | (1.7 | ) | (1.7 | ) | (54.1 | ) | (13.3 | ) | (54.1 | ) | ||||||||||||||||||
|
|
|
|
|
|
|
|
|
|
|
|
|
|
|
|
|
|||||||||||||||||||
| Income before income tax expense |
118.7 | 76.1 | 62.0 | 29.8 | 18.0 | 67.6 | 10.6 | 49.4 | ||||||||||||||||||||||||||
| Income tax expense (benefit) |
0.1 | — | — | — | — | — | — | — | ||||||||||||||||||||||||||
|
|
|
|
|
|
|
|
|
|
|
|
|
|
|
|
|
|||||||||||||||||||
| Net Income |
$ | 118.6 | $ | 76.1 | $ | 62.0 | $ | 29.8 | $ | 18.0 | $ | 67.6 | $ | 10.6 | $ | 49.4 | ||||||||||||||||||
|
|
|
|
|
|
|
|
|
|
|
|
|
|
|
|
|
|||||||||||||||||||
| Balance Sheet Data: |
||||||||||||||||||||||||||||||||||
| Cash and cash equivalents |
$ | 85.1 | $ | 79.9 | $ | 50.0 | $ | 72.6 | $ | 52.0 | $ | 98.8 | ||||||||||||||||||||||
| Working capital |
107.6 | 89.1 | 72.7 | 93.7 | 76.5 | 129.6 | ||||||||||||||||||||||||||||
| Total assets |
591.7 | 577.8 | 536.3 | 567.3 | 529.2 | 1,411.2 | ||||||||||||||||||||||||||||
| Total debt, net of unamortized debt issuance costs |
123.2 | 124.0 | 124.8 | 124.2 | 125.0 | 623.1 | ||||||||||||||||||||||||||||
| Statement of Cash Flows Data: |
||||||||||||||||||||||||||||||||||
| Net cash flow provided by (used in): |
||||||||||||||||||||||||||||||||||
| Operating activities |
$ | 129.0 | $ | 118.9 | $ | 78.4 | $ | 25.4 | $ | 23.6 | ||||||||||||||||||||||||
| Investing activities |
(43.7 | ) | (21.0 | ) | (16.9 | ) | (2.7 | ) | (1.7 | ) | ||||||||||||||||||||||||
| Financing activities |
(128.0 | ) | (103.1 | ) | (91.4 | ) | (30.0 | ) | (19.9 | ) | ||||||||||||||||||||||||
| Net increase (decrease) in cash and cash equivalents |
$ | (42.7 | ) | $ | (5.2 | ) | $ | (29.9 | ) | $ | (7.3 | ) | $ | 2.0 | ||||||||||||||||||||
| Other Data (unaudited): |
||||||||||||||||||||||||||||||||||
| EBITDA(1) |
$ | 150.6 | $ | 110.1 | $ | 97.4 | $ | 38.3 | $ | 26.7 | $ | 200.3 | $ | 43.0 | $ | 188.1 | ||||||||||||||||||
| Adjusted EBITDA(1)(2) |
$ | 152.8 | $ | 110.3 | $ | 106.8 | $ | 38.4 | $ | 27.9 | $ | 208.3 | $ | 43.2 | $ | 195.9 | ||||||||||||||||||
| Maintenance capital expenditures |
$ | 3.5 | $ | 4.7 | $ | 9.6 | $ | 1.3 | $ | 0.9 | $ | 20.3 | $ | 3.0 | $ | 20.2 | ||||||||||||||||||
| Growth capital expenditures |
$ | 40.3 | $ | 16.4 | $ | 7.4 | $ | 1.4 | $ | 0.8 | $ | 25.0 | $ | 7.1 | $ | 28.0 | ||||||||||||||||||
| Available cash for distribution(3) |
$ | 145.2 | $ | 102.0 | $ | 81.0 | $ | 32.6 | $ | 30.6 | ||||||||||||||||||||||||
| Key Operating Data (unaudited): |
||||||||||||||||||||||||||||||||||
| Production volume (thousand tons): |
||||||||||||||||||||||||||||||||||
| Ammonia (gross produced)(4) |
402.0 | 388.9 | 385.4 | 96.0 | 113.7 | |||||||||||||||||||||||||||||
| Ammonia (net available for sale)(4)(5) |
37.9 | 28.3 | 37.3 | 14.6 | 15.1 | |||||||||||||||||||||||||||||
| UAN |
930.6 | 963.7 | 928.6 | 252.1 | 248.2 | |||||||||||||||||||||||||||||
| Pet coke consumed (thousand tons) |
487.0 | 489.7 | 469.9 | 124.9 | 126.9 | |||||||||||||||||||||||||||||
| Pet coke consumed (cost per ton)(6) |
$ | 30 | $ | 28 | $ | 25 | $ | 29 | $ | 17 | ||||||||||||||||||||||||
| Sales (thousand tons): |
||||||||||||||||||||||||||||||||||
| Ammonia |
40.5 | 24.4 | 32.3 | 12.8 | 24.4 | |||||||||||||||||||||||||||||
| UAN |
904.6 | 951.0 | 939.5 | 274.5 | 267.0 | |||||||||||||||||||||||||||||
| Product pricing at gate (dollars per ton)(7): |
||||||||||||||||||||||||||||||||||
| Ammonia |
$ | 643 | $ | 518 | $ | 521 | $ | 553 | $ | 367 | ||||||||||||||||||||||||
| UAN |
$ | 282 | $ | 259 | $ | 247 | $ | 263 | $ | 209 | ||||||||||||||||||||||||
| On-stream factors(8): |
||||||||||||||||||||||||||||||||||
| Gasification |
95.6 | % | 96.8 | % | 90.2 | % | 99.4 | % | 97.7 | % | ||||||||||||||||||||||||
| Ammonia |
94.4 | % | 92.6 | % | 87.5 | % | 94.4 | % | 97.2 | % | ||||||||||||||||||||||||
| UAN |
91.9 | % | 92.0 | % | 87.3 | % | 97.8 | % | 91.4 | % | ||||||||||||||||||||||||
| Selected Data and Ratios (as adjusted for the offering): |
|
|||||||||||||||||||||||||||||||||
| Total debt(9) |
$ | 629.8 | ||||||||||||||||||||||||||||||||
| Net total debt(10) |
531.0 | |||||||||||||||||||||||||||||||||
| Cash interest expense(11) |
53.4 | |||||||||||||||||||||||||||||||||
| Ratio of total debt to Adjusted EBITDA |
3.21 | |||||||||||||||||||||||||||||||||
| Ratio of net total debt to Adjusted EBITDA |
2.71 | |||||||||||||||||||||||||||||||||
| Ratio of Adjusted EBITDA to cash interest costs |
3.67 | |||||||||||||||||||||||||||||||||
10
| (1) | EBITDA is defined as net income before (i) interest (income) expense, (ii) income tax expense and (iii) depreciation and amortization expense. Adjusted EBITDA is defined as EBITDA further adjusted for the impact of non-cash share-based compensation, and, when applicable, major scheduled turnaround expense, loss on extinguishment of debt, loss on disposition of assets and expenses associated with the Merger. |
We present EBITDA because we believe it allows users of our financial statements, such as investors and analysts, to assess our financial performance without regard to financing methods, capital structure or historical cost basis. We present Adjusted EBITDA because we have found it helpful to consider an operating measure that excludes expenses, such as major scheduled turnaround expenses, loss on extinguishment of debt, loss on disposition of assets and expenses associated with the Merger, relating to transactions not reflective of our core operations. When applicable, each of these expenses is discussed herein, so that investors have complete information about expenses. In addition, we believe that it is useful to exclude from Adjusted EBITDA non-cash share-based compensation, although it is a recurring cost incurred in the ordinary course of business. In our view, non-cash share-based compensation, which also is presented in our financial statements, reflects a non-cash cost which may obscure, for a given period, trends in the underlying business, due to the timing and nature of the equity awards. We also present Adjusted EBITDA because it is the starting point used by the board of directors of our general partner when calculating our available cash for distribution.
EBITDA and Adjusted EBITDA are not recognized terms under GAAP and should not be substituted for net income or cash flows from operations. Management believes that EBITDA and Adjusted EBITDA enable investors and analysts to better understand our ability to make distributions to common unitholders, help investors and analysts evaluate our ongoing operating results and allow for greater transparency in reviewing our overall financial, operational and economic performance by allowing investors to evaluate the same information used by management. EBITDA and Adjusted EBITDA presented by other companies may not be comparable to our presentation, since each company may define these terms differently.
A reconciliation of our Net Income to EBITDA and Adjusted EBITDA is as follows:
| Historical | Pro Forma | |||||||||||||||||||||||||||||||||
| Years Ended December 31, |
Three Months Ended March 31, |
Year Ended December 31, |
Three Months Ended March 31, |
Last Twelve Months Ended March 31, |
||||||||||||||||||||||||||||||
| 2013 | 2014 | 2015 | 2015 | 2016 | 2015 | 2016 | 2016 | |||||||||||||||||||||||||||
| (unaudited, in millions) | ||||||||||||||||||||||||||||||||||
| Net income |
$ | 118.6 | $ | 76.1 | $ | 62.0 | $ | 29.8 | $ | 18.0 | $ | 67.6 | $ | 10.6 | $ | 49.4 | ||||||||||||||||||
| Add: |
||||||||||||||||||||||||||||||||||
| Interest expense and other financing costs, net |
6.3 | 6.7 | 7.0 | 1.7 | 1.7 | 54.2 | 13.4 | 54.2 | ||||||||||||||||||||||||||
| Income tax expense (benefit) |
0.1 | — | — | — | — | — | — | — | ||||||||||||||||||||||||||
| Depreciation and amortization |
25.6 | 27.3 | 28.4 | 6.8 | 7.0 | 78.5 | 19.0 | 84.5 | ||||||||||||||||||||||||||
|
|
|
|
|
|
|
|
|
|
|
|
|
|
|
|
|
|||||||||||||||||||
| EBITDA |
$ | 150.6 | $ | 110.1 | $ | 97.4 | $ | 38.3 | $ | 26.7 | $ | 200.3 | $ | 43.0 | $ | 188.1 | ||||||||||||||||||
| Add: |
||||||||||||||||||||||||||||||||||
| Major scheduled turnaround expenses |
— | — | 7.0 | — | — | 7.0 | — | 7.0 | ||||||||||||||||||||||||||
| Share-based compensation, non-cash |
2.2 | 0.2 | 0.1 | 0.1 | — | 1.0 | 0.2 | 0.8 | ||||||||||||||||||||||||||
| Expenses associated with the Merger |
— | — | 2.3 | — | 1.2 | — | — | — | ||||||||||||||||||||||||||
|
|
|
|
|
|
|
|
|
|
|
|
|
|
|
|
|
|||||||||||||||||||
| Adjusted EBITDA |
$ | 152.8 | $ | 110.3 | $ | 106.8 | $ | 38.4 | $ | 27.9 | $ | 208.3 | $ | 43.2 | $ | 195.9 | ||||||||||||||||||
|
|
|
|
|
|
|
|
|
|
|
|
|
|
|
|
|
|||||||||||||||||||
| (2) | Adjusted EBITDA on a pro forma basis and including the impact of the anticipated $12.0 million of synergies would have been $207.9 million for the last twelve months ended March 31, 2016. |
| (3) | The board of directors of our general partner has a policy to calculate available cash for distribution starting with Adjusted EBITDA. Available cash for distribution is defined as our Adjusted EBITDA reduced for cash needed for (i) net cash interest expense (excluding capitalized interest) and debt service and other contractual obligations; (ii) maintenance capital expenditures; and (iii) to the extent applicable, major scheduled turnaround expenses, reserves for future operating or capital needs that the board of directors of the general partner deemed necessary or appropriate, and transaction expenses associated with the Merger, if any. Available cash for distribution may be increased by the release of previously established cash reserves, if any, at the discretion of the board of directors of our general partner. Actual distributions are set by the board of directors of our general partner. The board of directors of our general partner may modify our cash distribution policy at any time, and our partnership agreement does not require us to make distributions at all. |
Available cash for distribution is not a recognized term under GAAP. Available cash for distribution should not be considered in isolation or as an alternative to net income or operating income, or any other measure of financial performance or operating performance. In addition, available cash for distribution is not presented as, and should not be considered, an alternative to cash flows from operations or as a measure of liquidity. Available cash for distribution as reported by the Partnership may not be comparable to similarly titled measures of other entities, thereby limiting its usefulness as a comparative measure.
11
A reconciliation of the available cash for distribution is as follows:
| Years Ended December 31, | Three Months Ended March 31, |
|||||||||||||||||||
| 2013 | 2014 | 2015 | 2015 | 2016 | ||||||||||||||||
| (unaudited) | ||||||||||||||||||||
| (in millions, except units and per unit data) | ||||||||||||||||||||
| Adjusted EBITDA |
$ | 152.8 | $ | 110.3 | $ | 106.8 | $ | 38.4 | $ | 27.9 | ||||||||||
| Adjustments: |
||||||||||||||||||||
| Less: |
||||||||||||||||||||
| Net cash interest expense (excluding capitalized interest) and debt service |
(5.4 | ) | (5.8 | ) | (6.0 | ) | (1.5 | ) | (1.5 | ) | ||||||||||
| Maintenance capital expenditures |
(3.5 | ) | (4.7 | ) | (9.6 | ) | (1.3 | ) | (0.9 | ) | ||||||||||
| Major scheduled turnaround expenses |
— | — | (7.0 | ) | — | — | ||||||||||||||
| Cash reserves for future turnaround expenses |
— | — | (7.9 | ) | (3.0 | ) | — | |||||||||||||
| Cash reserves for future operating needs |
(2.2 | ) | — | — | — | — | ||||||||||||||
| Expenses associated with the Merger |
— | — | (2.3 | ) | — | (1.2 | ) | |||||||||||||
| Plus: |
||||||||||||||||||||
| Release of cash reserves established for turnaround expenses |
— | — | 7.0 | — | — | |||||||||||||||
| Release of previously established cash reserves |
2.5 | 2.2 | — | — | — | |||||||||||||||
| Available cash associated with CVR Nitrogen 2016 first quarter |
— | — | — | — | 6.3 | |||||||||||||||
| Other non-cash adjustments |
1.0 | — | — | — | — | |||||||||||||||
|
|
|
|
|
|
|
|
|
|
|
|||||||||||
| Available cash for distribution |
$ | 145.2 | $ | 102.0 | $ | 81.0 | $ | 32.6 | $ | 30.6 | ||||||||||
|
|
|
|
|
|
|
|
|
|
|
|||||||||||
| (4) | Gross tons produced for ammonia represent total ammonia produced, including ammonia produced that was upgraded to UAN. Net tons available for sale represent ammonia available for sale that was not upgraded into UAN. |
| (5) | Includes purchased ammonia. |
| (6) | Our pet coke cost per ton purchased from CVR Refining averaged $19, $24, and $27 for the years ended December 31, 2015, 2014 and 2013, respectively. Third-Party per coke prices averaged $40, $41 and $40 for the year ended December 31, 2015, 2014 and 2013, respectively. Our pet coke cost per ton purchased from CVR Refining averaged $9 and $21 for the three months ended March 31, 2016 and 2015, respectively. Third-Party pet coke prices averaged $33 and $44 for the three months ended March 31, 2016 and 2015, respectively. |
| (7) | Product pricing at gate represents net sales less freight revenue divided by product sales volume in tons, and is shown in order to provide a pricing measure that is comparable across the fertilizer industry. |
| (8) | On-stream factor is the total number of hours operated divided by the total number of hours in the reporting period and is included as a measure of operating efficiency. |
| (9) | Total debt was $629.8 million, or $623.1 million net of $6.7 million unamortized debt issue costs. |
| (10) | Net total debt is defined as total debt less cash. |
| (11) | Cash interest expense relates to estimated cash interest expense on the notes issued in this offering and the remaining $4.8 million untendered 2021 Notes. |
12
SUMMARY CONSOLIDATED HISTORICAL FINANCIAL DATA—CVR NITROGEN
The following tables include CVR Nitrogen’s selected summary financial data as of and for the years ended December 31, 2013, 2014 and 2015, which are derived from the audited income statements and cash flow financial statements of CVR Nitrogen for the corresponding periods, the audited balance sheets of CVR Nitrogen for the corresponding periods in 2015 and 2014, the unaudited balance sheets of CVR Nitrogen as of December 31, 2013 and the unaudited financial statements of CVR Nitrogen for the three months ended March 31, 2015 and 2016, which are derived from the unaudited financial statements of CVR Nitrogen for the corresponding periods. You should read the following data in conjunction with CVR Nitrogen’s audited and unaudited financial statements included in CVR Partners’ Current Report on Form 8-K filed on May 25, 2016. You should not assume results of operations for any past period indicates results for any future period. The selected balance sheet data as of March 31, 2015 and December 31, 2013 is derived from the unaudited financial statements of CVR Nitrogen, which are not included herein.
On March 14, 2016, CVR Nitrogen completed the sale of Rentech Nitrogen Pasadena Holdings, LLC and its subsidiaries, which owned and operated the Pasadena Facility. As a result of the sale, CVR Nitrogen classified its consolidated balance sheets and consolidated statements of operations for all periods presented in the table below to reflect the Pasadena Facility as discontinued operations. All discussions and amounts in the tables below for all periods presented, exclude the financial results attributable to the Pasadena Facility, unless otherwise noted.
| In millions, or as otherwise indicated | Years Ended December 31, | Three Months Ended March 31, |
||||||||||||||||||
| 2013 | 2014 | 2015 | 2015 | 2016 | ||||||||||||||||
| (unaudited) | ||||||||||||||||||||
| Statement of Operations Data: |
||||||||||||||||||||
| Revenues |
$ | 177.7 | $ | 196.4 | $ | 201.3 | $ | 36.8 | $ | 34.8 | ||||||||||
| Cost of sales |
96.8 | 121.6 | 105.2 | 19.4 | 20.3 | |||||||||||||||
| Gross profit |
80.9 | 74.8 | 96.1 | 17.4 | 14.5 | |||||||||||||||
| Total operating expenses |
13.5 | 13.6 | 16.4 | 3.6 | 3.7 | |||||||||||||||
| Operating income (loss) |
67.4 | 61.2 | 79.8 | 13.8 | 10.8 | |||||||||||||||
| Total other income (expense), net |
(20.1 | ) | (19.9 | ) | (21.8 | ) | (5.0 | ) | (5.6 | ) | ||||||||||
| Income from continuing operations before income taxes |
47.3 | 41.3 | 58.0 | 8.8 | 5.2 | |||||||||||||||
| Income tax expense (benefit) |
0.3 | — | — | — | — | |||||||||||||||
|
|
|
|
|
|
|
|
|
|
|
|||||||||||
| Net income from continuing operations |
47.6 | 41.3 | 58.0 | 8.8 | 5.2 | |||||||||||||||
| Income (loss) from discontinued operations, net of tax |
(43.5 | ) | (42.4 | ) | (159.5 | ) | 0.2 | (2.5 | ) | |||||||||||
|
|
|
|
|
|
|
|
|
|
|
|||||||||||
| Net income (loss) |
$ | 4.1 | $ | (1.1 | ) | $ | (101.5 | ) | $ | 9.0 | $ | 2.7 | ||||||||
|
|
|
|
|
|
|
|
|
|
|
|||||||||||
| Balance Sheet Data: |
||||||||||||||||||||
| Cash |
$ | 31.2 | $ | 24.5 | $ | 7.2 | $ | 31.1 | $ | 33.8 | ||||||||||
| Working capital |
$ | 16.8 | $ | 3.1 | $ | (2.8 | ) | $ | 0.1 | $ | 15.6 | |||||||||
| Total assets |
$ | 209.1 | $ | 212.3 | $ | 201.9 | $ | 227.1 | $ | 240.1 | ||||||||||
| Total debt, net of unamortized debt issuance costs |
$ | 311.6 | $ | 326.7 | $ | 347.6 | $ | 331.0 | $ | 362.5 | ||||||||||
| Statement of Cash Flows Data: |
||||||||||||||||||||
| Net cash flow provided by (used in): |
||||||||||||||||||||
| Operating activities(1) |
$ | 44.5 | $ | 64.9 | $ | 79.5 | $ | 22.5 | $ | 20.9 | ||||||||||
| Investing activities(2) |
(90.5 | ) | (72.6 | ) | (36.4 | ) | (10.4 | ) | (9.3 | ) | ||||||||||
| Financing activities(3) |
24.3 | 1.6 | (55.2 | ) | (7.7 | ) | 6.4 | |||||||||||||
| Net increase (decrease) in cash and cash equivalents |
(21.7 | ) | (6.0 | ) | (12.2 | ) | 4.4 | 17.9 | ||||||||||||
13
| In millions, or as otherwise indicated | Years Ended December 31, | Three Months Ended March 31, |
||||||||||||||||||
| 2013 | 2014 | 2015 | 2015 | 2016 | ||||||||||||||||
| (unaudited) | ||||||||||||||||||||
| Net cash provided by (used in) operating activities from discontinued operations |
28.8 | 47.4 | 13.9 | 1.2 | (4.2 | ) | ||||||||||||||
| Net cash provided by (used in) investing activities from discontinued operations |
(32.3 | ) | (46.8 | ) | (8.8 | ) | (3.4 | ) | (4.4 | ) | ||||||||||
| Net cash provided by (used in) discontinued operations |
(3.4 | ) | 0.6 | 5.1 | (2.2 | ) | (8.6 | ) | ||||||||||||
| Other Data: |
||||||||||||||||||||
| Adjusted EBITDA (unaudited)(4) |
$ | 83.0 | $ | 78.1 | $ | 102.6 | $ | 17.4 | $ | 15.7 | ||||||||||
| Maintenance capital expenditures (unaudited)(5) |
9.3 | 9.4 | 10.7 | 1.8 | 2.1 | |||||||||||||||
| Growth capital expenditures (unaudited)(5) |
50.5 | 14.4 | 17.6 | 2.7 | 6.3 | |||||||||||||||
| Key Operating Data (unaudited and excluding the Pasadena Facility): |
||||||||||||||||||||
| Production (tons, in thousands): |
||||||||||||||||||||
| Ammonia |
244.4 | 324.1 | 340.3 | 83.8 | 87.0 | |||||||||||||||
| UAN |
262.1 | 269.2 | 279.0 | 69.9 | 84.8 | |||||||||||||||
| Natural gas used in production: |
||||||||||||||||||||
| Volume (in thousands of MMBtu) |
8,942 | 11,487 | 12,301 | 3,021 | 3,207 | |||||||||||||||
| Pricing ($ per MMBtu) |
$ | 4.18 | $ | 4.98 | $ | 3.53 | $ | 4.68 | $ | 3.19 | ||||||||||
| Products sold (tons, in thousands): |
||||||||||||||||||||
| Ammonia |
102.7 | 152.7 | 186.3 | 30.6 | 43.8 | |||||||||||||||
| UAN |
268.9 | 266.9 | 275.7 | 48.1 | 49.0 | |||||||||||||||
| Products pricing (dollars per ton) |
||||||||||||||||||||
| Ammonia |
$ | 650 | $ | 549 | $ | 538 | $ | 520 | $ | 404 | ||||||||||
| UAN |
$ | 295 | $ | 280 | $ | 255 | $ | 267 | $ | 228 | ||||||||||
| Natural gas in cost of sales, excluding gas derivatives: |
||||||||||||||||||||
| Volume (MMBtu) |
10,085 | 11,335 | 12,348 | 2,186 | 2,657 | |||||||||||||||
| Pricing ($ per MMBtu) |
$ | 4.16 | $ | 5.00 | $ | 3.74 | $ | 3.59 | $ | 3.18 | ||||||||||
| On-stream factors(6): |
||||||||||||||||||||
| Ammonia |
83.6 | % | 95.6 | % | 98.4 | % | 100 | % | 100 | % | ||||||||||
| UAN |
84.1 | % | 95.3 | % | 97.0 | % | 100 | % | 100 | % | ||||||||||
| (1) | Includes Operating activities at the Pasadena Facility. |
| (2) | Includes Investing activities at the Pasadena Facility. |
| (3) | Includes Financing activities at the Pasadena Facility. |
| (4) | Excludes Adjusted EBITDA at the Pasadena Facility. EBITDA is defined as net income before (i) interest (income) expense, (ii) income tax expense and (iii) depreciation and amortization expense. Adjusted EBITDA is defined as EBITDA further adjusted for the impact of non-cash share-based compensation, and, when applicable, major scheduled turnaround expense, loss on extinguishment of debt, loss on disposition of assets and expenses associated with the Merger. |
We present EBITDA because we believe it allows users of our financial statements, such as investors and analysts, to assess our financial performance without regard to financing methods, capital structure or historical cost basis. We present Adjusted EBITDA because we have found it helpful to consider an operating measure that excludes expenses, such as major scheduled turnaround expenses, loss on extinguishment of debt, loss on disposition of assets and expenses associated with the Merger, relating to transactions not reflective of our core operations. When applicable, each of these expenses is discussed
14
herein, so that investors have complete information about expenses. In addition, we believe that it is useful to exclude from Adjusted EBITDA non-cash share-based compensation, although it is a recurring cost incurred in the ordinary course of business. In our view, non-cash share-based compensation, which also is presented in our financial statements, reflects a non-cash cost which may obscure, for a given period, trends in the underlying business, due to the timing and nature of the equity awards. We also present Adjusted EBITDA because it is the starting point used by the board of directors of our general partner when calculating our available cash for distribution.
EBITDA and Adjusted EBITDA are not recognized terms under GAAP and should not be substituted for net income or cash flows from operations. Management believes that EBITDA and Adjusted EBITDA enable investors and analysts to better understand our ability to make distributions to common unitholders, help investors and analysts evaluate our ongoing operating results and allow for greater transparency in reviewing our overall financial, operational and economic performance by allowing investors to evaluate the same information used by management. EBITDA and Adjusted EBITDA presented by other companies may not be comparable to our presentation, since each company may define these terms differently.
A reconciliation of our Net Income to EBITDA and Adjusted EBITDA, exclusive of amounts attributable to the Pasadena Facility is as follows:
| Years Ended December 31, | Three Months Ended March 31, |
|||||||||||||||||||
| 2013 | 2014 | 2015 | 2015 | 2016 | ||||||||||||||||
| (unaudited, in millions) | ||||||||||||||||||||
| Net income from continuing operations |
$ | 47.6 | $ | 41.3 | $ | 58.0 | $ | 8.8 | $ | 5.2 | ||||||||||
| Add: |
||||||||||||||||||||
| Interest expense and other financing costs, net |
14.1 | 19.1 | 21.7 | 5.0 | 5.6 | |||||||||||||||
| Income tax expense (benefit) |
(0.2 | ) | — | — | — | — | ||||||||||||||
| Depreciation and amortization |
9.2 | 15.9 | 18.3 | 3.3 | 4.0 | |||||||||||||||
|
|
|
|
|
|
|
|
|
|
|
|||||||||||
| EBITDA |
$ | 70.7 | $ | 76.3 | $ | 98.0 | $ | 17.1 | $ | 14.8 | ||||||||||
| Add: |
||||||||||||||||||||
| Major scheduled turnaround expenses |
4.9 | — | — | — | — | |||||||||||||||
| Share-based compensation, non-cash |
1.4 | 1.2 | 0.9 | 0.3 | 0.2 | |||||||||||||||
| Loss on debt extinguishment |
6.0 | 0.6 | — | — | — | |||||||||||||||
| Expenses associated with the Merger |
— | — | 3.7 | — | 0.7 | |||||||||||||||
|
|
|
|
|
|
|
|
|
|
|
|||||||||||
| Adjusted EBITDA |
$ | 83.0 | $ | 78.1 | $ | 102.6 | $ | 17.4 | $ | 15.7 | ||||||||||
|
|
|
|
|
|
|
|
|
|
|
|||||||||||
| (5) | Excludes expenditures at the Pasadena Facility. |
| (6) | The respective on-stream factors for the ammonia and UAN plant equal the total days the applicable plant operated in any given period, divided by the total days in that period. |
15
MANAGEMENT’S DISCUSSION AND ANALYSIS OF FINANCIAL CONDITION AND RESULTS OF
OPERATIONS
CVR Partners – Coffeyville Facility
Major Influences on Results of Operations
Our earnings and cash flows from operations are primarily affected by the relationship between nitrogen fertilizer product prices, on-stream factors and direct operating expenses. Natural gas is the most significant raw material required in our competitors’ production of nitrogen fertilizer. Our Coffeyville Facility does not use natural gas as a feedstock and uses a minimal amount of natural gas as an energy source in our operations. Instead, CVR Refining’s adjacent refinery supplies us with most of the pet coke feedstock we need pursuant to a 20-year pet coke supply agreement entered into in October 2007. The price at which our products are ultimately sold depends on numerous factors, including the global supply and demand for nitrogen fertilizer products which, in turn, depends on, among other factors, world grain demand and production levels, changes in world population, the cost and availability of fertilizer transportation infrastructure, weather conditions, the availability of imports and the extent of government intervention in agriculture markets.
Nitrogen fertilizer prices are also affected by local factors, including local market conditions and the operating levels of competing facilities. An expansion or upgrade of competitors’ facilities, political and economic developments and other factors are likely to continue to play an important role in nitrogen fertilizer industry economics. These factors can impact, among other things, the level of inventories in the market, resulting in price volatility and a reduction in product margins. Moreover, the industry typically experiences seasonal fluctuations in demand for nitrogen fertilizer products.
As a result of a favorable global demand environment for grains, nitrogen fertilizer prices rose to near historic levels beginning in 2011. In addition, North American producers began to benefit from lower natural gas prices due to the significant increase in shale basin and other non-conventional production in the region. The combination of higher nitrogen fertilizer prices globally and a feedstock cost advantage led to high margins for North American nitrogen fertilizer producers. This resulted in numerous announcements for expansion plans for existing plants as well as new facility development in the corn belt and the gulf coast. The majority of the additional supply from this expansion phase in North America is expected to come online in 2016. We expect product pricing may experience volatility as the new supply displaces imports into the gulf coast and corn belt. However, over the longer-term the U.S. is expected to remain a net importer of nitrogen fertilizer with domestic prices influenced by the higher cost of imported tons into the United States.
Since mid-2013, global nitrogen fertilizer prices have trended down as global grain supply increased and growth in grain demand slowed due to more challenging worldwide economic considerations. During 2015, there were announced transactions for further
16
consolidation in the North American nitrogen fertilizer market, including our definitive merger agreement under which we acquired all outstanding units of CVR Nitrogen.
While there is risk of short-term volatility given the inherent nature of the commodity cycle, the longer-term fundamentals for the U.S. nitrogen fertilizer industry remain intact. We view the anticipated combination of (i) increasing global population, (ii) decreasing arable land per capita, (iii) continued evolution to more protein-based diets in developing countries, (iv) sustained use of corn as feedstock for the domestic production of ethanol and (v) positioning at the lower end of the global cost curve will continue to provide a solid foundation for nitrogen fertilizer producers in the U.S.
In order to assess our operating performance, we calculate the product pricing at gate as an input to determine our operating margin. Product pricing at gate represents net sales less freight revenue divided by product sales volume in tons. We believe product pricing at gate is a meaningful measure because we sell products at our plant gate and terminal locations’ gates (“sold gate”) and delivered to the customer’s designated delivery site (“sold delivered”). The relative percentage of sold gate versus sold delivered can change period to period. The product pricing at gate provides a measure that is consistently comparable period to period.
We and other competitors in the U.S. farm belt share a significant transportation cost advantage when compared to our out-of-region competitors in serving the U.S. farm belt agricultural market; therefore we are able to cost-effectively sell substantially all of our products in the higher margin agricultural market. Further, we believe a significant portion of our competitors’ revenues are derived from the lower margin industrial market. Our products leave our Coffeyville Facility either in railcars for destinations located principally on the Union Pacific Railroad or in trucks for direct shipment to customers. We do not currently incur significant intermediate transfer, storage, barge freight or pipeline freight charges; however, we do incur costs to maintain and repair our railcar fleet. Selling products to customers within economic rail transportation limits of the Coffeyville Facility and keeping transportation costs low are keys to maintaining profitability.
As a result of the UAN expansion project completed in 2013, we will continue to upgrade substantially all of our ammonia production into UAN for as long as it makes economic sense to do so. The value of nitrogen fertilizer products is also an important consideration in understanding our results. For the years ended December 31, 2015 and 2014, we upgraded approximately 96% and 97%, respectively, of our ammonia production into UAN, a product that presently generates greater profit than ammonia.
The high fixed cost of our direct operating expense structure also directly affects our profitability. Our Coffeyville Facility’s pet coke gasification process results in a significantly higher percentage of fixed costs than a natural gas-based fertilizer plant. Major fixed operating expenses of our Coffeyville Facility include a large portion of electrical energy, employee labor, maintenance, including contract labor and outside services. We estimate these fixed costs averaged approximately 80% of direct operating expenses over the 24 months ended March 31, 2016.
Our largest raw material expense used in the production of ammonia at our Coffeyville Facility is pet coke, which we purchase from CVR Refining and third parties. For the three months ended March 31, 2016 and 2015, we incurred approximately $2.1 million and $3.6 million, respectively, for the cost of pet coke, which equaled an average cost per ton of $17 and $29, respectively.
Agreements with CVR Energy and CVR Refining
We are party to several agreements with CVR Energy and its affiliates that govern the business relations among us, CVR Energy and its subsidiaries (including CVR Refining), and our general partner. These include the pet coke supply agreement under which we buy the pet coke we use in our Coffeyville Facility; a services agreement, under which CVR Energy and its subsidiaries provide us with management services including the services of its senior management team; a feedstock and shared services agreement, which governs the provision of feedstocks for our Coffeyville Facility, including, but not limited to, hydrogen, high-pressure steam, nitrogen, instrument air, oxygen and natural gas; a raw water and facilities sharing agreement, which allocates raw water resources between the two businesses; an easement agreement; an environmental agreement which, among other matters, allocates liability and responsibility for remediating contamination at the Coffeyville Facility; a lease agreement pursuant to which we lease office space and laboratory space; and certain financing agreements that we entered into in connection with the Merger. These agreements were not the result of arm’s-length negotiations and the terms of these agreements are not necessarily as favorable to the parties to these agreements as terms which could have been obtained from unaffiliated third parties.
Factors Affecting Comparability
Our historical results of operations for the periods presented may not be comparable with prior periods or to our results of operations in the future for the reasons discussed below.
17
2015 Turnaround
During the third quarter of 2015, the Coffeyville Facility completed a major scheduled turnaround and the gasification, ammonia and UAN units were down for between 17 to 20 days each. Overall results were negatively impacted due to the lost production during the downtime that resulted in reduced sales and certain reduced variable expenses included in cost of product sold (exclusive of depreciation and amortization) and direct operating expenses (exclusive of depreciation and amortization). Costs of approximately $7.0 million associated with the 2015 turnaround are included in direct operating expenses (exclusive of depreciation and amortization) in the Consolidated Statements of Operations for the year ended December 31, 2015.
Linde Air Separation Unit Related Downtime
Linde owns, operates, and maintains the air separation plant that provides contract volumes of oxygen, nitrogen, and compressed dry air to our Coffeyville Facility. During the third quarter of 2015, the Linde air separation unit experienced downtime, in excess of the downtime associated with the major scheduled turnaround discussed above, that resulted in the gasification, ammonia and UAN units being down for between 16 to 19 days each. Overall results were negatively impacted due to the lost production during the downtime that resulted in reduced sales and certain reduced variable expenses included in cost of product sold (exclusive of depreciation and amortization) and direct operating expenses (exclusive of depreciation and amortization) for the year ended December 31, 2015.
The Merger
On April 1, 2016, we completed the Merger, which is not reflected in our results of operations.
Results of Operations
The period to period comparisons of CVR Partners’ results of operations have been prepared using the historical periods included in CVR Partners’ consolidated financial statements. In order to effectively review and assess our historical financial information, we have also included supplemental operating measures and industry measures that we believe are material to understanding our business.
Three Months Ended March 31, 2016 Compared to the Three Months Ended March 31, 2015
Net Sales. Net sales were $73.1 million for the three months ended March 31, 2016 compared to $93.1 million for the three months ended March 31, 2015. The decrease of $20.0 million was primarily the result of lower UAN sales prices ($14.2 million), lower hydrogen sales volumes ($4.8 million), lower ammonia sales prices ($4.6 million) and lower UAN sales volumes ($2.1 million), partially offset by higher ammonia sales volumes ($6.5 million). For the three months ended March 31, 2016, UAN and ammonia made up $62.6 million and $9.1 million of our net sales, respectively. This compared to UAN and ammonia net sales of $78.9 million and $7.2 million, respectively, for the three months ended March 31, 2015. The following table demonstrates the impact of changes in sales volumes and pricing for UAN, ammonia and hydrogen for the three months ended March 31, 2016 as compared to the three months ended March 31, 2015:
| Three Months Ended March 31, 2016 |
Three Months Ended March 31, 2015 |
Total Variance | Price Variance |
Volume Variance |
||||||||||||||||||||||||||||||||||||
| Volume(1) | $ per ton(2) | Sales $(3) | Volume(1) | $ per ton(2) | Sales $(3) | Volume(1) | Sales $(3) | |||||||||||||||||||||||||||||||||
| UAN |
267,049 | $ | 234 | $ | 62.6 | 274,540 | $ | 288 | $ | 78.9 | (7,491 | ) | $ | (16.3 | ) | $ | (14.2 | ) | $ | (2.1 | ) | |||||||||||||||||||
| Ammonia |
24,397 | $ | 373 | $ | 9.1 | 12,821 | $ | 562 | $ | 7.2 | 11,576 | $ | 1.9 | $ | (4.6 | ) | $ | 6.5 | ||||||||||||||||||||||
| Hydrogen |
160,408 | $ | 7 | $ | 1.1 | 600,278 | $ | 11 | $ | 6.5 | (439,870 | ) | $ | (5.4 | ) | $ | (0.6 | ) | $ | (4.8 | ) | |||||||||||||||||||
| (1) | UAN and ammonia sales volumes are in tons. Hydrogen sales volumes are in MSCF. |
| (2) | Includes freight charges. Hydrogen is based on $ per MSCF. |
| (3) | Sales dollars in millions. |
The decrease in UAN and ammonia sales prices for the three months ended March 31, 2016 compared to the three months ended March 31, 2015 was primarily attributable to pricing fluctuation in the market. The increase of ammonia sales volume for the three months ended March 31, 2016 compared to the three months ended March 31, 2015 was primarily attributable to the timing of customer demand. On-stream factors (total number of hours operated divided by total hours in the reporting period) for the gasification, ammonia and UAN units were 97.7%, 97.2% and 91.4%, respectively, for the three months ended March 31, 2016. Product pricing at gate for the three months ended March 31, 2016 compared to the three months ended March 31, 2015 decreased 20.5% for UAN and decreased 33.6% for ammonia.
18
Cost of Product Sold (Exclusive of Depreciation and Amortization). Cost of product sold (exclusive of depreciation and amortization) consists primarily of freight and distribution expenses, pet coke expense, purchased ammonia and purchased hydrogen. Cost of product sold (exclusive of depreciation and amortization) for the three months ended March 31, 2016 was $16.3 million, compared to $25.8 million for the three months ended March 31, 2015. The $9.5 million decrease resulted from lower costs from transactions with third parties of $8.5 million and affiliates of $1.0 million. The lower third-party costs incurred during the three months ended March 31, 2016 was primarily the result of less purchased ammonia and third-party coke costs. The lower affiliate costs incurred during the three months ended March 31, 2016 were primarily the result of lower expense of CVR Refining pet coke. The decrease in affiliate and third-party coke expense was primarily related to decreased market prices of petroleum coke.
Direct Operating Expenses (Exclusive of Depreciation and Amortization). Direct operating expenses (exclusive of depreciation and amortization) consist primarily of energy and utility costs, direct costs of labor, property taxes, plant-related maintenance services and environmental and safety compliance costs as well as catalyst and chemical costs. Direct operating expenses (exclusive of depreciation and amortization) for the three months ended March 31, 2016 were $23.7 million as compared to $24.4 million for the three months ended March 31, 2015. The $0.7 million decrease resulted primarily from lower utilities, net ($1.7 million), partially offset by higher outside services ($1.0 million). The lower utilities, net is primarily the result of lower electrical rates.
Selling, General and Administrative Expenses (Exclusive of Depreciation and Amortization). Selling, general and administrative expenses include the direct selling, general and administrative expenses of our business as well as certain expenses incurred by our affiliates, CVR Energy and Coffeyville Resources, on our behalf and billed or allocated to us in accordance with the applicable agreements. We also reimburse our general partner in accordance with the partnership agreement for expenses it incurs on our behalf. Reimbursed expenses to our general partner are included as selling, general and administrative expenses from affiliates. Selling, general and administrative expenses (exclusive of depreciation and amortization) were $6.4 million for the three months ended March 31, 2016 and $4.6 million for the three months ended March 31, 2015. The $1.8 million increase resulted primarily from a $1.6 million increase in costs of transactions with third parties and a $0.2 million increase in costs of transactions with affiliates. The overall variance was primarily the result of expenses associated with the Merger ($1.2 million), higher labor ($0.4 million) and higher bad debt reserves ($0.2 million) during the three months ended March 31, 2016.
Operating Income. Operating income was $19.7 million for the three months ended March 31, 2016, as compared to operating income of $31.5 million for the three months ended March 31, 2015. The decrease of $11.8 million for the three months ended March 31, 2016 as compared to the three months ended March 31, 2015 was the result of the decrease in net sales ($20.0 million) and increases in selling general and administrative expenses ($1.8 million) and depreciation and amortization ($0.2 million), partially offset by decreases in cost of product sold ($9.5 million) and in direct operating expenses ($0.7 million).
Year Ended December 31, 2015 Compared to the Year Ended December 31, 2014
Net Sales. Net sales were $289.2 million for the year ended December 31, 2015, compared to $298.7 million for the year ended December 31, 2014. The net sales decrease of $9.5 million for the year ended December 31, 2015 as compared to the year ended December 31, 2014 was primarily the result of lower UAN sales prices ($11.6 million), lower UAN sales volumes ($3.3 million), and lower hydrogen sales prices ($0.3 million), partially offset by higher ammonia sales volumes ($4.2 million) and higher hydrogen sales volumes ($2.0 million). For the year ended December 31, 2015, UAN, ammonia and hydrogen made up $258.8 million, $17.2 million, and $11.8 million of our net sales, respectively. This compared to UAN, ammonia and hydrogen net sales of $273.7 million, $13.1 million and $10.1 million, respectively, for the year ended December 31, 2014. The following table demonstrates the impact of changes in sales volumes and sales price for UAN, ammonia and hydrogen for the year ended December 31, 2015 compared to the year ended December 31, 2014.
| Year Ended December 31, 2015 | Year Ended December 31, 2014 | Total Variance | Price Variance |
Volume Variance |
||||||||||||||||||||||||||||||||||||
| Volume(1) | $ per ton(2) | Sales $(3) | Volume(1) | $ per ton(2) | Sales $(3) | Volume(1) | Sales $(3) | |||||||||||||||||||||||||||||||||
| (in millions) | ||||||||||||||||||||||||||||||||||||||||
| UAN |
939,547 | $ | 275 | $ | 258.8 | 951,043 | $ | 288 | $ | 273.7 | (11,496 | ) | $ | (14.9 | ) | $ | (11.6 | ) | $ | (3.3 | ) | |||||||||||||||||||
| Ammonia |
32,326 | $ | 533 | $ | 17.2 | 24,378 | $ | 536 | $ | 13.1 | 7,948 | $ | 4.1 | $ | (0.1 | ) | $ | 4.2 | ||||||||||||||||||||||
| Hydrogen |
1,196,320 | $ | 10 | $ | 11.8 | 996,516 | $ | 10 | $ | 10.1 | 199,804 | $ | 1.7 | $ | (0.3 | ) | $ | 2.0 | ||||||||||||||||||||||
| (1) | UAN and ammonia sales volumes are in tons. Hydrogen sales volumes are in MSCF. |
| (2) | Includes freight charges. Hydrogen is reflected as $ per MSCF. |
| (3) | Sales dollars in millions. |
For the year ended December 31, 2015 compared to the year ended December 31, 2014, our nitrogen fertilizer operations experienced a decrease of 1.2% in UAN sales unit volumes and an increase of 32.6% in ammonia sales unit volumes. The decrease in UAN sales volumes for the year ended December 31, 2015 compared to the year ended December 31, 2014 was partially attributable
19
to the 2015 turnaround and the Linde air separation unit related outages. The increase in ammonia sales for the year ended December 31, 2015 compared to the year ended December 31, 2014 was partially attributable to higher customer demand for the year ended December 31, 2015 compared to the year ended December 31, 2014. On-stream factors (total number of hours operated divided by total hours in the reporting period) for the gasification, ammonia and UAN units were 90.2%, 87.5% and 87.3%, respectively, for the year ended December 31, 2015. On-stream factors for the gasification, ammonia and UAN units were 96.8%, 92.6% and 92.0%, respectively, for the year ended December 31, 2014.
Product pricing at gate represents net sales less freight revenue divided by product sales volume in tons. Product pricing at gate for UAN decreased approximately 4.6% for the year ended December 31, 2015 as compared to the year ended December 31, 2014. Product pricing at gate for ammonia increased approximately 0.6% for the year ended December 31, 2015 as compared to the year ended December 31, 2014.
Cost of Product Sold (Exclusive of Depreciation and Amortization). Cost of product sold (exclusive of depreciation and amortization) includes cost of freight and distribution expenses, pet coke expenses, purchased ammonia and purchased hydrogen. Cost of product sold excluding depreciation and amortization for the year ended December 31, 2015 was $65.2 million, compared to $72.0 million for the year ended December 31, 2014. The $6.8 million decrease resulted from $4.1 million in lower costs from transactions with affiliates and a decrease in costs from transactions with third parties of $2.7 million. The lower affiliate costs incurred during the year ended December 31, 2015 were primarily the result of lower consumption of CVR Refining pet coke mostly due to price and also due to the decrease in production during the turnaround and the Linde air separation unit related downtime. The lower third-party costs incurred during the year ended December 31, 2015 was primarily the result of decreased distribution costs, freight expenses and purchased ammonia, partially offset by higher expenses associated with third-party coke expenses and other product costs. The lower distribution costs is due to a smaller portion of our fleet due for regulatory inspections and related repairs during the year ended December 31, 2015 as compared to the year ended December 31, 2014.
Direct Operating Expenses (Exclusive of Depreciation and Amortization). Direct operating expenses (exclusive of depreciation and amortization) consist primarily of energy and utility costs, direct costs of labor, property taxes, plant-related maintenance services and environmental and safety compliance costs as well as catalyst and chemical costs. Direct operating expenses (exclusive of depreciation and amortization) for the year ended December 31, 2015 were $106.1 million, as compared to $98.9 million for the year ended December 31, 2014. The total increase of $7.2 million for the year ended December 31, 2015, as compared to the year ended December 31, 2014, was comprised of a $6.1 million increase in costs from transactions with third parties and a $1.1 million increase in direct operating costs from affiliates. The increase in costs from transactions with third parties resulted primarily from higher turnaround expenses ($7.0 million), personnel ($2.9 million), repairs and maintenance other than turnaround expenses ($2.2 million), and other less significant increases, partially offset by lower utilities, net ($2.3 million), refractory brick amortization ($2.2 million) and outside services ($1.8 million). The increase in personnel costs is partially attributable to the increased efforts required to complete activities during downtime. The increase in repairs and maintenance is due to the Partnership being able to perform an increased amount of normal repairs and maintenance during the downtime. The lower utilities, net are primarily due to lower usage during the turnaround and the Linde outages.
Selling, General and Administrative Expenses (Exclusive of Depreciation and Amortization). Selling, general and administrative expenses include the direct expenses of our business as well as certain expenses incurred by our affiliates, CVR Energy and its subsidiaries, on our behalf and billed or allocated to us in accordance with the services agreement. We also reimburse our general partner in accordance with the partnership agreement for expenses it incurs on our behalf, and such costs are recorded as expenses from affiliates. Selling, general and administrative expenses (exclusive of depreciation and amortization) were $20.8 million for the year ended December 31, 2015, as compared to $17.7 million for the year ended December 31, 2014. The increase of $3.1 million for the year ended December 31, 2015 as compared to the year ended December 31, 2014 was the result of an increase in costs from transactions with affiliates ($0.6 million) coupled with an increase in costs from transactions with third parties ($2.5 million). The overall variance was primarily the result of an increase in legal expenses and other outside services due to the Merger ($2.3 million) and an increase in personnel services ($0.7 million) primarily due to increased share based compensation and incentive awards during the year ended December 31, 2015.
Net Income. For the year ended December 31, 2015, net income was $62.0 million, as compared to $76.1 million of net income for the year ended December 31, 2014, a decrease of $14.1 million. The decrease in net income was primarily due to the factors noted above.
Year Ended December 31, 2014 compared to the Year Ended December 31, 2013
Net Sales. Net sales were $298.7 million for the year ended December 31, 2014, compared to $323.7 million for the year ended December 31, 2013. The net sales decrease of $25.0 million for the year ended December 31, 2014 as compared to the year ended
20
December 31, 2013 was the result of lower UAN sales prices ($25.8 million), lower ammonia sales volumes ($10.7 million), and lower ammonia sales prices ($3.0 million), partially offset by higher UAN sales volumes ($14.6 million). For the year ended December 31, 2014, UAN, ammonia and hydrogen made up $273.7 million, $13.1 million, and $10.1 million of our net sales, respectively. This compared to UAN, ammonia and hydrogen net sales of $284.9 million, $26.8 million and $11.4 million, respectively, for the year ended December 31, 2013. The following table demonstrates the impact of changes in sales volumes and sales price for UAN, ammonia and hydrogen for the year ended December 31, 2014 compared to the year ended December 31, 2013.
| Year Ended December 31, 2014 | Year Ended December 31, 2013 | Total Variance | Price Variance |
Volume Variance |
||||||||||||||||||||||||||||||||||||
| Volume(1) | $ per ton(2) | Sales $(3) | Volume(1) | $ per ton(2) | Sales $(3) | Volume(1) | Sales $(3) | |||||||||||||||||||||||||||||||||
| (in millions) | ||||||||||||||||||||||||||||||||||||||||
| UAN |
951,043 | $ | 288 | $ | 273.7 | 904,596 | $ | 315 | $ | 284.9 | 46,447 | $ | (11.2 | ) | $ | (25.8 | ) | $ | 14.6 | |||||||||||||||||||||
| Ammonia |
24,378 | $ | 536 | $ | 13.1 | 40,535 | $ | 660 | $ | 26.8 | (16,157 | ) | $ | (13.7 | ) | $ | (3.0 | ) | $ | (10.7 | ) | |||||||||||||||||||
| Hydrogen |
996,516 | $ | 10 | $ | 10.1 | 1,165,300 | $ | 10 | $ | 11.4 | (168,784 | ) | $ | (1.3 | ) | $ | 0.3 | $ | (1.6 | ) | ||||||||||||||||||||
| (1) | UAN and ammonia sales volumes are in tons. Hydrogen sales volumes are in MSCF. |
| (2) | Includes freight charges. Hydrogen is reflected as $ per MSCF. |
| (3) | Sales dollars in millions. |
For the year ended December 31, 2014, our nitrogen fertilizer operations experienced an increase of 5.1% in UAN sales unit volumes and a decrease of 39.9% in ammonia sales unit volumes. The increase in UAN and decrease in ammonia sales volumes for the year ended December 31, 2014 compared to the year ended December 31, 2013 was partially attributable to the UAN expansion being available for the full period in 2014. On-stream factors (total number of hours operated divided by total hours in the reporting period) for the gasification, ammonia and UAN units were 96.8%, 92.6% and 92.0%, respectively, for the year ended December 31, 2014. On-stream factors for the gasification, ammonia and UAN units were 95.6%, 94.4% and 91.9%, respectively, for the year ended December 31, 2013.
Product pricing at gate represents net sales less freight revenue divided by product sales volume in tons. Product pricing at gate prices for UAN decreased approximately 8.2% for the year ended December 31, 2014 as compared to the year ended December 31, 2013. Product pricing at gate for ammonia decreased approximately 19.4% for the year ended December 31, 2014 as compared to the year ended December 31, 2013.
Cost of Product Sold (Exclusive of Depreciation and Amortization). Cost of product sold (exclusive of depreciation and amortization) includes cost of freight and distribution expenses, pet coke expenses, purchased ammonia, and purchased hydrogen. Cost of product sold excluding depreciation and amortization for the year ended December 31, 2014 was $72.0 million, compared to $58.1 million for the year ended December 31, 2013. The $13.9 million increase resulted from $15.3 million in higher costs from transactions with third parties, which is offset by lower costs from transactions with affiliates of $1.4 million. The higher third-party costs incurred during the year ended December 31, 2014 were primarily the result of increased distribution costs ($10.5 million) mostly due to the increase in railcar regulatory inspections and repairs as well as increased ammonia purchases ($6.5 million), partially offset by lower freight and pet coke expenses. The increase in railcar regulatory inspections and repairs is related to a larger portion of our fleet due for regulatory inspections and related repairs during the year ended December 31, 2014 as compared to the prior year.
Direct Operating Expenses (Exclusive of Depreciation and Amortization). Direct operating expenses (exclusive of depreciation and amortization) consist primarily of energy and utility costs, direct costs of labor, property taxes, plant-related maintenance services and environmental and safety compliance costs as well as catalyst and chemical costs. Direct operating expenses (exclusive of depreciation and amortization) for the year ended December 31, 2014 were $98.9 million, as compared to $94.1 million for the year ended December 31, 2013. The total increase of $4.8 million for the year ended December 31, 2014, as compared to the year ended December 31, 2013, was comprised of a $5.9 million increase in costs from transactions with third parties, partially offset by a $1.1 million decrease in direct operating costs from affiliates. The increase resulted primarily from higher utilities, net ($1.3 million), refractory brick amortization ($2.7 million), repairs and maintenance ($1.2 million), partially offset by lower insurance costs ($1.1 million). The increased utility costs were largely due to higher electrical and natural gas prices, partially offset by lower electrical volumes. The increase in refractory brick amortization is primarily due to a decrease in the estimated useful life to reflect higher estimated rates of use in our production process.
Selling, General and Administrative Expenses (Exclusive of Depreciation and Amortization). Selling, general and administrative expenses include the direct expenses of our business as well as certain expenses incurred by our affiliates, CVR Energy and its subsidiaries, on our behalf and billed or allocated to us in accordance with the services agreement. We also reimburse our general partner in accordance with the partnership agreement for expenses it incurs on our behalf, and such costs are recorded as expenses from affiliates. Selling, general and administrative expenses (exclusive of depreciation and amortization) were $17.7 million
21
for the year ended December 31, 2014, as compared to $21.0 million for the year ended December 31, 2013. The decrease of $3.3 million for the year ended December 31, 2014 as compared to the year ended December 31, 2013 was the result of a decrease in costs from transactions with affiliates ($2.6 million) coupled with a decrease in costs from transactions with third parties ($0.7 million). The overall variance was primarily the result of a decrease in reimbursements to our general partner ($1.7 million), a decrease in outside services ($1.2 million) and a decrease in share-based compensation ($1.0 million), partially offset by increases in expenses related to personnel costs ($0.4 million), exclusive of share-based compensation.
Net Income. For the year ended December 31, 2014, net income was $76.1 million, as compared to $118.6 million of net income for the year ended December 31, 2013, a decrease of $42.5 million. The decrease in net income was primarily due to the factors noted above.
Cash Flows—Three Months Ended March 31, 2016 Compared to the Three Months Ended March 31, 2015
The following table sets forth our cash flows for the periods indicated below:
| Three Months Ended March 31, | ||||||||
| 2016 | 2015 | |||||||
| (in millions) | ||||||||
| Net cash flow provided by (used in): |
||||||||
| Operating activities |
$ | 23.6 | $ | 25.4 | ||||
| Investing activities |
(1.7 | ) | (2.7 | ) | ||||
| Financing activities |
(19.9 | ) | (30.0 | ) | ||||
|
|
|
|
|
|||||
| Net increase (decrease) in cash and cash equivalents |
$ | 2.0 | $ | (7.3 | ) | |||
Cash Flows Provided by Operating Activities
For purposes of this cash flow discussion, we define trade working capital as accounts receivable, inventory and accounts payable. Other working capital is defined as all other current assets and liabilities except trade working capital.
Net cash flows provided by operating activities for the three months ended March 31, 2016 were approximately $23.6 million. Fluctuations in trade working capital increased our operating cash flow by $3.5 million due to a decrease in inventory of $4.9 million and an increase in accounts payable of $0.7 million, partially offset by an increase in accounts receivable of $2.1 million. The decrease in inventory was primarily attributable to decrease in finished goods inventory as a result of increased sales volumes for the three months ended March 31, 2016. The increase in accounts receivable was primarily attributable to an increase in sales and normal fluctuations in the timing of payments. Fluctuations in other working capital of $5.8 million decreased our operating cash flow and were due to a decrease to accrued expenses and other current liabilities of $4.2 million, a decrease in deferred revenue of $2.3 million, partially offset by a decrease to prepaid expenses and other current assets of $0.7 million for the three months ended March 31, 2016. The decrease in accrued expenses and other current liabilities was primarily due to the payment of incentive awards. The decrease in deferred revenue was primarily attributable to increased sales for the three months ended March 31, 2016.
Net cash flows provided by operating activities for the three months ended March 31, 2015 were approximately $25.4 million. Fluctuations in trade working capital had a nominal impact on our operating cash flow due to an increase in accounts receivable of $2.7 million, offset by a decrease in inventory of $1.7 million and an increase in accounts payable of $1.0 million. The increase in accounts receivable was primarily attributable to an increase in sales and normal fluctuations in the timing of payments. The decrease in inventory was due to a decrease in finished goods inventory as a result of increased sales for the three months ended March 31, 2015, partially offset by purchases of parts and supplies. Fluctuations in other working capital of $12.5 million decreased our operating cash flow and were due to a decrease in deferred revenue of $7.3 million, a decrease to accrued expenses and other current liabilities of $4.8 million and an increase to prepaid expenses and other current assets of $0.4 million for the three months ended March 31, 2015. The decrease in deferred revenue was primarily attributable to lower market demand for prepaid contracts and increased sales for the three months ended March 31, 2015. The decrease in accrued expenses and other current liabilities was primarily attributable to a decrease in balances related to accrued railcar regulatory inspections of $1.9 million as well as decreases due to the payment of incentive awards.
Cash Flows Used in Investing Activities
Net cash used in investing activities for the three months ended March 31, 2016 was $1.7 million compared to $2.7 million for the three months ended March 31, 2015. For the three months ended March 31, 2016 and 2015, net cash used in investing activities was the result of capital expenditures.
22
Cash Flows Used in Financing Activities
Net cash flows used in financing activities for the three months ended March 31, 2016 were $19.9 million, compared to net cash flows used in financing activities for the three months ended March 31, 2015 of $30.0 million. The net cash used in financing activities for the three months ended March 31, 2016 and 2015 was primarily attributable to quarterly cash distributions.
CVR Nitrogen—East Dubuque Facility
The period to period comparisons of CVR Nitrogen’s results of operations have been prepared using the historical periods included in CVR Nitrogen’s financial statements. The results of operations presented herein include only the results of the East Dubuque Facility. In order to effectively review and assess the historical financial information, we have also included supplemental operating measures and industry measures that we believe are material to understanding the business.
Factors Affecting Comparability
Our historical results of operations for the periods presented may not be comparable with prior periods or to our results of operations in the future for the reasons discussed below.
2013 Turnaround
During the fourth quarter of 2013, the East Dubuque Facility completed a major scheduled turnaround. Overall results were negatively impacted due to the lost production during the turnaround downtime and a subsequent fire that resulted in reduced revenue and certain reduced variable expenses included in cost of sales. Costs of approximately $7.8 million associated with the 2013 turnaround are included in the Consolidated Statements of Operations for the year ended December 31, 2013.
Ammonia Expansion and Ammonia Synthesis Converter Projects
Ammonia production capacity increased 23% after nitrogen fertilizer completed the ammonia expansion project in December 2013. This additional ammonia available for sale enabled higher ammonia deliveries during the subsequent years ended December 31, 2014 and December 31, 2015. Additionally, depreciation expense has increased as we placed assets associated with this project into service.
The East Dubuque Facility has started an ammonia synthesis converter project, which is expected to add approximately 50 tons per day of ammonia production capacity, and is expected to be completed before the end of the second quarter of 2016. Depreciation expense will increase when we place assets associated with this project into service.
Consequently, our operating results may not be comparable for periods before, during and after the construction of any expansion project or other significant capital project.
Results of Operations
Three Months Ended March 31, 2016 Compared to the Three Months Ended March 31, 2015
Revenues.
We generate revenue from the sale of nitrogen fertilizer products manufactured at our East Dubuque Facility. Our East Dubuque Facility produces ammonia, UAN, liquid and granular urea, which are nitrogen fertilizers that use natural gas as a feedstock. We also produce nitric acid and food-grade CO2. Nitrogen fertilizer products are used primarily in the production of corn. Revenues are seasonal based on the planting, growing, and harvesting cycles of customers who use nitrogen fertilizer.
| For the Three Months Ended March 31, |
||||||||
| 2016 | 2015 | |||||||
| (in millions) | ||||||||
| Revenues: |
||||||||
| Product shipments |
$ | 34.6 | $ | 36.6 | ||||
| Other |
0.2 | 0.2 | ||||||
|
|
|
|
|
|||||
| Total revenues |
$ | 34.8 | $ | 36.8 | ||||
|
|
|
|
|
|||||
23
| For the Three Months Ended March 31, 2016 |
For the Three Months Ended March 31, 2015 |
|||||||||||||||
| Tons | Revenue | Tons | Revenue | |||||||||||||
| (in thousands) | (in millions) | (in thousands) | (in millions) | |||||||||||||
| Revenues: |
||||||||||||||||
| Ammonia |
44 | $ | 17.7 | 31 | $ | 15.9 | ||||||||||
| UAN |
49 | 11.2 | 48 | 12.9 | ||||||||||||
| Urea (liquid and granular) |
14 | 4.6 | 16 | 6.8 | ||||||||||||
| Carbon dioxide (CO2) |
15 | 0.5 | 14 | 0.5 | ||||||||||||
| Nitric acid |
2 | 0.7 | 2 | 0.6 | ||||||||||||
| Other |
N/A | 0.1 | N/A | 0.1 | ||||||||||||
|
|
|
|
|
|
|
|
|
|||||||||
| Total |
124 | $ | 34.8 | 111 | $ | 36.8 | ||||||||||
|
|
|
|
|
|
|
|
|
|||||||||
Revenues for the three months ended March 31, 2015 were $34.8 million, compared to $36.8 million for the same period in the prior year. The decrease was due to lower sales prices for most products, partially offset by higher sales volumes for ammonia. Ammonia deliveries increased due to selling approximately 5,000 tons by barge in March 2016 and due to early, heavy movement from our leased facility in Niota, Illinois due to favorable weather conditions for ammonia application.
Average sales prices per ton for the three months ended March 31, 2016 were 22% lower for ammonia and 15% lower for UAN, as compared with the same period in the prior year. These two products comprised 83% of our East Dubuque Facility’s revenues for the three months ended March 31, 2016 and 78% for the same period in the prior year. The decrease in nitrogen fertilizer prices between the years was due primarily to an overall softening of the ammonia fertilizer market due to lower corn prices and higher supplies of nitrogen fertilizer.
Other revenues consist of $0.2 million of N2O emissions credit sales for the three months ended March 31, 2016 and $0.1 million of natural gas sales for the three months ended March 31, 2015.
Cost of Sales
| For the Three Months Ended March 31, |
||||||||
| 2016 | 2015 | |||||||
| (in millions) | ||||||||
| Cost of sales |
$ | 20.3 | $ | 19.3 | ||||
Cost of sales primarily consists of the cost of natural gas (East Dubuque’s primary feedstock), labor, depreciation and electricity. Cost of sales for the three months ended March 31, 2016 was $20.3 million, compared to $19.3 million for the same period in the prior year. The increase in the cost of sales was primarily due to an increase in sales volume for ammonia, as discussed above, and due to the gain on gas derivatives being $1.0 million less this year compared to last, partially offset by a significant decrease in natural gas prices.
Gross Profit
| For the Three Months Ended March 31, |
||||||||
| 2016 | 2015 | |||||||
| (in millions) | ||||||||
| Gross profit |
$ | 14.5 | $ | 17.4 | ||||
Gross profit was $14.5 million for the three months ended March 31, 2016, compared to $17.4 million for the same period in the prior year. Gross profit margin was 42% for the three months ended March 31, 2016, compared to 47% for the same period in the prior year. The decreases in gross profit and gross margin were primarily due to lower sales prices for most products and a lower gain on gas derivatives, partially offset by lower natural gas prices.
Gross profit margin can vary significantly from period to period. Nitrogen fertilizer and natural gas are both commodities, the prices of which can vary significantly from period to period and do not always move in the same direction. In addition, certain fixed costs of operating our East Dubuque Facility are recorded in cost of sales. Their impact on gross profit and gross margins varies as product sales volumes vary seasonally.
24
Operating Expenses
| For the Three Months Ended March 31, |
||||||||
| 2016 | 2015 | |||||||
| (in millions) | ||||||||
| Operating expenses |
||||||||
| Selling, general and administrative |
$ | 1.0 | $ | 1.3 | ||||
| Other |
0.1 | 0.1 | ||||||
|
|
|
|
|
|||||
| Operating expenses |
$ | 1.1 | $ | 1.4 | ||||
|
|
|
|
|
|||||
Operating expenses for the East Dubuque Facility were $1.1 million for the three months ended March 31, 2016, compared to $1.4 million for the three months ended March 31, 2015. These expenses were primarily comprised of selling, general and administrative expenses.
Selling, General and Administrative Expenses. Selling, general and administrative expenses for the three-month period ended March 31, 2016 were $1.0 million, compared to $1.3 million for the same period in the prior year. The decrease was primarily due to severance costs in the prior year.
Operating Income
| For the Three Months Ended March 31, |
||||||||
| 2016 | 2015 | |||||||
| (in millions) | ||||||||
| Operating income |
$ | 13.4 | $ | 16.0 | ||||
Operating income was $13.4 million for the three months ended March 31, 2016, compared to $16.0 million for the same period in the prior year. The decrease was primarily due to higher sales volumes for ammonia and lower natural gas costs, more than offset by lower sales prices for most products and a lower gain on gas derivatives.
Year Ended December 31, 2015 compared to the Year Ended December 31, 2014
Revenues
| For the Years Ended December 31, |
||||||||
| 2015 | 2014 | |||||||
| (in millions) | ||||||||
| Revenues: |
||||||||
| Product Shipments |
$ | 200.3 | $ | 189.8 | ||||
| Other |
1.0 | 6.6 | ||||||
|
|
|
|
|
|||||
| Total revenues |
$ | 201.3 | $ | 196.4 | ||||
|
|
|
|
|
|||||
| For the Year Ended December 31, 2015 |
For the Year Ended December 31, 2014 |
|||||||||||||||
| Tons | Revenue | Tons | Revenue | |||||||||||||
| (in thousands) | (in millions) | (in thousands) | (in millions) | |||||||||||||
| Revenues: |
||||||||||||||||
| Ammonia |
186 | $ | 100.1 | 153 | $ | 83.8 | ||||||||||
| UAN |
276 | 70.2 | 267 | 74.7 | ||||||||||||
| Urea (liquid and granular) |
62 | 24.3 | 55 | 24.9 | ||||||||||||
| CO2 |
72 | 2.3 | 81 | 2.6 | ||||||||||||
| Nitric Acid |
10 | 3.3 | 11 | 3.8 | ||||||||||||
| Other |
N/A | 1.1 | N/A | 6.6 | ||||||||||||
|
|
|
|
|
|
|
|
|
|||||||||
| Total |
606 | $ | 201.3 | 567 | $ | 196.4 | ||||||||||
|
|
|
|
|
|
|
|
|
|||||||||
Revenues for the year ended December 31, 2015 were $201.3 million, compared to $196.4 million for the same period in the prior year. The increase was primarily due to higher sales volumes for ammonia, partially offset by lower sales prices for all nitrogen fertilizer products, and lower natural gas sales.
25
Ammonia deliveries increased due to strong demand from agricultural and industrial customers. Volumes were low in 2014 because production was interrupted by a planned turnaround and a fire in the fourth quarter of 2013 that reduced product available for sale in 2014, and production was purposely reduced in order to sell natural gas at high prices in the first quarter of 2014. In addition, production was higher in 2015 due to the completion of an expansion project to increase ammonia production capacity.
Average sales prices per ton for the year ended December 31, 2015 were 2% lower for ammonia and 9% lower for UAN, as compared to the year ended December 31, 2014. These two products comprised 85% of our East Dubuque Facility’s revenues for the year ended December 31, 2015 and 81% for the year ended December 31, 2014. The decrease in nitrogen fertilizer prices between the years was due primarily to an overall softening of the ammonia fertilizer market due to lower corn prices and higher supplies of nitrogen fertilizer.
Other revenues consist primarily of natural gas sales. We occasionally sell natural gas when purchase commitments exceed production requirements or storage capacities, or when the margin from selling natural gas significantly exceeds the margin from producing additional ammonia. During the year ended December 31, 2015, we recorded $0.5 million in each of natural gas sales and sales of nitrous oxide emission reduction credits. During the year ended December 31, 2014, we recorded $6.1 million in natural gas sales and $0.5 million in sales of nitrous oxide emission reduction credits. On rare occasions, we have also purchased natural gas with the specific intent of immediately reselling it when local market anomalies create low-risk opportunities for gain. During the first quarter of 2014, temporary operational problems with a natural gas pipeline in the Midwest caused a significant spike in the local price of natural gas. This created a unique opportunity to purchase natural gas from other locations at lower prices for the purpose of reselling it at significantly higher prices. We also sold natural gas originally purchased for production at a gross profit that exceeded the expected gross profits from additional production using that natural gas. During the first quarter of 2014, we sold, at an average price of $29.90 per MMBtu, 151,000 MMBtus of natural gas that cost an average of $9.42 per MMBtu. The total $4.5 million in natural gas sales in the first quarter resulted in a gross profit of $3.1 million, which was significantly higher than the profit we would likely have realized on the 2,900 tons of lost ammonia production.
Cost of Sales
| For the Years Ended December 31, |
||||||||
| 2015 | 2014 | |||||||
| (in millions) | ||||||||
| Total cost of sales |
$ | 105.2 | $ | 121.6 | ||||
|
|
|
|
|
|||||
Cost of sales primarily consists of the cost of natural gas (East Dubuque’s primary feedstock), labor, depreciation and electricity. Cost of sales for the year ended December 31, 2015 was $105.2 million, compared to $121.6 million for the same period in the prior year. The decrease in cost of sales was primarily due to business interruption insurance proceeds and a decrease in natural gas costs. During the year ended December 31, 2015, we recorded $4.6 million in business interruption insurance proceeds relating to the 2013 fire. Decreased natural gas costs were due to a $6.4 million increase in unrealized gain on natural gas derivatives and a decrease in natural gas prices. Natural gas, including unrealized gains (losses) on natural gas derivatives, comprised 42% and labor costs comprised 15% of cost of sales on product shipments for the year ended December 31, 2015. For the year ended December 31, 2014, natural gas, including unrealized gains (losses) on natural gas derivatives, was 50% and labor was 13% of cost of sales. Depreciation expense included in cost of sales was $18.0 million for the year ended December 31, 2015 and $15.7 million for the year ended December 31, 2014. The increase in depreciation expense included in cost of sales was primarily due to the increase in ammonia sales volumes as depreciation is a component of the cost of goods and recognized at the time the product is sold. During the year ended December 31, 2014, we recorded $0.9 million of expense reimbursements under an insurance claim filed for the fire, which occurred in 2013.
Gross Profit
| For the Years Ended December 31, |
||||||||
| 2015 | 2014 | |||||||
| (in millions) | ||||||||
| Total gross profit |
$ | 96.1 | $ | 74.8 | ||||
|
|
|
|
|
|||||
Gross profit was $96.1 million for the year ended December 31, 2015, compared to $74.8 million for the year ended December 31, 2014. Gross profit margin was 48% for the year ended December 31, 2015, compared to 38% for the year ended December 31, 2014. The increases in gross profit and gross margin were primarily due to higher sales volumes for ammonia, business
26
interruption insurance proceeds and lower natural gas costs, partially offset by lower sales prices for all nitrogen fertilizer products. Gross profit margin, without business interruption insurance proceeds and natural gas derivatives, was 45% for the year ended December 31, 2015, compared to 40%, without natural gas derivatives, for the same period in the prior year.
Gross profit margin can vary significantly from period to period. Nitrogen fertilizer and natural gas are both commodities, the prices of which can vary significantly from period to period and do not always move in the same direction. In addition, certain fixed costs of operating our East Dubuque Facility are recorded in cost of sales. Their impact on gross profit and gross margins varies as product sales volumes vary seasonally.
During the fourth quarter of 2014, our East Dubuque Facility’s ammonia plant was shut down for seven days for unplanned repairs and maintenance. Also, during the third quarter of 2014, our East Dubuque Facility’s ammonia plant was shut down for ten days for unplanned repairs and maintenance. Gross profit was negatively impacted as the outages reduced the amount of product available for sale. Problems with the ammonia synthesis converter caused the shut-downs in both of the outage cases. The converter was damaged during a fire in 2013, then repaired and returned to service. The facility is currently operating near capacity, but it is possible that additional repairs will be needed before the converter is expected to be replaced before the end of summer 2016.
Operating Expenses
| For the Years Ended December 31, |
||||||||
| 2015 | 2014 | |||||||
| (in millions) | ||||||||
| Operating expenses: |
||||||||
| Selling, general and administrative |
$ | 4.6 | $ | 4.2 | ||||
| Depreciation and amortization |
0.3 | 0.2 | ||||||
| Other |
0.4 | 0.5 | ||||||
|
|
|
|
|
|||||
| Total operating expenses |
$ | 5.3 | $ | 4.9 | ||||
|
|
|
|
|
|||||
Operating expenses were $5.3 million for the year ended December 31, 2015, compared to $4.9 million for the year ended December 31, 2014. These expenses were primarily comprised of selling, general and administrative expenses, and depreciation expense.
Selling, General and Administrative Expenses. Selling, general and administrative expenses for the year ended December 31, 2015 were $4.6 million, compared to $4.2 million for the year ended December 31, 2014. This increase was primarily due to an increase in bonus expense of $0.5 million.
Depreciation and Amortization. Depreciation expense included in operating expense was $0.3 million for the year ended December 31, 2015, compared to $0.2 million for the year ended December 31, 2014. The majority of depreciation expense incurred was a manufacturing cost and was distributed between cost of sales and finished goods inventory, based on production volumes and ending inventory levels. However, a portion of depreciation expense was associated with assets supporting general and administrative functions and was recorded in operating expense.
Other. Other expenses include loss on disposal of fixed assets, which was $0.4 million for the year ended December 31, 2015, compared to $0.5 million for the prior year.
Operating Income
| For the Years Ended December 31, |
||||||||
| 2015 | 2014 | |||||||
| (in millions) | ||||||||
| Total operating income |
$ | 90.8 | $ | 69.9 | ||||
|
|
|
|
|
|||||
Operating income was $90.8 million for the year ended December 31, 2015, compared to $69.9 million for the year ended December 31, 2014. The increase was primarily due to higher sales volumes for ammonia, business interruption insurance proceeds and lower natural gas costs, partially offset by lower sales prices for all nitrogen fertilizer products.
27
Year Ended December 31, 2014 compared to the Year Ended December 31, 2013
Revenues
| For the Years Ended December 31, |
||||||||
| 2014 | 2013 | |||||||
| (in millions) | ||||||||
| Revenues: |
||||||||
| Product Shipments |
$ | 189.8 | $ | 174.2 | ||||
| Other |
6.6 | 3.5 | ||||||
|
|
|
|
|
|||||
| Total revenues |
$ | 196.4 | $ | 177.7 | ||||
|
|
|
|
|
|||||
| For the Year Ended December 31, 2014 |
For the Year Ended December 31, 2013 |
|||||||||||||||
| Tons | Revenue | Tons | Revenue | |||||||||||||
| (in thousands) | (in millions) | (in thousands) | (in millions) | |||||||||||||
| Revenues: |
||||||||||||||||
| Ammonia |
153 | $ | 83.8 | 103 | $ | 66.8 | ||||||||||
| UAN |
267 | 74.7 | 269 | 79.4 | ||||||||||||
| Urea (liquid and granular) |
55 | 24.9 | 43 | 20.5 | ||||||||||||
| CO2 |
81 | 2.6 | 71 | 2.4 | ||||||||||||
| Nitric Acid |
11 | 3.8 | 14 | 5.2 | ||||||||||||
| Other |
N/A | 6.6 | N/A | 3.4 | ||||||||||||
|
|
|
|
|
|
|
|
|
|||||||||
| Total |
567 | $ | 196.4 | 500 | $ | 177.7 | ||||||||||
|
|
|
|
|
|
|
|
|
|||||||||
Revenues were $196.4 million for the year ended December 31, 2014 compared to $177.7 million for the year ended December 31, 2013. The increase was due to higher sales volumes for ammonia and urea and higher natural gas sales, partially offset by lower sales prices for ammonia, UAN and urea.
Ammonia production capacity increased 23% after we completed the ammonia expansion project in December 2013. This additional ammonia available for sale enabled higher ammonia deliveries during the year ended December 31, 2014. During the fourth quarter of 2013, production was interrupted due to a planned turnaround and a subsequent fire, which resulted in lower amounts of ammonia available for sale in 2013. Urea sales increased during 2014 due to higher sales of DEF and granular urea.
Average sales prices per ton for the year ended December 31, 2014 were 16% lower for ammonia and 5% lower for UAN, as compared to the year ended December 31, 2013. These two products comprised 81% of our East Dubuque Facility’s revenues for the year ended December 31, 2014 and 82% for the year ended December 31, 2013. The decreases in our sales prices for ammonia and UAN were consistent with the decline in global nitrogen fertilizer prices in the earlier portions of the respective years, partially offset by increases in the latter portions of the respective years. These decreases were caused by significantly higher levels of low-priced urea in the global market, particularly from China. Prices were also affected by additional nitrogen fertilizer production brought on line in North America over the last 12 months.
Other revenues consist primarily of natural gas sales. We occasionally sell natural gas when purchase commitments exceed production requirements or storage capacities, or when the margin from selling natural gas significantly exceeds the margin from producing additional ammonia. During the year ended December 31, 2014, we recorded $6.1 million in natural gas sales and $0.5 million in sales of nitrous oxide emission reduction credits. On rare occasions, we have also purchased natural gas with the specific intent of immediately reselling it when local market anomalies create low-risk opportunities for gain. During the first quarter of 2014, temporary operational problems with a natural gas pipeline in the Midwest caused a significant spike in the local price of natural gas. This created a unique opportunity to purchase natural gas from other locations at lower prices for the purpose of reselling it at significantly higher prices. We also sold natural gas originally purchased for production at a gross profit that exceeded the expected gross profits from additional production using that natural gas. During the first quarter of 2014, we sold, at an average price of $29.90 per MMBtu, 151,000 MMBtus of natural gas that cost an average of $9.42 per MMBtu. The total $4.5 million in natural gas sales in the first quarter resulted in a gross profit of $3.1 million, which was significantly higher than the profit we would likely have realized on the 2,900 tons of lost ammonia production. During the year ended December 31, 2013, we recorded $3.4 million in natural gas sales and $0.1 million in sales of nitrous oxide emission reduction credits.
28
Cost of Sales
| For the Years Ended December 31, |
||||||||
| 2014 | 2013 | |||||||
| (in millions) | ||||||||
| Total cost of sales |
$ | 121.6 | $ | 96.8 | ||||
|
|
|
|
|
|||||
Cost of sales primarily consists of the cost of natural gas (East Dubuque’s primary feedstock), labor, depreciation and electricity. Cost of sales for the year ended December 31, 2014 was $121.6 million, compared to $96.8 million for the same period in the prior year. The increase in the cost of sales was primarily due to an increase in depreciation, the cost of natural gas and electricity. Increased natural gas costs were due to an increase in product sales volumes, additional natural gas purchased for resale and a loss on natural gas derivatives of $4.0 million. Natural gas, including unrealized gain (losses) on natural gas derivatives, comprised 50% and labor costs comprised 13% of cost of sales on product shipments for the year ended December 31, 2014. For the year ended December 31, 2013, natural gas was 43% and labor was 12% of cost of sales. Depreciation expense included in cost of sales was $15.7 million for the year ended December 31, 2014 and $9.0 million for the year ended December 31, 2013. The increase in depreciation expense was primarily due to the completion of the ammonia expansion project in late 2013. Increased electricity costs reflected higher rates and usage due in part to the new equipment installed as part of the ammonia expansion project. During the year ended December 31, 2014, we recorded $0.9 million of expense reimbursements under an insurance claim filed for the fire, which occurred in 2013.
Gross Profit
| For the Years Ended December 31, |
||||||||
| 2014 | 2013 | |||||||
| (in millions) | ||||||||
| Total gross profit |
$ | 74.8 | $ | 80.9 | ||||
|
|
|
|
|
|||||
Gross profit was $74.8 million for the year ended December 31, 2014, compared to $80.9 million for the year ended December 31, 2013. Gross profit margin was 38% for the year ended December 31, 2014, compared to 46% for the year ended December 31, 2013. The decreases in gross profit and gross margin were primarily due to lower product pricing and increased costs of natural gas, depreciation and electricity.
Gross profit margin can vary significantly from period to period. Nitrogen fertilizer and natural gas are both commodities, the prices of which can vary significantly from period to period and do not always move in the same direction. In addition, certain fixed costs of operating our East Dubuque Facility are recorded in cost of sales. Their impact on gross profit and gross margins varies as product sales volumes vary seasonally.
During the fourth quarter of 2014, our East Dubuque Facility’s ammonia plant was shut down for seven days for unplanned maintenance. Also, during the third quarter of 2014, our East Dubuque Facility’s ammonia plant was shut down for ten days for unplanned maintenance. Gross profit was negatively impacted as the outages reduced the amount of product available for sale. Problems with the ammonia synthesis converter caused the shut-downs in both of the outage cases. The converter was damaged during a fire in 2013, then repaired and returned to service. The facility is currently operating near capacity, but it is possible that additional repairs will be needed before the converter is expected to be replaced before the end of summer 2016.
Operating Expenses
| For the Years Ended December 31, |
||||||||
| 2014 | 2013 | |||||||
| (in millions) | ||||||||
| Operating expenses: |
||||||||
| Selling, general and administrative |
$ | 4.2 | $ | 4.6 | ||||
| Depreciation and amortization |
0.2 | 0.2 | ||||||
| Other |
0.5 | 0.8 | ||||||
|
|
|
|
|
|||||
| Total operating expenses |
$ | 4.9 | $ | 5.6 | ||||
|
|
|
|
|
|||||
29
Operating expenses were $4.9 million for the year ended December 31, 2014, compared to $5.6 million for the year ended December 31, 2013. These expenses were primarily comprised of selling, general and administrative expenses, depreciation expense and asset disposal costs.
Selling, General and Administrative Expenses. Selling, general and administrative expenses for the year ended December 31, 2014 were $4.2 million, compared to $4.6 million for the year ended December 31, 2013. This decrease was primarily due to decreases in various professional services fees of $0.3 million.
Depreciation and Amortization. Depreciation expense included in operating expense was $0.2 million for the years ended December 31, 2014 and 2013. The majority of depreciation expense incurred was a manufacturing cost and was distributed between cost of sales and finished goods inventory, based on production volumes and ending inventory levels. However, a portion of depreciation expense was associated with assets supporting general and administrative functions and was recorded in operating expense.
Other. Other expenses include loss on disposal of fixed assets, which was $0.5 million for the year ended December 31, 2014, compared to $0.8 million for the prior year.
Operating Income
| For the Years Ended December 31, |
||||||||
| 2014 | 2013 | |||||||
| (in millions) | ||||||||
| Total operating income |
$ | 69.9 | $ | 75.3 | ||||
|
|
|
|
|
|||||
Operating income was $69.9 million for the year ended December 31, 2014, compared to $75.3 million for the year ended December 31, 2013. The decrease was primarily due to lower product pricing, and increased costs of natural gas, depreciation and electricity.
Cash Flows—Three Months Ended March 31, 2016 Compared to the Three Months Ended March 31, 2015
The following table summarizes our consolidated statements of cash flows, including both the East Dubuque Facility and the East Dubuque Partnership:
| Three Months Ended March 31, |
||||||||
| 2016 | 2015 | |||||||
| (in millions) | ||||||||
| Net cash flow provided by (used in): |
||||||||
| Operating activities |
$ | 25.1 | $ | 21.3 | ||||
| Investing activities |
(4.9 | ) | (7.0 | ) | ||||
| Financing activities |
6.4 | (7.7 | ) | |||||
|
|
|
|
|
|||||
| Net increase in cash |
$ | 26.6 | $ | 6.6 | ||||
|
|
|
|
|
|||||
Operating Activities
Net cash provided by operating activities for the three months ended March 31, 2016 was $25.1 million. We had net income of $5.2 million for the three months ended March 31, 2016. Depreciation for the three months ended March 31, 2016 was $4.1 million. We had an unrealized gain on natural gas derivatives of $1.5 million relating to our forward purchase natural gas contracts. Inventories increased by $3.4 million during the three months ended March 31, 2016 due to the normal seasonality of our business. During the winter months, we typically build inventory balances for the high volume spring planting season. Deferred revenue increased $18.3 million during the three months ended March 31, 2016 due to receiving cash for prepaid sales contracts in the first quarter for delivery during the high volume planting season in the second quarter. Accrued interest increased $4.9 million, due primarily to the accumulation of interest leading up to the semi-annual interest payment in April 2016. Accrued expenses decreased by $3.2 million due primarily to timing of large payments for merger related costs, the Agrium Distribution Agreement cancellation, and capital projects.
30
Net cash provided by operating activities for the three months ended March 31, 2015 was $21.3 million. We had net income of $8.8 million for the three months ended March 31, 2015. Depreciation for the three months ended March 31, 2015 was $3.3 million. Accounts receivable increased by $1.8 million, primarily due to timing on collections. Inventories increased by $5.6 million during this period, which was primarily due to the normal seasonality of our business. Deferred revenue increased $18.2 million during the three months ended March 31, 2015 due to receiving cash for prepaid sales contracts in the first quarter for delivery during the high volume planting season in the second quarter. Accrued interest increased $4.6 million, due primarily to the accumulation of interest leading up to the semi-annual interest payment in April 2015.
Investing Activities
Net cash used in investing activities was $4.9 million for the three months ended March 31, 2016, compared to $7.0 million for the same period in the prior year. Net cash used in investing activities was primarily related to capital projects at our East Dubuque Facility. Net cash used in investing activities for the three months ended March 31, 2016 was primarily related to replacing the ammonia synthesis converter. Net cash used in investing activities for the three months ended March 31, 2015 was primarily related to upgrading a nitric acid compressor train and replacing the ammonia synthesis converter.
Financing Activities
Net cash provided by financing activities was $6.4 million for the three months ended March 31, 2016, compared to net cash used in operating activities of $7.7 million for the same period in the prior year. During the three months ended March 31, 2016, we made distributions of $8.2 million to our unitholders and borrowed $14.6 million under the GE Credit Facility. During the three months ended March 31, 2015, we made distributions of $11.7 million to our unitholders and borrowed $4.0 million under the GE Credit Facility.
Liquidity and Capital Resources
Our principal source of liquidity has historically been cash from operations, which can include cash advances from customers resulting from forward sales. Our principal uses of cash are funding our operations, distributions to common unitholders, capital expenditures and funding our debt service obligations.
On April 1, 2016, we incurred additional indebtedness in connection with consummating the Merger. The additional indebtedness included the 2021 Notes and also included amounts drawn on the Coffeyville Credit Facility to repay the outstanding balances under the GE Credit Facility (as defined below), as discussed below under “Merger-Related Financing Arrangements.” The outstanding balance under the GE Credit Facility was repaid in full and the GE Credit Facility was terminated on April 1, 2016. The repayment of the GE Credit Facility was funded from amounts drawn on the Coffeyville Credit Facility.
Also on April 1, 2016, the Partnership repaid all amounts outstanding under the Credit Agreement as defined and discussed in the notes to our audited consolidated financial statements. Effective upon such repayment, the Credit Agreement and all related loan documents and security interests were terminated and released. The repayment was funded from amounts drawn on the Coffeyville Credit Facility.
Depending on the needs of our business, contractual limitations and market conditions, we may from time to time seek to issue equity securities, incur additional debt, issue debt securities, or otherwise refinance our existing debt. There can be no assurance that we will seek to do any of the foregoing or that we will be able to do any of the foregoing on terms acceptable to us or at all. Further discussion of declared cash distributions is included below under “Distributions to Unitholders.”
Cash Balance and Other Liquidity
As of March 31, 2016, we had cash and cash equivalents of $52.0 million, including $0.8 million of customer advances. Working capital at March 31, 2016 was $76.5 million, consisting of $96.7 million in current assets and approximately $20.2 million in current liabilities. Working capital at December 31, 2015 was $72.7 million, consisting of $98.5 million in current assets and $25.9 million in current liabilities.
Interest Rate Swaps
Prior to the termination of the Credit Agreement on April 1, 2016, our profitability and cash flows were affected by changes in interest rates on our credit facility borrowings, specifically LIBOR and prime rates. The primary purpose of our interest rate risk management activities was to hedge our exposure to changes in interest rates by using interest rate derivatives to convert some or all of the interest rates we paid on our borrowings from a floating rate to a fixed interest rate.
31
We determined that the two interest rate swap agreements entered into in 2011 qualify for hedge accounting treatment. The impact recorded for the three months ended March 31, 2016 and 2015 was $0.1 million and $0.3 million, respectively, in interest expense. For the three months ended March 31, 2016 and 2015, the Partnership recorded a loss of approximately $0.0 million and $0.1 million, respectively, in the fair market value on the interest rate swaps. The interest rate swaps expired on February 12, 2016.
Merger-Related Financing Arrangements
On April 12, 2013, CVR Nitrogen and Finance Co. issued the 2021 Notes to qualified institutional buyers and non-U.S. persons in a private offering exempt from the registration requirements of the Securities Act of 1933, as amended. The 2021 Notes bear interest at a rate of 6.5% per year, payable semi-annually in arrears on April 15 and October 15 of each year. The 2021 Notes will mature on April 15, 2021, unless repurchased or redeemed earlier in accordance with their terms.
The 2021 Notes are fully and unconditionally guaranteed, jointly and severally, by each of CVR Nitrogen’s existing domestic subsidiaries, other than Finance Co. In addition, the 2021 Notes and the guarantees thereof are collateralized by a second priority lien on substantially all of CVR Nitrogen’s and the guarantors’ assets, subject to permitted liens.
On April 29, 2016, CVR Nitrogen commenced the Tender Offer and Consent Solicitation with respect to the outstanding 2021 Notes. CVR Nitrogen offered to purchase any and all of the outstanding 2021 Notes and solicited the consents of holders of the 2021 Notes to certain proposed amendments to the indenture governing the 2021 Notes, including elimination of the restrictive covenants and liens on collateral discussed above. As of the withdrawal deadline for the Tender Offer and Consent Solicitation on May 26, 2016, CVR Nitrogen had received Consents from holders of approximately 98.5% of the total outstanding principal amount of the 2021 Notes. CVR Nitrogen expects to settle the Tender Offer and execute the supplemental indenture to effect the Proposed Amendments on June 8, 2016 with the Proposed Amendments becoming operative upon settlement.
On April 1, 2016, in connection with the closing of the Merger, the Partnership entered into a $320.0 million senior term loan facility (the “AEPC Facility”) with American Entertainment Properties Corp., an affiliate of the Partnership (“AEPC”), as the lender, which (i) may be used by the Partnership to provide funds to CVR Nitrogen to make a change of control offer and, if applicable, a “clean-up” redemption in accordance with the 2021 Notes Indenture or (ii) may be used by the Partnership or CVR Nitrogen to make a tender offer for the 2021 Notes and, in each case, pay fees and expenses related thereto. The AEPC Facility is for a term of two years and bears interest at a rate of 12% per annum. Calculation of interest shall be on the basis of the actual number of days elapsed over a 360-day year and payable quarterly. We intend to use a portion of the proceeds from this offering to fund the Tender Offer. As a result, we do not expect to borrow amounts available under the AEPC Facility.
The AEPC Facility contains covenants that require the Partnership to, among other things, notify AEPC of the occurrence of any default or event of default and provide AEPC with information in respect of the Partnership’s business and financial status as it may reasonably require, including, but not limited to, copies of the Partnership’s unaudited quarterly financial statements and audited annual financial statements. In addition, the AEPC Facility contains customary events of default, including, among others, failure to pay any sum payable when due and the occurrence of a default of other indebtedness in excess of $25.0 million.
Immediately prior to the Merger, CVR Nitrogen had outstanding advances under the GE Credit Facility. The GE Credit Facility consisted of a $50.0 million senior secured revolving credit facility with a $10.0 million letter of credit sublimit.
On April 1, 2016, in connection with the closing of the Merger, the Partnership entered into the Coffeyville Credit Facility with Coffeyville Resources, as the lender, the proceeds of which were used by the Partnership (i) to fund the repayment of amounts outstanding under the GE Credit Facility, (ii) to pay the cash consideration and to pay fees and expenses in connection with the Merger and related transactions and (iii) to repay all of the loans outstanding under the Credit Agreement. The Coffeyville Credit Facility has a term of two years and bears an interest rate of 12.0% per annum. Interest is calculated on the basis of the actual number of days elapsed over a 360-day year and payable quarterly. The Partnership may voluntarily prepay in whole or in part the borrowings under the Coffeyville Credit Facility without premium or penalty. In April 2016, the Partnership borrowed $300.0 million under the Coffeyville Credit Facility.
The Coffeyville Credit Facility contains covenants that require the Partnership to, among other things, notify Coffeyville Resources of the occurrence of any default or event of default and provide Coffeyville Resources with information in respect of the Partnership’s business and financial status as it may reasonably require, including, but not limited to, copies of the Partnership’s unaudited quarterly financial statements and audited annual financial statements. In addition, the Coffeyville Credit Facility contains customary events of default, including, among others, failure to pay any sum payable when due and the occurrence of a default of other indebtedness in excess of $25.0 million.
32
We expect to use the proceeds from this offering to repay in full and terminate the Coffeyville Credit Facility and fund our Tender Offer.
Capital Spending
Our total capital expenditures for the three months ended March 31, 2016 were approximately $1.7 million. We divide our capital spending needs into two categories: maintenance and growth. Maintenance capital spending includes only non-discretionary maintenance projects and projects required to comply with environmental, health and safety regulations. We also treat maintenance capital spending as a reduction of cash available for distribution to unitholders. Growth capital projects generally involve an expansion of existing capacity, improvement in product yields and/or a reduction in direct operating expenses. Of the $1.7 million spent for the three months ended March 31, 2016, approximately $0.9 million was related to maintenance capital projects and the remainder was related to growth capital projects. For the three months ended March 31, 2016, capital expenditures were the result of various individually less significant projects.
Capital spending for our business has been and will be determined by the Board of Directors of our general partner. Our maintenance capital expenditures for our Coffeyville Facility are expected to be approximately $7.0 million to $10.0 million for the year ending December 31, 2016. Maintenance capital expenditures for the East Dubuque Facility subsequent to the completion of the Merger are expected to be approximately $10.0 million to $12.0 million for nine months ending December 31, 2016.
The East Dubuque Facility has started an ammonia synthesis converter project, the cost of which is categorized as growth capital spending. Replacement of an ammonia synthesis converter at the East Dubuque Facility is expected to increase reliability, production and plant efficiency. The project is expected to be completed before the end of the second quarter of 2016, and post-merger expenditures for this project are estimated to be between $8.0 million to $11.0 million.
Future capital spending estimates may change as a result of unforeseen circumstances and a change in our plans and may be revised from time to time or amounts may not be spent in the manner discussed herein. Planned capital expenditures for 2016 are subject to change due to unanticipated increases in the cost, scope and completion time for our capital projects. For example, we may experience increases in labor or equipment costs necessary to comply with government regulations or to complete projects that sustain or improve the profitability of our nitrogen fertilizer plants.
Major Scheduled Turnaround Expenditures
Consistent, safe and reliable operations are critical to our financial performance and results of operations. Unplanned downtime of either plant may result in lost margin opportunity, increased maintenance expense and a temporary increase in working capital investment and related inventory position. The financial impact of planned downtime, such as major turnaround maintenance, is mitigated through a diligent planning process that takes into account margin environment, the availability of resources to perform the needed maintenance, feedstock logistics and other factors.
Historically, the Coffeyville Facility has undergone a full facility turnaround every two to three years. Turnarounds at the Coffeyville Facility are expected to last 14-21 days. The Coffeyville Facility underwent a full facility turnaround in the third quarter of 2015, at a cost of approximately $7.0 million. The Partnership is planning to undergo the next scheduled full facility turnaround at the Coffeyville Facility in the second half of 2017.
Historically, the East Dubuque Facility has also undergone a full facility turnaround every two to three years. The East Dubuque Facility is planning to undergo the next scheduled full facility turnaround in the second quarter of 2016. The turnaround is expected to last between 25-30 days. Expenses associated with the East Dubuque Facility turnaround are estimated to be between $5.0 million to $7.0 million. The lost production during the downtime is expected to result in reduced sales and reduced variable expenses for the East Dubuque Facility during 2016.
Distributions to Unitholders
The board of directors of the Partnership’s general partner has a policy for the Partnership to distribute all available cash generated on a quarterly basis. On March 7, 2016, the Partnership paid a cash distribution to the Partnership’s unitholders of record on the close of business on February 29, 2016 for the fourth quarter of 2015 in the amount of $0.27 per common unit, or $19.7 million in aggregate.
33
Capital and Commercial Commitments
We are required to make payments relating to various types of obligations. The following table summarizes our minimum payments as of April 1, 2016 relating to long-term debt, operating leases, unconditional purchase obligations with third parties and affiliates and interest payments for the five years ending December 31, 2020 and thereafter.
Contractual Obligations
The following table summarizes the contractual obligations of CVR Partners, including the East Dubuque Facility, as of April 1, 2016:
| Payments Due by Period | ||||||||||||||||||||||||||||
| Total | 2016 | 2017 | 2018 | 2019 | 2020 | Thereafter | ||||||||||||||||||||||
| (in millions) | ||||||||||||||||||||||||||||
| Long-term debt(1) |
$ | 595.0 | $ | 320.0 | $ | 0.0 | $ | 275.0 | $ | 0.0 | $ | 0.0 | $ | 0.0 | ||||||||||||||
| Operating leases(2) |
15.6 | 4.0 | 3.4 | 2.6 | 1.9 | 1.4 | 2.3 | |||||||||||||||||||||
| Unconditional purchase obligations with third parties(3) |
33.0 | 11.5 | 6.9 | 5.3 | 4.9 | 1.7 | 2.7 | |||||||||||||||||||||
| Unconditional purchase obligations with affiliates(4) |
87.6 | 5.7 | 7.9 | 7.9 | 6.6 | 7.3 | 52.2 | |||||||||||||||||||||
| Interest payments(5) |
175.9 | 42.5 | 56.8 | 29.8 | 20.8 | 20.8 | 5.2 | |||||||||||||||||||||
|
|
|
|
|
|
|
|
|
|
|
|
|
|
|
|||||||||||||||
| Total |
$ | 907.1 | $ | 383.7 | $ | 75.0 | $ | 320.6 | $ | 34.2 | $ | 31.2 | $ | 62.4 | ||||||||||||||
|
|
|
|
|
|
|
|
|
|
|
|
|
|
|
|||||||||||||||
| (1) | Long-term debt includes the Coffeyville Credit Facility and the 2021 Notes. |
| (2) | We lease various facilities and equipment, primarily railcars, under non-cancelable operating leases for various periods. |
| (3) | The amounts include commitments under a product supply agreement with Linde that expires in 2020 and a pet coke supply agreement with HollyFrontier Corporation that expires in December 2016. |
| (4) | The amounts include commitments under our long-term pet coke supply agreement with CRRM, having an initial term that ends in 2027, subject to renewal. The Partnership’s purchase obligations for pet coke from CRRM have been derived from a calculation of the average pet coke price paid to CRRM over the preceding two year period. |
| (5) | Interest payments are based on the then current interest rate on April 1, 2016. |
Under our long-term pet coke supply agreement with CRRM, we may become obligated to provide security for our payment obligations under the agreement if in CRRM’s sole judgment there is a material adverse change in our financial condition or liquidity position or in our ability to make payments. This security may not exceed an amount equal to 21 times the average daily dollar value of pet coke we purchase for the 90-day period preceding the date on which CRRM gives us notice that it has deemed that a material adverse change has occurred. Unless otherwise agreed by CRRM and us, we can provide such security by means of a standby or documentary letter of credit, prepayment, a surety instrument, or a combination of the foregoing. If we do not provide such security, CRRM may require us to pay for future deliveries of pet coke on a cash-on-delivery basis. If we fail to pay for such deliveries on a cash-on-delivery basis, CRRM may suspend delivery of pet coke until such security is provided and terminate the agreement upon 30 days’ prior written notice. Additionally, we may terminate the agreement within 60 days of providing security, so long as we provide five days’ prior written notice.
Our ability to make payments on and to refinance our indebtedness, to make distributions, to fund planned capital expenditures and to satisfy our other capital and commercial commitments will depend on our ability to generate cash flow in the future. This, to a certain extent, is subject to nitrogen fertilizer margins, natural gas prices and general economic, financial, competitive, legislative, regulatory and other factors that are beyond our control.
Our business may not generate sufficient cash flow from operations, and future borrowings may not be available to us under our credit facility or any replacement credit facility, in an amount sufficient to enable us to make quarterly distributions, finance necessary capital expenditures, service our indebtedness or fund our other liquidity needs. See “Liquidity and Capital Resources” above for further discussion.
Off-Balance Sheet Arrangements
We do not have any “off-balance sheet arrangements” as such term is defined within the rules and regulations of the SEC.
34
Critical Accounting Policies of CVR Partners
We prepare our consolidated financial statements in accordance with GAAP. In order to apply these principles, management must make judgments, assumptions and estimates based on the best available information at the time. Actual results may differ based on the accuracy of the information utilized and subsequent events. Our critical accounting policies, which are described below, could materially affect the amounts recorded in our consolidated financial statements.
Long-Lived Assets
We calculate depreciation and amortization on a straight-line basis over the estimated useful lives of the various classes of depreciable assets. When assets are placed in service, we estimate what we believe are their reasonable useful lives. We account for impairment of long-lived assets in accordance with Accounting Standards Codification (“ASC”) ASC Topic 360, Property, Plant and Equipment—Impairment or Disposal of Long-Lived Assets (“ASC 360”). In accordance with ASC 360, the Partnership reviews long-lived assets (excluding goodwill and intangible assets with indefinite lives) for impairment whenever events or changes in circumstances indicate that the carrying amount of an asset may not be recoverable. Recoverability of assets to be held and used is measured by a comparison of the carrying amount of an asset to estimated undiscounted future net cash flows expected to be generated by the asset. If the carrying amount of an asset exceeds its estimated undiscounted future net cash flows, an impairment charge is recognized for the amount by which the carrying amount of the assets exceeds their fair value. Assets to be disposed of are reported at the lower of their carrying value or fair value less cost to sell. No impairment charges were recognized for any of the periods presented.
Goodwill
To comply with ASC 350, Intangibles—Goodwill and Other (“ASC 350”), we perform a test for goodwill impairment annually, or more frequently in the event we determine that a triggering event has occurred. Our annual testing is performed as of November 1 of each year. In accordance with ASC 350, the Partnership may elect to perform a qualitative assessment to determine whether the two-step quantitative impairment test is required. If the Partnership elects to perform a qualitative assessment, the two-step impairment test is required only if the Partnership concludes that is more likely than not that the reporting unit’s fair value is less than its carrying amount. For the years ending December 31, 2015 and 2014, the Partnership elected to perform a qualitative assessment.
We began the qualitative assessment by analyzing the key drivers and other external factors that impact our business in order to determine if any significant events, transactions or other factors had occurred or are expected to occur that would impair our earnings or competitiveness therefore impairing the fair value of the Partnership. After assessing the totality of events and circumstances, it was determined that it was not more likely than not that the fair value of the Partnership was less than the carrying value, and so it was not necessary to perform the two-step valuation. The key drivers that were considered in the evaluation of the Partnership’s fair value included:
| • | general economic conditions, |
| • | fertilizer pricing, |
| • | input costs, |
| • | liquidity and capital resources, and |
| • | customer outlook. |
Revenue Recognition
Revenues for products sold are recorded upon delivery of the products to customers, which is the point at which title is transferred, the customer has the assumed risk of loss, and when payment has been received or collection is reasonably assured. Sales are recognized when the product is delivered and all significant obligations of the Partnership have been satisfied. Deferred revenue represents customer prepayments under contracts to guarantee a price and supply of nitrogen fertilizer in quantities expected to be delivered in the next 12 months in the normal course of business. Taxes collected from customers and remitted to governmental authorities are not included in reported revenues. Pass-through finished goods delivery costs reimbursed by customers are reported in net sales, while an offsetting expense is included in cost of product sold (exclusive of depreciation and amortization).
35
Allocation of Costs
Our consolidated financial statements include an allocation of costs that have been incurred by CVR Energy or Coffeyville Resources on our behalf. The allocation of such costs is governed by the services agreement entered into by CVR Energy and us and affiliated companies in October 2007 and subsequently amended. The services agreement provides guidance for the treatment of certain general and administrative expenses and certain direct operating expenses incurred on our behalf. Such expenses incurred include, but are not limited to, salaries, benefits, share-based compensation expense, insurance, accounting, tax, legal and technology services.
Fair Value of Financial Instruments
The Partnership uses forward swap contracts primarily to reduce the exposure to changes in interest rates on its debt and to provide a cash flow hedge. These derivative instruments have been designated as hedges for accounting purposes. Accordingly, these instruments are recorded at fair value in the Consolidated Balance Sheets, at each reporting period end. The actual measurement of the cash flow hedge ineffectiveness will be recognized in earnings, if applicable. The effective portion of the gain or loss on the swaps will be reported in accumulated other comprehensive income (loss) (“AOCI”), in accordance with ASC 815, Derivatives and Hedging.
Other financial instruments consisting of cash and cash equivalents, accounts receivable, and accounts payable are carried at cost, which approximates fair value, as a result of the short-term nature of the instruments.
Share-Based Compensation
The Partnership records share-based compensation related to the CVR Partners, LP Long Term Incentive Plan, and we have been allocated share-based compensation expense from CVR Energy and Coffeyville Resources. The Partnership accounts for share-based compensation in accordance with ASC 718, Compensation—Stock Compensation (“ASC 718”). ASC 718 requires that compensation costs relating to share-based payment transactions be recognized in a company’s financial statements. ASC 718 applies to transactions in which an entity exchanges its equity instruments for goods or services and also may apply to liabilities an entity incurs for goods or services that are based on the fair value of those equity instruments.
36
| Page | ||||
| CVR PARTNERS, LP UNAUDITED PRO FORMA FINANCIAL STATEMENTS |
||||
| Unaudited Pro Forma Condensed Combined Financial Information |
31 | |||
| Unaudited Pro Forma Condensed Combined Balance Sheet As of March 31, 2016 |
32 | |||
| 33 | ||||
| Unaudited Pro Forma Condensed Combined Statement of Operations for the Year Ended December 31, 2015 |
34 | |||
| Notes to the Unaudited Pro Forma Condensed Combined Financial Statements |
35 | |||
37
UNAUDITED PRO FORMA CONDENSED COMBINED FINANCIAL INFORMATION
On April 1, 2016, CVR Partners, LP (“CVR Partners”) completed its acquisition via merger of CVR Nitrogen, L.P. (formerly known as Rentech Nitrogen Partners, L.P. and also formerly known as East Dubuque Nitrogen Partners, L.P.) (“CVR Nitrogen”) and CVR Nitrogen GP, LLC (formerly known as Rentech Nitrogen GP, LLC and also formerly known as East Dubuque Nitrogen GP, LLC) (“CVR Nitrogen GP”). Set forth below are the unaudited pro forma condensed combined financial statements and accompanying notes (the “pro forma financial statements”) that give effect to the mergers (defined below). These pro forma financial statements also give effect to the assumed issuance of $625.0 million 8.5% senior secured notes due 2023 and the assumed payoff of the substantial majority of CVR Partners’ and CVR Nitrogen’s debt (collectively with the mergers, the “transactions”).
The unaudited pro forma condensed combined balance sheet as of March 31, 2016 has been prepared to give effect to the mergers as if they had occurred on March 31, 2016. The unaudited pro forma condensed combined statement of operations for the three months ended March 31, 2016 and the year ended December 31, 2015, has been prepared to give effect to the transactions as if they had occurred on January 1, 2015. The pro forma financial statements were prepared using the acquisition method of accounting with CVR Partners as the acquirer. Therefore, the historical basis of CVR Partners’ assets and liabilities was not affected by the mergers.
For purposes of preparing the unaudited pro forma condensed combined balance sheet as of March 31, 2016, CVR Nitrogen’s assets and liabilities have been recorded at their estimated fair values. The fair values assigned in these unaudited pro forma financial statements are preliminary and represent management’s estimate of fair value and are subject to revision. Pro forma adjustments are included only to the extent they are (i) directly attributable to the mergers, (ii) factually supportable, and (iii) with respect to the statement of operations, expected to have a continuing impact on the combined results. The accompanying pro forma financial statements are presented for illustrative purposes only and is based on available information and assumptions CVR Partners believes are reasonable. It does not purport to represent what the actual combined results of operations or the combined financial position of CVR Partners would have been had the mergers occurred on the dates indicated, nor is it necessarily indicative of future combined results of operations or combined financial position. The actual financial position and results of operations will differ, perhaps significantly, from the pro forma amounts reflected herein due to a variety of factors, including access to additional information, final valuations and changes in operating results following the date of the pro forma financial statements.
38
CVR PARTNERS, LP AND SUBSIDIARIES
UNAUDITED PRO FORMA CONDENSED COMBINED BALANCE SHEET AS OF MARCH 31, 2016
| Historical | ||||||||||||||||||||
| Thousands of dollars |
CVR Partners |
CVR Nitrogen, Excluding Pasadena |
Adjustments for the Transactions |
Pro Forma Combined |
||||||||||||||||
| ASSETS |
||||||||||||||||||||
| Current assets: |
||||||||||||||||||||
| Cash and cash equivalents |
$ | 51,979 | $ | 33,772 | $ | 130,926 | (a | ) | $ | 98,759 | ||||||||||
| (6,445 | ) | (b | ) | |||||||||||||||||
| (99,229 | ) | (c | ) | |||||||||||||||||
| (12,244 | ) | (d | ) | |||||||||||||||||
| Accounts receivable, net of allowance for doubtful accounts |
9,066 | 8,941 | — | 18,007 | ||||||||||||||||
| Inventories |
32,592 | 14,652 | 18,444 | (e | ) | 82,511 | ||||||||||||||
| 6,691 | (f | ) | ||||||||||||||||||
| 10,132 | (g | ) | ||||||||||||||||||
| Prepaid expenses and other current assets |
3,100 | 2,036 | (150 | ) | (b | ) | 4,986 | |||||||||||||
| Receivable for working capital adjustment on sale of Pasadena |
— | 4,638 | (4,638 | ) | (h | ) | — | |||||||||||||
|
|
|
|
|
|
|
|
|
|||||||||||||
| Total current assets |
96,737 | 64,039 | 43,487 | 204,263 | ||||||||||||||||
|
|
|
|
|
|
|
|
|
|||||||||||||
| Property, plant and equipment, net of accumulated depreciation |
387,635 | 176,052 | 598,362 | (i | ) | 1,162,049 | ||||||||||||||
| Goodwill |
40,969 | — | — | 40,969 | ||||||||||||||||
| Other long-term assets |
3,881 | — | — | 3,881 | ||||||||||||||||
|
|
|
|
|
|
|
|
|
|||||||||||||
| Total assets |
$ | 529,222 | $ | 240,091 | $ | 641,849 | $ | 1,411,162 | ||||||||||||
|
|
|
|
|
|
|
|
|
|||||||||||||
| LIABILITIES AND PARTNERS’ CAPITAL |
||||||||||||||||||||
| Current liabilities: |
||||||||||||||||||||
| Accounts payable |
$ | 11,488 | $ | 9,067 | $ | (2,710 | ) | (j | ) | $ | 20,266 | |||||||||
| 2,421 | (k | ) | ||||||||||||||||||
| Personnel accruals |
3,162 | — | 2,710 | (j | ) | 6,453 | ||||||||||||||
| 581 | (l | ) | ||||||||||||||||||
| Deferred revenue |
838 | 24,485 | 5,328 | (m | ) | 30,651 | ||||||||||||||
| Accrued expenses and other current liabilities |
4,776 | 14,901 | (2,421 | ) | (k | ) | 17,256 | |||||||||||||
|
|
|
|
|
|
|
|
|
|||||||||||||
| Total current liabilities |
20,264 | 48,453 | 5,909 | 74,626 | ||||||||||||||||
|
|
|
|
|
|
|
|
|
|||||||||||||
| Long-term liabilities: |
||||||||||||||||||||
| Long-term debt, net of current portion |
124,974 | 362,522 | 135,655 | (a | ) | 623,134 | ||||||||||||||
| (17 | ) | (b | ) | |||||||||||||||||
| Other long-term liabilities |
16 | 901 | — | 917 | ||||||||||||||||
|
|
|
|
|
|
|
|
|
|||||||||||||
| Total long-term liabilities |
124,990 | 363,423 | 135,638 | 624,051 | ||||||||||||||||
|
|
|
|
|
|
|
|
|
|||||||||||||
| Partners’ capital: |
||||||||||||||||||||
| Common unitholders’ interest |
383,967 | (171,785 | ) | (433 | ) | (d | ) | 707,920 | ||||||||||||
| (4,729 | ) | (a | ) | |||||||||||||||||
| (6,578 | ) | (b | ) | |||||||||||||||||
| 507,478 | (n | ) | ||||||||||||||||||
| General partner’s interest |
1 | — | — | 1 | ||||||||||||||||
|
|
|
|
|
|
|
|
|
|||||||||||||
| Total partners’ capital (deficit) attributable to the Partnership |
383,968 | (171,785 | ) | 495,738 | 707,921 | |||||||||||||||
|
|
|
|
|
|
|
|
|
|||||||||||||
| Noncontrolling interest |
— | — | 4,564 | (o | ) | 4,564 | ||||||||||||||
|
|
|
|
|
|
|
|
|
|||||||||||||
| Total partners’ capital (deficit) |
383,968 | (171,785 | ) | 500,302 | 712,485 | |||||||||||||||
|
|
|
|
|
|
|
|
|
|||||||||||||
| Total liabilities and partners’ capital |
$ | 529,222 | $ | 240,091 | $ | 641,849 | $ | 1,411,162 | ||||||||||||
|
|
|
|
|
|
|
|
|
|||||||||||||
See the accompanying notes to the unaudited pro forma condensed combined financial statements
39
CVR PARTNERS, LP AND SUBSIDIARIES
UNAUDITED PRO FORMA CONDENSED COMBINED STATEMENT OF OPERATIONS FOR THE THREE MONTHS ENDED MARCH 31, 2016
| Historical | Adjustments for the Transactions |
Pro Forma Combined |
||||||||||||||||||
| Thousands of dollars |
CVR Partners |
CVR Nitrogen, Excluding Pasadena |
||||||||||||||||||
| Net sales |
$ | 73,092 | $ | 34,848 | $ | — | $ | 107,940 | ||||||||||||
| Operating costs and expenses: |
||||||||||||||||||||
| Cost of product sold (exclusive of depreciation and amortization) |
16,381 | — | 2,723 | (a | ) | 19,104 | ||||||||||||||
| Direct operating expenses (exclusive of depreciation and amortization) |
23,690 | — | 13,970 | (a | ) | 37,744 | ||||||||||||||
| 84 | (b | ) | ||||||||||||||||||
| Cost of sales |
— | 20,336 | (20,336 | ) | (a | ) | — | |||||||||||||
| Selling, general and administrative expenses (exclusive of depreciation and amortization) |
6,392 | 3,665 | (1,893 | ) | (d | ) | 8,164 | |||||||||||||
| Depreciation and amortization |
6,976 | — | 3,643 | (a | ) | 19,013 | ||||||||||||||
| 8,394 | (c | ) | ||||||||||||||||||
| Other expense |
— | 84 | (84 | ) | (b | ) | — | |||||||||||||
|
|
|
|
|
|
|
|
|
|||||||||||||
| Total operating costs and expenses |
53,439 | 24,085 | 6,501 | 84,025 | ||||||||||||||||
|
|
|
|
|
|
|
|
|
|||||||||||||
| Operating income (loss) |
19,653 | 10,763 | (6,501 | ) | 23,915 | |||||||||||||||
|
|
|
|
|
|
|
|
|
|||||||||||||
| Other income (expense): |
||||||||||||||||||||
| Interest expense, net |
(1,633 | ) | (5,568 | ) | (6,169 | ) | (e | ) | (13,370 | ) | ||||||||||
| Other income (expense), net |
23 | 15 | — | 38 | ||||||||||||||||
|
|
|
|
|
|
|
|
|
|||||||||||||
| Total other (expense) |
(1,610 | ) | (5,553 | ) | (6,169 | ) | (13,332 | ) | ||||||||||||
|
|
|
|
|
|
|
|
|
|||||||||||||
| Income (loss) before income tax expense (benefit) |
18,043 | 5,210 | (12,670 | ) | 10,583 | |||||||||||||||
| Income tax expense (benefit) |
1 | — | — | 1 | ||||||||||||||||
|
|
|
|
|
|
|
|
|
|||||||||||||
| Net income (loss) |
$ | 18,042 | $ | 5,210 | $ | (12,670 | ) | $ | 10,582 | |||||||||||
|
|
|
|
|
|
|
|
|
|||||||||||||
See the accompanying notes to the unaudited pro forma condensed combined financial statements
40
CVR PARTNERS, LP AND SUBSIDIARIES
UNAUDITED PRO FORMA CONDENSED COMBINED STATEMENT OF OPERATIONS FOR THE YEAR ENDED DECEMBER 31, 2015
| Historical | Adjustments for the Transactions |
Pro Forma Combined |
||||||||||||||||||
| Thousands of dollars |
CVR Partners |
CVR Nitrogen, Excluding Pasadena |
||||||||||||||||||
| Net sales |
$ | 289,194 | $ | 201,344 | $ | — | $ | 490,538 | ||||||||||||
| Operating costs and expenses: |
||||||||||||||||||||
| Cost of product sold (exclusive of depreciation and amortization) |
65,189 | — | 30,144 | (a | ) | 95,333 | ||||||||||||||
| Direct operating expenses (exclusive of depreciation and amortization) |
106,056 | — | 52,808 | (a | ) | 159,554 | ||||||||||||||
| 690 | (b | ) | ||||||||||||||||||
| Cost of sales |
— | 105,238 | (105,238 | ) | (a | ) | — | |||||||||||||
| Selling, general and administrative expenses (exclusive of depreciation and amortization) |
20,768 | 15,663 | 5,000 | (a | ) | 35,437 | ||||||||||||||
| (5,994 | ) | (d | ) | |||||||||||||||||
| Depreciation and amortization |
28,452 | — | 17,286 | (a | ) | 78,485 | ||||||||||||||
| 32,747 | (c | ) | ||||||||||||||||||
| Other expense |
— | 690 | (690 | ) | (b | ) | — | |||||||||||||
|
|
|
|
|
|
|
|
|
|||||||||||||
| Total operating costs and expenses |
220,465 | 121,591 | 26,753 | 368,809 | ||||||||||||||||
|
|
|
|
|
|
|
|
|
|||||||||||||
| Operating income (loss) |
68,729 | 79,753 | (26,753 | ) | 121,729 | |||||||||||||||
|
|
|
|
|
|
|
|
|
|||||||||||||
| Other income (expense): |
||||||||||||||||||||
| Interest expense, net |
(6,840 | ) | (21,701 | ) | (25,674 | ) | (e | ) | (54,215 | ) | ||||||||||
| Other income (expense), net |
164 | (84 | ) | — | 80 | |||||||||||||||
|
|
|
|
|
|
|
|
|
|||||||||||||
| Total other (expense) |
(6,676 | ) | (21,785 | ) | (25,674 | ) | (54,135 | ) | ||||||||||||
|
|
|
|
|
|
|
|
|
|||||||||||||
| Income (loss) before income tax expense (benefit) |
62,053 | 57,968 | (52,427 | ) | 67,594 | |||||||||||||||
| Income tax expense (benefit) |
11 | 22 | — | 33 | ||||||||||||||||
|
|
|
|
|
|
|
|
|
|||||||||||||
| Net income (loss) |
$ | 62,042 | $ | 57,946 | $ | (52,427 | ) | $ | 67,561 | |||||||||||
|
|
|
|
|
|
|
|
|
|||||||||||||
See the accompanying notes to the unaudited pro forma condensed combined financial statements
41
NOTES TO THE UNAUDITED PRO FORMA CONDENSED COMBINED FINANCIAL STATEMENTS
Except as noted within the context of each footnote, the dollar amounts presented in the tabular data within these footnotes are stated in thousands of dollars.
(1) Basis of Presentation
The accompanying unaudited pro forma condensed combined financial statements are intended to reflect the impact of the transactions on CVR Partners’ consolidated financial statements and presents the pro forma condensed combined financial position and results of operations of CVR Partners based on the historical financial statements of CVR Partners and CVR Nitrogen, after giving effect to the transactions and pro forma adjustments as described in these notes. Pro forma adjustments are included only to the extent they are (i) directly attributable to the mergers, (ii) factually supportable and (iii) with respect to the statement of operations, expected to have a continuing impact on the combined results. The accompanying pro forma financial statements are presented for illustrative purposes only and do not reflect the costs of any integration activities or benefits that may result from realization of commercial synergies expected to result from the mergers.
The unaudited pro forma condensed combined balance sheet as of March 31, 2016 has been prepared to give effect to the transactions as if they had occurred on March 31, 2016. The unaudited pro forma condensed combined statement of operations for the three months ended March 31, 2016 and the year ended December 31, 2015, have been prepared to give effect to the transactions as if they had occurred on January 1, 2015.
The mergers will be accounted for using the acquisition method of accounting with CVR Partners as the acquirer of CVR Nitrogen. The pro forma financial statements reflect the preliminary assessment of fair values and useful lives assigned to the assets acquired and liabilities assumed. Fair value estimates were determined based on preliminary discussions between CVR Partners and CVR Nitrogen management, due diligence efforts and information available in public filings. The fair values assigned in these pro forma financial statements are preliminary and represent management’s estimate of fair value and are subject to adjustment. The actual fair values of the assets acquired and liabilities assumed may differ materially from the amounts presented below as further analysis is completed. The final valuation of assets acquired and liabilities assumed may result in different adjustments than those shown in the pro forma financial statements, and these differences may have a material impact on the accompanying pro forma financial statements and the consolidated future results of operations and financial position of the merged entities.
The financing transactions reflected in these pro forma financial statements include the issuance of $625.0 million 8.5% senior secured notes due 2023 (the “Senior Notes”) and the subsequent payoff of the substantial majority of CVR Partners’ and CVR Nitrogen’s debt obligations. The financing costs presented below represent costs that meet the pro forma factually supportable criteria and may differ materially from the actual amounts. The actual interest rate may also vary materially from the interest rate included herein.
(2) The Mergers
On April 1, 2016, CVR Partners, completed the previously announced transactions contemplated by the Agreement and Plan of Merger, dated as of August 9, 2015 (the “Merger Agreement”), by and among CVR Partners, Lux Merger Sub 1 LLC, a wholly owned subsidiary of CVR Partners (“Merger Sub 1”), Lux Merger Sub 2 LLC, a wholly owned subsidiary of CVR Partners (“Merger Sub 2”), CVR Nitrogen and CVR Nitrogen GP. Pursuant to the terms and conditions set forth in the Merger Agreement, (i) Merger Sub 1 merged with and into CVR Nitrogen GP, with CVR Nitrogen GP continuing as the surviving entity as a wholly owned subsidiary of CVR Partners, and (ii) Merger Sub 2 merged with and into CVR Nitrogen, with CVR Nitrogen continuing as the surviving entity as a subsidiary of CVR Partners (collectively, the “mergers”).
Under the terms of the Merger Agreement, holders of CVR Nitrogen common units, except for the parent affiliate units discussed below, received 1.04 CVR Partners common units and $2.57 in cash, without interest, for each CVR Nitrogen common unit held as consideration for the mergers.
CVR Nitrogen was required to sell or spin off its facility located in Pasadena, Texas (the “Pasadena Facility”) as a condition to closing of the mergers. On March 14, 2016, CVR Nitrogen completed the sale of 100% of the issued and outstanding membership interests of its subsidiary that owned the Pasadena Facility to a third party. Holders of common units representing limited partner interests in CVR Nitrogen (“CVR Nitrogen common units”) of record as of March 28, 2016 received consideration for the Pasadena Facility and may receive additional consideration in the future according to the terms of the purchase agreement. For purposes of the pro forma financial statements, it has been assumed that the Pasadena Facility was separated from CVR Nitrogen for the unaudited pro forma condensed combined statement of operations for the three months ended March 31, 2016 and the year ended December 31, 2015.
42
For purposes of these pro forma financial statements, giving effect to the consideration described above, the purchase price consideration to complete the mergers was approximately $434.9 million based upon the price of CVR Partners common units of $8.36 as of the close of trading on March 31, 2016 and 38.6 million CVR Nitrogen common units outstanding, exclusive of the parent affiliate units discussed below. The pro forma financial statements include pro forma adjustments to give effect to the CVR Nitrogen phantom units.
Phantom units granted and outstanding under CVR Nitrogen’s equity plans and held by an employee who continued in the employment of a CVR Partners-affiliated entity upon closing of the mergers were canceled and replaced with new incentive awards of substantially equivalent value and on substantially the same terms and conditions. Each phantom unit granted and outstanding and held by (i) an employee who did not continue in the employment of a CVR Partners-affiliated entity, or (ii) a director of CVR Nitrogen GP, upon closing of the mergers, vested in full and the holders thereof received the merger consideration.
Accounting Standards Codification (“ASC”) 805, “Business Combinations,” requires that the consideration transferred be measured at the date the mergers are completed at the current market price at the date of the closing of the mergers.
The aggregate merger consideration reflected in the pro forma financial statements is approximately $802.4 million, including the fair value of CVR Partners common units issued of approximately $335.7 million, a cash contribution of approximately $99.2 million, and approximately $367.5 million fair value of assumed debt and excluding the fair value of noncontrolling interest.
Parent Affiliate Units
In March 2016, CVR Energy, Inc. (“CVR Energy”) purchased 400.0 thousand CVR Nitrogen common units. Pursuant to the Merger Agreement, any CVR Nitrogen common units held of record by an affiliate of CVR Partners and designated in writing as parent affiliate units remained outstanding as CVR Nitrogen common units following the effective time of the mergers and such affiliate did not receive any merger consideration for those units. Coffeyville Resources, LLC (“CRLLC”), an indirect, wholly-owned subsidiary of CVR Energy, owns CVR Partners’ general partner and 38,920,000 of CVR Partners common units as of March 31, 2016.
Preliminary Purchase Price Consideration
A summary of the total purchase price consideration to be allocated by CVR Partners in the acquisition of CVR Nitrogen is provided below, in thousands.
| Purchase Price: |
||||
| Fair value of CVR Partners common units issued, as of the close of the merger |
$ | 335,693 | ||
| Cash payment to CVR Nitrogen common unitholders and certain phantom unit holders |
99,229 | |||
|
|
|
|||
| Fair value of consideration transferred |
434,922 | |||
| Fair value of noncontrolling interest for parent affiliate units |
4,564 | |||
|
|
|
|||
| Total purchase price consideration to be allocated |
$ | 439,486 | ||
|
|
|
As shown in the table below, the fair value of the portion of the consideration attributable to CVR Nitrogen common units included in these pro forma financial statements is based on the closing price for CVR Partners common units of $8.36 as of the close of business on March 31, 2016.
The following table summarizes the equity portion of the merger consideration:
| (in thousands; except per unit data) | ||||
| CVR Nitrogen common units outstanding, as of the close of the merger |
38,985 | |||
| Less: Non-controlling interest from parent affiliate units(1) |
400 | |||
|
|
|
|||
| Net units subject to merger consideration |
38,585 | |||
| Unit consideration per CVR Nitrogen common unit |
1.04 | |||
|
|
|
|||
| Number of CVR Partners common units to be issued for merger consideration |
40,129 | |||
| Number of CVR Partners common units to be issued for CVR Nitrogen phantom units issued to non-continuing employees and CVR Nitrogen board members(2) |
26 | |||
|
|
|
|||
| Total number of CVR Partners units to be issued |
40,155 | |||
| Fair value per CVR Partners common unit, as of the close of the merger |
$ | 8.36 | ||
|
|
|
|||
| Fair value of CVR Partners common units issued |
$ | 335,693 | ||
|
|
|
|||
43
| (1) | See “parent affiliate units” above for discussion of parent affiliate units. |
| (2) | Pursuant to the Merger Agreement, each phantom unit granted and outstanding and held by (i) an employee who did not continue in the employment of a CVR Partners-affiliated entity, or (ii) a director of CVR Nitrogen GP, upon closing of the mergers, vested in full and the holders thereof received the merger consideration. |
Merger Expenses
CVR Partners and CVR Nitrogen expect to incur merger-related transaction costs of approximately $20.1 million prior to, or concurrent with, the mergers, primarily related to legal, accounting and other transaction-related expenses for the mergers, of which approximately $1.9 million was incurred during the three months ended March 31, 2016 and $6.0 million was incurred during the year ended December 31, 2015. The estimated merger-related transaction costs included in these pro forma financial statements represent costs that meet the factually supportable criteria and may differ materially from actual amounts.
(3) Financing
The aggregate merger consideration reflected in the pro forma financial statements includes approximately $367.5 million of assumed debt at fair value as of March 31, 2016. The pro forma financial statements assume the payoff of the substantial majority of the CVR Partners’ and CVR Nitrogen’s outstanding debt and the issuance of $625.0 million Senior Notes. The assumed debt includes the 2021 Notes and the outstanding advances under the Wells Fargo Credit Agreement, both of which are defined and discussed further below.
The following table represents the calculation of the pro forma net incremental debt as presented in pro forma adjustment (a) in the pro forma condensed combined balance sheet. In addition to the amounts shown in the table below, the pro forma financial statements include $4.7 million cash payment for the Tender Offer (defined and discussed below) premium.
| As of March 31, 2016 |
||||
| (in thousands) | ||||
| Senior Secured Notes due 2023 |
$ | 625,000 | ||
| Repayment of amounts outstanding under CVR Nitrogen’s Wells Fargo Credit Agreement(1) |
(49,100 | ) | ||
| Repayment of CVR Partners’ historical debt(1) |
(125,000 | ) | ||
| Tendered amount of the 2021 Notes |
(315,245 | ) | ||
|
|
|
|||
| Pro Forma incremental principal amount of debt, excluding impact of debt issuance costs |
$ | 135,655 | ||
|
|
|
|||
| (1) | Outstanding amounts were paid on April 1, 2016. |
Senior Notes
The financing transactions reflected in these pro forma financial statements include the issuance of $625.0 million Senior Notes and the subsequent payoff of the substantial majority of CVR Partners’ and CVR Nitrogen’s debt obligations. The financing costs presented below represent costs that meet the factually supportable criteria and may differ materially from the actual amounts. The interest rate used in the unaudited pro forma condensed combined statement of operations is assumed to be 8.5%. The actual interest rate may vary materially from this assumed rate. A change of 1/8% in the interest rate on the borrowings related to the Senior Notes would result in a change in annual interest expense and net income of approximately $0.8 million.
The 2021 Notes
On April 12, 2013, CVR Nitrogen and CVR Nitrogen Finance Corporation (formerly known as Rentech Nitrogen Finance Corporation and also formerly known as East Dubuque Finance Corporation) (the “Finance Corporation” and together with CVR Nitrogen, the “Issuers”) issued $320.0 million of 6.5% second lien senior secured notes due 2021 (the”2021 Notes”). The 2021 Notes bear interest at a rate of 6.5% per year, payable semi-annually in arrears on April 15 and October 15 of each year. The 2021 Notes will mature on April 15, 2021, unless repurchased or redeemed earlier in accordance with their terms.
On April 29, 2016, CVR Nitrogen commenced a cash tender offer (the “Tender Offer”) to purchase any and all of the outstanding 2021 Notes. In connection with the Tender Offer, CVR Nitrogen is soliciting consents to certain proposed amendments (the “Consent Solicitation”) to the indenture governing the 2021 Notes (the “Indenture”). Holders that validly tender their 2021 Notes pursuant to the Tender Offer and deliver their consents pursuant to the Consent Solicitation (and who do not validly withdraw their tender and consents) on or before 5:00 p.m., New York City time on May 12, 2016 (the “Early Tender Date”) will receive $1,015 per $1,000 in principal amount of the 2021 Notes. Holders who validly tender their 2021 Notes and provide their consents after the Early Tender
44
Date but on or before 5:00 p.m., New York City time on June 8, 2016, unless extended or earlier terminated, will receive an amount equal to $985 per $1,000 in principal amount. Holders whose 2021 Notes are purchased under the Tender Offer will also receive accrued and unpaid interest up to the settlement date.
The primary purpose of the Consent Solicitation is to eliminate or modify substantially all of the restrictive covenants relating to CVR Nitrogen and its subsidiaries, eliminate all events of default other than failure to pay principal, premium or interest on the 2021 Notes, eliminate all conditions to satisfaction and discharge, and release the liens on the collateral securing the 2021 Notes. Holders may not tender their 2021 Notes in the Tender Offer without delivering their consents under the Consent Solicitation, and holders may not deliver their consents under the Consent Solicitation without tendering their 2021 Notes pursuant to the Tender Offer. The amendments to the Indenture contemplated by the Consent Solicitation will not become operative unless at least a majority of the aggregate principal amount of the 2021 Notes (excluding consents from CVR Nitrogen and its affiliates) validly participate in (and do not validly withdraw) the Consent Solicitation; provided 66 2/3% of the aggregate principal amount of the 2021 Notes (excluding consents from CVR Nitrogen and its affiliates) must validly participate in the Consent Solicitation to release the collateral securing the 2021 Notes.
Concurrently with, but separately from the Tender Offer, CVR Nitrogen also commenced an offer to purchase all of the outstanding 2021 Notes at a price equal to 101% of the principal amount thereof (the “Change of Control Offer”), as required as a result of the mergers. Holders who validly tender their 2021 Notes prior to 5:00 p.m., New York City time on June 28, 2016, will receive $1,010 for each $1,000 in principal amount. Holders whose 2021 Notes are purchased under the Change of Control Offer will also receive accrued and unpaid interest up to the settlement date.
On May 12, 2016, CVR Partners had received tenders and consents from holders of $315,245,000 in aggregate principal amount of the 2021 Notes, representing approximately 98.5% of the total outstanding principal amount of the 2021 Notes. CVR Partners received the requisite consents in respect of the 2021 Notes in connection with the Consent Solicitation to amend the Indenture. As a result, CVR Partners may execute a supplemental indenture relating to the 2021 Notes promptly after the withdrawal deadline setting forth the Proposed Amendments. The Proposed Amendments will become operative upon payment for the tendered 2021 Notes pursuant to the terms of the Tender Offer and Consent Solicitation.
The 2021 Notes that remain outstanding following the consummation of the Tender Offer and the Change of Control Offer will continue to be obligations of the Issuers. The 2021 Notes are fully and unconditionally guaranteed, jointly and severally, by each of the Issuers’ existing domestic subsidiaries, other than the Finance Corporation. In addition, the 2021 Notes and the guarantees thereof are collateralized by a second priority lien on substantially all of the Issuers’ and the guarantor’s assets, subject to permitted liens.
On April 1, 2016, in connection with the closing of the mergers, CVR Partners entered into a $320.0 million senior term loan facility (the “AEPC Facility”) with American Entertainment Properties Corp., an affiliate of CVR Partners (“AEPC”), as the lender, which (i) may be used by CVR Partners to provide funds to CVR Nitrogen to make a change of control offer and, if applicable, a “clean-up” redemption in accordance with the Indenture governing the 2021 Notes or (ii) may be used by CVR Partners or CVR Nitrogen to make a tender offer for the 2021 Notes and, in each case, pay fees and expenses related thereto. The AEPC Facility is for a term of two years and bears interest at a rate of 12% per annum. Calculation of interest shall be on the basis of the actual number of days elapsed over a 360-day year and payable quarterly. CVR Partners may voluntarily prepay in whole or in part the Loan without premium or penalty. Although the AEPC Facility borrowings are available to CVR Partners to fund the Tender Offer and the Change of Control Offer discussed above, the pro forma financial statements do not assume the use of such borrowings.
The pro forma financial statements assume the payoff of $315,245,000 in aggregate principal amount of the 2021 Notes at 101.5% of the associated principal amount, with the remaining $4,755,000 aggregate principal amount assumed to remain outstanding. The pro forma financial statements do not adjust to fair value the remaining $4,755,000 of aggregate principal of the 2021 Notes because a fair value adjustment is not material for purposes of these pro forma financial statements.
Wells Fargo Credit Agreement
On July 22, 2014, CVR Nitrogen entered into a new credit agreement by and among CVR Nitrogen and Finance Corporation as borrowers (the “Borrowers”), certain subsidiaries of CVR Nitrogen, as guarantors, General Electric Capital Corporation, for itself as agent for the lenders party thereto, the other financial institutions party thereto, and GE Capital Markets, Inc., as sole lead arranger and bookrunner. On March 1, 2016, Wells Fargo Bank, N.A. acquired our new credit agreement (the “Wells Fargo Credit Agreement”) from General Electric Capital Corporation.
The Wells Fargo Credit Agreement consisted of a $50.0 million senior secured revolving credit facility with a $10.0 million letter of credit sublimit. At March 31, 2016, a letter of credit had been issued, but not drawn upon, in the amount of $1.4 million. The Wells Fargo Credit Agreement was used to fund growth projects, working capital needs, letters of credit and for other general partnership purposes.
45
Borrowings under the Wells Fargo Credit Agreement bear interest at a rate equal to an applicable margin plus, at the Borrowers’ option, either (a) in the case of base rate borrowings, a rate equal to the highest of (1) the prime rate, (2) the federal funds rate plus 0.5% or (3) LIBOR for an interest period of one month plus 1.00% or (b) in the case of LIBOR borrowings, the offered rate per annum for deposits of dollars for the applicable interest period on the day that is two business days prior to the first day of such interest period. The applicable margin for borrowings under the Wells Fargo Credit Agreement is 2.25% with respect to base rate borrowings and 3.25% with respect to LIBOR borrowings.
In connection with the closing of the mergers, CVR Partners paid off the outstanding balance of the Wells Fargo Credit Agreement, including accrued interest and fees, and the Wells Fargo Credit Agreement was terminated.
CVR Partners’ Credit Facility
On April 13, 2011, Coffeyville Resources Nitrogen Fertilizers, LLC, a wholly-owned subsidiary of CVR Partners, as borrower, and CVR Partners, as guarantor, entered into a new credit facility with a group of lenders including Goldman Sachs Lending Partners LLC, as administrative and collateral agent (the “Credit Agreement”). The Credit Agreement includes a term loan facility of $125.0 million and a revolving credit facility of $25.0 million with an uncommitted incremental facility of up to $50.0 million. As of March 31, 2016, CVR Partners had $125.0 million outstanding borrowings under the Credit Agreement. On April 1, 2016, in connection with the completion of the mergers, CVR Partners repaid all amounts outstanding the Credit Agreement. Effective upon such repayment, the Credit Agreement and all related loan documents and security interests were terminated and released. The repayment was funded from amounts drawn on the CRLLC Facility, as discussed below.
The CRLLC Facility
On April 1, 2016, in connection with the closing of the mergers, CVR Partners entered into a $300.0 million senior term loan facility (the “CRLLC Facility”) with CRLLC, which was used by CVR Partners (i) to fund the repayment of amounts outstanding under the Wells Fargo Credit Agreement, (ii) to pay the cash merger consideration and to pay fees and expenses in connection with the mergers and related transactions and (iii) to repay all of the loans outstanding under the Credit Agreement.
The CRLLC Facility has a term of two years and bears an interest rate of 12.0% per annum. Calculation of interest is on the basis of the actual number of days elapsed over a 360-day year and payable quarterly. CVR Partners may voluntarily prepay in whole or in part the amounts outstanding under the CRLLC Facility without premium or penalty. The pro forma financial statements do not include the CRLLC Facility because the transaction occurred after the March 31, 2016 balance sheet date and because it is assumed the proceeds of the new Senior Notes are used to pay off the outstanding balance.
Deferred Financing Costs
The financing costs of $6.6 million presented in these pro forma financial statements represent costs that meet the factually supportable criteria and may differ materially from actual amounts. Approximately $0.2 million of financing costs were incurred during the three months ended March 31, 2016.
(4) Pro Forma Adjustments to the Unaudited Pro Forma Condensed Combined Balance Sheets
This note should be read in conjunction with Note 1. Basis of Presentation; Note 2. The Mergers; and Note 3. Financing. The Pasadena Facility was sold on March 14, 2016, as such, the CVR Nitrogen consolidated balance sheet as of March 31, 2016 excludes the Pasadena Facility.
Adjustments under the column heading “Adjustments for the Transaction” represent the following:
| (a) | Reflects the net impact of the estimated incremental $135.7 million principal amount of debt, exclusive of debt issuance costs. The pro forma adjustment is net of $4.7 million, which represents the Tender Offer premium. See further discussion in Note 3, Financing. |
| (b) | Reflects the incurrence of $6.4 million pro forma deferred financing fees associated with the new Senior Notes. $0.2 million of deferred financing fees associated with the new Senior Notes were included in prepaid expenses and other current assets in the historical CVR Partners’ condensed combined balance sheet, which are reclassified to a reduction of the carrying value of debt in the pro forma condensed combined balance sheet. The historical deferred financing fees are also eliminated, because it is assumed that the substantial majority of historical debt is paid off in these pro forma financial statements. As of March 31, 2016, the historical CVR Nitrogen deferred financing costs included $6.6 million in deferred financing fees, presented as a reduction to the carrying value of debt. CVR Partners’ historical deferred financing fees related to its historical credit facility were nominal as of March 31, 2016. |
46
| (c) | Reflects $99.2 million for cash portion of the merger consideration. The cash merger consideration includes the payment to the holders of CVR Nitrogen common units, who will receive $2.57 in cash, without interest, for each CVR Nitrogen common unit held, exclusive of the parent affiliate units, as consideration for the mergers. Cash merger consideration also includes $0.1 million for the cash portion of the merger consideration paid for the phantom units granted under the CVR Nitrogen equity plans and held by a non-continuing employee or any member of the board of directors of CVR Nitrogen GP, as required under the terms of the Merger Agreement. |
| (d) | Reflects an approximate $12.2 million decrease to cash and common unitholders’ interest to reflect the estimated transaction costs to be incurred in association with the mergers. Of this amount, $11.8 million is assumed to be included in the purchase price allocation as an assumed liability and $0.4 million of this amount is reflected as a decrease to equity. These estimated transaction costs to be incurred are not included in the unaudited pro forma condensed combined statement of operations as they are nonrecurring expenses. |
| (e) | CVR Nitrogen’s inventory will be purchased by CVR Partners at fair value. Inventories have historically been carried at the lower of first-in, first-out (“FIFO”) cost, or net realizable value. The estimated increase in finished goods inventory value of approximately $18.4 million as of March 31, 2016, is reflected to adjust estimated pro forma inventories to fair value, which reflects the estimated selling price to a market participant at the closing date of the mergers. All other inventory items’ cost basis is estimated to equal fair value. These estimated fair values are preliminary and subject to further adjustments based on the final fair value determination to be completed subsequent to the mergers’ closing date. |
| (f) | Reflects the reclassification of CVR Nitrogen’s catalysts, including precious metals used as catalysts, to conform the presentation in CVR Nitrogen’s condensed consolidated financial statements to the presentation in CVR Partners’ condensed consolidated financial statements. |
| (g) | Reflects the reclassification of CVR Nitrogen’s spare parts to conform the presentation in CVR Nitrogen’s condensed consolidated financial statements to the presentation in CVR Partners’ condensed consolidated financial statements. |
| (h) | Reflects the elimination of accounts receivable recorded at CVR Nitrogen as of March 31, 2016, which relates to the working capital adjustment on the sale of Pasadena. The Pasadena purchase agreement includes a cash working capital adjustment, which is estimated to be an approximate $4.6 million cash payment to CVR Nitrogen, after confirmation of the amount within ninety days of the closing of the transaction. The final working capital adjustment could differ from this estimate. The distribution of the cash working capital adjustment and any other additional cash payments if and to the extent made by the buyer relating to the purchase of the Pasadena Facility, and subject to reduction for certain expenses, will be made to CVR Nitrogen’s unitholders of record at the close of business on March 28, 2016 within a reasonable time shortly after receiving such cash payments. |
| (i) | Reflects an increase in property, plant and equipment to reflect the estimated step up to fair value of CVR Nitrogen’s owned properties, plant and equipment, including land. This estimated fair value is preliminary and is subject to further adjustments based on the final fair value determination to be completed. |
| (j) | Reflects reclassification of CVR Nitrogen’s presentation of accounts payable to conform the presentation in CVR Nitrogen’s condensed consolidated financial statements to the presentation in CVR Partners’ condensed consolidated financial statements. |
| (k) | Reflects reclassification of CVR Nitrogen’s presentation of accrued expenses and other current liabilities to conform the presentation in CVR Nitrogen’s condensed consolidated financial statements to the presentation in CVR Partners’ condensed consolidated financial statements. |
| (l) | Reflects the estimated liability as a result of replacement phantom unit awards for CVR Nitrogen employees who continued in the employment of a CVR Partners-affiliated entity. As required under the terms of the Merger Agreement, phantom units granted and outstanding under CVR Nitrogen’s equity plans and held by an employee who continued in the employment of a CVR Partners-affiliated entity upon closing of the mergers were canceled and replaced with new incentive awards of substantially equivalent value and on substantially the same terms and conditions. |
| (m) | Reflects an increase in CVR Nitrogen deferred revenue to reflect the estimated step up to fair value. This estimated fair value is preliminary and is subject to further adjustments based on the final fair value determination to be completed. |
| (n) | Reflects the elimination of the CVR Nitrogen common unitholders’ interest and the issuance of CVR Partners common units to holders of CVR Nitrogen common units. CVR Nitrogen common unitholders received 1.04 CVR Partners common units for each CVR Nitrogen common unit held as part of the consideration for the mergers. Also includes the unit consideration for the phantom units granted under the CVR Nitrogen equity plans and held by a non-continuing employee or any member of the board of directors of CVR Nitrogen GP, as required under the terms of the Merger Agreement. |
47
| (o) | Reflects CVR Partners affiliate’s non-controlling interest in CVR Nitrogen common units, reflected at fair value based on CVR Nitrogen’s closing share price on March 31, 2016 of $11.41 per CVR Nitrogen common unit. In March 2016, CVR Energy purchased 400.0 thousand CVR Nitrogen common units, representing approximately 1% of the outstanding CVR Nitrogen units. As discussed in Note 2, these units were not subject to the merger consideration. |
(5) Pro Forma Adjustments to the Unaudited Condensed Combined Statement of Operations
This note should be read in conjunction with Note 1, Basis of Presentation; Note 2, The Mergers; and Note 3, Financing.
It was a condition to the completion of the mergers that CVR Nitrogen sell or spin off the Pasadena Facility. On March 14, 2016, CVR Nitrogen completed the sale of 100% of the issued and outstanding membership interest of the Pasadena segment to a third party. For purposes of the pro forma financial statements, it has been assumed that the Pasadena Facility has been separated from CVR Nitrogen for the unaudited pro forma condensed combined statement of operations for the three months ended March 31, 2016 and the year ended December 31, 2015.
Adjustments under the column heading “Pro Forma Adjustments for the Transaction” represent the following:
| (a) | Reflects the reclassification of cost of sales to conform CVR Nitrogen’s condensed consolidated financial statement presentation to CVR Partners’ condensed consolidated financial statement presentation. |
CVR Partners records cost of product sold, direct operating expenses and selling, general and administrative expenses, exclusive of depreciation and amortization. The pro forma adjustment conforms the classification in alignment with CVR Partners’ basis of presentation. CVR Nitrogen recorded depreciation and amortization of approximately $4.0 million and $18.0 million, respectively, in cost of sales for the three months ended March 31, 2016 and the year ended December 31, 2015, excluding depreciation and amortization of the Pasadena Facility. Of these amounts, approximately $0.4 million and $0.7 million, respectively, for the three months ended March 31, 2016 and the year ended December 31, 2015, were reclassified to direct operating expenses to conform with CVR Partners’ catalysts presentation as discussed in Balance Sheet pro forma adjustment (f). The historical cost basis of CVR Nitrogen’s catalysts is estimated to equal fair value.
CVR Nitrogen recorded expenses, other than depreciation and amortization and selling, general and administrative expenses discussed above, of approximately $16.3 million and $87.2 million, respectively, in cost of sales for the three months ended March 31, 2016 and the year ended December 31, 2015, excluding expenses of the Pasadena Facility. Of these amounts, for the three months ended March 31, 2016 and the year ended December 31, 2015, approximately $13.6 million and $52.1 million, respectively, were reclassified to direct operating expenses, $2.8 million and $30.1 million, respectively, were reclassified to cost of product sold and approximately $0 and $5.0 million, respectively, were reclassified to selling, general and administrative expenses to conform with CVR Partners’ presentation.
| (b) | Reflects the reclassification of other expense to conform CVR Nitrogen’s condensed consolidated financial statement presentation to CVR Partners’ condensed consolidated financial statement presentation. |
| (c) | Depreciation and amortization has been increased to reflect the estimated additional depreciation expense related to the increase in property, plant, and equipment based on the preliminary estimated fair value of the acquired assets. The estimated incremental depreciation expense for the three months ended March 31, 2016 and year ended December 31, 2015 is approximately $8.4 million and $32.7 million, respectively, based upon a range of estimated useful lives of 3 to 30 years. The following table is an estimated incremental increase to depreciation and amortization for CVR Nitrogen, excluding the Pasadena Facility: |
| Three Months Ended March 31, 2016 |
Year Ended December 31, 2015 |
|||||||
| Pro forma depreciation and amortization |
$ | 12,037 | $ | 50,033 | ||||
| Elimination of depreciation and amortization |
(3,643 | ) | (17,286 | ) | ||||
|
|
|
|
|
|||||
| Estimated incremental increase to depreciation and amortization |
$ | 8,394 | $ | 32,747 | ||||
|
|
|
|
|
|||||
| (d) | Reflects the elimination of transaction costs reflected in the historical financial statements. |
| (e) | Reflects the estimated net increase in interest expense of $6.2 million and $25.7 million, respectively, for the three months ended March 31, 2016 and the year ended December 31, 2015. The net increase in pro forma interest expense results from the assumed issuance of $625.0 million Senior Notes at an estimated 8.5% interest rate and the amortization of deferred financing costs, net of the elimination of historical interest expense. Interest expense related to the $4,755,000 Senior 2021 Notes assumed to remain outstanding as discussed in Note 3, Financing, is considered not material for purposes of these pro forma financial statements. |
48
| Three Months Ended March 31, 2016 |
Year Ended December 31, 2015 |
|||||||
| Pro forma interest expense of new Senior Notes |
$ | 13,134 | $ | 53,272 | ||||
| Pro forma amortization of deferred financing costs of new Senior Notes |
236 | 943 | ||||||
| Elimination of historical interest expense and deferred financing costs |
(7,201 | ) | (28,541 | ) | ||||
|
|
|
|
|
|||||
| Estimated increase to interest expense |
$ | 6,169 | $ | 25,674 | ||||
|
|
|
|
|
|||||
49