Attached files
| file | filename |
|---|---|
| 8-K - 8-K - MAM SOFTWARE GROUP, INC. | v440866_8k.htm |
Exhibit 99.1

Driving Business Performance Driving Business Performance Introduction to MAM Software Group, Inc. Michael G. Jamieson President & Chief Executive Officer Brian H. Callahan Executive Vice President & Chief Financial Officer May 2016
Driving Business Performance Safe harbor statement Statements and/or figures included in this presentation that are not historical facts (including any statements or projection s c oncerning plans and objectives of management for future operations or economic performance, or assumptions or forecasts related thereto ), are forward - looking statements. These statements can be identified by the use of forward - looking terminology including “forecast,” “ may,” “believe,” “will,” “expect,” “anticipate,” “estimate,” “continue” or other similar words. These statements discuss future exp ect ations, contain projections of results of operations or of financial condition or state other “forward - looking” information. We and our representatives may from time to time make other oral or written statements that are also forward - looking statements. These forward - looking statements are made based upon management’s current plans, and best expectations, estimates, assumptions and beliefs concerning future events that may impact the company’s future prospects and therefore involve a number of risks a nd uncertainties. MAM Software Group, Inc. cautions that forward - looking statements are not guarantees and that actual results coul d differ materially from those expressed or implied in the forward - looking statements. Because these forward - looking statements involve risks and uncertainties, actual results could differ materially from those expr essed or implied by these forward - looking statements for a number of important reasons. MAM Software Group, Inc. expressly disclaims any intention or obligation to revise or update any forward - looking statements whether as a result of new information, future events , or otherwise. 2

Driving Business Performance Who are we? MAM Software is a provider of cloud based and on - premise business solutions and services for the automotive aftermarket and other vertical markets Investment highlights ● Founded in 1984 ● NASDAQ CM: MAMS ● TTM Total Revenue $31.7m (Mar 31, 2016) ● TTM Recurring Revenue 79% (Mar 31, 2016) ● US & UK operations (222 full time and 9 part time) ● Approx. 4,700 customers $31.7m TTM TOTAL REVENUE 79% TTM RECURRING REVENUE 3
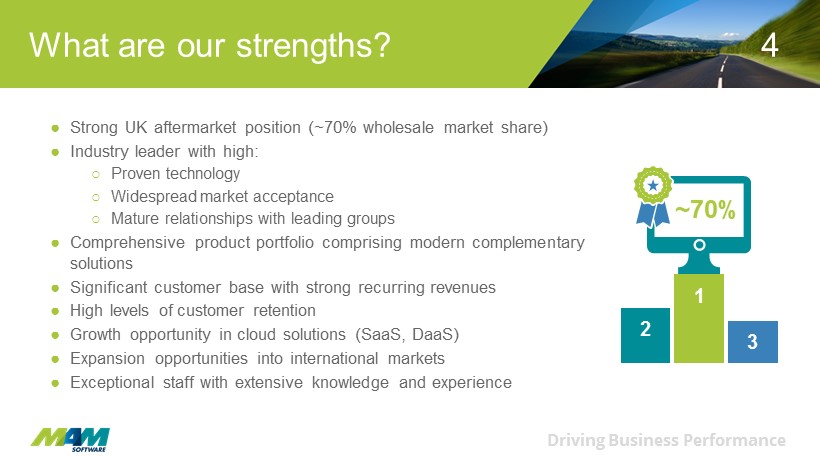
Driving Business Performance ● Strong UK aftermarket position (~70% wholesale market share) ● Industry leader with high: ○ Proven technology ○ Widespread market acceptance ○ Mature relationships with leading groups ● Comprehensive product portfolio comprising modern complementary solutions ● Significant customer base with strong recurring revenues ● High levels of customer retention ● Growth opportunity in cloud solutions (SaaS, DaaS) ● Expansion opportunities into international markets ● Exceptional staff with extensive knowledge and experience What are our strengths? 2 1 3 ~70% 4
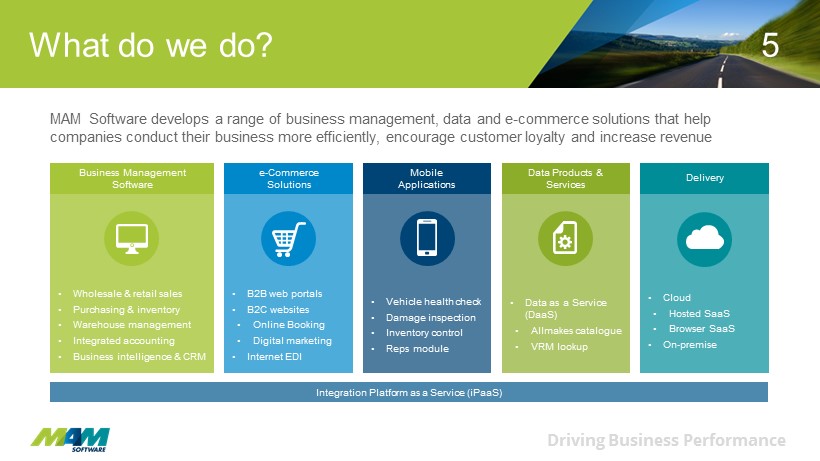
Driving Business Performance What do we do? Integration Platform as a Service (iPaaS) MAM Software develops a range of business management, data and e - commerce solutions that help companies conduct their business more efficiently, encourage customer loyalty and increase revenue Business Management Software e - Commerce Solutions Mobile Applications Data Products & Services Delivery ▪ Wholesale & retail sales ▪ Purchasing & inventory ▪ Warehouse management ▪ Integrated accounting ▪ Business intelligence & CRM ▪ B2B web portals ▪ B2C websites ▪ Online Booking ▪ Digital marketing ▪ Internet EDI ▪ Vehicle health check ▪ Damage inspection ▪ Inventory control ▪ Reps module ▪ Data as a Service (DaaS) ▪ Allmakes catalogue ▪ VRM lookup ▪ Cloud ▪ Hosted SaaS ▪ Browser SaaS ▪ On - premise 5
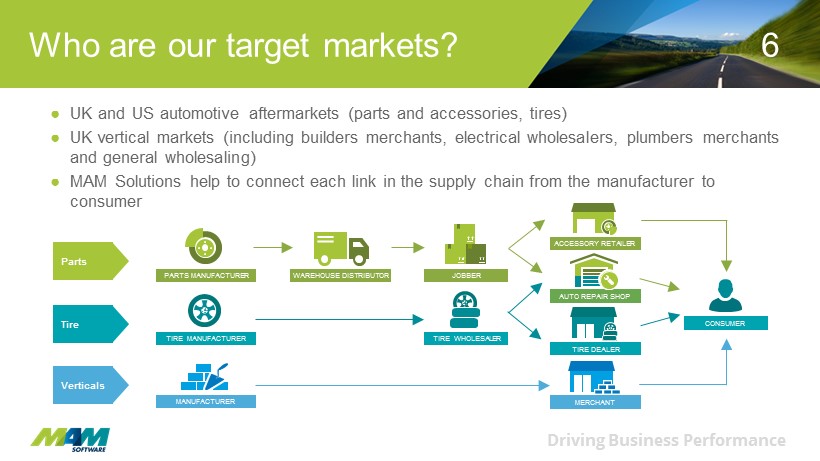
Driving Business Performance Who are our target markets? ● UK and US automotive aftermarkets (parts and accessories, tires) ● UK vertical markets (including builders merchants, electrical wholesalers, plumbers merchants and general wholesaling) ● MAM Solutions help to connect each link in the supply chain from the manufacturer to consumer PARTS MANUFACTURER WAREHOUSE DISTRIBUTOR TIRE MANUFACTURER MANUFACTURER TIRE WHOLESALER JOBBER ACCESSORY RETAILER AUTO REPAIR SHOP TIRE DEALER MERCHANT CONSUMER Tire Parts Verticals 6

Driving Business Performance Who are our customers? UK Parts US Parts US Auto Repair & Tire UK Verticals 7
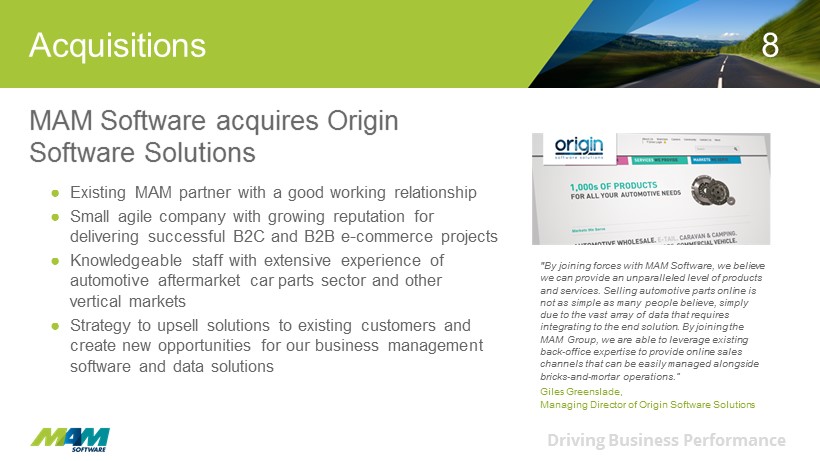
Driving Business Performance Acquisitions ● Existing MAM partner with a good working relationship ● Small agile company with growing reputation for delivering successful B2C and B2B e - commerce projects ● Knowledgeable staff with extensive experience of automotive aftermarket car parts sector and other vertical markets ● Strategy to upsell solutions to existing customers and create new opportunities for our business management software and data solutions MAM Software acquires Origin Software Solutions "By joining forces with MAM Software, we believe we can provide an unparalleled level of products and services. Selling automotive parts online is not as simple as many people believe, simply due to the vast array of data that requires integrating to the end solution. By joining the MAM Group, we are able to leverage existing back - office expertise to provide online sales channels that can be easily managed alongside bricks - and - mortar operations.” Giles Greenslade, Managing Director of Origin Software Solutions 8
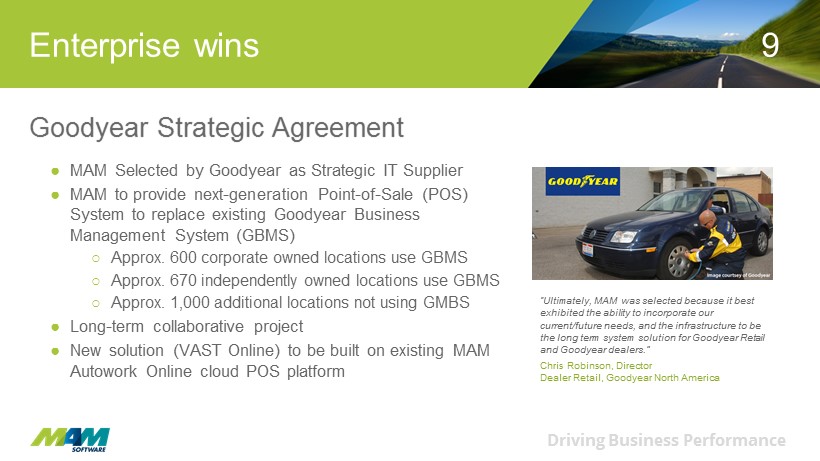
Driving Business Performance Enterprise wins “Ultimately, MAM was selected because it best exhibited the ability to incorporate our current/future needs, and the infrastructure to be the long term system solution for Goodyear Retail and Goodyear dealers.” Chris Robinson, Director Dealer Retail, Goodyear North America Goodyear Strategic Agreement ● MAM Selected by Goodyear as Strategic IT Supplier ● MAM to provide next - generation Point - of - Sale (POS) System to replace existing Goodyear Business Management System (GBMS) ○ Approx. 600 corporate owned locations use GBMS ○ Approx. 670 independently owned locations use GBMS ○ Approx. 1,000 additional locations not using GMBS ● Long - term collaborative project ● New solution (VAST Online) to be built on existing MAM Autowork Online cloud POS platform 9

Driving Business Performance Enterprise wins ALLDATA Strategic Agreement "Our partnership with MAM Software in designing Manage Online is the perfect example of our dedication to quality. MAM helped create a powerful cloud - based shop management system that helps our customers run their shops with fewer headaches and more successes.” Mitch Major, President ALLDATA ● Successful launch of white - label MAM cloud shop management system (SMS) ● ALLDATA is a leading provider of manufacturers’ automotive repair information and solutions, owned by AutoZone (NYSE: AZO) ● Current customer base of approx. 80,000 automotive repair and collision shop subscribers ● ALLDATA to supply AAMCO - a national network of 700 independent service centers - a customized shop management system, developed by MAM 10

Driving Business Performance Growth opportunities Sector Customers Addressable Total Market (Businesses) Avg. Annual SaaS Revenue per Business Avg. Annual DaaS Revenue per Business Potential Annual XaaS Market Value Auto Parts Stores – wholesale and retail 1,369 2,004 ** $10,000 $4,500 $29m Wholesale & Retail Tire Dealers 26 1,920 ** $6,000 $1,700 $15m Auto Repair Shops 2,766* 25,000 ** $1,186 n/a $30m Verticals (merchants) 71 2,348 ** $11,000 n/a $26m Sector Customers Addressable Total Market (Businesses)* Avg. Annual SaaS Revenue per Business* Avg. Annual DaaS Revenue per Business* Potential Annual XaaS Market Value* Auto Parts Businesses – Wholesale and Retail 1,373 2,000 $10,000 $5,200 $30m Wholesale & Retail Tire Dealers 22 2,500 $6,000 $1,600 $19m Auto Repair Shops 1 2,684 25,000 $1,322 n/a $33m Verticals (Merchants) 84 2,500 $12,000 n/a $30m *Source = MAM estimates ● United Kingdom ○ Continued growth in automotive sector – SaaS & DaaS solutions ○ New products and services – mobile and e - commerce ○ Growth in the tire sector ○ Vertical markets ○ Acquisitions 11
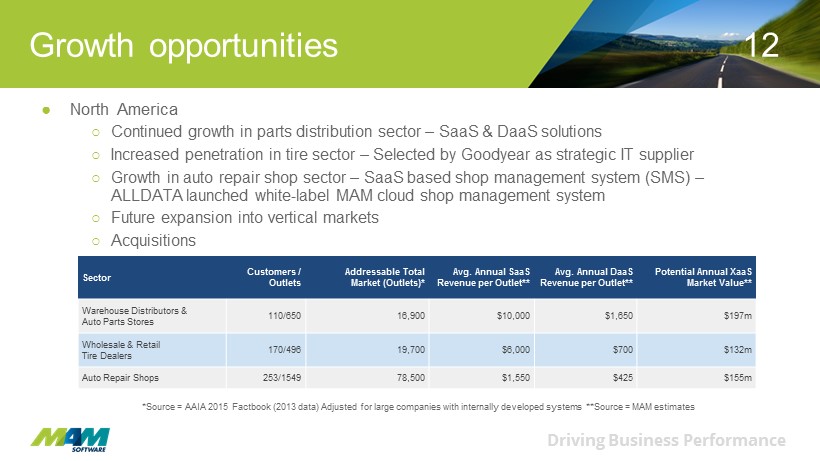
Driving Business Performance Growth opportunities Sector Customers / Outlets Addressable Total Market (Outlets)* Avg. Annual SaaS Revenue per Outlet** Avg. Annual DaaS Revenue per Outlet** Potential Annual XaaS Market Value** Warehouse Distributors & Auto Parts Stores 110/650 16,900 $10,000 $1,650 $197m Wholesale & Retail Tire Dealers 170/496 19,700 $6,000 $700 $132m Auto Repair Shops 253/1549 78,500 $1,550 $425 $155m *Source = AAIA 2015 Factbook (2013 data) Adjusted for large companies with internally developed systems **Source = MAM estim ate s ● North America ○ Continued growth in parts distribution sector – SaaS & DaaS solutions ○ Increased penetration in tire sector – Selected by Goodyear as strategic IT supplier ○ Growth in auto repair shop sector – SaaS based shop management system (SMS) – ALLDATA launched white - label MAM cloud shop management system ○ Future expansion into vertical markets ○ Acquisitions 12

Driving Business Performance SaaS progress KPIs +7.9% Software as a Service progress - Key Performance Indicators (March 31, 2016) <2% +39% 5 MONTHS YEAR ON YEAR QUARTERLY INCREASE IN USER COUNTS YEAR ON YEAR QUARTERLY INCREASE IN SaaS REVENUE CUSTOMER ACQUISITION COSTS (CAC) RECOVERY PERIOD QUARTERLY CHURN RATE FOR Q3 2016 (CUSTOMER RELATIONSHIPS THAT MAM OWNS) 13
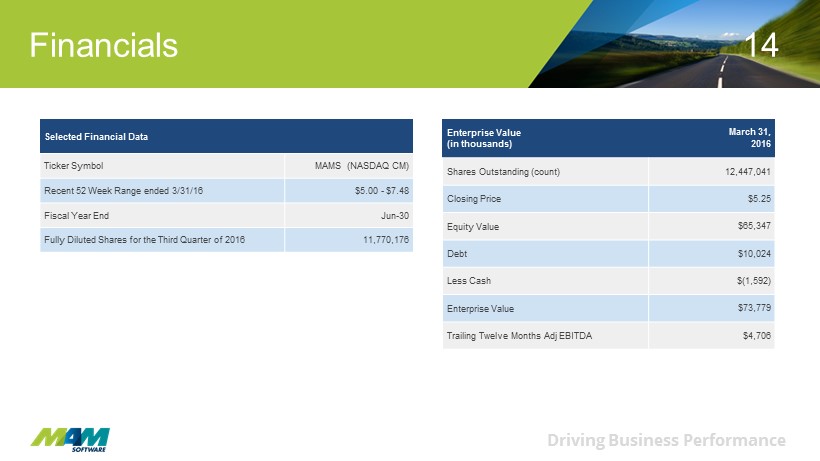
Driving Business Performance Financials Selected Financial Data Ticker Symbol MAMS (NASDAQ CM) Recent 52 Week Range ended 3/31/16 $5.00 - $7.48 Fiscal Year End Jun - 30 Fully Diluted Shares for the Third Quarter of 2016 11,770,176 Enterprise Value (in thousands) March 31, 2016 Shares Outstanding (count) 12,447,041 Closing Price $5.25 Equity Value $65,347 Debt $10,024 Less Cash $(1,592) Enterprise Value $73,779 Trailing Twelve Months Adj EBITDA $4,706 14

Driving Business Performance $35,000 $30,000 $25,000 $20,000 $15,000 $10,000 $5,000 $ 2012 2013 2014 2015 Q3 2016 TTM $26,100 $27,466 $30,690 $31,638 Value (thousands) Financials MAM Software Group Revenue (in thousands) 25% $7,989 75% $23,649 27% $8,310 73% $22,380 30% $8,276 70% $19,190 69% $17,900 31% $8,200 $31,713 21% $6,779 79% $24,934 Non - Recurring Revenue 15 Recurring Revenues

Driving Business Performance Financials MAM Software Group Revenue (TTM Q3 2016) (in thousands) Recurring Cloud Revenue $16,178 51% Hardware Revenue $1,088 3% Professional Services Revenue $2,147 7% DaaS $9,741 31% SaaS $6,437 20% Software/System Revenue $3,544 11% Recurring Software Support Revenue $8,756 28% One Time Revenue $6,779 21% 16

Driving Business Performance Financials Statement of Operations (in thousands) For the Three Months Ended March 31, For the Nine Months Ended March 31, 2016 2015 2016 2015 Revenue $7,916 $7,659 $23,812 $23,737 Cost of Revenues $3,537 $3,342 $10,755 $9,856 Gross Margin $4,379 $4,317 $13,057 $13,881 Operating Expenses $3,524 $3,351 $10,420 $10,975 Operating Income $855 $966 $2,637 $2,906 Other Income (Expense) $(104) ($4) $59 ($9) Income before Income Taxes $751 $962 $2,696 $2,897 Provision for Income Taxes ($155) ($241) ($532) ($642) Net income $596 $721 $2,164 $2,255 Earnings per share - Basic $0.05 $0.05 $0.17 $0.17 Earnings per share – Diluted $0.05 $0.05 $0.17 $0.17 17
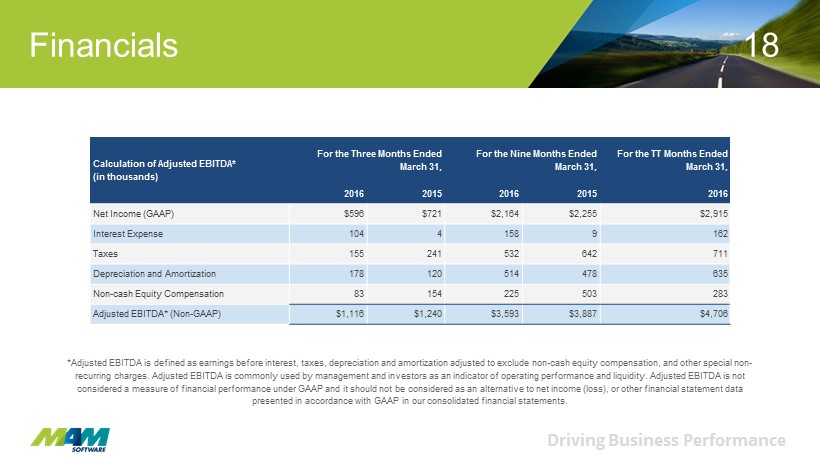
Driving Business Performance Financials *Adjusted EBITDA is defined as earnings before interest, taxes, depreciation and amortization adjusted to exclude non - cash equit y compensation, and other special non - recurring charges. Adjusted EBITDA is commonly used by management and investors as an indicator of operating performance and liq uidity. Adjusted EBITDA is not considered a measure of financial performance under GAAP and it should not be considered as an alternative to net income (los s), or other financial statement data presented in accordance with GAAP in our consolidated financial statements. Calculation of Adjusted EBITDA* (in thousands) For the Three Months Ended March 31, For the Nine Months Ended March 31, For the TT Months Ended March 31, 2016 2015 2016 2015 2016 Net Income (GAAP) $596 $721 $2,164 $2,255 $2,915 Interest Expense 104 4 158 9 162 Taxes 155 241 532 642 711 Depreciation and Amortization 178 120 514 478 635 Non - cash Equity Compensation 83 154 225 503 283 Adjusted EBITDA* (Non - GAAP) $1,116 $1,240 $3,593 $3,887 $4,706 18

Driving Business Performance Financials Condensed Balance Sheet (in thousands) As of March 31, June 30, June 30, June 30, 2016 2015 2014 2013 Assets Cash and Cash Equivalents $1,592 $6,793 $7,008 $4,061 Accounts Receivable 3,976 4,243 3,857 3,511 All Other Current Assets 1,417 1,907 1,716 2,175 Total Current Assets 6,985 12,943 12,581 9,747 Long - Term Assets 15,060 12,978 12,164 11,594 Total Assets $22,045 $25,921 $24,745 $21,341 Liabilities and Stockholders' Equity Total Current Liabilities $8,651 $7,274 $6,982 $6,245 Total Long - Term Liabilities 8,868 250 488 474 Total Liabilities 17,519 7,524 7,470 6,719 Total Stockholders' Equity 4,526 18,397 17,275 14,622 Total Liabilities and Stockholders' Equity $22,045 $25,921 $24,745 $21,341 19

Driving Business Performance Financial model *Assuming revenue splits of approximately 88% recurring and 12% non - recurring and based on current visibility. Other internal assumptions also included in forward numbers 2014 (ACTUAL) 2015 (ACTUAL) Future* ($50M in Revenue) Sales Level ($ millions) $30.7 $31.6 $50 Gross Margin (% of sales) 56.0% 57.2% 62% R&D (% of sales) 12.0% 12.2% 9.5% SG&A ($ millions) $10.0 $9.8 $10.7 Adj. EBITDA Margin (% of sales) 13.8% 15.8% 30% - 33% Net Margin (% of sales) 5.4% 9.5% 20% - 23% 20
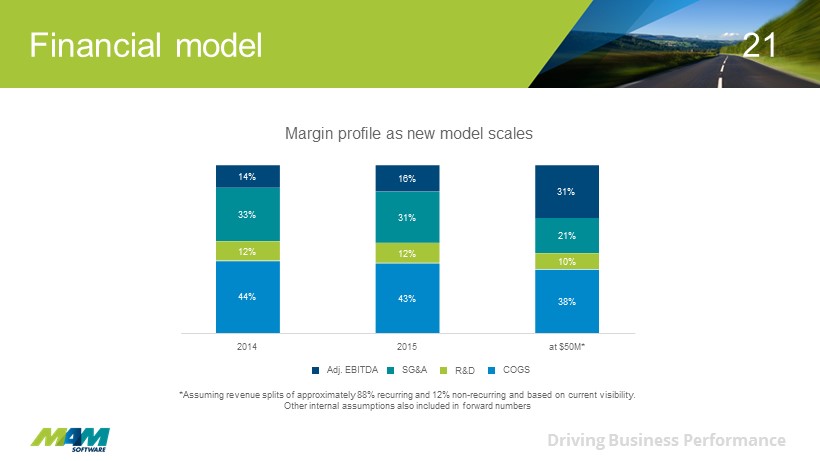
Driving Business Performance Financial model Margin profile as new model scales 2014 2015 at $50M* *Assuming revenue splits of approximately 88% recurring and 12% non - recurring and based on current visibility. Other internal assumptions also included in forward numbers 14% 33% 12% 44% 16% 31% 12% 43% 38% 10% 21% 31% Adj. EBITDA SG&A R&D COGS 21

Driving Business Performance ● Oversubscribed tender offer completed on December 1, 2015 ● Repurchased 2,000,000 shares at $7.50 per share for a total cost of $15m ● Financed with $4.5m of cash on hand plus $10.5m of debt ● Outstanding shares have been reduced by 2m to 12.4m as a result ● In December 2015 in connection with the tender offer, we entered into a $12m credit facility with JPMorgan Chase ● The facility includes a $9.5m term loan and a $2.5m revolver. Tender offer Purchase of 2,000,000 Shares of Common Stock 22
Driving Business Performance Investment Highlights ● Highly recurring revenue stream ● Exceptional customer retention rate ● Dominant UK Market Position ● Emerging vendor in an under - penetrated North American market evidenced by wins with ALLDATA/AutoZone (NYSE:AZO) and Goodyear Tire (NASDAQ:GT) ● Opportunity to achieve targeted Net Margins of 20% - 30% at scale 23
Driving Business Performance Questions mam software www.mamsoft.co.uk @mamsoft Thank you. Any Questions? Michael G. Jamieson President & Chief Executive Officer Email: mikej@mamsoft.co.uk Tel: +44 (0) 1226 352900 Brian Callahan Executive Vice President & Chief Financial Officer Email: bcallahan@mamsoftware.com Tel: (484) 860 3358 24