Attached files
| file | filename |
|---|---|
| 8-K - Entegra Financial Corp. | e00326_enfc-8k.htm |
Shareholder Meeting May 19, 2016

Information in this presentation may contain “forward - looking statements” . Such statements involve known and unknown risks, uncertainties and other factors that may cause actual results to differ materially . Forward - looking statements are often characterized by the use of qualifying words such as “expects,” “anticipates,” “believes,” “estimates,” “plans,” “projects,” or other statements concerning opinions or judgments of the Company and its management about future events . The accuracy of such forward looking statements could be affected by factors including, but not limited to, the financial success or changing conditions or strategies of the Company’s customers or vendors, fluctuations in interest rates, actions of government regulators, the availability of capital and personnel or general economic conditions . Additional factors that could cause actual results to differ materially from those anticipated by forward looking statements are discussed in the Company’s filings with the Securities and Exchange Commission, including without limitation its Registration Statement on Form S - 1 , annual report on Form 10 - K, quarterly reports on Form 10 - Q and current reports on Form 8 - K . Entegra Financial Corp . undertakes no obligation to revise or update these statements following the date of this presentation . Forward Looking Statements

• All data throughout the presentation is in thousands, except per share data • Any reference to Q1 and Q1 pro - forma data refers to March 31, 2016 and is unaudited Financial Data

Strategic Update
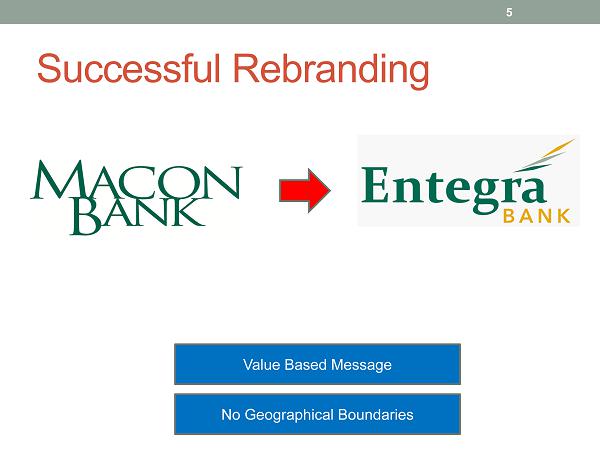
Successful Rebranding 5 No Geographical Boundaries Value Based Message

Expanding Geographic Footprint

Track Record of Successful Acquisitions Date Branches Assets Nov, 2015 2 $39.9M April, 2016 1 $109.9M

ASB Acquisition – Positive Results to Date Deposit Growth - $2.9M (7.2%) Q1 2016 Income - $115k

Strategic Plan Execution Long - term Independence Strong ROE Strategic Acquisitions Expansion to High Growth, Contiguous Markets Proper Capital Usage

No. 2 Deposit Share in Legacy Markets 309 117 87 76 63 58 89 907 1,742 325 304 419 405 581 - 200 400 600 800 1,000 1,200 1,400 1,600 1,800 2,000 Macon Henderson Jackson Polk Transylvania Cherokee Haywood Entegra Competitors 1 4 3 2 4 3 4 Total - $5.5B Deposit Market

Significant Opportunity in Upstate SC 10,225 4,490 3,529 1,709 1,116 838 494 467 280 241 - 2,000 4,000 6,000 8,000 10,000 12,000 Greenville Spartanburg Anderson Pickens Oconee Greenwood Laurens Cherokee Union Abbeville Total: $23.4B Deposit Market

Financial Overview

Well Capitalized & Room to Grow Entegra Bank Pro Forma Capital Levels @ March 31, 2016 11.56% 17.74% 17.74% 18.88% 5.00% 6.50% 8.00% 10.00% 0.00% 2.00% 4.00% 6.00% 8.00% 10.00% 12.00% 14.00% 16.00% 18.00% 20.00% Leverage CET I Tier 1 RBC Total RBC Actual Well Capitalized

Consistent Asset Growth 1,114,528 1,078,537 1,021,777 874,706 769,939 784,893 903,648 1,031,416 1,152,275 - 200,000 400,000 600,000 800,000 1,000,000 1,200,000 1,400,000 2008 2009 2010 2011 2012 2013 2014 2015 Pro - Forma Q1

Steady Loan Growth 815,959 770,448 715,313 615,540 560,717 521,874 540,479 624,072 698,459 - 100,000 200,000 300,000 400,000 500,000 600,000 700,000 800,000 900,000 2008 2009 2010 2011 2012 2013 2014 2015 Pro - Forma Q1
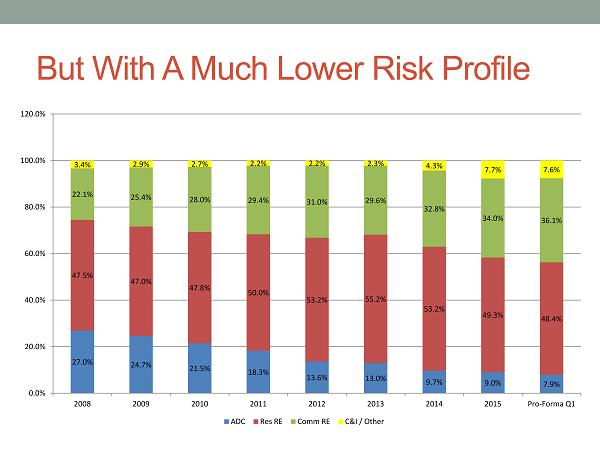
But With A Much Lower Risk Profile 27.0% 24.7% 21.5% 18.3% 13.6% 13.0% 9.7% 9.0% 7.9% 47.5% 47.0% 47.8% 50.0% 53.2% 55.2% 53.2% 49.3% 48.4% 22.1% 25.4% 28.0% 29.4% 31.0% 29.6% 32.8% 34.0% 36.1% 3.4% 2.9% 2.7% 2.2% 2.2% 2.3% 4.3% 7.7% 7.6% 0.0% 20.0% 40.0% 60.0% 80.0% 100.0% 120.0% 2008 2009 2010 2011 2012 2013 2014 2015 Pro - Forma Q1 ADC Res RE Comm RE C&I / Other

Stable Deposits Despite Brokered 53,508 53,063 50,858 55,145 59,610 70,114 86,244 121,062 125,914 662,497 737,345 747,561 695,687 615,488 614,112 616,873 595,555 663,854 - 20,000 40,000 60,000 80,000 100,000 120,000 140,000 160,000 180,000 200,000 - 100,000 200,000 300,000 400,000 500,000 600,000 700,000 800,000 900,000 2008 2009 2010 2011 2012 2013 2014 2015 Pro - Forma Q1 Noninterest Interest Brokered

Significantly Improved Deposit Mix 29% 71% Dec, 2008 Core Non - Core 61% 39% Pro - Forma Q1 Core Non - Core

Credit Losses Continue to Decline Credit Losses = Net Charge - Offs + REO Losses 3,400 25,937 24,629 31,282 13,005 9,237 5,610 210 158 - 500 1,000 1,500 2,000 2,500 - 5,000 10,000 15,000 20,000 25,000 30,000 35,000 2008 2009 2010 2011 2012 2013 2014 2015 Q1 2016 Credit Losses REO Expenses

Problem Assets Continue to Improve 47,603 44,267 81,993 58,379 37,482 26,133 21,205 12,649 16,408 65,409 92,685 113,178 86,170 58,864 47,019 31,205 19,196 21,843 - 20,000 40,000 60,000 80,000 100,000 120,000 2008 2009 2010 2011 2012 2013 2014 2015 Pro - Forma Q1 Nonperforming Assets Classified Loans

Strong Growth in Margin Income 31,429 29,905 26,875 24,911 24,932 24,463 25,872 27,421 33,289 - 5,000 10,000 15,000 20,000 25,000 30,000 35,000 2008 2009 2010 2011 2012 2013 2014 2015 Pro - Forma Q1 Annualized
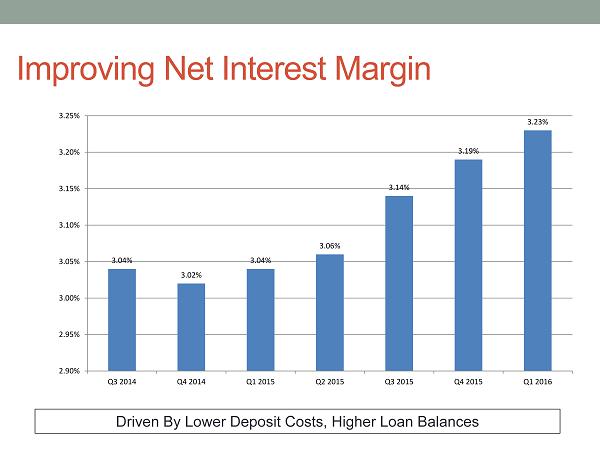
Improving Net Interest Margin 3.04% 3.02% 3.04% 3.06% 3.14% 3.19% 3.23% 2.90% 2.95% 3.00% 3.05% 3.10% 3.15% 3.20% 3.25% Q3 2014 Q4 2014 Q1 2015 Q2 2015 Q3 2015 Q4 2015 Q1 2016 Driven By Lower Deposit Costs, Higher Loan Balances

Focus on SBA Gains & Deposit Fees 258 629 823 1,336 2,312 2,329 2,547 3,044 - 500 1,000 1,500 2,000 2,500 3,000 3,500 2013 2014 2015 Pro - Forma Q1 Annualized SBA Deposit Fees

Realistic ROE Growth Targets 4.53% 6.00% 8.00% 0.00% 1.00% 2.00% 3.00% 4.00% 5.00% 6.00% 7.00% 8.00% 9.00% Q1 2016 (Core) 2016 (Budget) 2017 (Budget) Future ROE Improvement Driven By Proper Leverage

Stock Price Driven By Tangible Book 15.94 16.39 17.08 19.42 19.99 19.88 20.54 10 14.39 15.51 17.55 17.34 19.36 17.37 9 11 13 15 17 19 21 IPO Dec 31, 2014 March 31, 2015 June 30, 2015 September 30, 2015 December 31, 2015 March 31, 2016 Tangible Book Stock Price

Summary
Entegra Summary Successful M&A Record Strong Organic Growth Growing ROE Excellent Asset Quality Consistent Book Value Growth Improving Core Deposit Mix