Attached files
| file | filename |
|---|---|
| 8-K - 8-K - Dine Brands Global, Inc. | a16-11157_18k.htm |
Exhibit 99.1
ANNUAL MEETING OF STOCKHOLDERS May 17, 2016 © 2016 DineEquity, Inc. All rights reserved.
Forward-Looking Information: Statements contained in this presentation may constitute forward-looking statements within the meaning of the Private Securities Litigation Reform Act of 1995. You can identify these forward-looking statements by words such as "may," "will," "should," "could," "expect," "anticipate," "believe," "estimate," "intend," "plan" and other similar expressions. These statements involve known and unknown risks, uncertainties and other factors, which may cause actual results to be materially different from those expressed or implied in such statements. These factors include, but are not limited to: the effect of general economic conditions; the Company's indebtedness; risk of future impairment charges; trading volatility and the price of the Company’s common stock; the Company's results in any given period differing from guidance provided to the public; the highly competitive nature of the restaurant business; the Company's business strategy failing to achieve anticipated results; risks associated with the restaurant industry; risks associated with locations of current and future restaurants; rising costs for food commodities and utilities; shortages or interruptions in the supply or delivery of food; ineffective marketing and guest relationship initiatives and use of social media; changing health or dietary preferences; our engagement in business in foreign markets; harm to our brands' reputation; litigation; fourth-party claims with respect to intellectual property assets; environmental liability; liability relating to employees; failure to comply with applicable laws and regulations; failure to effectively implement restaurant development plans; our dependence upon our franchisees; concentration of Applebee's franchised restaurants in a limited number of franchisees; credit risk from IHOP franchisees operating under our previous business model; termination or non-renewal of franchise agreements; franchisees breaching their franchise agreements; insolvency proceedings involving franchisees; changes in the number and quality of franchisees; inability of franchisees to fund capital expenditures; heavy dependence on information technology; the occurrence of cyber incidents or a deficiency in our cybersecurity; failure to execute on a business continuity plan; inability to attract and retain talented employees; risks associated with retail brand initiatives; failure of our internal controls; and other factors discussed from time to time in the Company's Annual and Quarterly Reports on Forms 10-K and 10-Q, respectively, and in the Company's other filings with the Securities and Exchange Commission. The forward-looking statements contained in this presentation are made as of the date hereof and the Company assumes no obligation to update or supplement any forward-looking statements. Non-GAAP Financial Measures: This presentation includes references to the Company's non-GAAP financial measures "adjusted net income available to common stockholders (adjusted EPS)," and "free cash flow". "Adjusted EPS" is computed for a given period by deducting from net income or loss available to common stockholders for such period the effect of any closure and impairment charges, any gain or loss related to debt extinguishment, any intangible asset amortization, any non-cash interest expense, any gain or loss related to the disposition of assets, and other items deemed not reflective of current operations. This is presented on an aggregate basis and a per share (diluted) basis. “Free cash flow" for a given period is defined as cash provided by operating activities, plus receipts from notes and equipment contracts receivable, less capital expenditures. Management utilizes free cash flow to determine the amount of cash remaining for general corporate and strategic purposes and for the return of cash to stockholders pursuant to our capital allocation strategy, after the receipts from notes and equipment contracts receivable, and the funding of operating activities, capital expenditures and debt service. Management believes this information is helpful to investors to determine the Company's adherence to debt covenants and the Company's cash available for these purposes. Adjusted EPS and free cash flow are supplemental non-GAAP financial measures and should not be considered in isolation or as a substitute for measures of performance prepared in accordance with United States generally accepted accounting principles. 2 © 2016 DineEquity, Inc. All rights reserved.
OVERVIEW DINEEQUITY, INC. OF © 2016 DineEquity, Inc. All rights reserved.
HIGHLIGHTS OF THE DINEEQUITY STORY Applebee’s and IHOP are two iconic brands with #1 positions in their respective categories(1) for the last eight consecutive years •With more than 3,700 restaurants, DineEquity is one of the largest full-service restaurant companies in the world Stable long-term capital structure with an attractive fixed interest rate of 4.277% through 2021 99% franchised and asset-lite business model generates strong free cash flow with reduced volatility Balanced capital allocation strategy and commitment to return the majority of free cash flow to shareholders •DineEquity has returned a combined total of approximately $374 million to its shareholders in the form of quarterly cash dividends on its common stock and repurchases of common stock since being formed in 2008 through the first quarter of 2016. Purchasing co-op mitigates commodity inflation for our brands Our Shared Services platform leverages resources and expertise to achieve synergies across the organization (1) Nation’s Restaurant News, “Top 100,” June 15, 2015 (Applebee’s rank based on 2014 U.S. system-wide sales in the casual dining category; IHOP rank based on 2014 U.S. system-wide sales in the family dining category). 4 © 2016 DineEquity, Inc. All rights reserved.
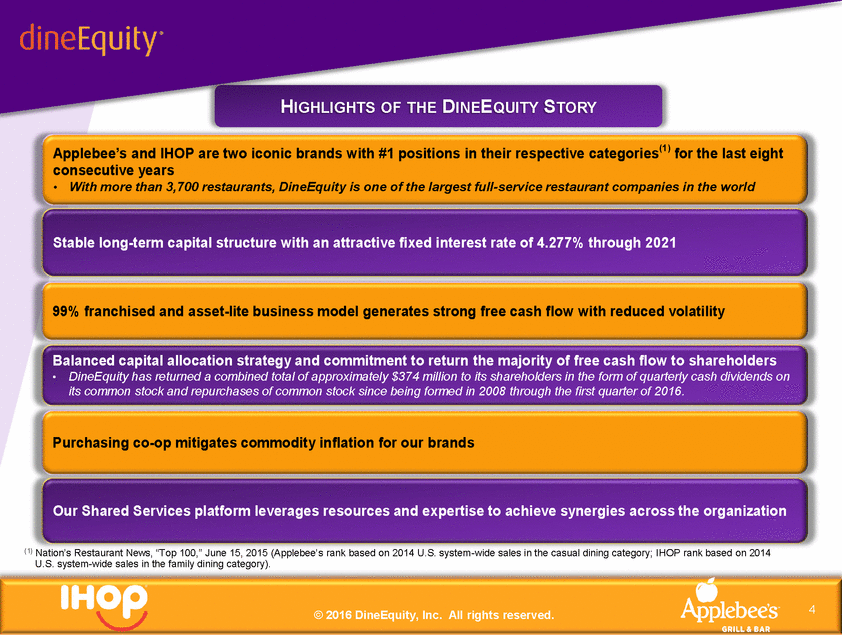
FIVE-YEAR CUMULATIVE TOTAL STOCKHOLDER RETURN $400 $300 36 $200 78 $156.82 $100 $0 2010 2011 2012 2013 2014 2015 Source: Value Line Publishing LLC Assumes $100 was invested at the close of trading on the last day of trading in 2010 in our common stock and in the market in dex, with reinvestment of all dividends. Stockholder returns over the indicated periods should not be considered indicative of future stock prices or stockholder retu rns. 5 © 2016 DineEquity, Inc. All rights reserved. $226.82 $192. $176.34$178.28 $180. $135.68 $102.11 $118.45 $85.48 DineEquity, Inc. Standard & Poor's 500
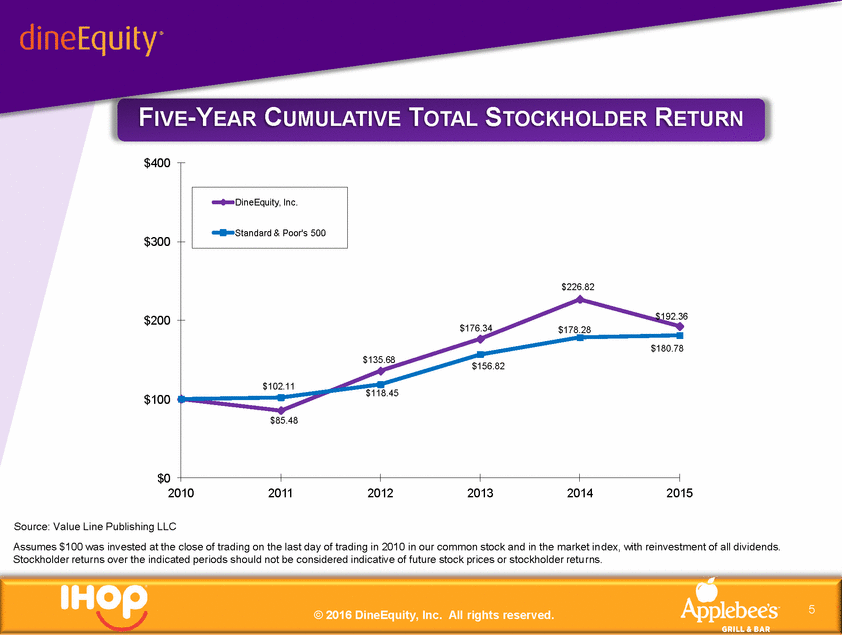
OUR BRANDS LEAD THEIR RESPECTIVE CATEGORIES Family Dining: Domestic System-wide Sales ($ in millions) $2,933 $3,000 $2,539 2,000 $960 1,000 0 IHOP Denny's Cracker Barrel Waffle House Bob Evans Casual Dining: Domestic System-wide Sales ($ in millions) $5,000 $4,577 $3,763 4,000 $3,634 $3,238 3,000 2,000 1,000 0 Applebee's Olive Garden Chili's Buffalo Wild Wings Outback Steakhouse Source: Latest available data disclosed in Nation’s Restaurant News, “Top 100,” June 15, 2015 (Applebee’s rank compared to highest ranked competitors based on 2014 U.S. system-wide sales in the casual dining category; IHOP rank compared to highest ranked competitors based on 2014 U.S. system-wide sales in the family dining category). 6 © 2016 DineEquity, Inc. All rights reserved. 2014 U.S. System-wide Sales 2014 U .S. System-wide Sales $2,487 $2,137 $1,119
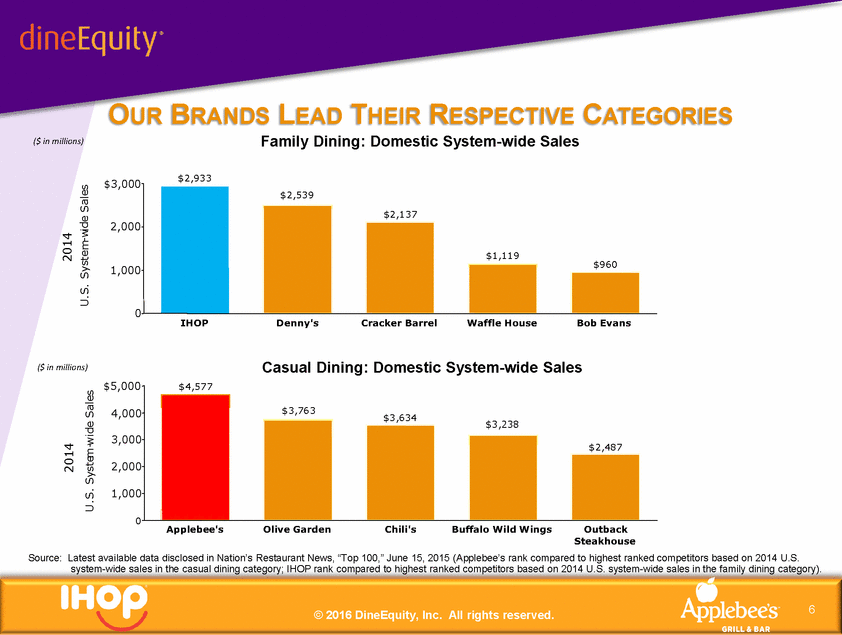
OUR BRANDS ARE MARKET SHARE LEADERS THEIR RESPECTIVE CATEGORIES IN IHOP Denny's (ranked #2) Remaining Family Dining Competitors 56.0% 20.4% Source: Latest available data disclosed in Nation’s Restaurant News, “Top 100,” June 15, 2015. A chain’s market share is based on its U.S. system-wide sales as a percentage of its Top 100 industry segment’s total sales 7 © 2016 DineEquity, Inc. All rights reserved.
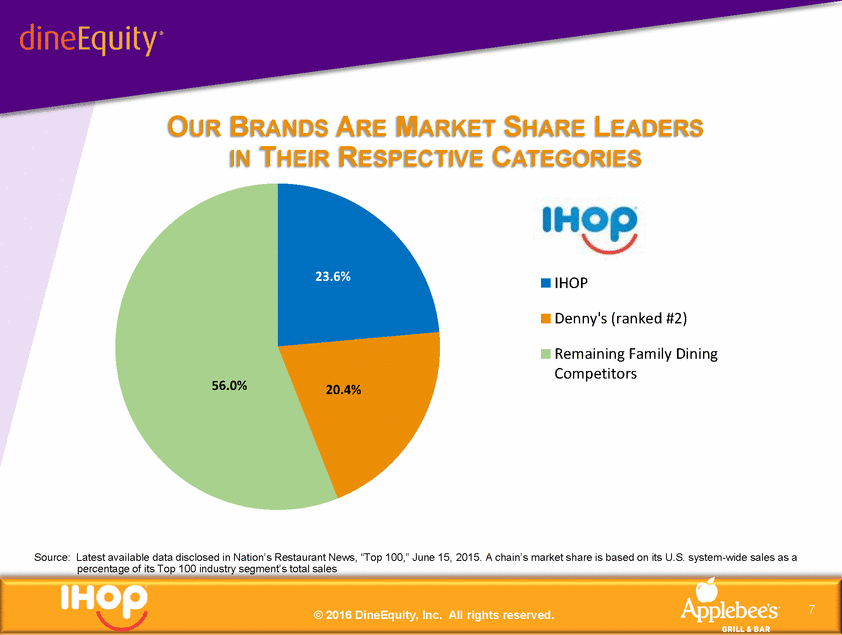
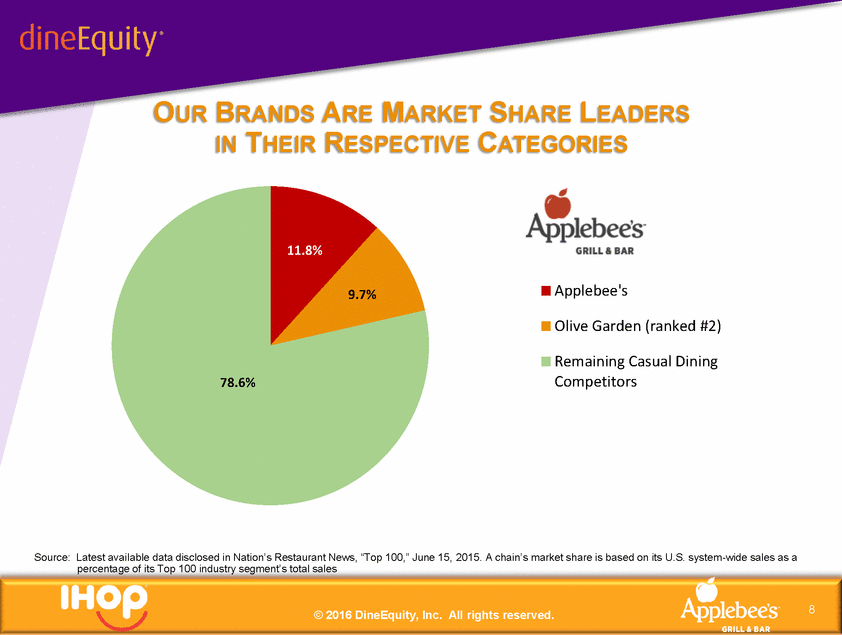
OUR BRANDS ARE MARKET SHARE LEADERS THEIR RESPECTIVE CATEGORIES IN 11.8% Applebee's 9.7% Olive Garden (ranked #2) Remaining Casual Dining Competitors 78.6% Source: Latest available data disclosed in Nation’s Restaurant News, “Top 100,” June 15, 2015. A chain’s market share is based on its U.S. system-wide sales as a percentage of its Top 100 industry segment’s total sales 8 © 2016 DineEquity, Inc. All rights reserved.
OUR STRATEGY TO DRIVE ORGANIC GROWTH © 2016 DineEquity, Inc. All rights reserved.
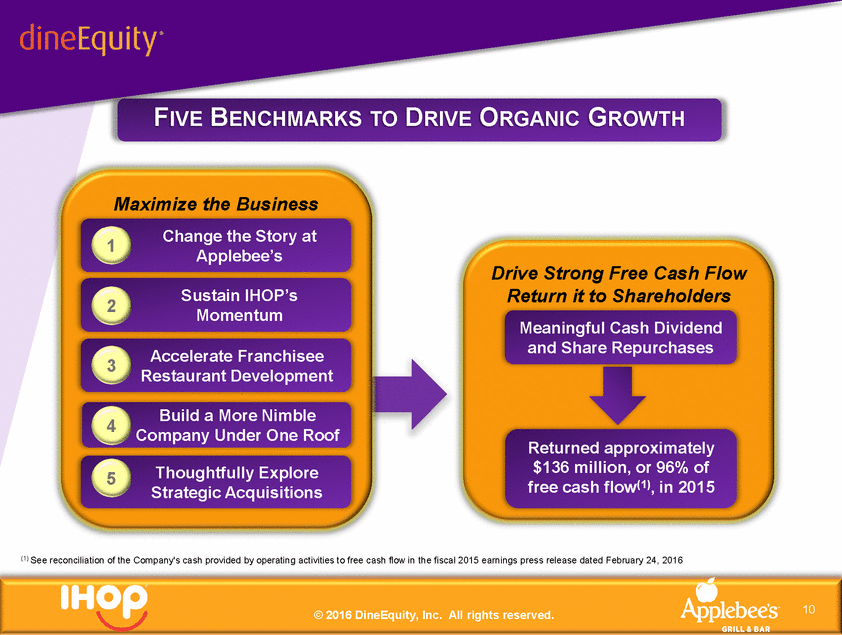
FIVE BENCHMARKS DRIVE ORGANIC GROWTH TO Maximize the Business Change the Story at Applebee’s 1 Drive Strong Free Cash Flow Return it to Shareholders Meaningful Cash Dividend and Share Repurchases Sustain IHOP’s Momentum 2 Accelerate Franchisee Restaurant Development 3 Build a More Nimble Company Under One Roof 4 Returned approximately $136 million, or 96% of free cash flow(1), in 2015 Thoughtfully Explore Strategic Acquisitions 5 (1) See reconciliation of the Company's cash provided by operating activities to free cash flow in the fiscal 2015 earnings press release dated February 24, 2016 10 © 2016 DineEquity, Inc. All rights reserved.
INNOVATE EVOLVE BUILD STRONG BRANDS © 2016 DineEquity, Inc. All rights reserved.
H A N D - C U T, W O O D - F I R E D P L A T F O R M Changing the Applebee’s Conversation 12
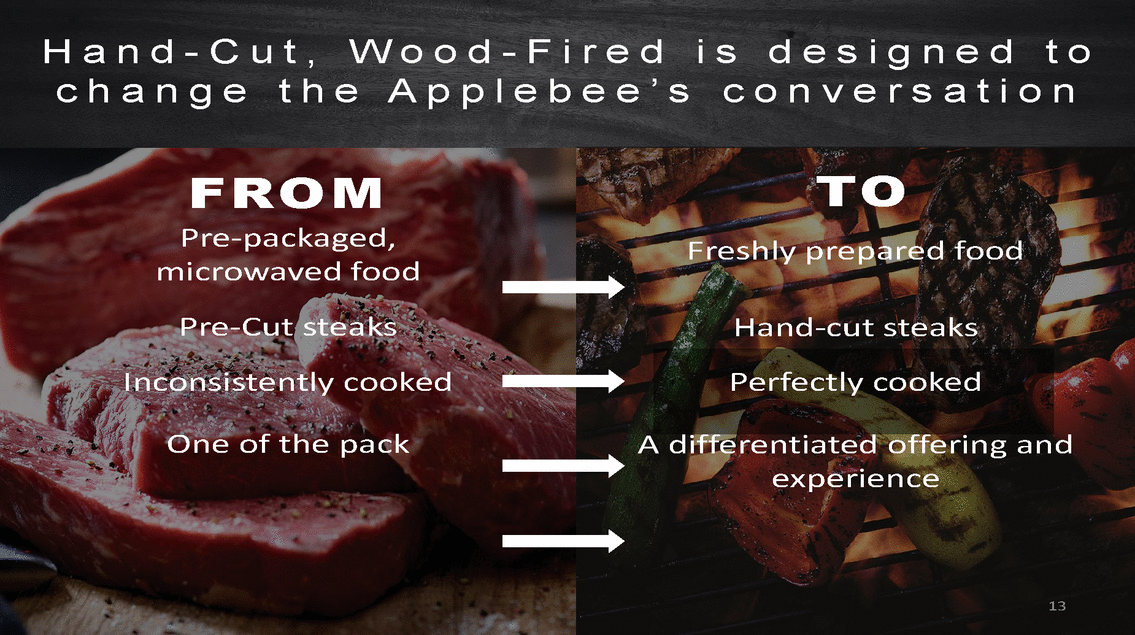
H a n d - C u t ,W o o d - F i r e d i sd e s i g n e d c o n v e r s a t i o t o n c h a n g e t h e A p p l e b e e ’ s TO Freshly prepared food FROM Pre-packaged, microwaved food Pre-Cut steaks Inconsistently cooked Hand-cut steaks Perfectly cooked One of the pack A differentiated offering experience and 13
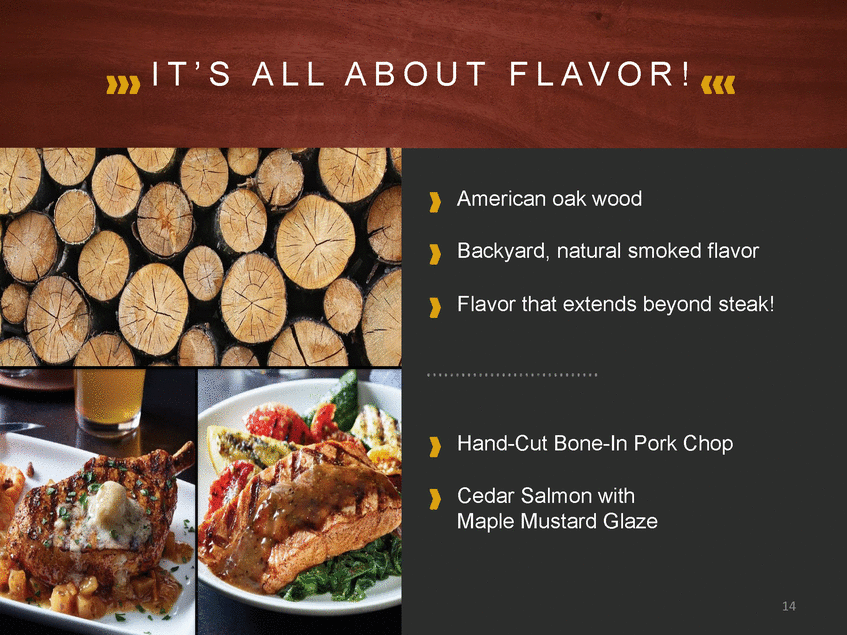
I T ’ S A L L A B O U T F L A V O R ! American oak wood Backyard, natural smoked flavor Flavor that extends beyond steak! Hand-Cut Bone-In Pork Chop Cedar Salmon with Maple Mustard Glaze 14
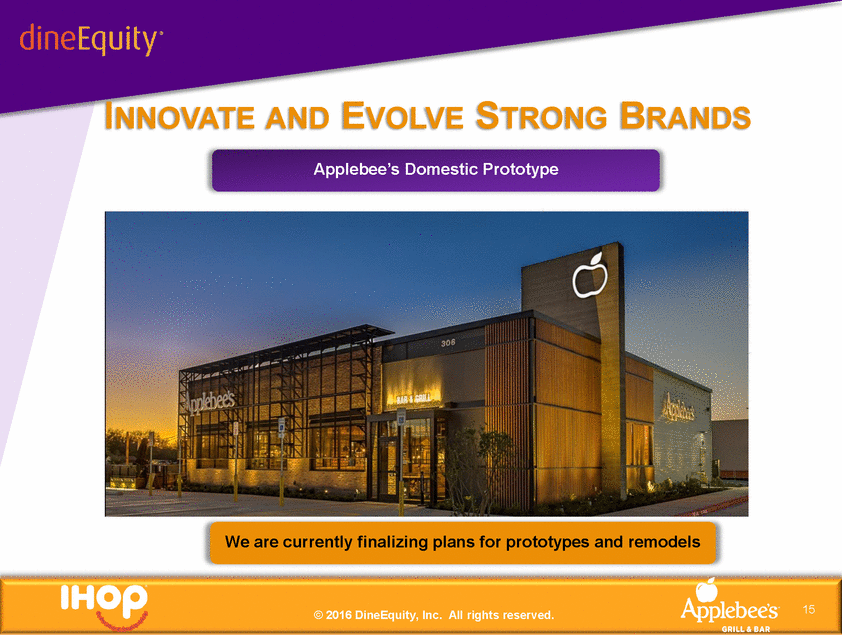
INNOVATE AND EVOLVE STRONG Applebee’s Domestic Prototype BRANDS We are currently finalizing plans for prototypes and remodels 15 © 2016 DineEquity, Inc. All rights reserved.
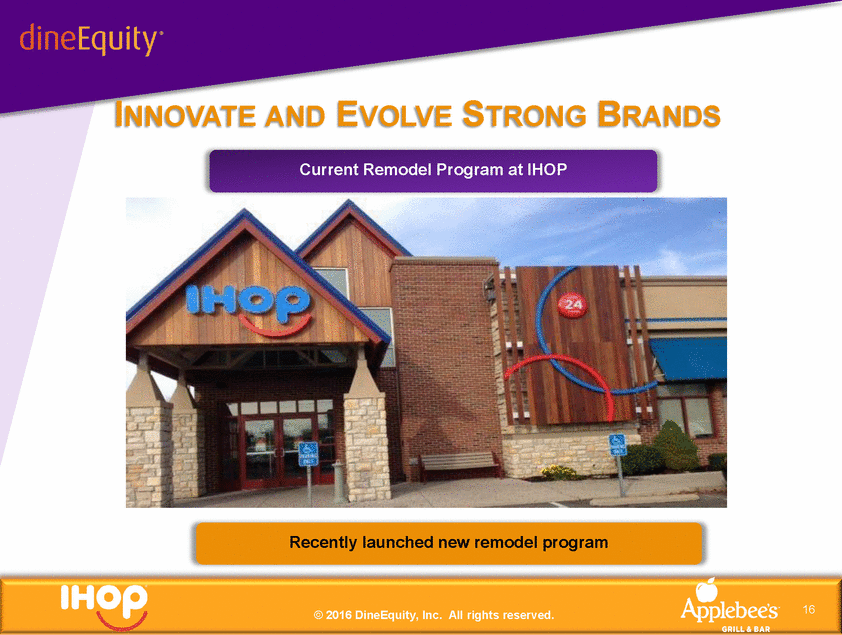
INNOVATE AND EVOLVE STRONG Current Remodel Program at IHOP BRANDS Recently launched new remodel program 16 © 2016 DineEquity, Inc. All rights reserved.
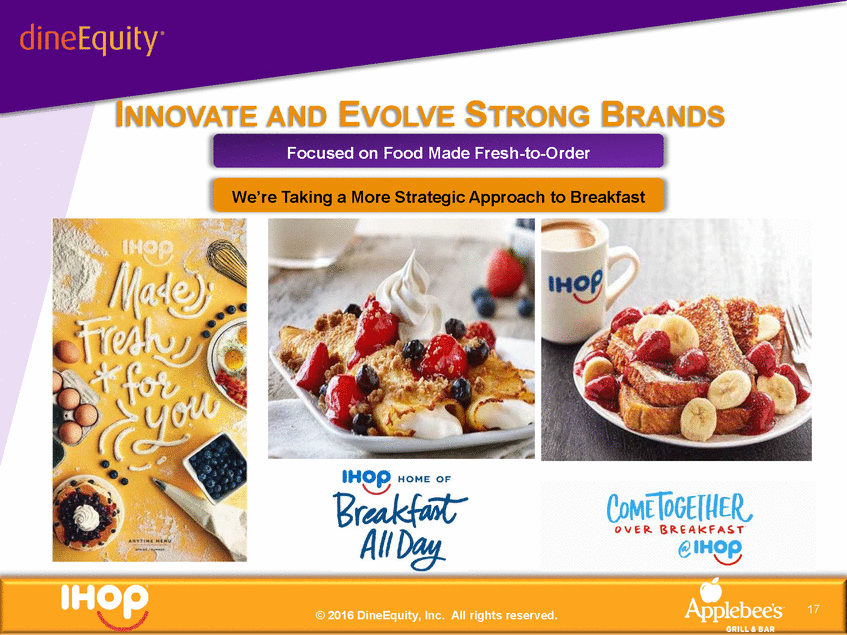
INNOVATE AND EVOLVE STRONG BRANDS Focused on Food Made Fresh-to-Order We’re Taking a More Strategic Approach to Breakfast 17 © 2016 DineEquity, Inc. All rights reserved.
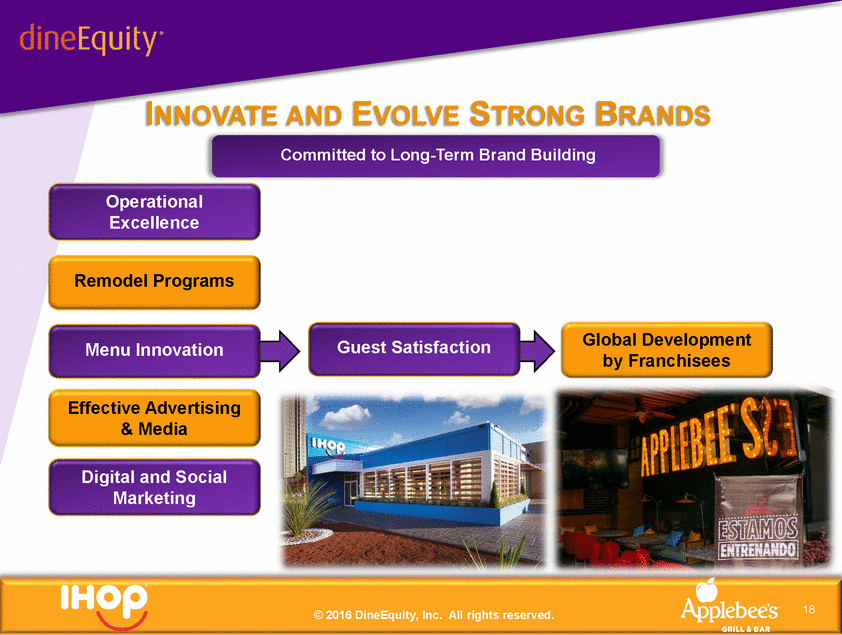
INNOVATE AND EVOLVE STRONG BRANDS Committed to Long-Term Brand Building Operational Excellence Remodel Programs Global Development by Franchisees Guest Satisfaction Menu Innovation Effective Advertising & Media Digital and Social Marketing 18 © 2016 DineEquity, Inc. All rights reserved.
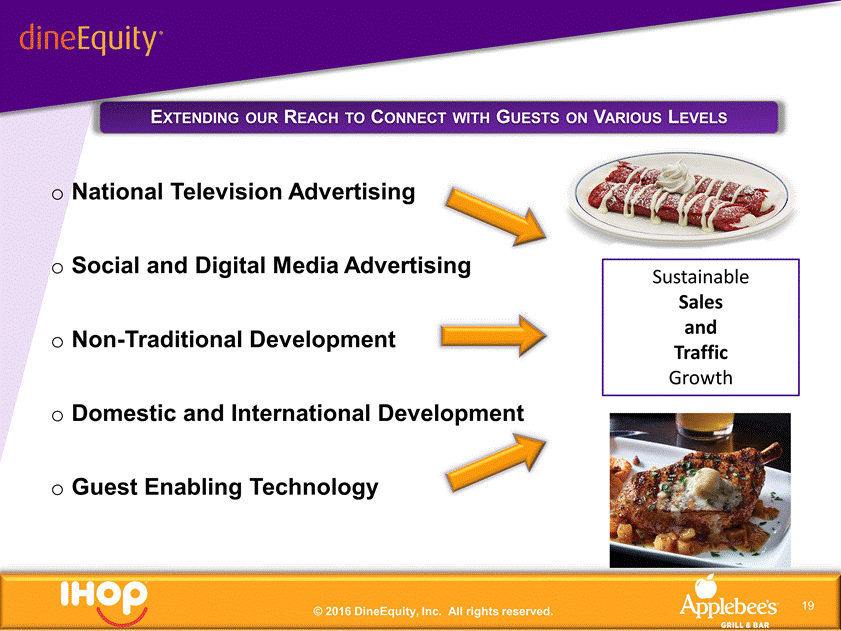
EXTENDING OUR REACH TO CONNECT WITH GUESTS ON VARIOUS LEVELS o National Television Advertising o Social and Digital Media Advertising o Non-Traditional Development o Domestic and International Development o Guest Enabling Technology Sustainable Sales and Traffic Growth © 2016 DineEquity, Inc. All rights reserved.
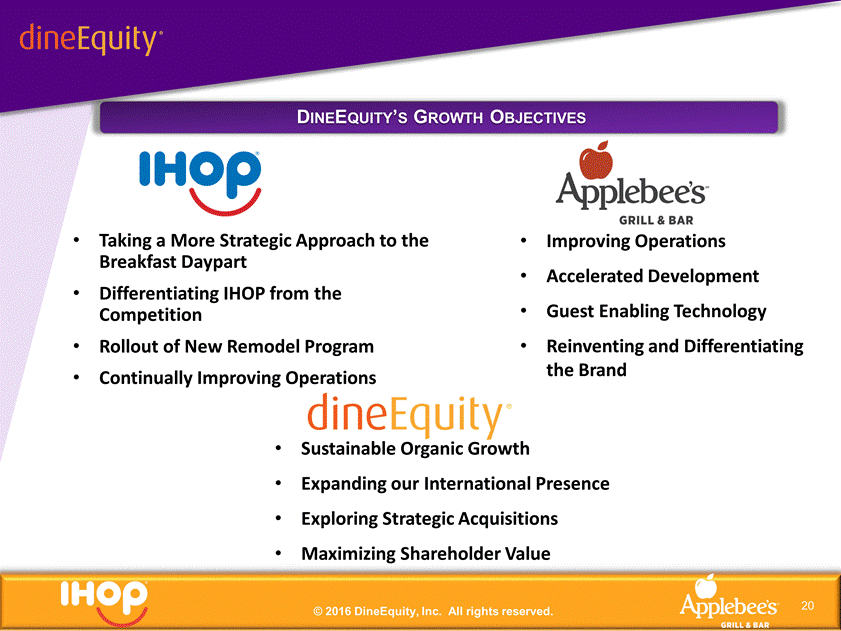
DINEEQUITY’S GROWTH OBJECTIVES • Taking a More Strategic Approach to the Breakfast Daypart • Differentiating IHOP from the Competition • Rollout of New Remodel Program • Continually Improving Operations 20 • Improving Operations • Accelerated Development • Guest Enabling Technology • Reinventing and Differentiating the Brand • Sustainable Organic Growth • Expanding our International Presence • Exploring Strategic Acquisitions • Maximizing Shareholder Value © 2016 DineEquity, Inc. All rights reserved.
FIRST QUARTER 2016 FINANCIAL RESULTS © 2016 DineEquity, Inc. All rights reserved.
FIRST QUARTER 2016 RESULTS AND HIGHLIGHTS Reported adjusted EPS of $1.58(1) and GAAP EPS of $1.37 • Generated free cash flow of approximately $39 million,(2) of which approximately $37 million was returned to shareholders in the form of share repurchases and a first quarter cash dividend combined. • Same-restaurant Sales Performance o IHOP’s same-restaurant comp sales increased by 1.5%, marking the 12th consecutive quarter of positive same-restaurant sales performance o Applebee’s same-restaurant comp sales declined by 3.7% • IHOP franchisees and area licensees and Applebee's franchisees opened a combined 13 new gross restaurants. • The consolidation of our restaurant support center is yielding the expected results. • Our 11th annual National Pancake Day was a record-breaking event, raising approximately $4 million for charities. (1) See reconciliation of the Company's net income available to common stockholders to net income available to common stockholders, as adjusted for certain items, contained in the first quarter 2016 earnings press release dated May 5, 2016 (2) See reconciliation of the Company's cash provided by operating activities to free cash flow contained in the first quarter 2016 earnings press release dated May 5, 2016 © 2016 DineEquity, Inc. All rights reserved.
POSITIONED FUTURE SUCCESS FOR © 2016 DineEquity, Inc. All rights reserved.
BUILDING ON OUR ACHIEVEMENTS FOR FUTURE SUCCESS Boldly change the story at Applebee’s with the introduction of our hand-cut, wood-fired platform • Build on IHOP’s momentum by further differentiating the brand from the competition • Collaborate with our franchisees to achieve positive and sustainable sales and traffic at both brands • Accelerate the pace the of traditional and non-traditional development by our franchisees in domestic and international markets • Explore strategic acquisitions to leverage our scalable Shared Services platform and purchasing co-op • Build a more nimble and collaborative organization Focused on key priorities to drive organic growth © 2016 DineEquity, Inc. All rights reserved.
ANNUAL MEETING OF STOCKHOLDERS MAY 17, 2016 © 2016 DineEquity, Inc. All rights reserved.
