Attached files
| file | filename |
|---|---|
| EX-99.1 - EX-99.1 - SANDRIDGE ENERGY INC | d168990dex991.htm |
| EX-10.1 - EX-10.1 - SANDRIDGE ENERGY INC | d168990dex101.htm |
| 8-K - FORM 8-K - SANDRIDGE ENERGY INC | d168990d8k.htm |
 SandRidge Energy, Inc.
Company Overview
February 2016 Exhibit 99.2 |
 Disclaimer This presentation regarding SandRidge Energy, Inc. and its subsidiaries (“SD” or the “Company”) has been prepared solely for informational purposes using certain Company information and publicly available information. Neither the Company nor any of its advisors or representatives makes any representation or warranty, express or implied, as to the accuracy or completeness of the information in this presentation, and nothing contained herein is, or should be relied on as, a promise or representation, whether as to the past or the future. The presentation includes certain statements, estimates, and projections with respect to, among other things, the anticipated operating performance of the Company, which are inherently subject to significant economic, competitive, and other uncertainties and contingencies and have been included solely for illustrative purposes. This presentation speaks as of the date on which it is made. Neither the delivery of this presentation nor any further discussions with the Company or any of its advisors or representatives shall, under any circumstances, create any implication that there has been no change in the affairs of the Company since that date. Neither the Company nor any of its advisors or representatives undertakes any duty to update or to correct this presentation. This presentation is not intended to furnish regulatory, tax, accounting, investment, restructuring, or any other advice to any recipient. This presentation has been prepared without taking into account individual investment objectives, financial situation, or needs of any particular person. The statements and information contained in this presentation that are not statements of historical fact, including any estimates and assumptions contained herein, are "forward looking statements" as defined in Section 27A of the Securities Act of 1933, as amended, and Section 21E of the Securities Exchange Act of 1934, as amended. These statements are qualified in their entirety by the "Risk Factors," "Management's Discussion and Analysis of Financial Condition and Results of Operations," and all other applicable sections of the Company's 2014 annual report on Form 10-K filed with the Securities and Exchange Commission and subsequently filed quarterly reports on Form 10-Q. 2 SandRidgeEnergy.com |
 Introduction……………………………………………………………………………………………
Reserves…………………………………………………………………………………………………
Core Assets
Mississippian..……………………………………………………………………………………..
North Park
Basin………………………………………………………………………………….
Other
Assets…………………………………………………………………………………………..
Appendix………………………………………………………………………………………………
4
8 14 20 26 28 Page Table of Contents 3 SandRidgeEnergy.com |
 Introduction |
 Business Highlights
Experienced Developers with
Culture of Innovation and Continuous Improvement
Solid Base Returns /
Substantial Upside
MidCon provides derisked production base with high graded drilling inventory,
under current pricing Growth potential with recent North Park
acquisition and continued MidCon improvements Upsides: well
costs, deployment of extended and multi laterals into North Park Basin (NPB), stacked zones in MidCon and NPB, NPB type curve and stimulation methods Deep Operating Experience Large scale efficient operator: Over 1,600 horizontal wells; 30+ rigs in 2014; market leading cost of
$2.2MM per Mississippian lateral
Infrastructure and logistics: building and optimizing extensive midstream and
electrical systems Artificial lift: optimizing well returns via
gas lift, ESPs, and rod pumps Engineering: pioneering
application of multilaterals, extended laterals, full section development and new completion techniques to reduce costs and enhance recovery Business Minded Management Team Management background includes oil majors, independents and Wall Street
Prudent management strategy to increase asset value through innovation and
cost reduction Focused on asset base diversification and
increasing oil mix; focused on fully loaded returns Positioned to
Capitalize on Market Opportunities
Strong tenured team focused on results and value. Proactive during the
downturn with improved operating metrics, focus on capital
efficiency and successes eliminating contractual and business
overhang issues
Ability to deploy skillsets into adjacent assets and selected consolidation
opportunities Near Term Objectives
Top decile in all operational execution measures
Fierce capital discipline targeting a minimum 10% fully burdened IRR at
strip Drive costs down further in MidCon, become cost leader in
Niobrara Initiate Niobrara development targeting 12k bopd into
2017 Keep cost structure in-line with activity level
5
SandRidgeEnergy.com |
 Asset Overview E&P Assets Midstream SWG System Electrical System Compressors, Other Non-Oil & Gas Real Estate Corporate HQ, Other OKC Properties Non-E&P Assets * Lariat Services activities significantly reduced Dec ’15 Production: 1.0 Mboe/d
1P Reserves: 25 MMboe Dec ’15 Production: 3.7 Mboe/d
1P Reserves (1) : 7 MMboe Dec ’15 Production: 58.3 Mboe/d
1P Reserves (1) : 261 MMboe (1) Net of NCI portion of royalty trusts 6 SandRidgeEnergy.com |
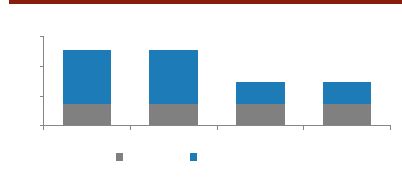
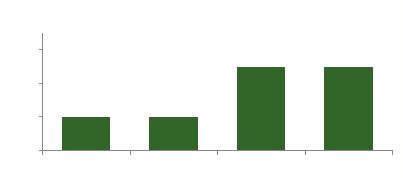
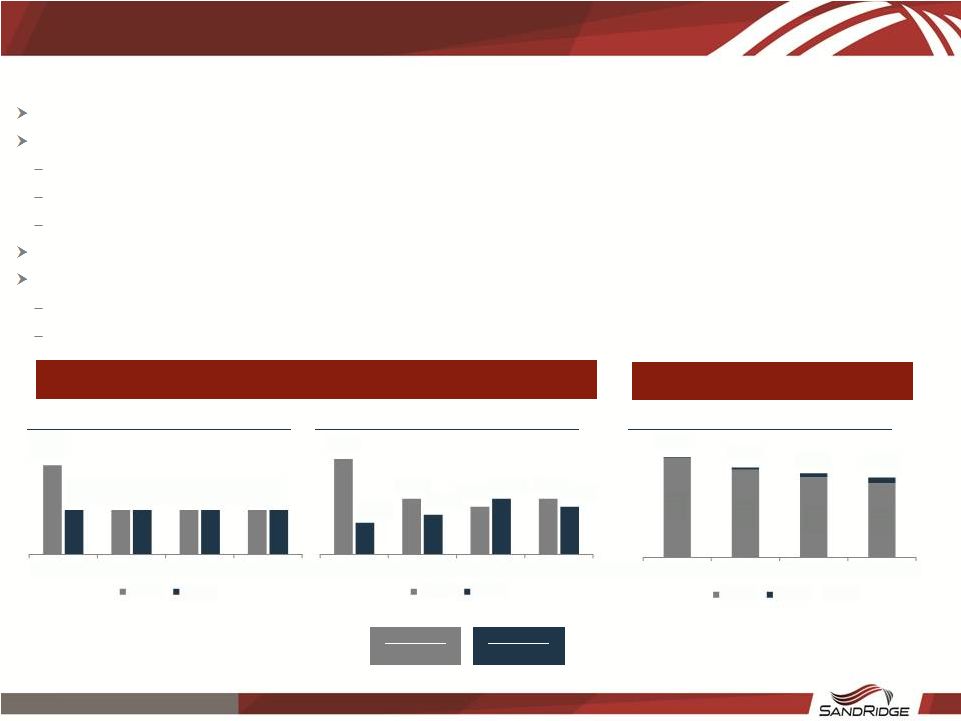 7 SandRidgeEnergy.com 2016 Focus Drilling Plan Rig Count Laterals Spud Focused on enhancing MidCon returns while establishing North Park and protecting liquidity
Flexible capital spending program designed to adjust with market
environment Prudently reduced MidCon rig count with high graded
targets and lower well costs Concentration on highest return focus
areas Utilizing reservoir and geologic modeling
1 rigs planned in MidCon for remainder of 2016
Cost reductions from multi lateral full section development and extended
lateral designs Quickly establish best practices in North Park
development Drive down well costs
Improve recovery through enhanced completion techniques
Production Mboed FY-16 Total 32 Laterals FY-16 Total 22 Laterals 62.6 55.1 50.5 46.8 63.2 56.6 53.0 50.3 Q1-16 Q2-16 Q3-16 Q4-16 MidCon Rockies Total 12 7 6 7 4 5 7 6 Q1-16 Q2-16 Q3-16 Q4-16 MidCon Rockies 2 1 1 1 1 1 1 1 Q1-16 Q2-16 Q3-16 Q4-16 MidCon Rockies |
 Reserves |
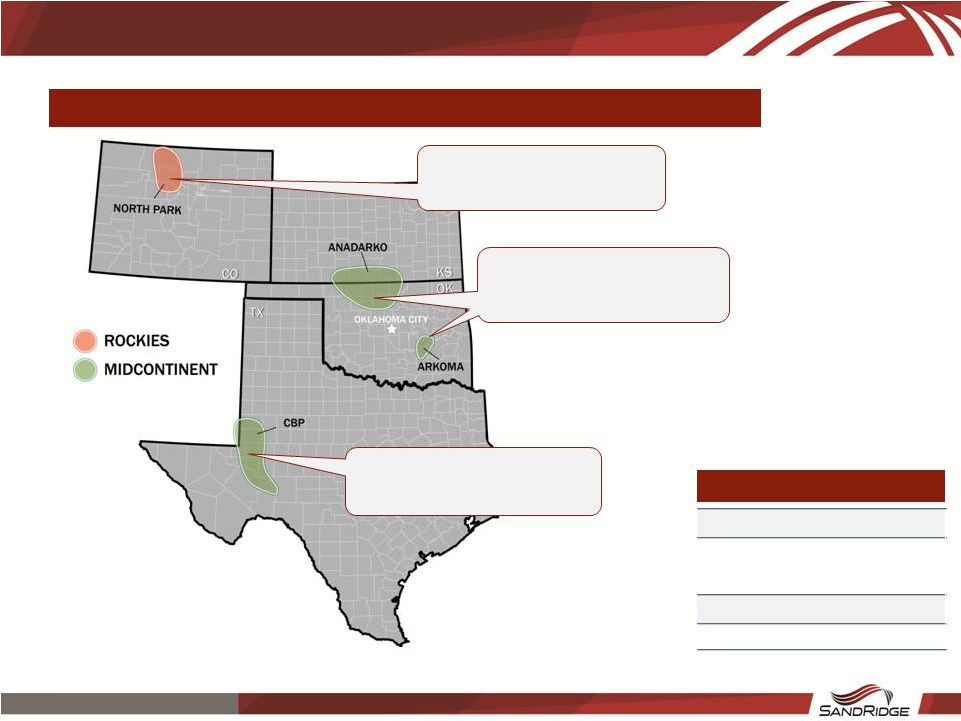
 Asset Map Strong production base with platform for growth – $2.1 billion of 2P NPV & 1.0 Bboe Summary of Assets by Location Dec ’15 Production: 3.7 Mboe/d
1P Reserves (1) : 7 MMboe 1P PV-10 (1)(2) : ($20MM) Dec ’15 Production: 58.3 Mboe/d
1P Reserves (1) : 261 MMboe 1P PV-10 (1)(2) : $1,131MM Dec ’15 Production: 1.0 Mboe/d
1P Reserves: 25 MMboe Acquisition Value: ~$190MM (1) Net of NCI portion of royalty trusts (2) As of 1/29/16 strip; $37.45 / $2.43 (2016), $43.79 / $2.75 (2017), $46.30 / $2.88 (2018), $48.00 / $2.99 (2019), $49.32 / $3.11
(2020) Totals
1P 2P Reserves (MMboe) (1) 293 1,005 PV-10 ($MM) (1)(2) $1,105 $2,128 9 SandRidgeEnergy.com |
 Core Emerging Non-Core Mississippian Chester North Park Basin Woodford & Meramec Permian Reserves (Mboe) (1)(2) 255,246 3,860 24,710 1,444 7,455 PV-10 ($MM) (1)(2) $1,088 $33 ~$190 (3) $10 ($20) Dec ’15 Production (Mboe/d) 56.4 1.2 1.0 0.7 3.8 Overview of Reserve Assets Note: (1) Proved reserves net of NCI portion of royalty trusts (2) As of 1/29/16 strip; $37.45 / $2.43 (2016), $43.79 / $2.75 (2017), $46.30 / $2.88 (2018), $48.00 / $2.99 (2019), $49.32 / $3.11
(2020) (3)
Reflects North Park acquisition value
Mississippian reserve base supported by growth potential in Chester and North
Park 10
SandRidgeEnergy.com |
 Note: Based on SEC reserve report run at 1/29/16 strip; assumes well costs of: Miss@$2.4MM; Chester@$2.8MM; North Park@$4MM;
Woodford@$3.1MM 1/29/16 strip: $37.45 / $2.43 (2016), $43.79 /
$2.75 (2017), $46.30 / $2.88 (2018), $48.00 / $2.99 (2019), $49.32 / $3.11 (2020) Net of NCI portion of royalty trusts Technical PUDs: Proved undeveloped locations which fit the geologic risk profile of SEC PUDs but excluded from actual SEC PUDs due to
5 year development rule or other limitations (1) North Park
Undeveloped PV-10 includes facilities costs of $41MM Reserve
volumes are 79% developed and 24% oil Reserves & PV-10 By
Area @ Jan 29, 2016 Strip Pricing 11
SandRidgeEnergy.com |
 12 SandRidgeEnergy.com Competitive Returns in Depressed Commodity Environment IRR Comparison: D&C Only IRR Comparison: “All-In” ($MM) D&C Non-D&C (1) Total “All-In” Mississippian $2.1 $0.5 $2.6 North Park $3.6 $0.1 $3.7 Note: Blended type curve reflects 2016 Mississippian drilling program (1) Non-D&C costs include undiscounted: Midstream and Electrical ($55k), SWG ($120k), and Workovers ($320k)
Competitive returns at both D&C and “All-In” cost in low
commodity price environment 13%
17% 22% 10% 16% 23% 0% 5% 10% 15% 20% 25% 30% 35% 1/29 STRIP 1/29 STRIP (OIL + $5) 1/29 STRIP (OIL + $10) Miss (Blended) North Park 20% 26% 32% 11% 17% 24% 0% 5% 10% 15% 20% 25% 30% 35% 1/29 STRIP 1/29 STRIP (OIL + $5) 1/29 STRIP (OIL + $10) Miss (Blended) North Park 12 SandRidgeEnergy.com |
 13 SandRidgeEnergy.com Acreage Summary Significant HBP acreage, with expiring acreage largely being Kansas non-core Notes: HBP includes HBU Acreage Position & Lease Expiration Acreage Summary Non-HBP Lease Expiration Schedule HBP Non-HBP Total 2016 2017 2018 2019 2020 Total 366,633 186,542 553,175 Expiring Acreage 38,657 108,142 37,360 2,033 - 186,192 66% 34% 100% Extendable Acreage 6,056 24,129 11,168 - - 41,352 182,331 480,471 662,801 Expiring Acreage 331,003 145,739 3,213 488 - 480,444 28% 72% 100% Extendable Acreage 141,947 78,045 1,060 90 - 221,142 70,416 62,705 133,121 Expiring Acreage 7,385 46,825 6,580 1,275 640 62,706 53% 47% 100% Extendable Acreage 1,040 - - 280 640 1,960 18,754 7,693 26,447 Expiring Acreage 235 97 - 7,322 - 7,654 71% 29% 100% Extendable Acreage - 8 - - - 8 638,133 737,411 1,375,544 46% 54% 100% CO TX OK KS 13 SandRidgeEnergy.com |
 Core Assets Mississippian |
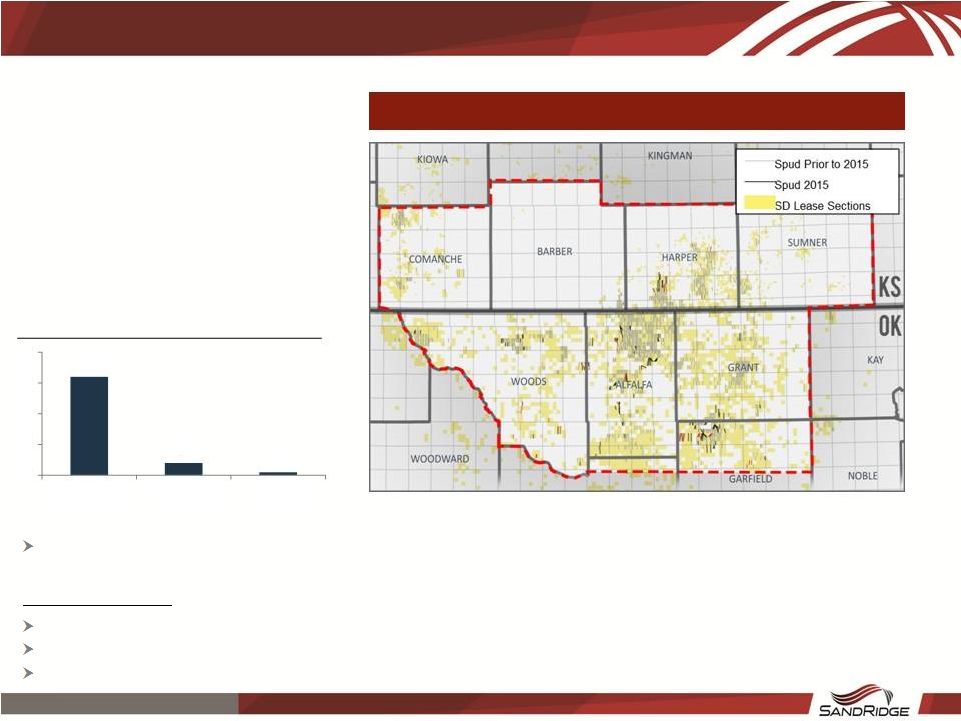 Rig Count Utilizing full section development (FSD), extended lateral well designs, pad drilling and a focus on non-D&C spend to
increase margins within development areas
Focus Area Acreage
955k gross & 667k net acres (196k in KS, 471k in OK)
64% HBP or 426k net acres (68% in OK, 55% in KS)
2016: 85k acres expiring with extensions on ~25%, 21k @
$418/acre=$8.8MM Current Activity
SD Focus Area Reduced activity and high grading locations in response to market conditions Drilling 32 MidCon laterals in 2016 with a focus on Garfield and Alfalfa Counties 15 SandRidgeEnergy.com 32 4 1 0 10 20 30 40 Beginning 2015 Ending 2015 Current |
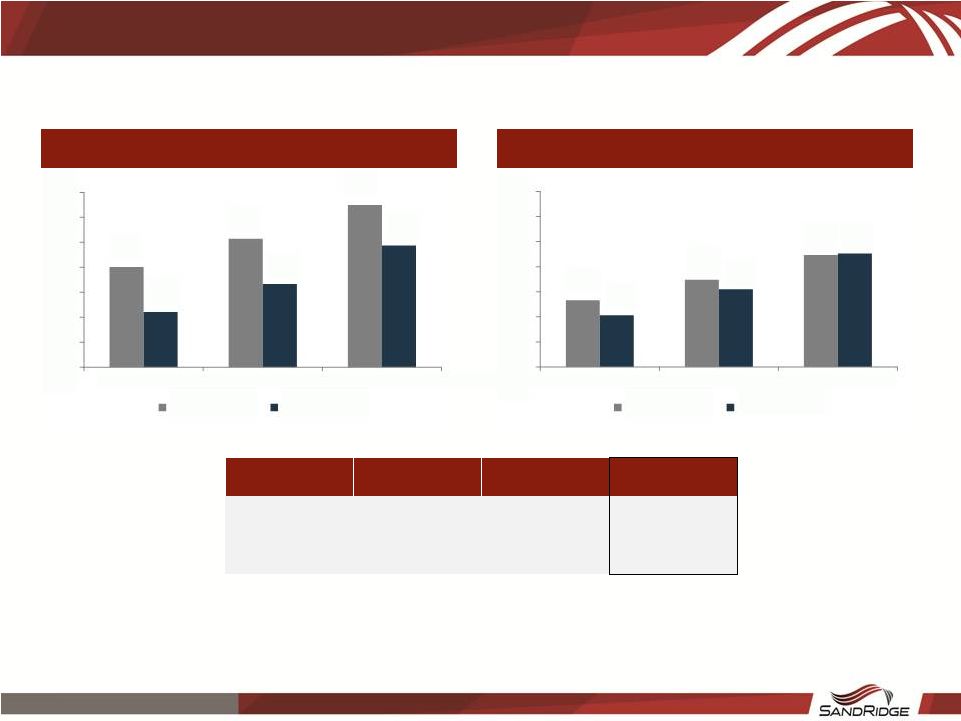
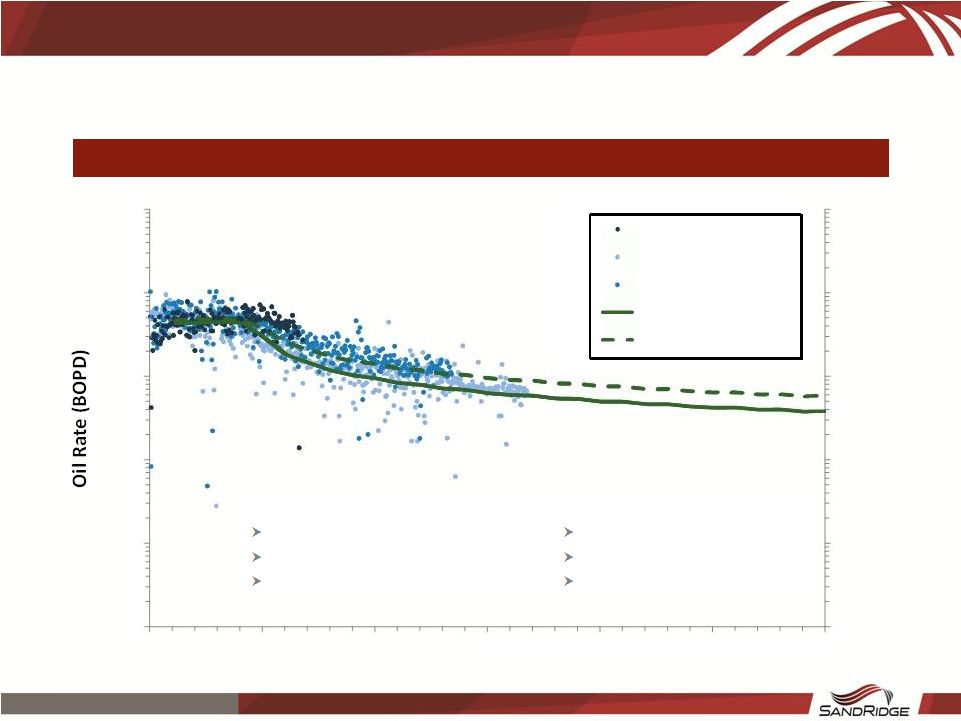
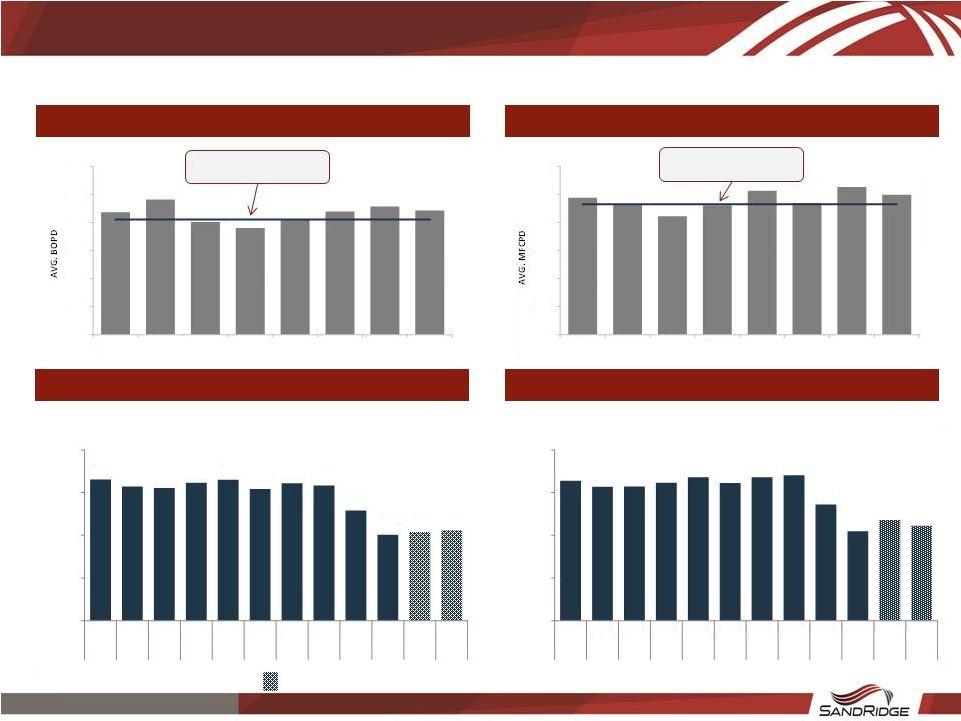 Mississippian Performance Overview
Mississippian Total Program Quarterly Lateral Costs
Mississippian Singles Quarterly Lateral Costs
Mississippian Single Laterals Averaged $2.1MM / Lateral in Q4
’15 Mississippian Total Program Averaged $2.2MM / Lateral in
Q4 ’15 Mississippian Single Lateral 30-Day IPs
(Oil) Mississippian Single Lateral 30-Day IPs
(Gas) Blended Type Curve
(205 BOPD) Blended Type Curve (1,161 MCFPD) High Grading & Cost Reduction Efforts Result In Mississippian Outperformance
Denotes figures based on field estimates
16 SandRidgeEnergy.com 1,220 1,154 1,055 1,153 1,282 1,171 1,314 1,247 - 250 500 750 1,000 1,250 1,500 Q1'14 Q2'14 Q3'14 Q4'14 Q1'15 Q2'15 Q3'15 Q4'15 218 241 201 190 205 219 228 221 - 50 100 150 200 250 300 Q1'14 Q2'14 Q3'14 Q4'14 Q1'15 Q2'15 Q3'15 Q4'15 $3.3 $3.1 $3.1 $3.2 $3.4 $3.2 $3.4 $3.4 $2.7 $2.1 $2.4 $2.2 $0.0 MM $1.0 MM $2.0 MM $3.0 MM $4.0 MM Q1 Q2 Q3 Q4 Q1 Q2 Q3 Q4 Q1 Q2 Q3 Q4 2013 2013 2013 2013 2014 2014 2014 2014 2015 2015 2015 2015 $3.3 $3.1 $3.1 $3.2 $3.3 $3.1 $3.2 $3.2 $2.6 $2.0 $2.1 $2.1 $0.0 MM $1.0 MM $2.0 MM $3.0 MM $4.0 MM Q1 Q2 Q3 Q4 Q1 Q2 Q3 Q4 Q1 Q2 Q3 Q4 2013 2013 2013 2013 2014 2014 2014 2014 2015 2015 2015 2015 |
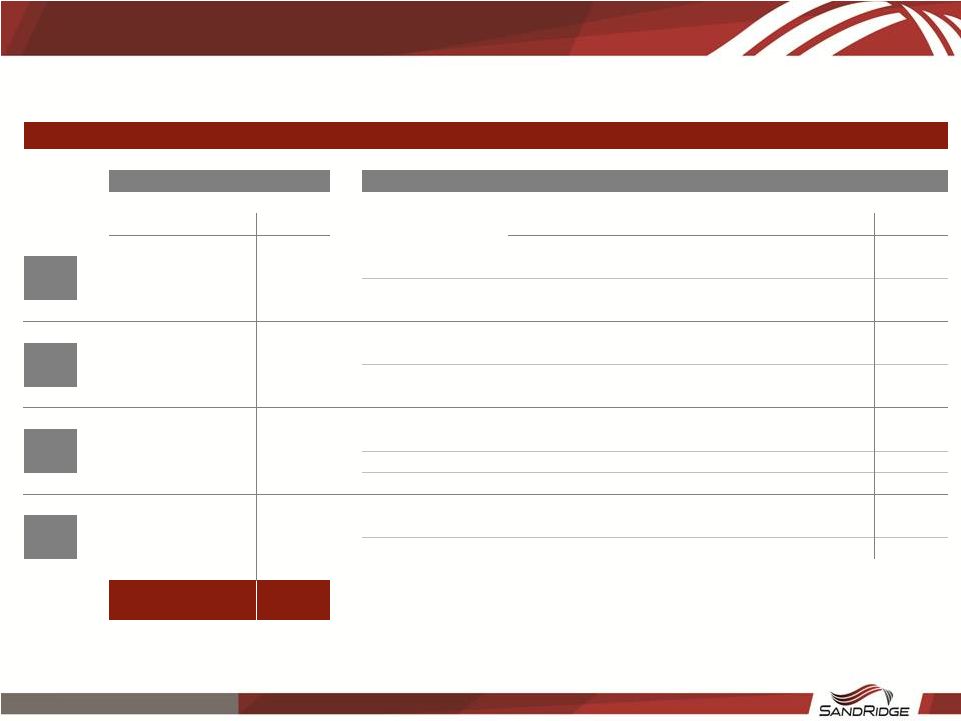
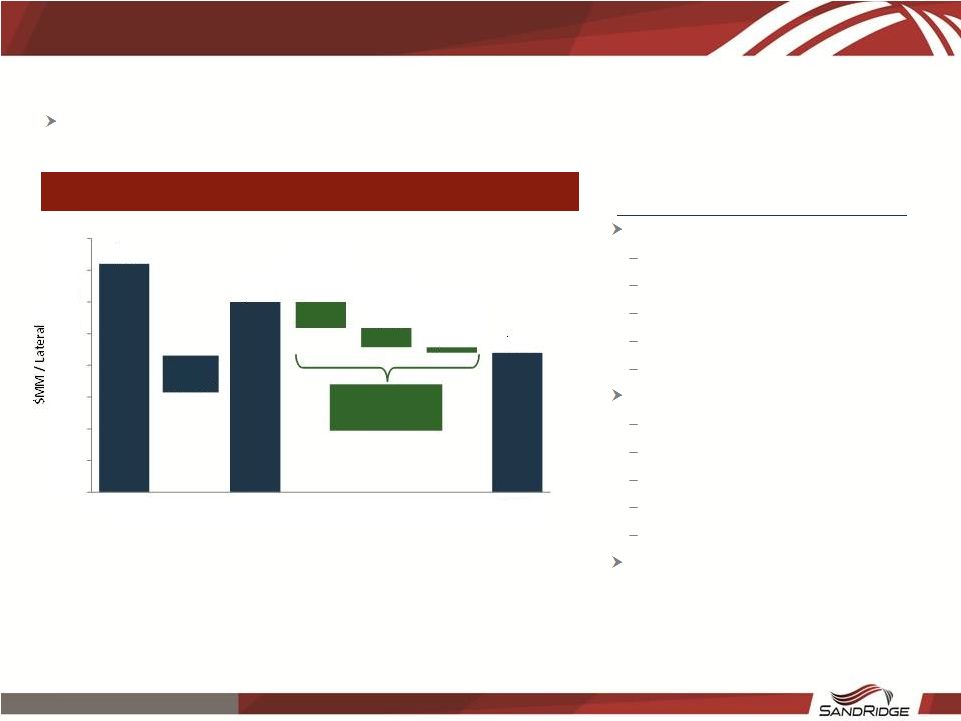 Sustainable Well Cost Reductions
Realized Savings
$410k Efficiency Gains
Rig efficiency & cycle time improvement
Location high grading
Logistics Completion design revision Artificial lift design $305k Service Costs Drilling rig rates Liner packer system Stimulation Directional drilling ESP/Artificial lift equipment $85k – Multilateral Expansion D&C Cost Reduction Key to Preserving Competitive Returns $2.2MM per Mississippian lateral target achieved; additional $100,000 to be implemented in 1H 2016
17 SandRidgeEnergy.com $3.6 $3.0 $2.2 - $0.5 $1.0 $1.5 $2.0 $2.5 $3.0 $3.5 $4.0 2012 2014 Q4'15 17% Savings Efficiency Gains $410k Service Costs $305k Multilateral Expansion $85k 27% Savings Realized Mississippian Cost Savings |
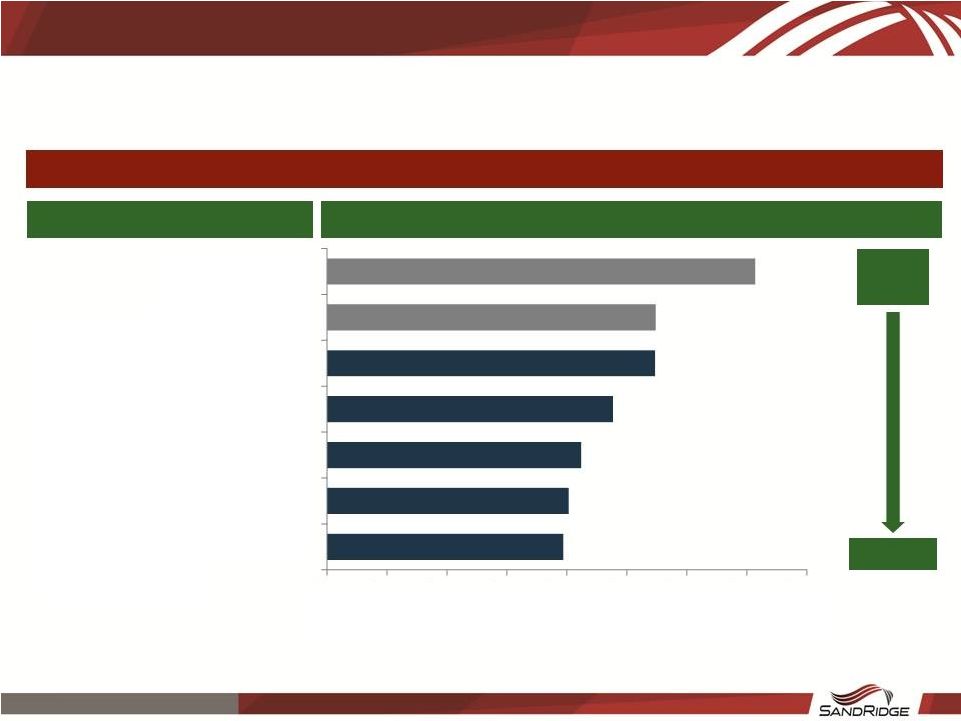 Latest well costs reduced from above $700 to ~$400 per completed lateral
foot Reduced Cost per Completed Foot
Cost / ft FSDs and Extended Laterals Reduce Average Cost per Lateral Well Name / Design 2014 Current (1) Comprised of eight laterals and reflects Q4 2015 laterals drilled and on production
18 SandRidgeEnergy.com $0 $100 $200 $300 $400 $500 $600 $700 $800 Extended Laterals @ $3.8MM Willis 2709 1-18H - (FSD 3.0) Mary Lu 2407 1-20H (FSD 3.0) Carrier 2407 1-18H - (FSD 3.0) Old Design Average - (FSD 3.5) Single @ 2.1 $MM Single @ 3.2 $MM (1) |
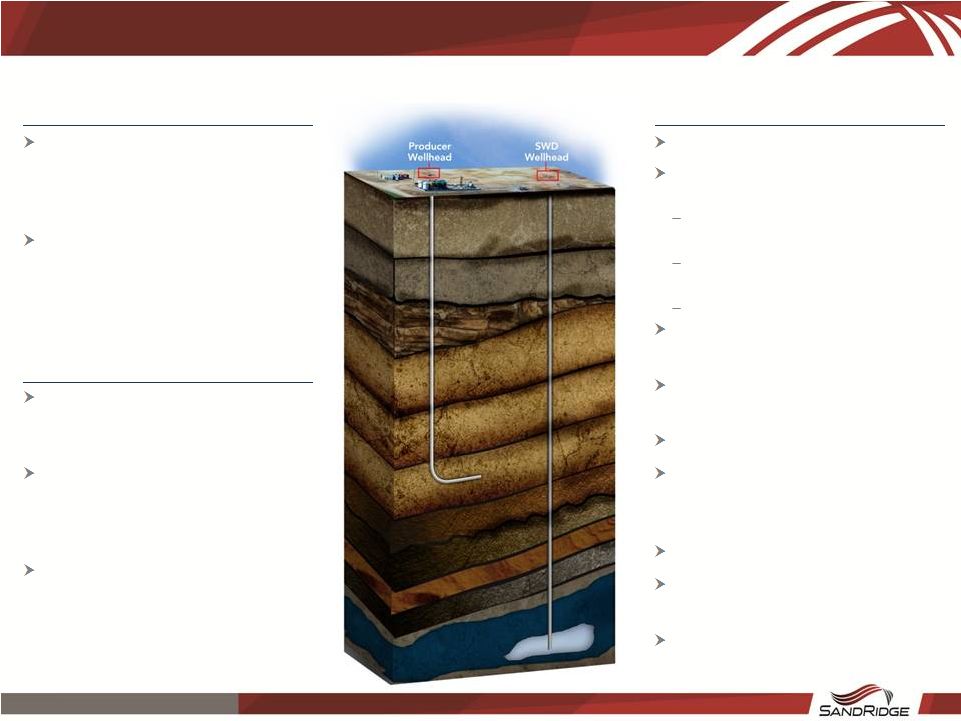 Produce Over 860k barrels of water gathered and disposed per day during January 2016 in the Mid- Continent and Permian Basin >200 SWD wells in Mid-Continent and Permian Basin Gather & Process Produced water is transported to disposal location through SD owned pipeline system Typically Polyethylene pipe (8” to 12” diameter) connected to producing wells, buried under ground Water is treated at disposal location Key Stats 99% of water piped vs trucked Average capacity of 15,000 Bblsw/d per well Low pressure pumps at most locations Various tubing sizes based on needed capacity Open hole Arbuckle completion Pressure and volume continuously monitored Produced water disposed in Arbuckle for ~80 years Frac flowback is 1% of total Core gathering system is interconnected – maximizing system flexibility 1,050 miles of installed pipelines Functionally similar to hydrocarbon gathering and processing system New assets, built since 2008 SWG Gathering System 19 SandRidgeEnergy.com |
 Core Assets North Park Basin |
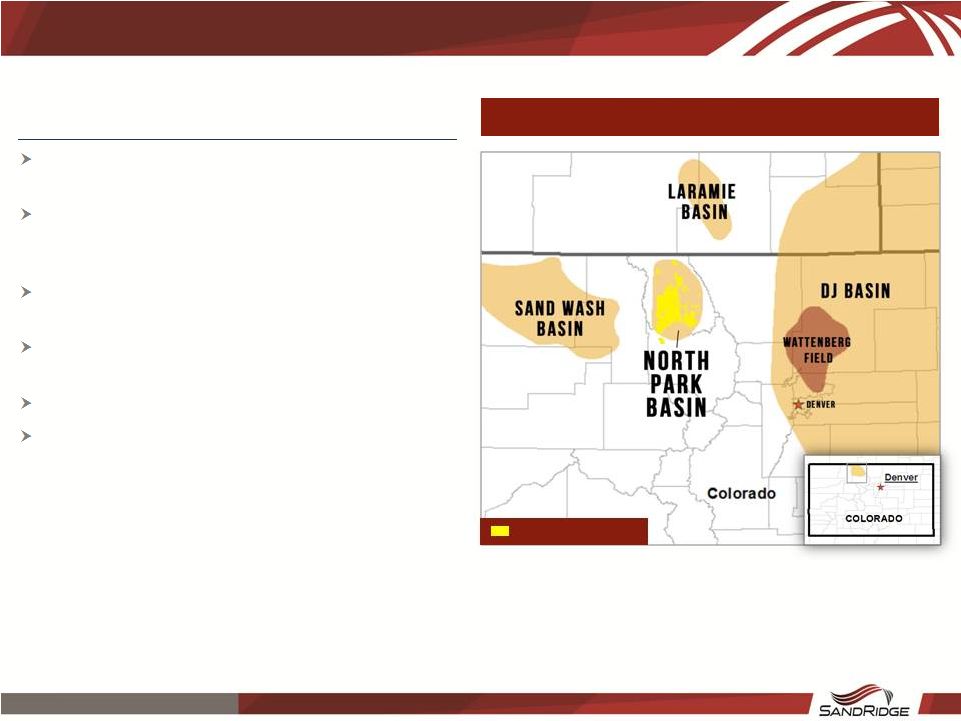 21 SandRidgeEnergy.com North Park Basin Overview 133k net acres in Jackson County, CO (53% held by production or held by Federal Unit) Stacked pay potential (Niobrara A, B, C, D, E, Frontier Sand) with over 1,300 locations identified for Niobrara D development Estimated 25 MMBoe proved reserves (82% oil) at projected year end 2015 SEC prices 1.0 MBoepd of current production from 16 horizontal wells; 13 drilling permits approved; 14 submitted 3D seismic coverage over 54 square miles 100% operated with high working interest and average royalty burden less than 17% Asset Overview North Park Acreage SandRidge Acreage |
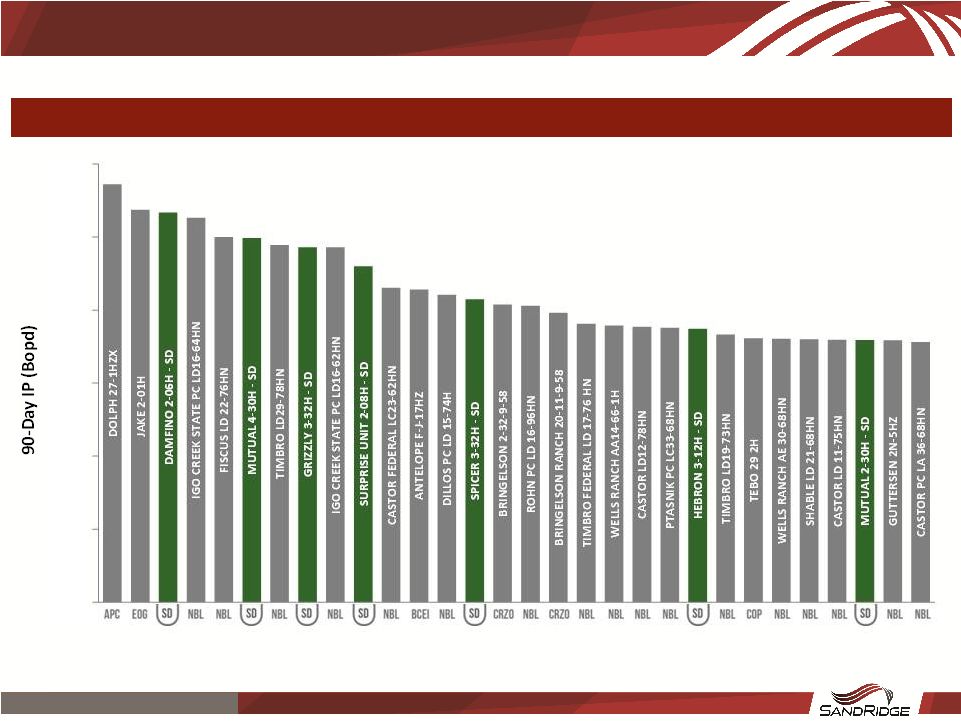 22 SandRidgeEnergy.com Note: Data sourced from IHS Competitive North Park Production Results North Park – 7 SandRidge Wells are in Top 30 of Colorado Niobrara Laterals <5,200 ft. - 100 200 300 400 500 600 |
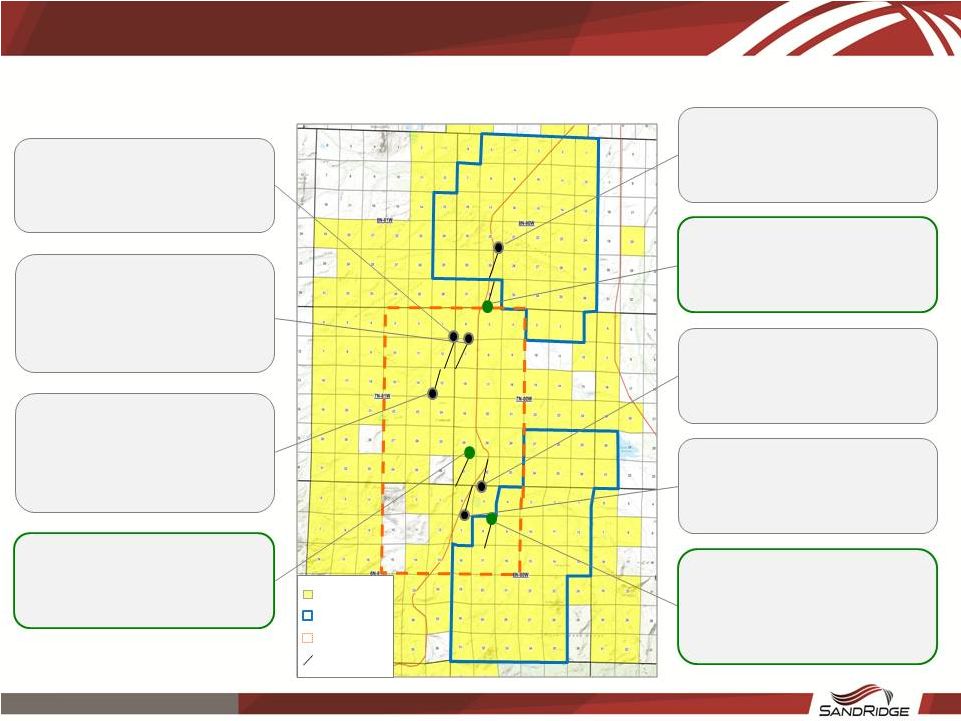 23 SandRidgeEnergy.com North Park Basin – Recent Well Results 502 Boepd Average 30-Day IP on Last 9 Wells Hebron 03-12H First Prod: Aug 2013 30-day IP: 517 Boepd Hebron 02-7H (C zone test, 41% outside targeted zone) First Prod: Oct 2013 30-day IP: 325 Boepd
Coalmont 03-13H (Poor contact with
D zone and 50% of optimal proppant)
First Prod: Aug 2013
30-day IP: 214 Boepd Mutual 04-30H
(100% contact with targeted D zone)
First Prod: Dec 2014
30-day IP: 646 Boepd
SandRidge
Acreage
Federal Units
3D Seismic Area
Wells Drilled
Peterson Ridge 01-20H
First Prod: Jan 2014 30-day IP: 359 Boepd
Grizzly 03-32H
First Prod: Sep 2014
30-day IP: 619 Boepd Spicer
03-32H First Prod:
Aug 2014 30-day IP: 572 Boepd
Damfino 02-06H (95% contact with targeted D zone) First Prod: Nov 2013 30-day IP: 729 Boepd
Surprise Unit 02-08H
(most pounds of proppant
per lat. ft)
First Prod: Jul 2015
30-day IP: 538 Boepd 200-day
IP: 450 Bopd |
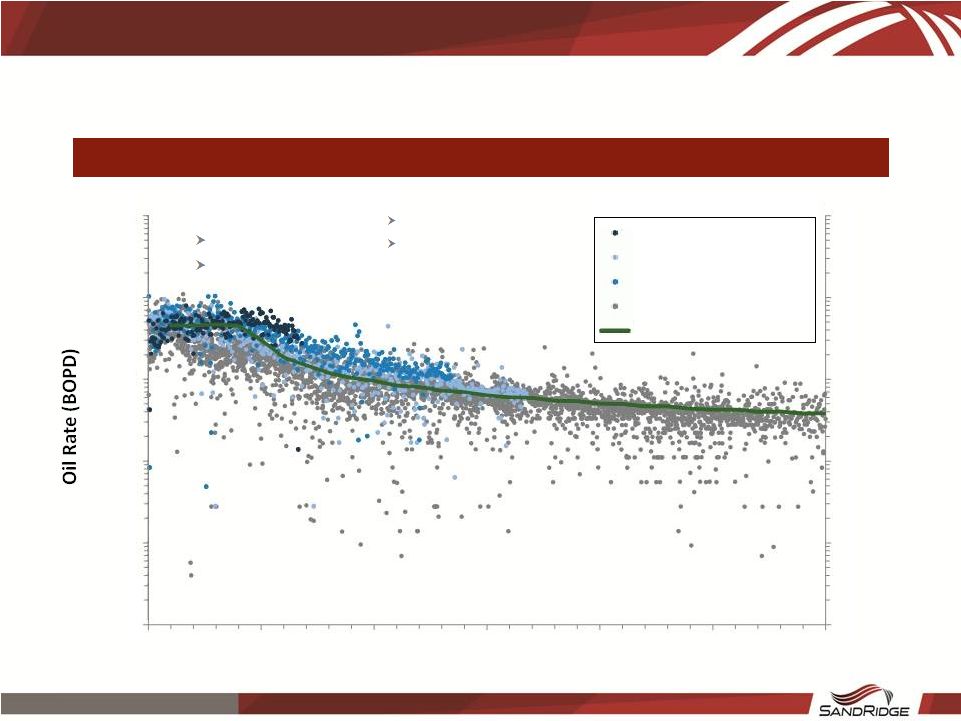 24 SandRidgeEnergy.com Prior Completed NPB Niobrara Horizontal Wells North Park Niobrara D Chalk Horizontal Well Performance 248 MBO type curve fits data which includes wells with under-stimulated completion
Type Curve Well
Selection Criteria
>600 lbs/ft of proppant
>16 Completion Stages
0 1 10 100 1,000 10,000 0 1 10 100 1,000 10,000 0 5 10 15 20 25 30 Time (months) Surprise 2-8H Grizzly 03-32H Mutual 04-30H Under-stimulated Completion 248 MBO Type Curve SD Planned Completion 1,500 lbs/ft of proppant 30 Completion Stages |
 25 SandRidgeEnergy.com NPB Niobrara Horizontal Well Type Curves North Park Niobrara D Chalk Type Curve Comparison 248 MBO type curve conservative versus wells with enhanced completion method
0 1 10 100 1,000 10,000 0 1 10 100 1,000 10,000 0 5 10 15 20 25 30 Time (months) Surprise 2-8H Grizzly 03-32H Mutual 04-30H 248 MBO Type Curve 381 MBO Type Curve Type Curve Well Selection Criteria >1,100 lbs/ft of proppant High percentage of lateral in target zone >22 Completion Stages SD Planned Completion 1,500 lbs/ft of proppant Geo-steer for 100% in target zone 30 Completion Stages |
 Other Assets |
 SandRidge owns interests in 3 Royalty Trusts which provide cash payments to SD and
public unitholders
Royalty trusts consist of mature producing properties operated by
SandRidge No capital expenditures from SandRidge are required for
the trusts’ operations All drilling obligations for the
trusts have been fulfilled as of Q1’15 SandRidge provides
operating and administrative services to the trust in exchange for a fee The three trusts are Mississippian Trust I (SDT), Mississippian Trust II (SDR), and Permian Trust (PER), of which
SandRidge owns 27%, 38%, and 25% of the outstanding units,
respectively Ownership
SDT SDR PER TOTAL SandRidge SD Subordinated - 12,431 - 12,431 (10%) SD Common 7,528 6,244 13,125 26,897 (20%) Total SD Units (000s) 7,528 (27%) 18,675 (38%) 13,125 (25%) 39,328 (30%) Common Public Units 20,472 (73%) 31,050 (62%) 39,375 (75%) 90,897 (70%) Total Units Outstanding 28,000 49,725 52,500 130,225 Unit Price (1.29.2016) $2.34 $1.78 $2.72 Market Capitalization $65,520 $88,511 $142,800 SD Implied Ownership $17,616 $33,241 $35,700 $86,557 ($ in 000s) Royalty Trusts – SDT, SDR and PER 27 SandRidgeEnergy.com |
 Appendix |
   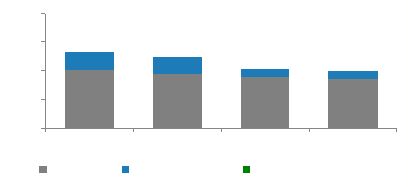 29 SandRidgeEnergy.com 2016 Consolidated Hedge Position Oil Volumes Hedged (MMBbls) Approx. $91MM in value as of 1/29/16 Strip 1Q '16 2Q '16 3Q '16 4Q '16 2016 Volumes Hedged Oil Swaps (MMBbls) 0.4 0.4 0.4 0.4 1.5 Oil 3 Way Collars (MMBbls) 0.9 0.9 0.4 0.4 2.6 Panhandle Basis (Bcf) 2.7 2.7 2.8 2.8 11.0 Hedge Avg. Prices Oil Swaps ($/Bbl) $88.4 $88.4 $88.4 $88.4 $88.4 Oil 3 Way Collars ($/Bbl) Average Short Call Price $101.4 $101.4 $99.6 $99.6 $100.9 Average Long Put Price $90.0 $90.0 $90.0 $90.0 $90.0 Average Short Put Price $83.4 $83.4 $82.5 $82.5 $83.1 Panhandle Basis ($/Mmbtu) ($0.4) ($0.4) ($0.4) ($0.4) ($0.4) Hedge Value ($MM) Oil Swaps $20.4 $18.8 $17.9 $17.3 $74.4 Oil 3 Way Collars $6.0 $6.0 $2.8 $2.8 $17.5 Panhandle Basis Swaps ($0.5) ($0.2) ($0.3) ($0.4) ($1.4) Total $25.9 $24.6 $20.4 $19.6 $90.5 0.4 0.4 0.4 0.4 0.9 0.9 0.4 0.4 - 0.5 1.0 1.5 1Q '16 2Q '16 3Q '16 4Q '16 Oil Volumes Hedged (MMBbls) Oil Swaps Oil 3 Way Collars 1.3 1.3 0.7 0.7 2.73 2.73 2.76 2.76 2.71 2.73 2.75 2.77 1Q '16 2Q '16 3Q '16 4Q '16 Panhandle Basis Volumes Hedged (Bcf) $20 $19 $18 $17 $6 $6 $3 $3 $0 $10 $20 $30 $40 1Q '16 2Q '16 3Q '16 4Q '16 Forecasted Hedge Value ($MM) Oil Swaps Oil 3 Way Collars Panhandle Basis Swaps $26 $25 $20 $20 |
 30 SandRidgeEnergy.com Summary Glossary Glossary of Select Terms and Acronyms 1P – proven reserves (proved developed reserves and proved undeveloped reserves) ESP – electric submersible pump OOIP – original oil in place 2P – equal to 1P plus probable reserves EUR – estimated ultimate recovery PUDs – proved undeveloped reserves 3P – equal to 2P plus possible reserves FSD – full section development PV-10 – PV of estimated future O&G revenues, net of estimated direct expenses, discounted at 10% annual BO – barrel of oil HBP – held by production PVI – Present Value Index based on cash flows discounted at 10% BOP – Blowout Preventer HBU – held by unit RR – rig release BTU – British thermal units HCPV – hydrocarbon pore volume SD – SandRidge Bblsw/d – barrels of water per day IP
– initial production STACK – Sooner Trend, Anadarko, Canadian, Kingfisher (Counties) CBP – Central Basin Platform (Permian) LOE – lease operating expenses STAG – Sooner Trend, Anadarko, Garfield (Counties) CF – cubic feet NMA – net mineral acres SWG – saltwater gathering system D&C – drilling and completion OCC – Oklahoma Corporation Commission WTI
– West Texas Intermediate Note: With respect to units of measurement (e.g., BO, BTU, CF), the following conventions apply:
Prefix M or MM = one thousand (M), one million (MM)
Suffix E = equivalent Suffix PD (or /d) = per day |
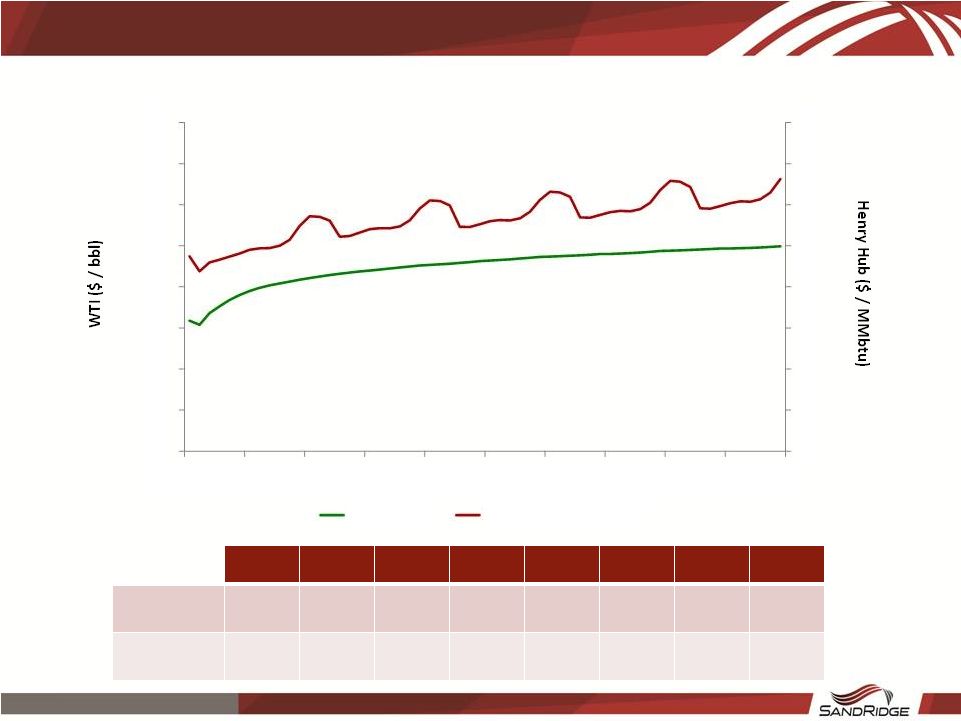 January 29, 2016 Strip
Q1 ’16 Q2 ’16 Q3 ’16 Q4 ’16 2017 2018 2019 2020 WTI ($ / bbl) $32.05 $36.69 $39.70 $41.29 $43.79 $46.30 $48.00 $49.32 Henry Hub ($ / Mmbtu) $2.29 $2.37 $2.46 $2.61 $2.75 $2.88 $2.99 $3.11 $0.00 $0.50 $1.00 $1.50 $2.00 $2.50 $3.00 $3.50 $4.00 $0.00 $10.00 $20.00 $30.00 $40.00 $50.00 $60.00 $70.00 $80.00 Jan-16 Jul-16 Jan-17 Jul-17 Jan-18 Jul-18 Jan-19 Jul-19 Jan-20 Jul-20 WTI ($ / bbl) Henry Hub ($ / MMbtu) 31 SandRidgeEnergy.com |
 SandRidge Energy, Inc.
Business Plan Overview
May 2016 |
 33 SandRidgeEnergy.com Disclaimer This presentation regarding SandRidge Energy, Inc. and its subsidiaries (“SD” or the “Company”) has been prepared solely for informational purposes using certain Company information and publicly available information. Neither the Company nor any of its advisors or representatives makes any representation or warranty, express or implied, as to the accuracy or completeness of the information in this presentation, and nothing contained herein is, or should be relied on as, a promise or representation, whether as to the past or the future. The presentation includes certain statements, estimates, and projections with respect to, among other things, the anticipated operating performance of the Company, which are inherently subject to significant economic, competitive, and other uncertainties and contingencies and have been included solely for illustrative purposes. This presentation speaks as of the date on which it is made. Neither the delivery of this presentation nor any further discussions with the Company or any of its advisors or representatives shall, under any circumstances, create any implication that there has been no change in the affairs of the Company since that date. Neither the Company nor any of its advisors or representatives undertakes any duty to update or to correct this presentation. This presentation is not intended to furnish regulatory, tax, accounting, investment, restructuring, or any other advice to any recipient. This presentation has been prepared without taking into account individual investment objectives, financial situation, or needs of any particular person. The statements and information contained in this presentation that are not statements of historical fact, including any estimates and assumptions contained herein, are "forward looking statements" as defined in Section 27A of the Securities Act of 1933, as amended, and Section 21E of the Securities Exchange Act of 1934, as amended. These statements are qualified in their entirety by the "Risk Factors," "Management's Discussion and Analysis of Financial Condition and Results of Operations," and all other applicable sections of the Company's 2014 annual report on Form 10-K filed with the Securities and Exchange Commission and subsequently filed quarterly reports on Form 10-Q. |
 (1) D&C costs exclude infrastructure costs associated with tie-in of wells
Key Assumptions 34 SandRidgeEnergy.com 2016 2017 2018 2019 2020 Rigs / Laterals 1.3 Rigs / 32 Lat. 1.5 Rigs / 36 Lat. 2 Rigs / 48 Lat. 2 Rigs / 48 Lat. 2 Rigs / 48 Lat. Type Curve Miss 6 type curves ranging from 286 – 485 Mboe EUR / 257 – 446 boepd IP-30 Chester 219 Mboe EUR / 294 boepd IP-30 D&C Costs ($ / lat) (1) Miss $2.10MM $2.00MM $1.95MM $1.90MM $1.85MM Chester $2.85MM $2.71MM $2.64MM $2.57MM $2.51MM LOE ($ / boe) (Excludes CBP) $8.44 / boe $9.40 / boe $9.90 / boe $10.30 / boe $10.59 / boe Rigs / Laterals 1 Rigs / 22 Lat. 1.5 Rigs / 42 Lat. 3.5 Rigs / 95 Lat. 5.5 Rigs / 146 Lat. 6.0 Rigs / 157 Lat. Oil Type Curve 248 Mbo EUR / 457 bopd IP-120 D&C Costs ($ / lateral) (1) $3.76MM $3.60MM $3.55MM $3.50MM $3.45MM LOE ($ / boe) $6.04 / boe $4.00 / boe $4.00 / boe $4.00 / boe $4.00 / boe |
 (1) Represents run-rate expense G&A; actual 2016 G&A includes ~$15MM of severance and other non-recurring costs including Jan and Feb payroll prior to RIF (2) Includes workovers, capitalized G&A, midstream & infrastructure, general corporate and other capex items not associated with drilling and completion; excludes capitalized interest (3) Gas differential represents a percent discount to Henry Hub (4) Pipeline is expected to come online mid-2019 Key Assumptions (cont’d) 2016 2017 2018 2019 2020 G&A $100MM (1) $80MM $80MM $80MM $80MM Non-D&C Capex (2) $136MM $105MM $95MM $107MM $100MM Price Deck (5/3/16 Strip) Oil $41.11 $47.29 $48.79 $50.26 $51.66 Gas $2.32 $2.98 $3.02 $3.03 $3.11 MidCon (Anadarko / CBP) WTI ($3.67) / ($4.00) ($3.68) / ($4.00) ($3.66) / ($4.00) ($3.65) / ($4.00) ($3.64) / ($4.00) Henry Hub ($0.23) / ($0.83) ($0.25) / ($0.66) ($0.30) / ($0.66) ($0.24) / ($0.67) ($0.21) / ($0.68) NPB (3) WTI ($8.64) ($8.64) ($8.64) ($7.35) (4) ($6.34) Henry Hub NA (66%) (66%) (66%) (66%) 35 SandRidgeEnergy.com |
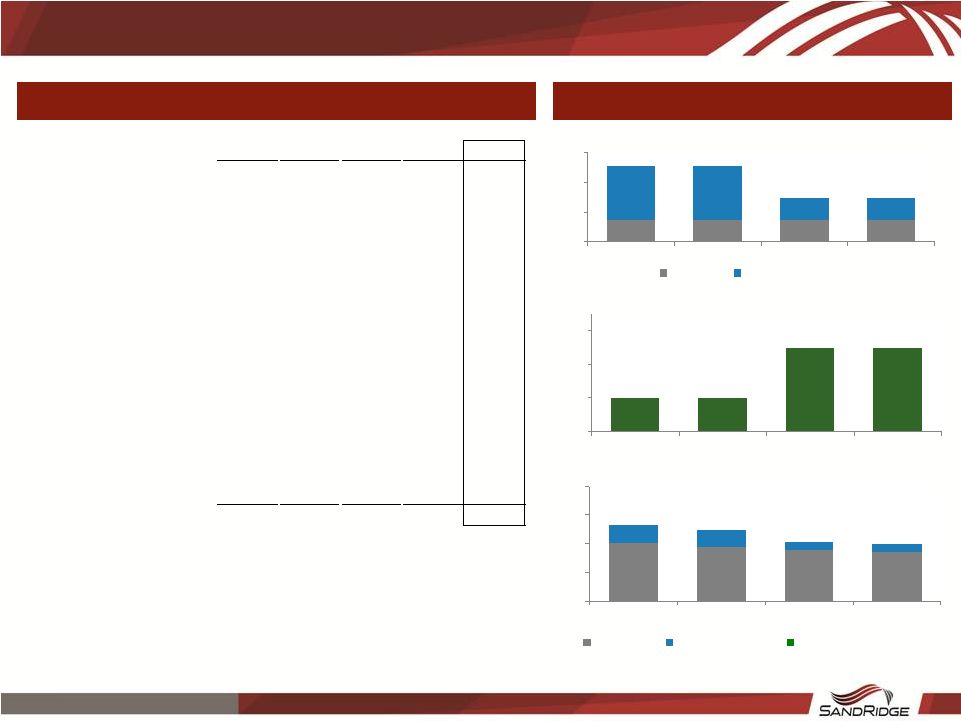
 2016 2017 2018 2019 2020 Q1 Q2 Q3 Q4 FY Q1 Q2 Q3 Q4 FY FY FY FY Oil Production (MMBbls) 1.8 1.7 1.6 1.6 6.6 1.5 1.6 1.6 1.7 6.5 9.0 13.3 17.1 NGL Production (MMBbls) 1.1 0.9 0.9 0.8 3.7 0.8 0.8 0.8 0.8 3.2 3.5 3.8 4.2 Gas Production (Bcf) 17.4 15.3 14.4 13.4 60.6 13.0 12.7 12.5 12.7 51.0 50.4 51.5 53.0 Total Production (MMBoe) 5.8 5.2 4.9 4.6 20.4 4.5 4.5 4.5 4.6 18.1 20.9 25.7 30.2 % Liquids 49.6% 50.3% 50.8% 51.6% 50.5% 51.9% 52.8% 53.5% 54.6% 53.2% 59.8% 66.6% 70.7% Daily Production (Mboepd) 63.2 56.6 53.0 50.3 55.7 50.1 49.4 48.8 50.5 49.7 57.2 70.4 82.5 Total Revenue $122 $131 $129 $131 $513 $117 $114 $115 $121 $467 $571 $774 $983 Less: LOE (50) (47) (46) (46) (190) (42) (42) (42) (42) (169) (176) (196) (215) Less: Production Taxes (2) (3) (3) (3) (12) (3) (4) (4) (4) (15) (24) (37) (46) Less: Midstream & Marketing (5) (6) (6) (6) (21) (6) (6) (6) (6) (22) (22) (22) (22) Less: G&A (1) (28) (23) (23) (23) (99) (19) (19) (19) (19) (78) (79) (80) (80) Less: Other (9) (9) (10) (10) (38) (10) (10) (10) (10) (39) (36) (34) (31) Adjusted EBITDA $28 $42 $41 $43 $153 $36 $33 $34 $40 $144 $234 $406 $589 Less: MidCon D&C Capex (31) (20) (11) (11) (73) (9) (8) (15) (22) (54) (75) (73) (71) Less: Rockies D&C Capex (10) (23) (21) (22) (75) (25) (28) (34) (51) (139) (310) (490) (538) Less: Non-D&C Capex (2) (36) (35) (33) (31) (136) (26) (26) (27) (27) (105) (95) (107) (100) Working Capital and Other (3) (54) (17) (4) (4) (80) (11) (5) (5) (5) (26) (21) (17) (11) Unlevered Cash Flow ($102) ($54) ($28) ($26) ($211) ($35) ($34) ($47) ($65) ($180) ($266) ($281) ($131) (1) G&A excludes non-recurring items and long term incentive plan which is anticipated to be paid in cash in 2016
(2) Excludes capitalized interest (3) Includes (i) Working Capital, (ii) Non-recurring G&A and severance, (iii) cash P&A cost, (iv) retained WTO minimum volume
fees not included in EBITDA, (v) non-cash G&A included in
EBITDA and (vi) Other Total Company Business Plan
Projections Total Company 5 Year Forecast
36 SandRidgeEnergy.com |
 2016 2017 2018 2019 2020 Q1 Q2 Q3 Q4 FY Q1 Q2 Q3 Q4 FY FY FY FY Total Oil Production (MBbls/d) 19.1 16.6 14.8 13.5 16.0 12.7 12.1 11.5 11.2 11.9 10.8 10.1 9.6 Total NGL Production (MBbls/d) 11.7 10.3 9.6 8.9 10.1 8.9 8.6 8.3 8.1 8.5 7.9 7.5 7.3 Total Gas Production (MMcf/d) 191.3 168.7 156.3 145.9 165.5 144.7 139.9 134.9 132.2 137.9 127.6 121.4 117.1 Total Daily Production (MBoepd) 62.6 55.1 50.5 46.8 53.7 45.7 44.0 42.3 41.4 43.3 39.9 37.9 36.4 % Liquids 49.1% 49.0% 48.4% 48.0% 48.6% 47.3% 47.0% 46.8% 46.7% 47.0% 46.7% 46.6% 46.4% Total Revenue $86 $96 $94 $93 $369 $94 $87 $85 $86 $353 $331 $321 $319 Less: LOE (49) (46) (45) (44) (185) (40) (39) (39) (38) (156) (151) (149) (147) Less: Production / Severance Taxes (2) (3) (3) (3) (11) (3) (3) (3) (3) (12) (15) (20) (20) Less: Other (6) (9) (10) (10) (35) (10) (10) (10) (10) (39) (36) (34) (31) Field-Level EBITDA $29 $37 $37 $36 $139 $41 $36 $34 $35 $146 $128 $119 $120 Rigs 2.0 1.0 1.0 1.0 1.3 1.0 1.0 2.0 2.0 1.5 2.0 2.0 2.0 Laterals Drilled 12.0 7.0 6.0 7.0 32.0 6.0 6.0 12.0 12.0 36.0 48.0 48.0 48.0 LOE / BOE (excl CBP) $7.91 $8.25 $8.62 $9.17 $8.44 $9.24 $9.27 $9.49 $9.63 $9.40 $9.90 $10.30 $10.59 MidCon Business Plan Projections MidCon 5 Year Projection 37 SandRidgeEnergy.com |
 2016 2017 2018 2019 2020 Q1 Q2 Q3 Q4 FY Q1 Q2 Q3 Q4 FY FY FY FY Total Oil Production (MBbls/d) 0.6 1.5 2.5 3.5 2.0 4.4 5.3 6.1 7.4 5.8 13.9 26.2 37.1 Total NGL Production (MBbls/d) 0.0 0.0 0.0 0.0 0.0 0.0 0.0 0.2 0.9 0.3 1.6 3.0 4.3 Total Gas Production (MMcf/d) 0.0 0.0 0.0 0.0 0.0 0.0 0.0 1.5 5.5 1.8 10.4 19.6 27.8 Daily Production (MBoepd) 0.6 1.5 2.5 3.5 2.0 4.4 5.3 6.6 9.1 6.4 17.2 32.5 46.0 % Liquids 100.0% 100.0% 100.0% 100.0% 100.0% 100.0% 100.0% 96.3% 89.9% 95.4% 89.9% 89.9% 89.9% Total Revenue $1 $5 $8 $12 $26 $15 $19 $22 $27 $83 $210 $423 $634 Less: LOE (1) (1) (1) (2) (5) (2) (3) (3) (3) (12) (25) (47) (67) Less: Production / Severance Taxes (0) (0) (0) (0) (1) (1) (1) (1) (1) (3) (8) (17) (25) Field-Level EBITDA $0 $3 $7 $10 $20 $12 $15 $18 $23 $67 $177 $359 $541 Rigs 1.0 1.0 1.0 1.0 1.0 1.0 1.0 2.0 2.0 1.5 3.5 5.5 6.0 Laterals Drilled 4.0 5.0 7.0 6.0 22.0 8.0 7.0 13.0 14.0 42.0 95.0 146.0 157.0 LOE / BOE Production $14.99 $7.57 $5.05 $4.51 $6.04 $4.00 $4.00 $4.00 $4.00 $4.00 $4.00 $4.00 $4.00 Rockies Business Plan Projections Rockies 5 Year Projection 38 SandRidgeEnergy.com |
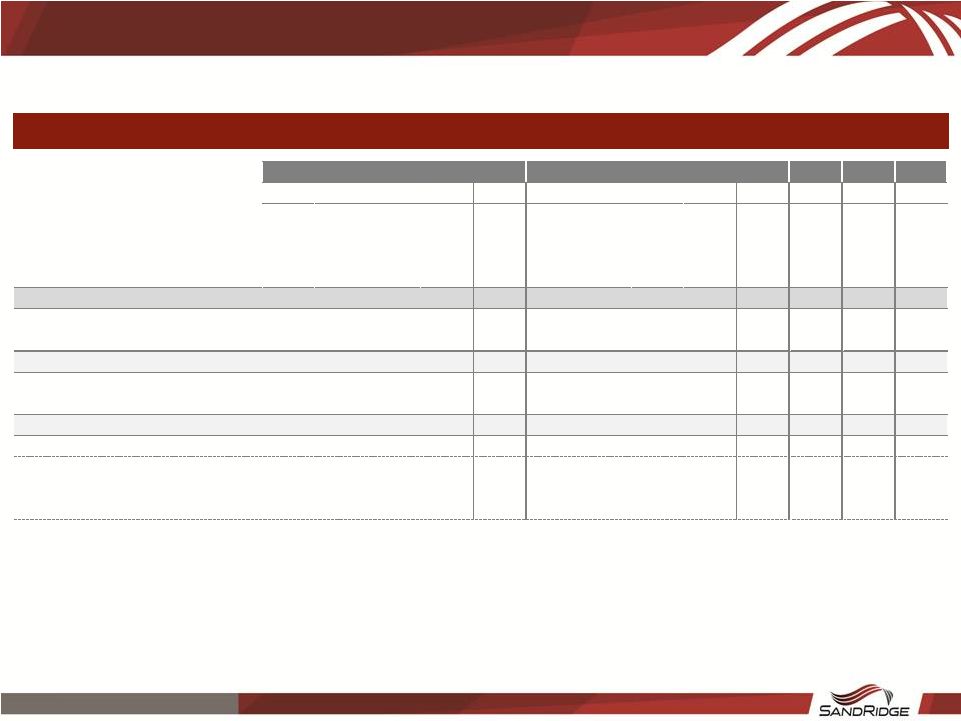
 Beginning 3P Drilling Program Ending 3P Type Curve Inventory (1) 2016 2017 2018 2019 2020 Inventory (1) Orange 207 11 15 20 20 20 121 Blue 491 12 7 8 8 8 448 Green 134 2 3 4 4 4 117 Dark Orange 65 - 1 2 2 2 58 Cyan 140 - 1 2 2 2 133 Brown 774 - 1 2 2 2 767 Subtotal Miss 1,811 25 28 38 38 38 1,644 % Total 73.6% 78.1% 77.8% 79.2% 79.2% 79.2% 73.1% Chester 545 7 8 10 10 10 500 Woodford 104 - - - - - 104 Arkoma NA - - - - - NA Subtotal 649 7 8 10 10 10 604 % Total 26.4% 21.9% 22.2% 20.8% 20.8% 20.8% 26.9% Grand Total 2,460 32 36 48 48 48 2,248 MidCon Inventory and Drilling Schedule MidCon 3P Inventory (1) 3P inventory is unrisked 39 SandRidgeEnergy.com |
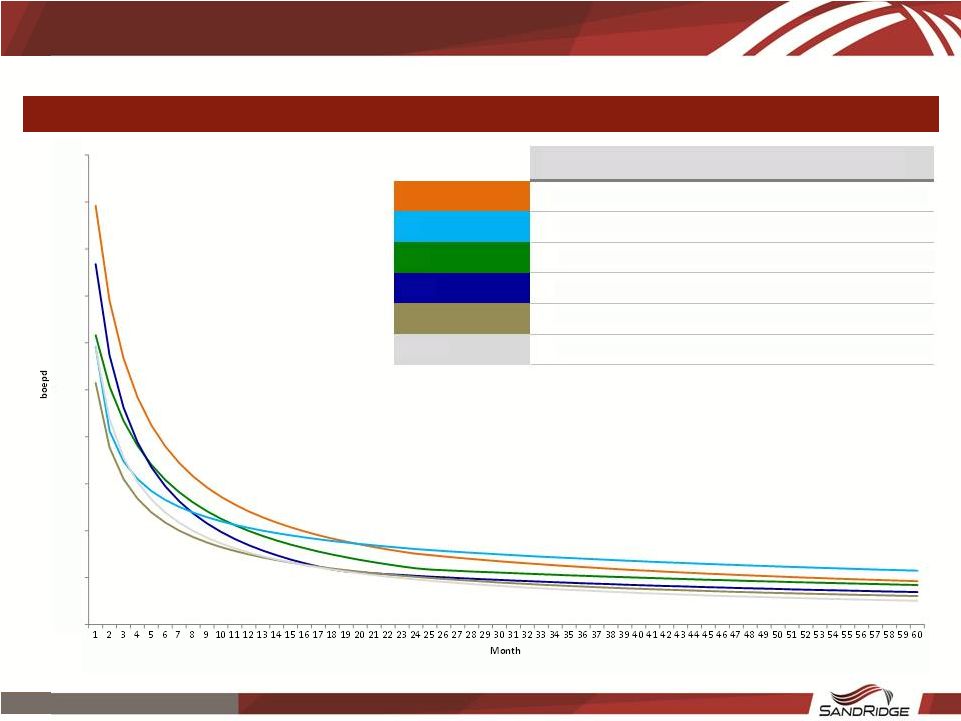 (1) Reflects well-head production unadjusted for shrinkage (2) Assumes $2.1MM/lateral cost for Miss type curves, $2.2MM/lateral for Chester type curve, and 1/29/2016 strip pricing
MidCon Type Curve Assumptions (cont’d)
MidCon Type Curves and Well-Head Economics (1) 3P IP-30 EUR IRR Inventory (boepd) (Mboe) % Oil (2) Orange / Dark Orange 207 446 476 25% 27% Cyan 140 295 486 18% 18% Green 134 308 420 25% 15% Blue 491 384 327 24% 10% Brown 774 257 287 24% 6% Chester 545 294 236 58% 11% 0.0 50.0 100.0 150.0 200.0 250.0 300.0 350.0 400.0 450.0 500.0 40 SandRidgeEnergy.com |
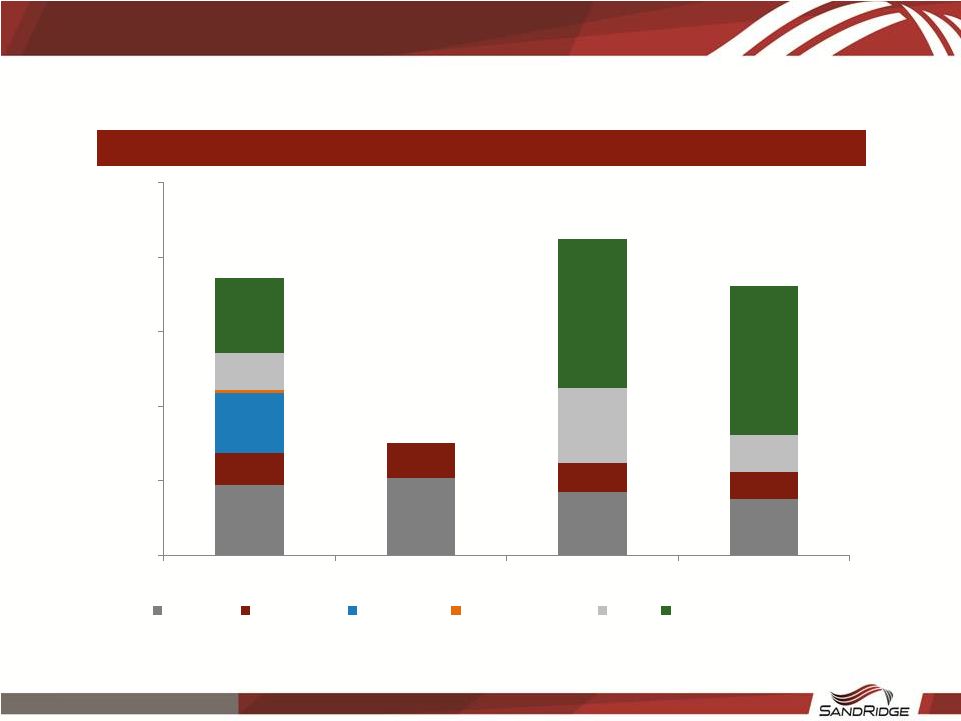 $4.7 $5.2 $4.2 $3.8 $2.2 $2.4 $2.0 $1.8 $4.0 $2.5 $5.0 $2.5 $5.0 $10.0 $10.0 $18.6 $7.6 $21.2 $18.1 - $5.0 $10.0 $15.0 $20.0 $25.0 2017 2018 2019 2020 Flowline Power Line Substation Communications SWD Central Tank Battery North Park Facilities Capex 2017 – 2020 Facilities Capital Expenditures ($MM) 41 SandRidgeEnergy.com |
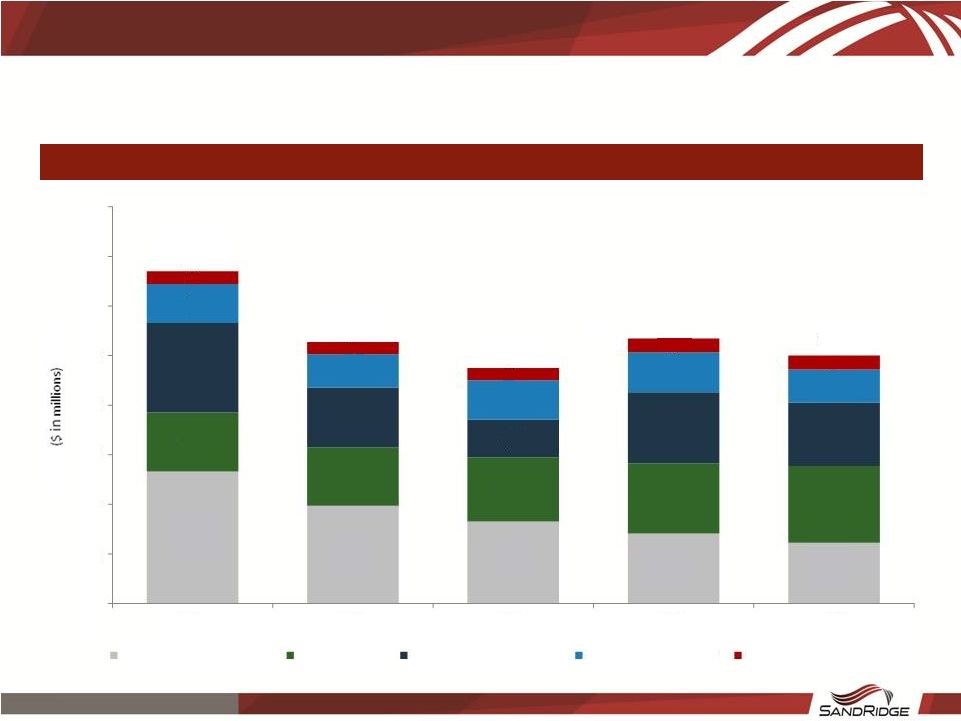 Non-D&C Capex
Detail Non-D&C Capex Forecast Detail Set forth below is the detailed break out of all non-D&C capital expenditures in the forecast
Note: Excludes capitalized interest
42 SandRidgeEnergy.com $53 $39 $33 $28 $25 $24 $24 $26 $28 $31 $36 $24 $15 $29 $26 $16 $13 $16 $16 $13 $5 $5 $5 $5 $6 $134 $105 $95 $107 $100 - $20 $40 $60 $80 $100 $120 $140 $160 2016 2017 2018 2019 2020 Workovers / Recompletions Capitalized G&A Midstream & Infrastructure Leasehold, Seismic, G&G General Corporate and Other |
 SandRidge Energy, Inc.
3P PV-10 Detail |
 Reserve Category PV-10 ($ thousands) Developed $ 990,230 Undeveloped 97,895 Miss Proved $ 1,088,125 Technical PUDs 87,215 Miss Proved + TPUDs
$ 1,175,340
Developed $ 33,370 Undeveloped - Chester Proved
$ 33,370
Technical PUDs
603 Chester Proved + TPUDs
$ 33,973
Developed $ 14,636 Undeveloped (20,460) NPB Proved $ (5,824) Technical PUDs 51,808 NPB Proved + TPUDs
$ 45,984
Total Proved $ 1,115,671 Total Proved Incl. Technical PUDs $ 1,255,297 Developed $ 9,938 Undeveloped - Woodford Proved
$ 9,938 Technical PUDs 257 Woodford Proved + TPUDs
$ 10,195
Developed $ (20,461) Undeveloped - Permian Proved
$ (20,461)
Total Proved $ 1,105,148 Total Proved Incl. Technical PUDs $ 1,245,031 Total Probables $ 882,954 Total 2P $ 2,127,985 Total Company Possible $ 81,419 Total 3P $ 2,209,404 Mississippian Chester North Park Woodford & Meramec Permian 3P PV-10 Detail (1/29/16 Strip) Note: Based on YE 2015 Reserves with 1/1/2016 Effective Date, Excluding NCI of Royalty Trusts 44 SandRidgeEnergy.com |
 Reserve Category PV-10 ($ thousands) Developed $ 1,099,474 Undeveloped 122,517 Miss Proved $ 1,221,991 Technical PUDs 116,308 Miss Proved + TPUDs
$ 1,338,299
Developed $ 38,265 Undeveloped - Chester Proved
$ 38,265
Technical PUDs
976 Chester Proved + TPUDs
$ 39,242
Developed $ 17,712 Undeveloped 33,099 NPB Proved $ 50,811 Technical PUDs 112,114 NPB Proved + TPUDs
$ 162,925
Total Proved $ 1,311,067 Total Proved Incl. Technical PUDs $ 1,540,466 Developed $ 11,474 Undeveloped - Woodford Proved
$ 11,474
Technical PUDs
429 Woodford Proved + TPUDs
$ 11,903
Developed $ (10,336) Undeveloped - Permian Proved
$ (10,336)
Total Proved $ 1,312,205 Total Proved Incl. Technical PUDs $ 1,542,033 Total Probables $ 1,373,555 Total 2P $ 2,915,588 Total Company Possible $ 179,978 Total 3P $ 3,095,565 Mississippian Chester North Park Woodford & Meramec Permian 3P PV-10 Detail (5/11/16 Strip) Note: Based on YE 2015 Reserves with 1/1/2016 Effective Date, Excluding NCI of Royalty Trusts 45 SandRidgeEnergy.com |
 April 2016 North Park Basin Update |
 Disclaimer This presentation regarding SandRidge Energy, Inc. and its subsidiaries (“SD” or the “Company”) has been prepared solely for informational purposes using certain Company information and publicly available information. Neither the Company nor any of its advisors or representatives makes any representation or warranty, express or implied, as to the accuracy or completeness of the information in this presentation, and nothing contained herein is, or should be relied on as, a promise or representation, whether as to the past or the future. The presentation includes certain statements, estimates, and projections with respect to, among other things, the anticipated operating performance of the Company, which are inherently subject to significant economic, competitive, and other uncertainties and contingencies and have been included solely for illustrative purposes. This presentation speaks as of the date on which it is made. Neither the delivery of this presentation nor any further discussions with the Company or any of its advisors or representatives shall, under any circumstances, create any implication that there has been no change in the affairs of the Company since that date. Neither the Company nor any of its advisors or representatives undertakes any duty to update or to correct this presentation. This presentation is not intended to furnish regulatory, tax, accounting, investment, restructuring, or any other advice to any recipient. This presentation has been prepared without taking into account individual investment objectives, financial situation, or needs of any particular person. The statements and information contained in this presentation that are not statements of historical fact, including any estimates and assumptions contained herein, are "forward looking statements" as defined in Section 27A of the Securities Act of 1933, as amended, and Section 21E of the Securities Exchange Act of 1934, as amended. These statements are qualified in their entirety by the "Risk Factors," "Management's Discussion and Analysis of Financial Condition and Results of Operations," and all other applicable sections of the Company's 2014 annual report on Form 10-K filed with the Securities and Exchange Commission and subsequently filed quarterly reports on Form 10-Q 47 SandRidgeEnergy.com |
 North Park Activity
Summary Update
1 st Development Well on Production Our initial well (Gregory) is cleaning up in its early flow back period,
but is tracking consistent with the type curve
Drilling Update Gregory 0780 1-9H: completed with 30+ days on production Hebron 0780 1-18HR: drilled to TD, awaiting completion Hebron 0780 2-18H: drilled to TD, awaiting completion Hebron 0780 4-7H: drilled to TD, awaiting completion Well Design & Improvements Early results illustrate benefits of enhanced stimulation methods and our ability to quickly optimize design for maximum results Eliminated use of intermediate casing (significant cost savings) Use of oil based mud resulted in significant improvements in hole stability, (increased drilling efficiency) Use of reprocessed seismic data significantly improved targeting D&C Costs Cost reductions have been realized since our initial well, with clear path to reduce costs per well to be realized ahead of schedule Drilling time reduced by 50% over first three wells 48 SandRidgeEnergy.com |
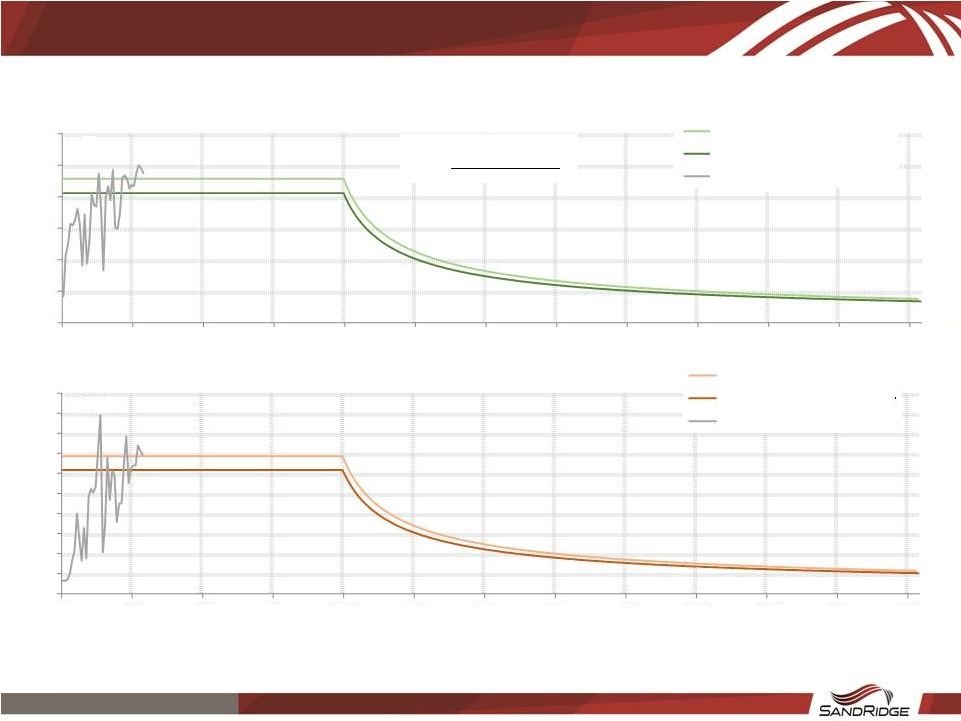 Gregory Daily Production
Gregory 0780 1-9H 30-Day IP
Rate of 550 Boepd (89% oil)
49 SandRidgeEnergy.com 0 30 60 90 120 150 180 210 240 270 300 330 360 0 30 60 90 120 150 180 210 240 270 300 330 360 100 600 500 400 300 200 100 500 450 400 350 300 250 0 200 150 50 0 Mcf/d Bbls/d Type Curve Oil Rate Risked 2016 Budget Type Curve Gregory Oil Type Curve Gas Rate Risked 2016 Budget Type Curve Gregory Gas |