Attached files
| file | filename |
|---|---|
| 8-K - 8-K - Nexeo Solutions Holdings, LLC | a2016q28k.htm |
| EX-99.1 - EXHIBIT 99.1 - Nexeo Solutions Holdings, LLC | a20160513ex991.htm |

Nexeo Quarterly Earnings Webcast Q2 – FY16 May 13, 2016 Please stand by… We will begin momentarily

Welcome to Nexeo’s Second Quarter of Fiscal Year 2016 Investor Teleconference and Webcast May 13, 2016 10:00 AM Eastern Time 9:00 AM Central Time 2
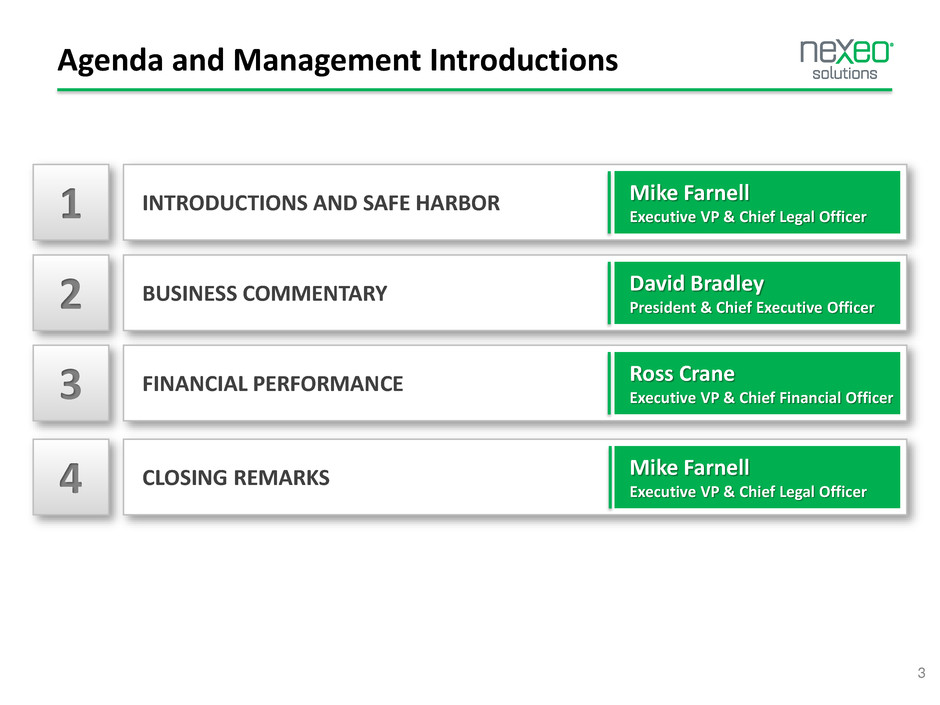
3 Agenda and Management Introductions 1 INTRODUCTIONS AND SAFE HARBOR 2 BUSINESS COMMENTARY 3 FINANCIAL PERFORMANCE 4 CLOSING REMARKS Mike Farnell Executive VP & Chief Legal Officer David Bradley President & Chief Executive Officer Ross Crane Executive VP & Chief Financial Officer Mike Farnell Executive VP & Chief Legal Officer

• This event is being streamed. It is recommended that you listen via your computer speakers. – If for any reason you are unable to stream audio, you can listen to the audio via telephone by calling: • US/Canada Attendee Backup Telephone: 877.553.3226 • International Toll Attendee Backup Telephone: 484.365.2914 • Conference ID: 10221561 • NOTE: For optimal viewing it is best to NOT use VPN, but instead connect directly to the internet. Please disable any pop-up blockers in order to view the content in its entirety. • After the live event, the link used to register for the webcast becomes the archive (recording) link. To access the recording please go to: – https://engage.vevent.com/rt/nexeojh~051316 • Send follow-up questions via e-mail: – www.nexeosolutions.com/investor-relations Welcome 4

Non-GAAP Financial Measures and Safe Harbor 5 Non-GAAP Financial Measures Certain financial measures presented herein, including EBITDA and Adjusted EBITDA, were derived based on methodologies other than in accordance with generally accepted accounting principles (GAAP). We have included these measures because we believe they are indicative of our operating performance and our ability to meet our debt service requirements and are used by investors and analysts to evaluate companies with our capital structure. As presented by us, EBITDA and Adjusted EBITDA may not be comparable to similarly titled measures reported by other companies. EBITDA and Adjusted EBITDA should be considered in addition to, not as substitutes for, financial measures presented in accordance with GAAP. For a reconciliation of EBITDA and Adjusted EBITDA to the nearest GAAP measures, see slides 17 and 18. Safe Harbor I) Forward Looking Statements: This presentation contains statements related to Nexeo Solutions Holdings LLC’s and Nexeo Solutions, LLC’s (“Nexeo” or the “Company”) future plans and expectations and, as such, includes “forward-looking statements” within the meaning of the Private Securities Litigation Reform Act of 1995, Section 27A of the Securities Act of 1933, as amended, and Section 21E of the Securities Exchange Act of 1934, as amended. Forward-looking statements are those statements that are based upon management’s current plans and expectations as opposed to historical and current facts and are often identified in this presentation by use of words including but not limited to “may,” “believe,” “will,” “project,” “expect,” “estimate,” “anticipate,” and “plan.” Although the forward-looking statements contained in this presentation reflect management’s current assumptions based upon information currently available to management and based upon that which management believes to be reasonable assumptions, the Company cannot be certain that actual results will be consistent with these forward-looking statements. Forward-looking statements necessarily involve significant known and unknown risks, assumptions and uncertainties that may cause the Company’s actual results, performance prospects and opportunities in future periods to differ materially from those expressed or implied by such forward-looking statements. These risks and uncertainties include, among other things: the Company’s ability to achieve projected cost savings; consolidation of the Company’s competitors; increased costs of products the Company purchases and its ability to pass on cost increases to its customers; disruptions to the supply of chemicals and plastics that the Company distributes or in the operations of the Company’s customers; the Company’s significant working capital requirements and the risks associated with maintaining large inventories; any disruptions to the Company’s ERP system; the Company’s ability to meet the demands of the Company’s customers on a timely basis; risks and costs related with operating as a stand-alone company; risks related to the Company’s supplier and customer contracts; risks related to the Company’s substantial indebtedness; changes in state, federal or foreign laws affecting the industries in which we operate; the Company’s ability to comply with any new and existing environmental and other laws and regulations; and general business and economic trends in the United States and other countries, including uncertainty as to changes and trends. Our future results will depend upon various other risks and uncertainties, including the risks and uncertainties discussed in the definitive proxy statement filed by WL Ross Holding Corp. with the SEC on May 9, 2016 concerning the proposed business combination, including those included in the section entitled “Risk Factors” therein, and in our Annual Report on Form 10-K and Quarterly Reports on Form 10-Q. These and other important factors may cause our actual results, performance or achievements to differ materially from any future results, performance or achievements expressed or implied by these forward-looking statements. II) Ongoing Disclosure: The Company does not intend to provide all information enclosed herein on an ongoing basis.
Business Commentary David Bradley President and Chief Executive Officer 6
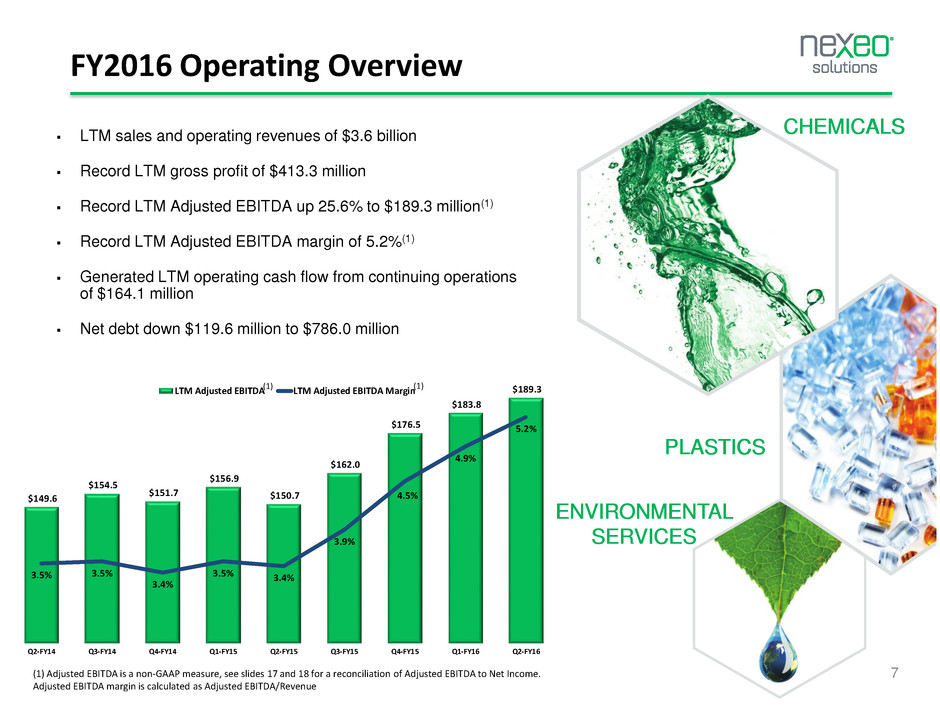
$149.6 $154.5 $151.7 $156.9 $150.7 $162.0 $176.5 $183.8 $189.3 3.5% 3.5% 3.4% 3.5% 3.4% 3.9% 4.5% 4.9% 5.2% Q2-FY14 Q3-FY14 Q4-FY14 Q1-FY15 Q2-FY15 Q3-FY15 Q4-FY15 Q1-FY16 Q2-FY16 LTM Adjusted EBITDA LTM Adjusted EBITDA Margin FY2016 Operating Overview PLASTICS CHEMICALS ENVIRONMENTAL SERVICES LTM sales and operating revenues of $3.6 billion Record LTM gross profit of $413.3 million Record LTM Adjusted EBITDA up 25.6% to $189.3 million(1) Record LTM Adjusted EBITDA margin of 5.2%(1) Generated LTM operating cash flow from continuing operations of $164.1 million Net debt down $119.6 million to $786.0 million 7(1) Adjusted EBITDA is a non-GAAP measure, see slides 17 and 18 for a reconciliation of Adjusted EBITDA to Net Income. Adjusted EBITDA margin is calculated as Adjusted EBITDA/Revenue (1) (1)

Financial Performance Ross Crane Chief Financial Officer 8
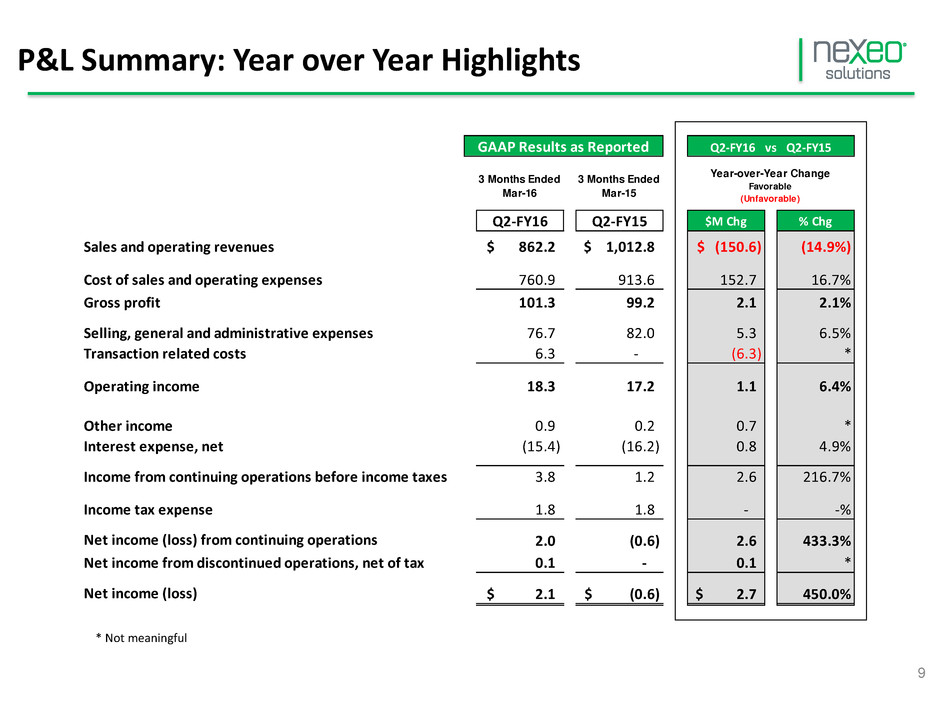
P&L Summary: Year over Year Highlights 9 * Not meaningful 3 Months Ended Mar-16 3 Months Ended Mar-15 Q2-FY16 Q2-FY15 $M Chg % Chg Sales and operating revenues 862.2$ 1,012.8$ (150.6)$ (14.9%) Cost of sales and operating expenses 760.9 913.6 152.7 16.7% Gross profit 101.3 99.2 2.1 2.1% Selling, general and administrative expenses 76.7 82.0 5.3 6.5% Transaction related costs 6.3 - (6.3) * Operating income 18.3 17.2 1.1 6.4% Other income 0.9 0.2 0.7 * Interest expense, net (15.4) (16.2) 0.8 4.9% Income from continuing operations before income taxes 3.8 1.2 2.6 216.7% Income tax expense 1.8 1.8 - -% Net income (loss) from continuing operations 2.0 (0.6) 2.6 433.3% Net income from discontinued operations, net of tax 0.1 - 0.1 * Net income (loss) 2.1$ (0.6)$ 2.7$ 450.0% Year-over-Year Change Favorable (Unfavorable) GAAP Results as Reported Q2-FY16 vs Q2-FY15

Year-over-Year LOB Revenue and Gross Profit Growth 10 -14.9% -23.4% -6.9% 4.6% 2.1% -12.9% 29.1% -8.6% Enterprise Chemicals Plastics Other Revenue Year-over-Year % Chg Gross Profit Year-over-Year % Chg

3.5% 4.8% Q2-FY15 Q2-FY16 Adjusted EBITDA Margin(1) 1.7% 2.1% Q2-FY15 Q2-FY16 Operating Income Margin 8.1% 8.9% Q2-FY15 Q2-FY16 SG&A % of Sales $35.9 $41.4 Q2-FY15 Q2-FY16 Adjusted EBITDA(1) ($ millions) $17.2 $18.3 Q2-FY15 Q2-FY16 Operating Incom ($ millions) $82.0 $76.7 Q2-FY15 Q2-FY16 SG&A ($ millions) Year-over-Year Analysis of Key P&L Metrics 11(1) Adjusted EBITDA is a non-GAAP measure. See slide 17 for a reconciliation of Adjusted EBITDA to Net Income. Calculation of Adjusted EBITDA margin is based on Adjusted EBITDA divided by Revenue. Δ +6.4% Δ +15.3% Δ +130 Bps Δ +80 Bps Δ +40 Bps Δ -6.5%
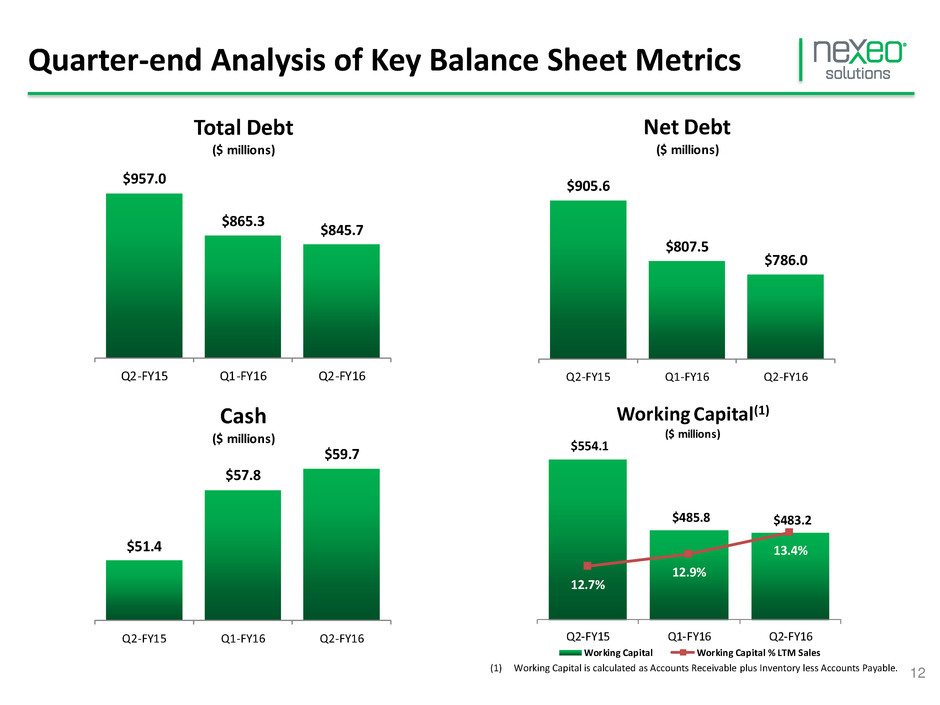
$51.4 $57.8 $59.7 Q2-FY15 Q1-FY16 Q2-FY16 Cash ($ millions) $554.1 $485.8 $483.2 12.7% 12.9% 13.4% Q2-FY15 Q1-FY16 Q2-FY16 Working Capital(1) ($ millions) Working Capital Working Capital % LTM Sales $905.6 $807.5 $786.0 Q2-FY15 Q1-FY16 Q2-FY16 Net Debt ($ millions) $957.0 $865.3 $845.7 Q2-FY15 Q1-FY16 Q2-FY16 Total Debt ($ millions) Quarter-end Analysis of Key Balance Sheet Metrics 12(1) Working Capital is calculated as Accounts Receivable plus Inventory less Accounts Payable.
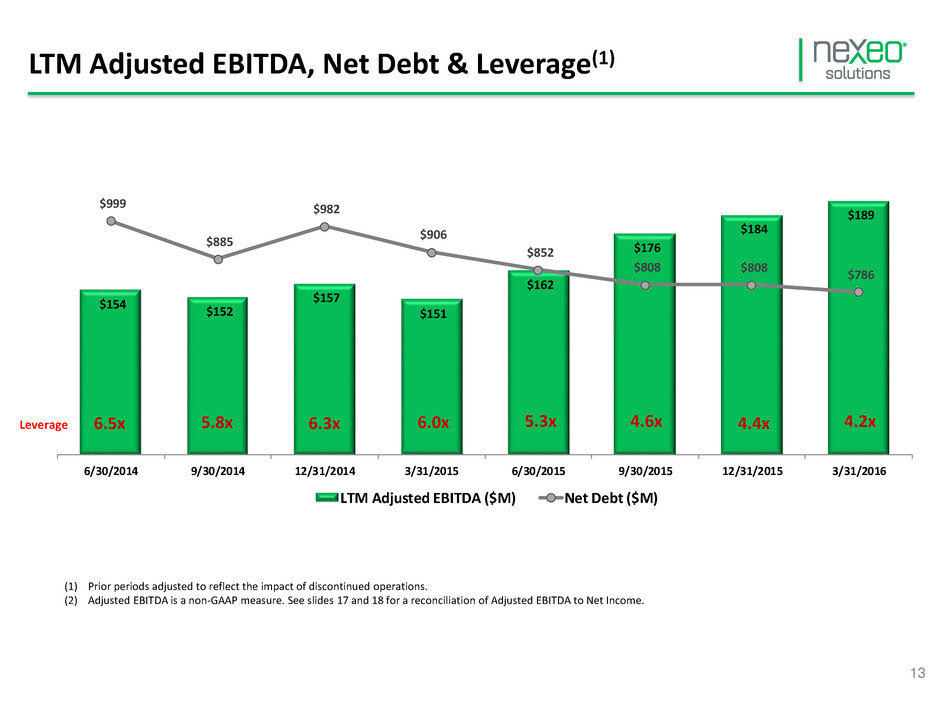
$154 $152 $157 $151 $162 $176 $184 $189 $999 $885 $982 $906 $852 $808 $808 $786 6/30/2014 9/30/2014 12/31/2014 3/31/2015 6/30/2015 9/30/2015 12/31/2015 3/31/2016 LTM Adjusted EBITDA ($M) Net Debt ($M) LTM Adjusted EBITDA, Net Debt & Leverage(1) 6.5x 5.8x 6.3x 6.0x 5.3x 13 (1) Prior periods adjusted to reflect the impact of discontinued operations. (2) Adjusted EBITDA is a non-GAAP measure. See slides 17 and 18 for a reconciliation of Adjusted EBITDA to Net Income. 4.6x 4.2x4.4xLeverage

Organizational Strategy 14

THANK YOU FOR ATTENDING. We look forward to hosting you next quarter! Closing Remarks Please feel free to contact Nexeo’s Investor Relations Personnel at: Investor.relations@nexeosolutions.com 281-297-0966 15

APPENDIX 16

Adjusted EBITDA Reconciliation 17 (1) Management adjustments associated with integration, restructuring and transformational activities. (2) Special one-time compensation incentive approved by the Compensation Committee for fiscal year 2015 performance. (3) Includes net realized and unrealized foreign exchange gains and losses. (4) Management, monitoring, consulting, reimbursable fees and leverage fees, per the agreement with TPG Capital, L.P. (5) Includes professional and transaction costs related to potential acquisitions and other one-time items. (6) Reflects certain expenses incurred to terminate activity and relationships associated with these operations. Nexeo Solutions Holdings, LLC Adjusted EBITDA Reconciliation (in millions) Q2-FY15 Q3-FY15 Q4-FY15 Q1-FY16 Q2-FY16 Net income (loss) attributable to Nexeo Solutions Holdings, LLC (0.6)$ 18.8$ 9.7$ 4.3$ 2.1$ Net (income) loss from discontinued operations - - - - (0.1) Interest expense, net 16.2 16.2 15.9 15.6 15.4 Income tax expense 1.8 1.8 1.2 1.3 1.8 Depreciation and amortization 13.5 13.1 13.1 13.6 13.8 EBITDA from continuing operations 30.9 49.9 39.9 34.8 33.0 Management add-backs (1) 4.2 2.6 2.9 1.6 1.3 FY 2015 special one-time compensation incentives (2) - - 8.9 - - Foreign exchange (gains) losses, net (3) (0.7) 0.4 1.3 0.5 (0.3) Management fees (4) 0.9 1.3 1.1 0.9 0.8 Compensation expense related to management equity plan (non-cash) 0.3 0.3 0.3 0.3 0.3 Transaction and other one-time items (5) 0.3 (0.1) - 1.0 6.3 Adjusted EBITDA from continuing operations 35.9$ 54.4$ 54.4$ 39.1$ 41.4$ Adjusted EBITDA from discontinued operations (6) (0.2) - - - - Adjusted EBITDA 35.7$ 54.4$ 54.4$ 39.1$ 41.4$

LTM Adjusted EBITDA Reconciliation 18 (1) Management adjustments associated with integration, restructuring and transformational activities. (2) Special one-time compensation incentive approved by the Compensation Committee for fiscal year 2015 performance. (3) Includes net realized and unrealized foreign exchange gains and losses. (4) Management, monitoring, consulting, reimbursable fees and leverage fees, per the agreement with TPG Capital, L.P. (5) Includes professional and transaction costs related to potential acquisitions and other one-time items. (6) Reflects certain expenses incurred to terminate activity and relationships associated with these operations. Nexeo Solutions Holdings, LLC Adjusted EBITDA Reconciliation (in millions) 12/ 31/ 2014 LT M 3/ 31/ 2015 LT M 6/ 30/ 2015 LT M 9/ 30/ 2015 LT M 12/ 31/ 2015 LT M 3/ 31/ 2016 LT M Net income attributable to Nexeo Solutions Holdings, LLC 10.3$ 8.3$ 19.8$ 20.4$ 32.2$ 34.9$ Net loss attributable to noncontrolling interest (0.4) (0.2) (0.1) - - - Net (income) loss from discontinued operations (16.1) (14.6) (12.5) 0.8 - (0.1) Interest expense, net 65.7 66.2 65.3 64.7 63.9 63.1 Income tax expense 4.1 5.0 6.0 3.9 6.1 6.1 Depreciation and amortization 54.9 54.4 53.0 52.6 53.3 53.6 EBITDA from continuing operations 118.5$ 119.1$ 131.5$ 142.4$ 155.5$ 157.6$ Management add-backs (1) 23.9 24.2 21.8 16.2 11.3 8.4 FY 2015 special one-time compensation incentives (2) - - - 8.9 8.9 8.9 Foreign exchange (gains) losses, net (3) 2.3 (0.1) 0.7 2.2 1.5 1.9 Management fees (4) 5.2 4.7 4.8 4.7 4.2 4.1 Compensation expense related to management equity plan (non-cash) 1.0 1.0 1.0 1.2 1.2 1.2 Transaction and other one-time items (5) 6.0 1.8 2.2 0.9 1.2 7.2 Adjusted EBITDA from continuing operations 156.9$ 150.7$ 162.0$ 176.5$ 183.8$ 189.3$ Adjustments associated with discontinued operations: Pretax gain on Composites Sale 15.5 15.5 15.5 - - - Adjusted EBITDA from discontinued operations (6) 3.2 1.0 (2.0) (1.0) (0.2) - Adjusted EBITDA 175.6$ 167.2$ 175.5$ 175.5$ 183.6$ 189.3$
