Attached files
| file | filename |
|---|---|
| 8-K - FORM 8-K - WABASH NATIONAL Corp | v439656_8k.htm |
Exhibit 99.1
ANNUAL SHAREHOLDERS MEETING May 12, 2016 Dick Giromini, President & CEO Wabash National Corporation
2 This presentation contains certain forward - looking statements, as defined by the Private Securities Litigation Reform Act of 1995. All statements other than historical facts are forward - looking statements, including without limit, those regarding shipment outlook, Operating EBITDA, backlog, demand level expectations, profitability and earnings capacity, margin opportunities, and potential benefits of any recent acquisitions. Any forward - looking statements are subject to certain risks and uncertainties that could cause actual results to differ materially from those implied by the forward - looking statements. Without limit, these risks and uncertainties include economic conditions, increased competition, dependence on new management, reliance on certain customers and corporate partnerships, shortages and costs of raw materials, manufacturing capacity and cost containment risks, dependence on industry trends, access to capital, acceptance of products, and government regulation. You should review and consider the various disclosures made by the Company in this presentation and in its reports to its stockholders and periodic reports on Forms 10 - K and 10 - Q. We cannot give assurance that the expectations reflected in our forward - looking statements will prove to be correct. Our actual results could differ materially from those anticipated in these forward - looking statements. All written and oral forward - looking statements attributable to us are expressly qualified in their entirety by the factors we disclose that could cause our actual results to differ materially from our expectations. S AFE H ARBOR S TATEMENT © 2016 Wabash National, L.P. All rights reserved. Wabash®, Wabash National®, DuraPlate®, DuraPlate AeroSkirt®, Walker, Brenner® and Beall® are marks owned by Wabash National, L. P. Transcraft® and Benson® are marks owned by Transcraft Corporation.
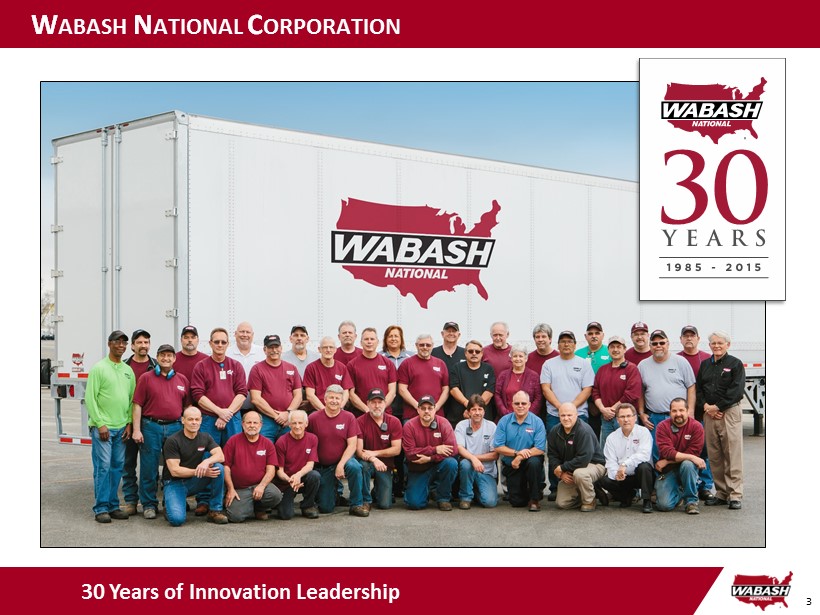
3 W ABASH N ATIONAL C ORPORATION 30 Years of Innovation Leadership
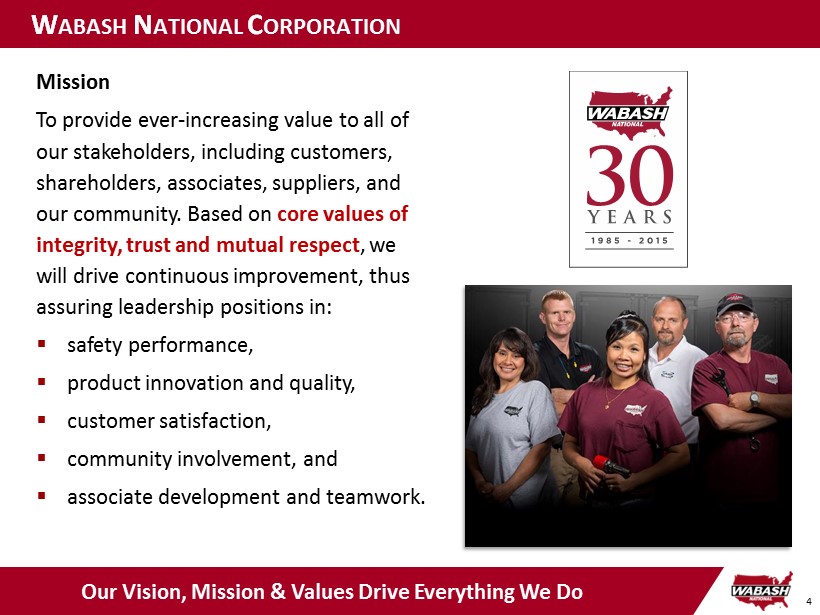
4 Mission To provide ever - increasing value to all of our stakeholders, including customers, shareholders, associates, suppliers, and our community. Based on core values of integrity, trust and mutual respect , we will drive continuous improvement, thus assuring leadership positions in: ▪ safety performance, ▪ product innovation and quality, ▪ customer satisfaction, ▪ community involvement, and ▪ associate development and teamwork. W ABASH N ATIONAL C ORPORATION Our Vision, Mission & Values Drive Everything We Do
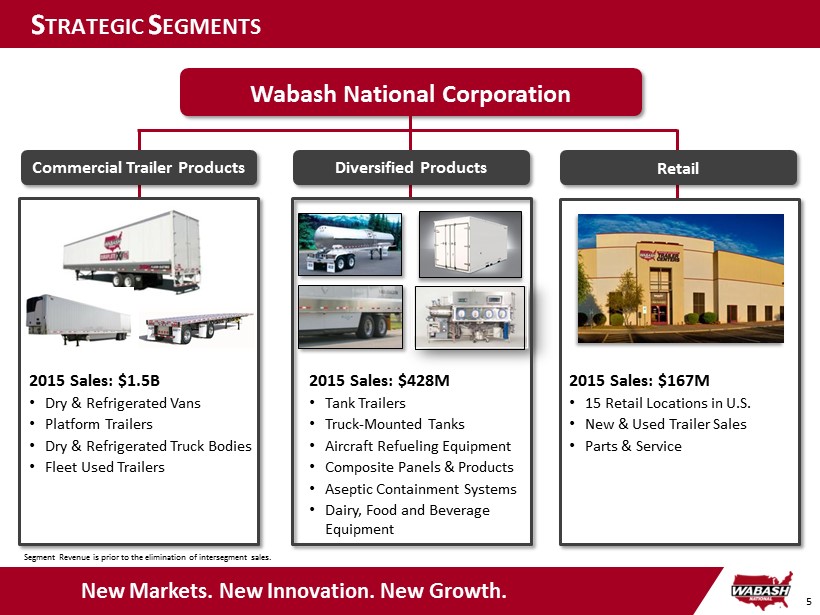
5 S TRATEGIC S EGMENTS Wabash National Corporation Commercial Trailer Products 2015 Sales: $ 1.5B • Dry & Refrigerated Vans • Platform Trailers • Dry & Refrigerated Truck Bodies • Fleet Used Trailers Diversified Products 2015 Sales: $428M • Tank Trailers • Truck - Mounted Tanks • Aircraft Refueling Equipment • Composite Panels & Products • Aseptic Containment Systems • Dairy, Food and Beverage Equipment New Markets. New Innovation. New Growth. Retail 2015 Sales: $ 167M • 15 Retail Locations in U.S. • New & Used Trailer Sales • Parts & Service Segment Revenue is prior to the elimination of intersegment sales.
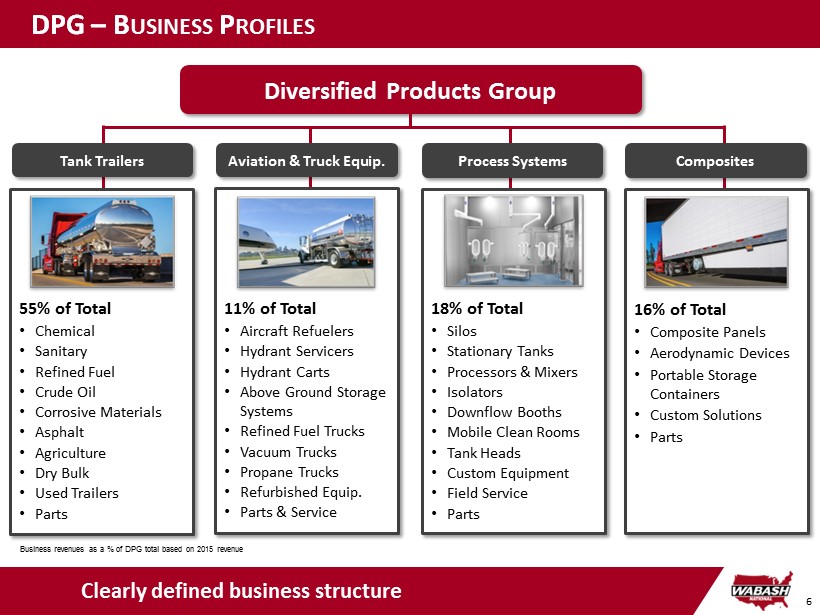
6 Clearly defined business structure DPG – B USINESS P ROFILES Diversified Products Group Tank Trailers 55% of Total • Chemical • Sanitary • Refined Fuel • Crude Oil • Corrosive Materials • Asphalt • Agriculture • Dry Bulk • Used Trailers • Parts Aviation & Truck Equip. Process Systems Composites 11% of Total • Aircraft Refuelers • Hydrant Servicers • Hydrant Carts • Above Ground Storage Systems • Refined Fuel Trucks • Vacuum Trucks • Propane Trucks • Refurbished Equip. • Parts & Service 16% of Total • Composite Panels • Aerodynamic Devices • Portable Storage Containers • Custom Solutions • Parts 18% of Total • Silos • Stationary Tanks • Processors & Mixers • Isolators • Downflow Booths • Mobile Clean Rooms • Tank Heads • Custom Equipment • Field Service • Parts Business revenues as a % of DPG total based on 2015 revenue
7 ▪ Record Revenue , Operating Income, Gross Profit and Operating EBITDA ▪ # 1 market share position among trailer manufacturers in North America ▪ Named a “50 Best U.S. Manufacturer” for third year 2015 C OMPANY H IGHLIGHTS
8 ▪ Earned ISO 14001:2004 registrations for environmental management at Cadiz , Kentucky, and San José Iturbide, Mexico, operations ▪ Raised a record $ 723,000 in community impact for the United Way 2015 C OMPANY H IGHLIGHTS
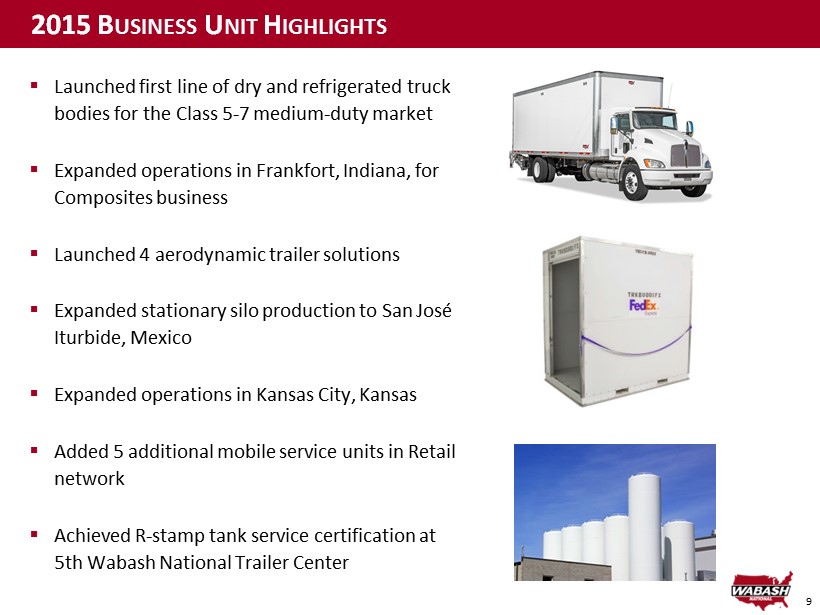
9 ▪ Launched first line of dry and refrigerated truck bodies for the Class 5 - 7 medium - duty market ▪ Expanded operations in Frankfort, Indiana, for Composites business ▪ Launched 4 aerodynamic trailer solutions ▪ Expanded stationary silo production to San José Iturbide, Mexico ▪ Expanded operations in Kansas City, Kansas ▪ Added 5 additional mobile service units in Retail network ▪ A chieved R - stamp tank service certification at 5th Wabash National Trailer Center 2015 B USINESS U NIT H IGHLIGHTS

10 S TRATEGIC P LAN G OALS & O BJECTIVES Focus on High - Margin Opportunities Diversify the Business Operational Excellence Grow the Business Objectives Goals Enhanced Shareholder Value Reduce Cyclicality Improve Profitability Drive Top - Line Growth

11 2015 S EGMENT R EVENUE AND P RODUCT M IX New Markets. New Innovation. New Growth. 2015 Consolidated Revenue: $2.0B

12 $338 $640 $1,187 $1,462 $1,636 $1,863 $2,027 $2,038 $0 $300 $600 $900 $1,200 $1,500 $1,800 $2,100 12/09 12/10 12/11 12/12 12/13 12/14 12/15 3/16 ($ millions) F INANCIAL P ERFORMANCE Trailing Twelve Month (TTM) Revenue FY 2015 Set New Records Across Multiple Metrics ($ millions) Significantly improved financial results: ▪ TTM revenue exceeds $2.0B, up approximately $1.7B since year end 2009 ▪ TTM Operating Income increases $ 267M since year end 2009 ▪ WNC Gross Margin levels reach 16% on TTM basis ▪ 2015 Financial Results – record performance in Revenue, Gross Profit, Gross Margin and Operating Income TTM Operating Income and Gross Margin
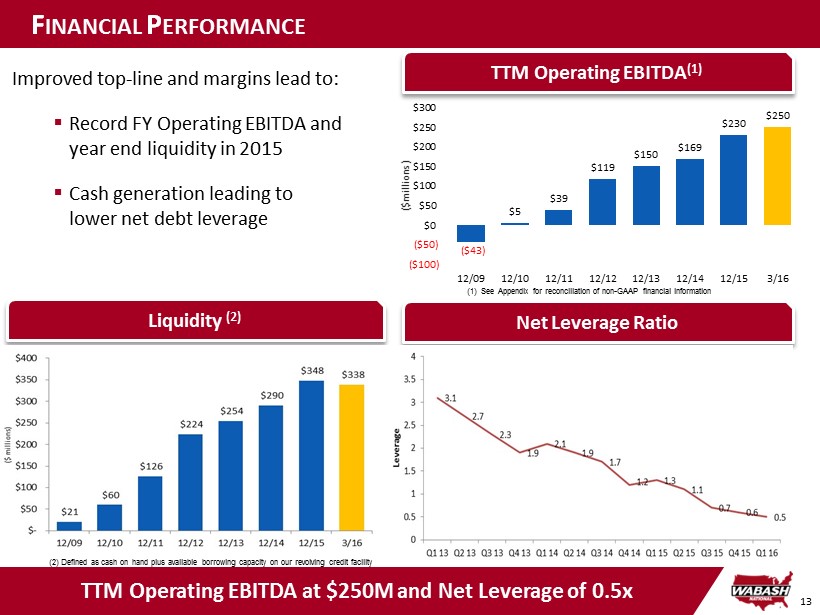
13 F INANCIAL P ERFORMANCE TTM Operating EBITDA at $ 250M and Net Leverage of 0.5x Net Leverage Ratio Improved top - line and margins lead to: ▪ Record FY Operating EBITDA and year end liquidity in 2015 ▪ Cash generation leading to lower net debt leverage ($43) $5 $39 $119 $150 $169 $230 $250 ($100) ($50) $0 $50 $100 $150 $200 $250 $300 12/09 12/10 12/11 12/12 12/13 12/14 12/15 3/16 ($millions) (1) See Appendix for reconciliation of non - GAAP financial information TTM Operating EBITDA (1) Liquidity (2) (2) Defined as cash on hand plus available borrowing capacity on our revolving credit facility
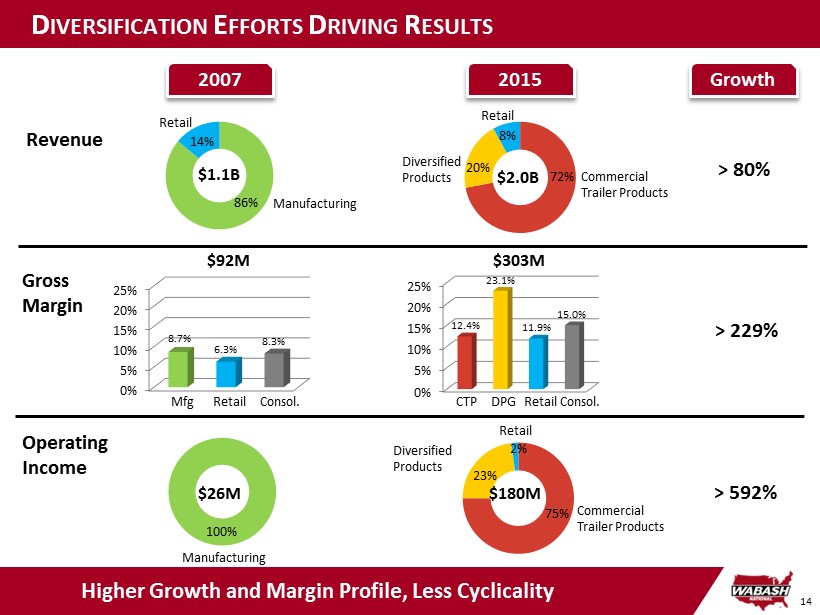
14 2007 Higher Growth and Margin Profile, Less Cyclicality 2015 D IVERSIFICATION E FFORTS D RIVING R ESULTS Revenue Manufacturing Retail 14% 86% 20% Commercial Trailer Products Diversified Products Retail 72% 8% Operating Income Manufacturing Retail Diversified Products Commercial Trailer Products 23% 2% 75% Gross Margin 0% 5% 10% 15% 20% 25% 12.4% 23.1% 11.9% 15.0% CTP Retail Consol. DPG 0% 5% 10% 15% 20% 25% 8.7% 6.3% 8.3% Mfg Retail Consol. $1.1B $2.0B $92M $303M 100% $26M $180M Growth > 80% > 229% > 592%

15 2007 2015 TTM ▪ Gross Margin 8.3 % 15.0 % 16.0% ▪ Operating Margin 2.4% 8.9 % 9.9% ▪ Earnings up 187% since 2007 ($ 0.52/ sh in ‘07. to $1.49/sh . i n ‘15) ▪ Strong free cash flow with > 100% cash conversion ▪ TTM ROIC 21.8% as of 3/31/2016 ▪ $ 338M of liquidity or 17% of revenue as of 3/31/2016 ▪ 0.5x net leverage as of 3/31/2016 ▪ Significant capacity to fund future g rowth W ABASH N ATIONAL – F INANCIAL H IGHLIGHTS New Markets. New Innovation. New Growth. Disciplined Balance Sheet Management Margin Expansion Strong Earnings, Cash Generation & ROIC Balanced Capital Allocation ▪ $66M of shares repurchased in ’15 & ‘16 and an additional $94M approved for additional repurchases in 2016 and 2017 ▪ $ 25 – $ 30M of CapEx planned for 2016 ▪ $64M committed for debt reduction in 2015 and 2016
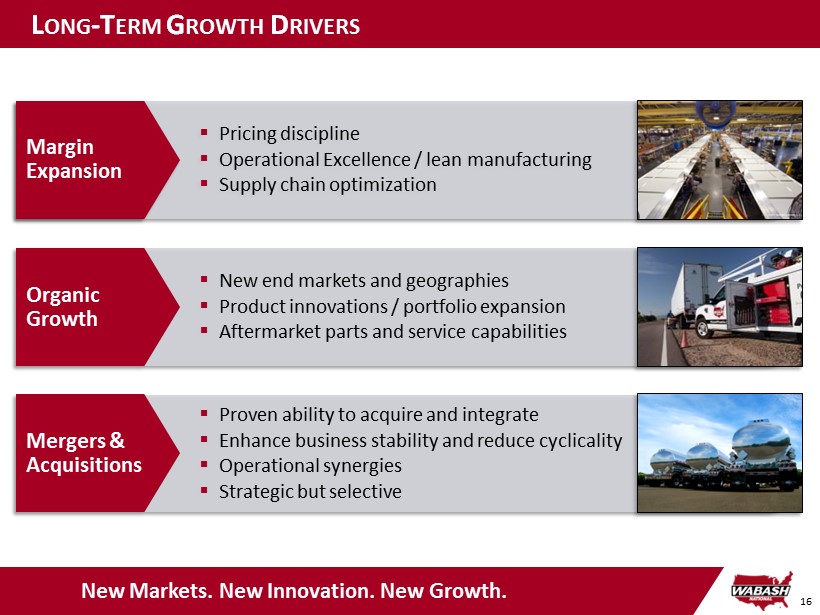
16 L ONG - T ERM G ROWTH D RIVERS ▪ Pricing discipline ▪ Operational Excellence / lean manufacturing ▪ Supply chain optimization Margin Expansion ▪ New end markets and geographies ▪ Product innovations / portfolio expansion ▪ Aftermarket p arts and s ervice capabilities Organic Growth ▪ Proven ability to acquire and integrate ▪ Enhance business stability and reduce cyclicality ▪ Operational synergies ▪ Strategic but selective Mergers & Acquisitions New Markets. New Innovation. New Growth.

17
ANNUAL SHAREHOLDERS MEETING Appendix
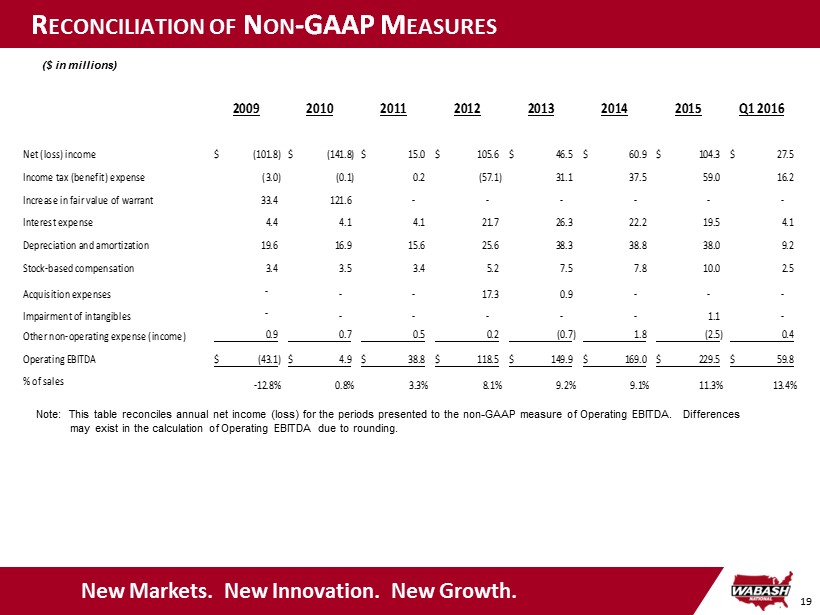
19 R ECONCILIATION OF N ON - GAAP M EASURES New Markets. New Innovation. New Growth. ($ in millions) Note: This table reconciles annual net income (loss) for the periods presented to the non - GAAP measure of Operating EBITDA. Di fferences may exist in the calculation of Operating EBITDA due to rounding. 2009 2010 2011 2012 2013 2014 2015 Q1 2016 Net (loss) income (101.8)$ (141.8)$ 15.0$ 105.6$ 46.5$ 60.9$ 104.3$ 27.5$ Income tax (benefit) expense (3.0) (0.1) 0.2 (57.1) 31.1 37.5 59.0 16.2 Increase in fair value of warrant 33.4 121.6 - - - - - - Interest expense 4.4 4.1 4.1 21.7 26.3 22.2 19.5 4.1 Depreciation and amortization 19.6 16.9 15.6 25.6 38.3 38.8 38.0 9.2 Stock-based compensation 3.4 3.5 3.4 5.2 7.5 7.8 10.0 2.5 Acquisition expenses - - - 17.3 0.9 - - - Impairment of intangibles - - - - - - 1.1 - Other non-operating expense (income) 0.9 0.7 0.5 0.2 (0.7) 1.8 (2.5) 0.4 Operating EBITDA (43.1)$ 4.9$ 38.8$ 118.5$ 149.9$ 169.0$ 229.5$ 59.8$ % of sales -12.8% 0.8% 3.3% 8.1% 9.2% 9.1% 11.3% 13.4%
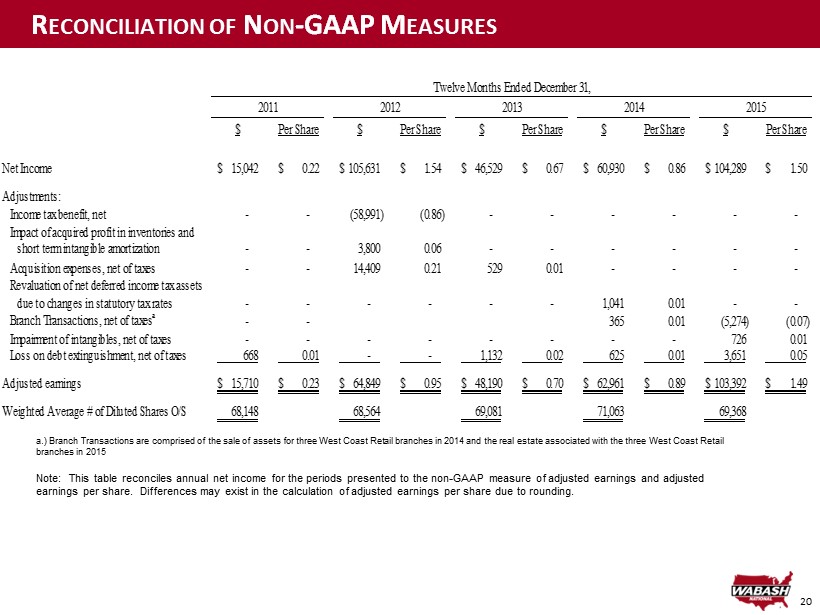
20 R ECONCILIATION OF N ON - GAAP M EASURES a.) Branch Transactions are comprised of the sale of assets for three West Coast Retail branches in 2014 and the real estate ass ociated with the three West Coast Retail branches in 2015 Note : This table reconciles annual net income for the periods presented to the non - GAAP measure of adjusted earnings and adjusted earnings per share. Differences may exist in the calculation of adjusted earnings per share due to rounding. $ Per Share $ Per Share $ Per Share $ Per Share $ Per Share Net Income 15,042$ 0.22$ 105,631$ 1.54$ 46,529$ 0.67$ 60,930$ 0.86$ 104,289$ 1.50$ Adjustments: Income tax benefit, net - - (58,991) (0.86) - - - - - - Impact of acquired profit in inventories and short term intangible amortization - - 3,800 0.06 - - - - - - Acquisition expenses, net of taxes - - 14,409 0.21 529 0.01 - - - - Revaluation of net deferred income tax assets due to changes in statutory tax rates - - - - - - 1,041 0.01 - - Branch Transactions, net of taxes a - - 365 0.01 (5,274) (0.07) Impairment of intangibles, net of taxes - - - - - - - - 726 0.01 Loss on debt extinguishment, net of taxes 668 0.01 - - 1,132 0.02 625 0.01 3,651 0.05 Adjusted earnings 15,710$ 0.23$ 64,849$ 0.95$ 48,190$ 0.70$ 62,961$ 0.89$ 103,392$ 1.49$ Weighted Average # of Diluted Shares O/S 68,148 68,564 69,081 71,063 69,368 Twelve Months Ended December 31, 2014 20152011 2012 2013
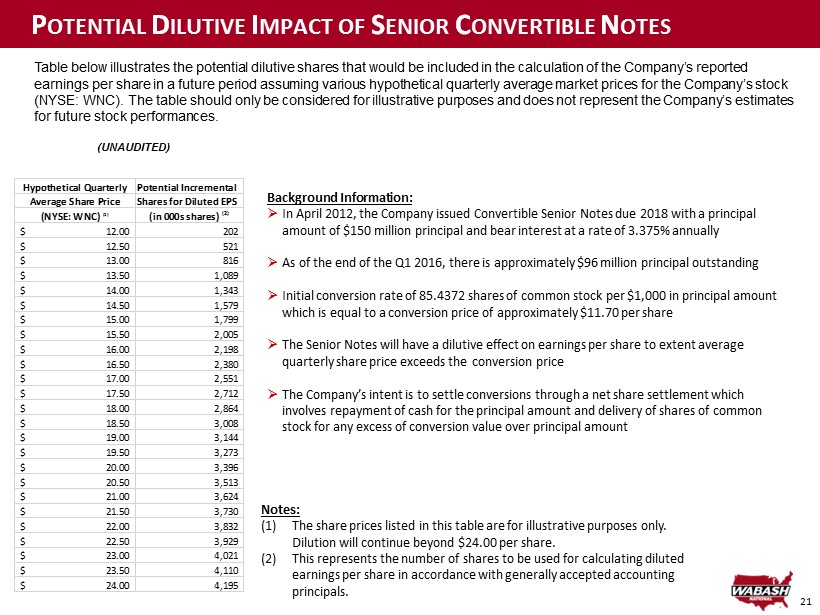
21 P OTENTIAL D ILUTIVE I MPACT OF S ENIOR C ONVERTIBLE N OTES (UNAUDITED) Table below illustrates the potential dilutive shares that would be included in the calculation of the Company’s reported earnings per share in a future period assuming various hypothetical quarterly average market prices for the Company’s stock (NYSE: WNC). The table should only be considered for illustrative purposes and does not represent the Company’s estimates for future stock performances. Notes: (1) The share prices listed in this table are for illustrative purposes only. Dilution will continue beyond $24.00 per share. (2) This represents the number of shares to be used for calculating diluted earnings per share in accordance with generally accepted accounting principals. Background Information: » In April 2012, the Company issued Convertible Senior Notes due 2018 with a principal amount of $150 million principal and bear interest at a rate of 3.375% annually » As of the end of the Q1 2016, there is approximately $96 million principal outstanding » Initial conversion rate of 85.4372 shares of common stock per $1,000 in principal amount which is equal to a conversion price of approximately $11.70 per share » The Senior Notes will have a dilutive effect on earnings per share to extent average quarterly share price exceeds the conversion price » The Company’s intent is to settle conversions through a net share settlement which involves repayment of cash for the principal amount and delivery of shares of common stock for any excess of conversion value over principal amount Hypothetical Quarterly Potential Incremental Average Share Price Shares for Diluted EPS (NYSE: WNC) (1) (in 000s shares) (2) 12.00$ 202 12.50$ 521 13.00$ 816 13.50$ 1,089 14.00$ 1,343 14.50$ 1,579 15.00$ 1,799 15.50$ 2,005 16.00$ 2,198 16.50$ 2,380 17.00$ 2,551 17.50$ 2,712 18.00$ 2,864 18.50$ 3,008 19.00$ 3,144 19.50$ 3,273 20.00$ 3,396 20.50$ 3,513 21.00$ 3,624 21.50$ 3,730 22.00$ 3,832 22.50$ 3,929 23.00$ 4,021 23.50$ 4,110 24.00$ 4,195