Attached files
| file | filename |
|---|---|
| 8-K - 8-K - Multi Packaging Solutions International Ltd | mpsx-20160512x8k.htm |
| EX-99.1 - EX-99.1 - Multi Packaging Solutions International Ltd | mpsx-20160512ex991b61523.htm |
|
|
Multi packaging Solutions Solutions that Protect and Promote the World’s Great Brands 3Q 2016 Earnings Webcast |

|
|
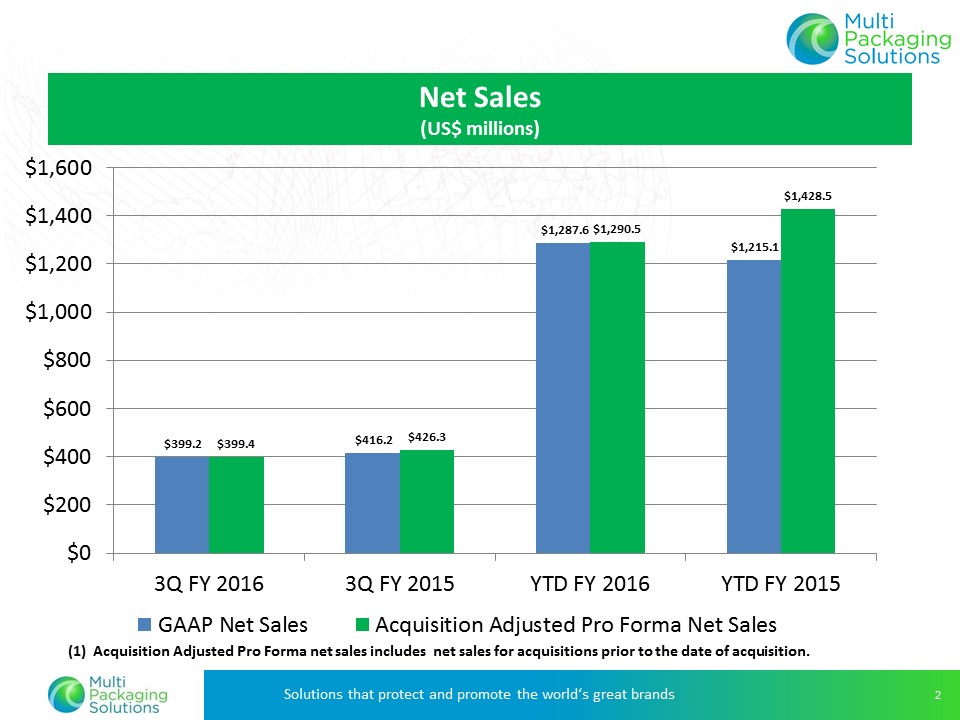
Multi packaging Solutions Solutions that protect and promote the world‘s great brands 2 $399.2 $416.2 $1,287.6 $1,215.1 $399.4 $426.3 $1,290.5 $1,428.5 $0 $200 $400 $600 $800 $1,000 $1,200 $1,400 $1,600 3Q FY 2016 3Q FY 2015 YTD FY 2016 YTD FY 2015 GAAP Net Sales Acquisition Adjusted Pro Forma Net Sales Net Sales (US$ millions) (1) Acquisition Adjusted Pro Forma net sales includes net sales for acquisitions prior to the date of acquisition. |
|
|
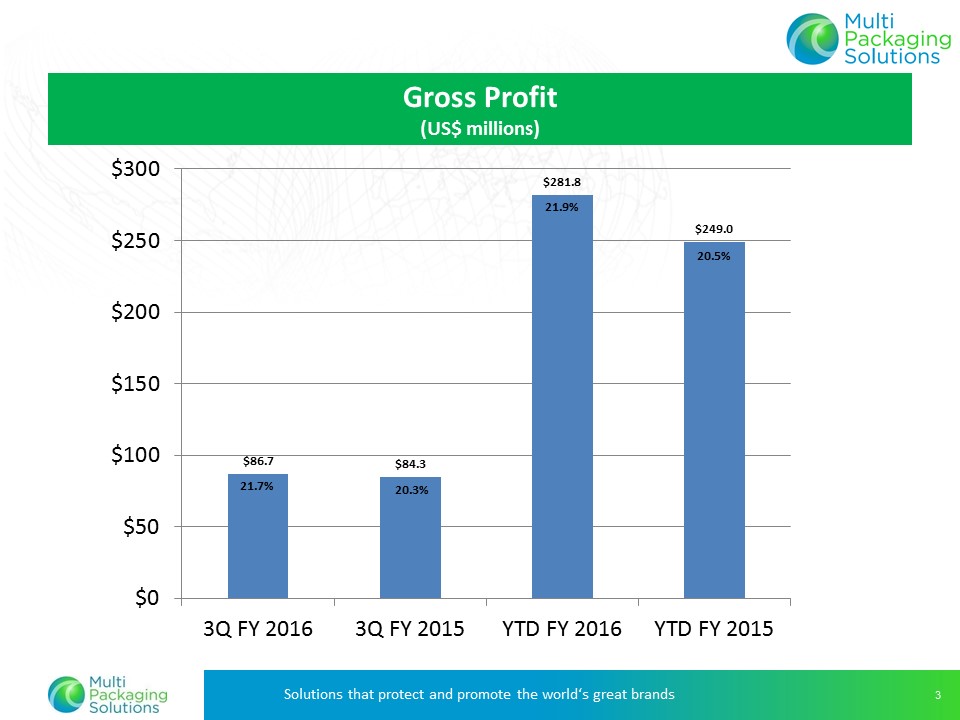
Multi packaging Solutions Solutions that protect and promote the world‘s great brands 3 Gross Profit (US$ millions) $86.7 $84.3 $281.8 $249.0 $0 $50 $100 $150 $200 $250 $300 3Q FY 2016 3Q FY 2015 YTD FY 2016 YTD FY 2015 21.7% 20.3% 21.9% 20.5% |
|
|
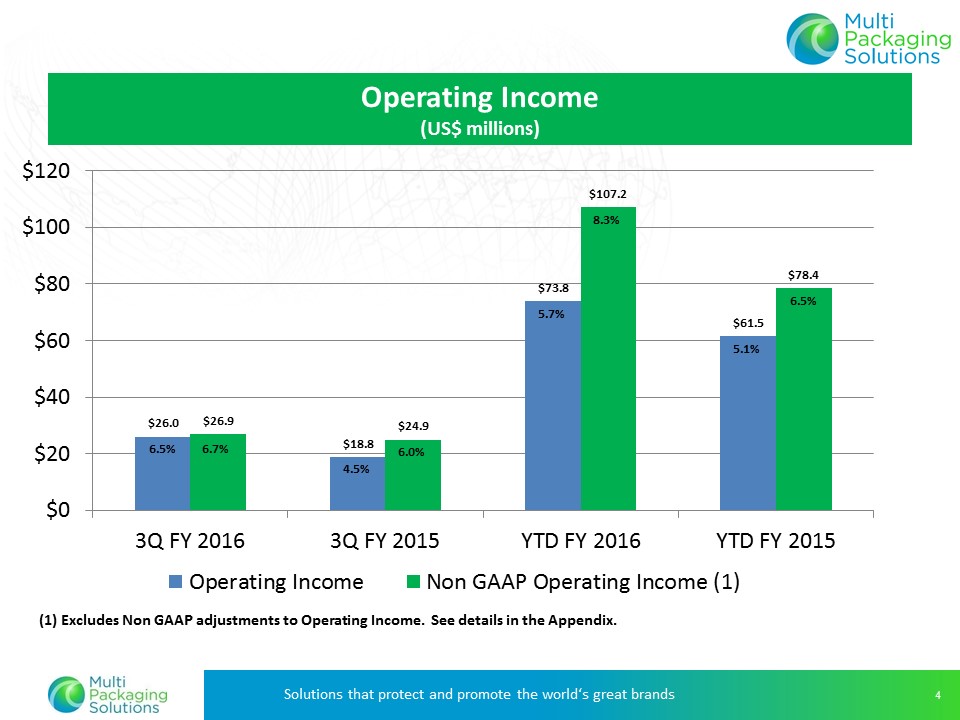
Multi packaging Solutions Solutions that protect and promote the world‘s great brands 4 $26.0 $18.8 $73.8 $61.5 $26.9 $24.9 $107.2 $78.4 $0 $20 $40 $60 $80 $100 $120 3Q FY 2016 3Q FY 2015 YTD FY 2016 YTD FY 2015 Operating Income Non GAAP Operating Income (1) (1) Excludes Non GAAP adjustments to Operating Income. See details in the Appendix. 6.5% 6.7% 4.5% 5.7% 6.0% 8.3% 6.5% 5.1% Operating Income (US$ millions) |
|
|
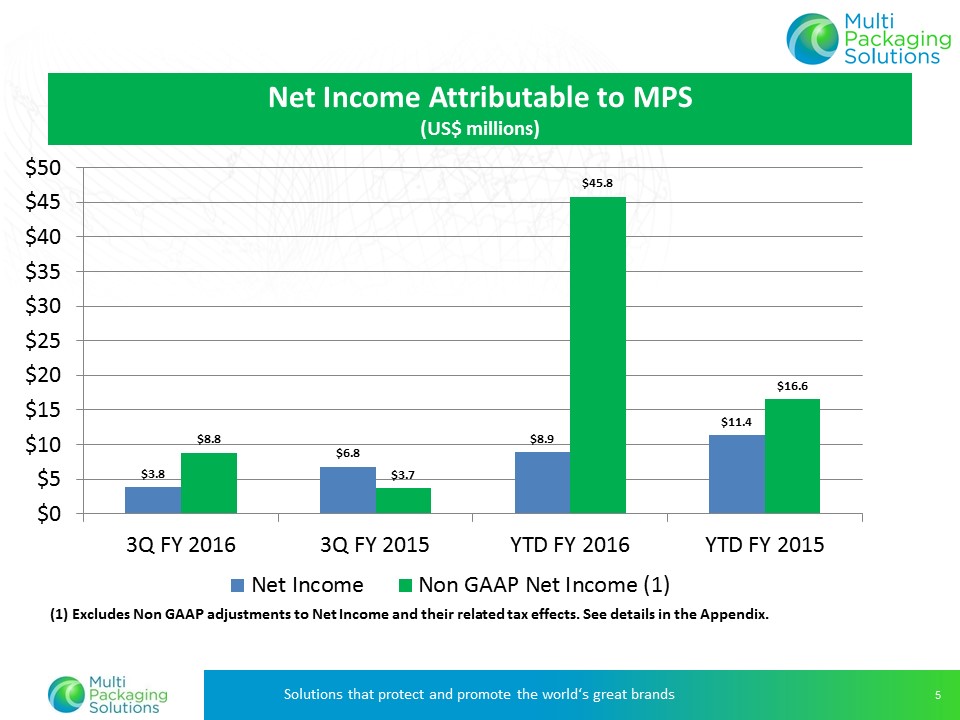
Multi packaging Solutions Solutions that protect and promote the world‘s great brands 5 $3.8 $6.8 $8.9 $11.4 $8.8 $3.7 $45.8 $16.6 $0 $5 $10 $15 $20 $25 $30 $35 $40 $45 $50 3Q FY 2016 3Q FY 2015 YTD FY 2016 YTD FY 2015 Net Income Non GAAP Net Income (1) (1) Excludes Non GAAP adjustments to Net Income and their related tax effects. See details in the Appendix. Net Income Attributable to MPS (US$ millions) |
|
|
Multi packaging Solutions Solutions that protect and promote the world‘s great brands 6 $0.05 $0.11 $0.12 $0.18 $0.11 $0.06 $0.64 $0.27 $0.00 $0.10 $0.20 $0.30 $0.40 $0.50 $0.60 $0.70 3Q FY 2016 3Q FY 2015 YTD FY 2016 YTD FY 2015 EPS Non GAAP EPS (1) (1) Excludes Non GAAP adjustments to Net Income and their related tax effects. See details in the Appendix. Diluted Net Income Per Share Attributable to MPS |

|
|
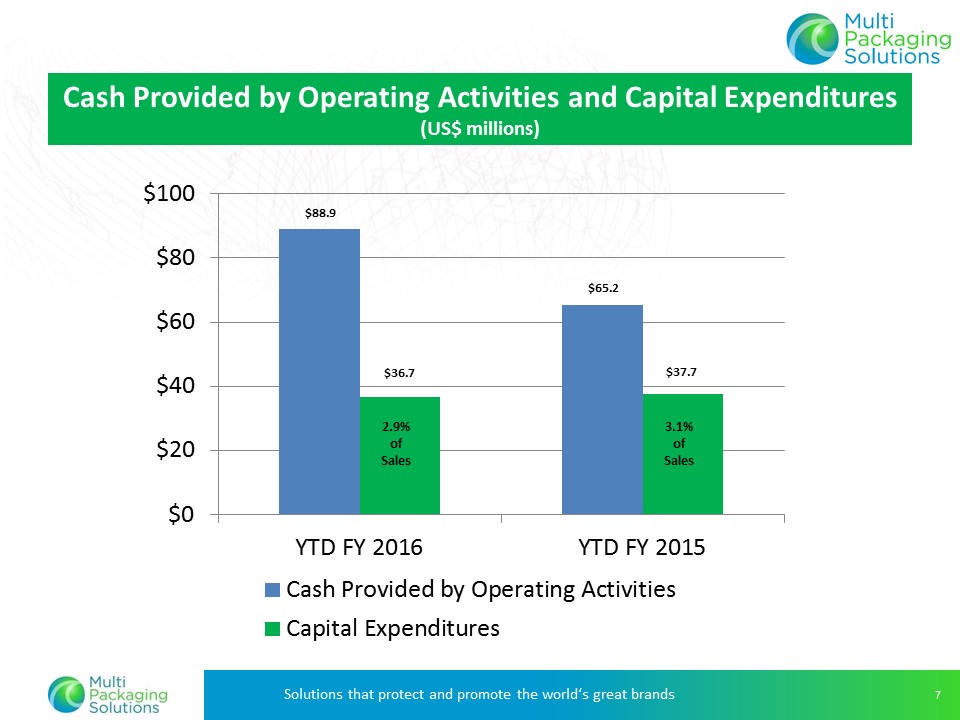
Multi packaging Solutions Solutions that protect and promote the world‘s great brands 7 $88.9 $65.2 $36.7 $37.7 $0 $20 $40 $60 $80 $100 YTD FY 2016 YTD FY 2015 Cash Provided by Operating Activities Capital Expenditures 2.9% of Sales 3.1% of Sales Cash Provided by Operating Activities and Capital Expenditures (US$ millions) |
|
|
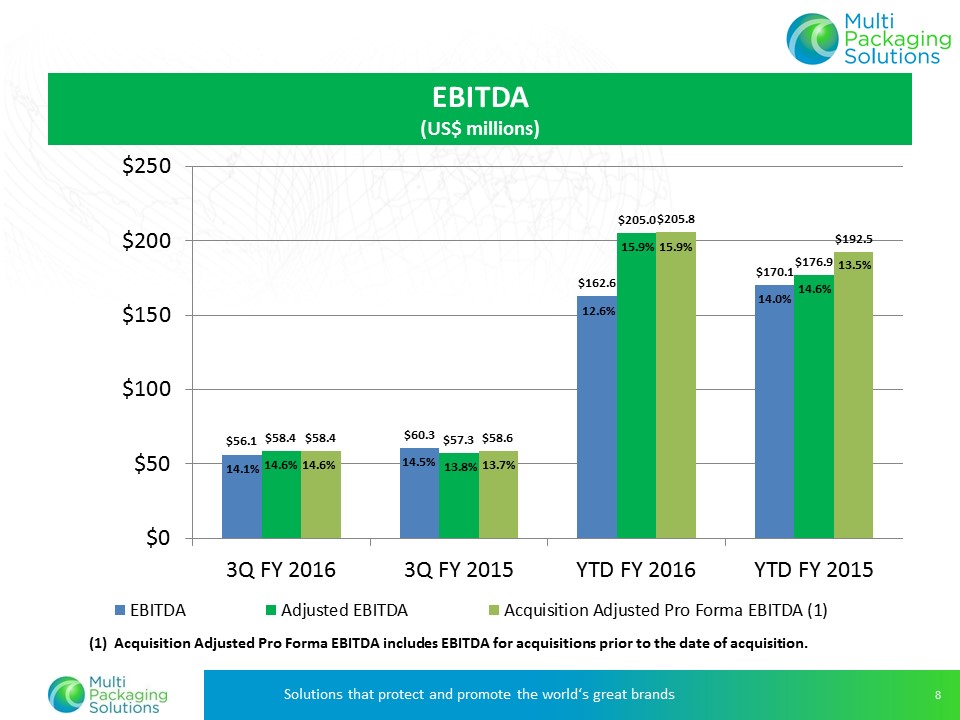
Multi packaging Solutions Solutions that protect and promote the world‘s great brands 8 $56.1 $60.3 $162.6 $170.1 $58.4 $57.3 $205.0 $176.9 $58.4 $58.6 $205.8 $192.5 $0 $50 $100 $150 $200 $250 3Q FY 2016 3Q FY 2015 YTD FY 2016 YTD FY 2015 EBITDA Adjusted EBITDA Acquisition Adjusted Pro Forma EBITDA (1) 14.5% 14.6% 13.8% 14.0% (1) Acquisition Adjusted Pro Forma EBITDA includes EBITDA for acquisitions prior to the date of acquisition. 13.5% EBITDA (US$ millions) 15.9% 12.6% 14.1% 14.6% 13.7% 15.9% 14.6% |
|
|
Multi packaging Solutions Solutions that Protect and Promote the World’s Great Brands 3Q 2016 Earnings Webcast Appendix Depreciation and Amortization Non GAAP Adjusted EBITDA to Net Income Reconciliation Non GAAP Adjusted Income Reconciliation Non GAAP Pro Forma Sales Reconciliation Debt Summary |
|
|
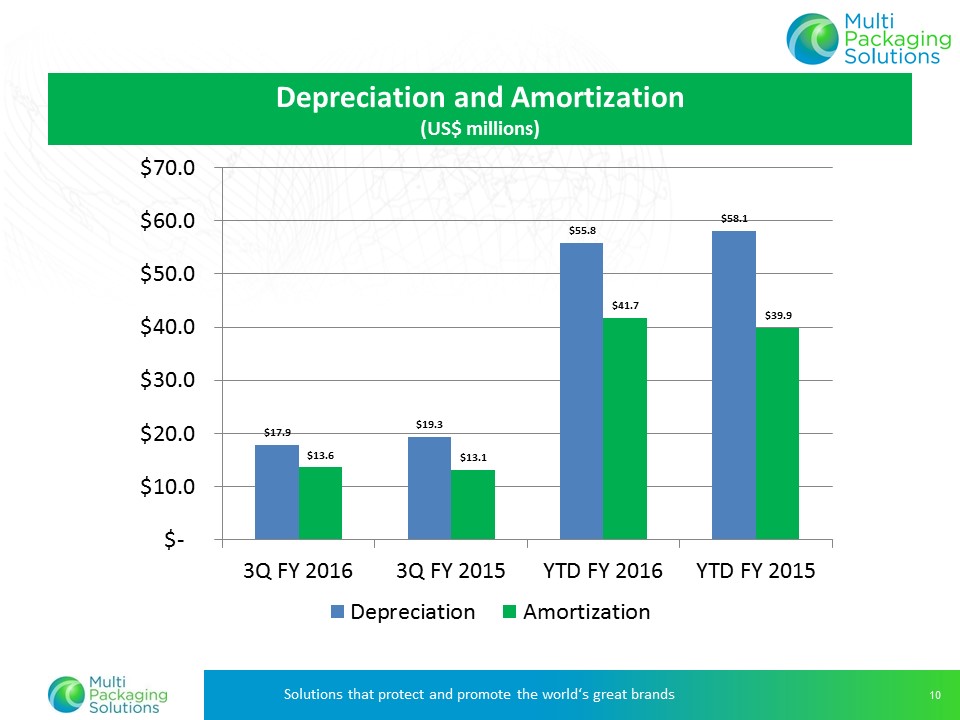
Multi packaging Solutions Solutions that protect and promote the world‘s great brands 10 $17.9 $19.3 $55.8 $58.1 $13.6 $13.1 $41.7 $39.9 $‐ $10.0 $20.0 $30.0 $40.0 $50.0 $60.0 $70.0 3Q FY 2016 3Q FY 2015 YTD FY 2016 YTD FY 2015 Depreciation Amortization Depreciation and Amortization (US$ millions) |
|
|
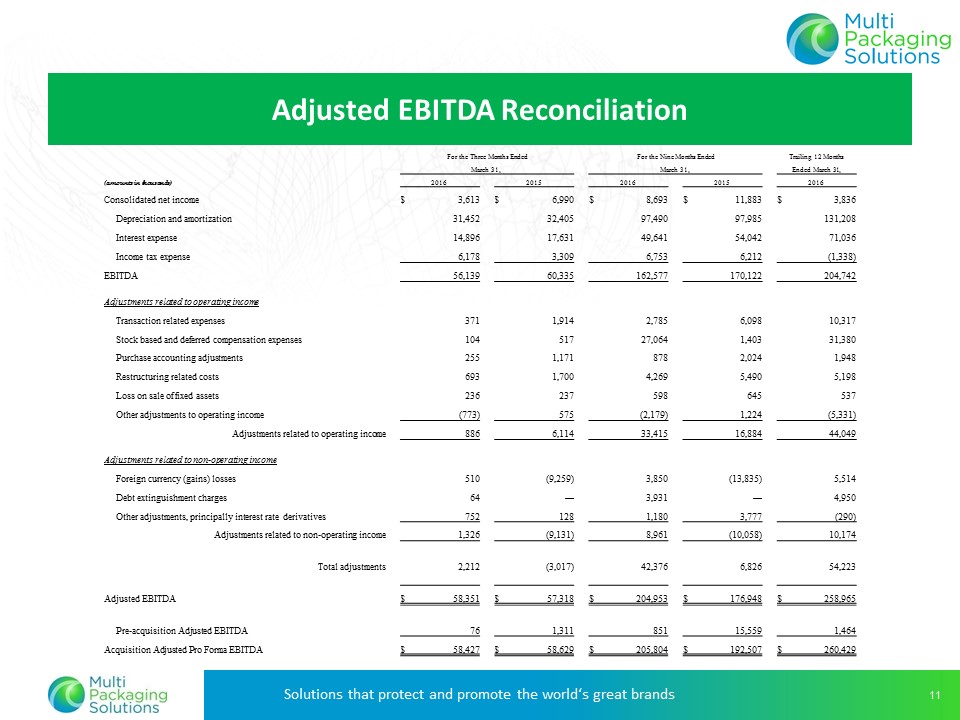
Multi packaging Solutions Solutions that protect and promote the world‘s great brands 11 Adjusted EBITDA Reconciliation For the Three Months Ended For the Nine Months Ended Trailing 12 Months March 31, March 31, Ended March 31, (amounts in thousands) 2016 2015 2016 2015 2016 Consolidated net income $ 3,613 $ 6,990 $ 8,693 $ 11,883 $ 3,836 Depreciation and amortization 31,452 32,405 97,490 97,985 131,208 Interest expense 14,896 17,631 49,641 54,042 71,036 Income tax expense 6,178 3,309 6,753 6,212 (1,338) EBITDA 56,139 60,335 162,577 170,122 204,742 Adjustments related to operating income Transaction related expenses 371 1,914 2,785 6,098 10,317 Stock based and deferred compensation expenses 104 517 27,064 1,403 31,380 Purchase accounting adjustments 255 1,171 878 2,024 1,948 Restructuring related costs 693 1,700 4,269 5,490 5,198 Loss on sale of fixed assets 236 237 598 645 537 Other adjustments to operating income (773) 575 (2,179) 1,224 (5,331) Adjustments related to operating income 886 6,114 33,415 16,884 44,049 Adjustments related to non-operating income Foreign currency (gains) losses 510 (9,259) 3,850 (13,835) 5,514 Debt extinguishment charges 64 — 3,931 — 4,950 Other adjustments, principally interest rate derivatives 752 128 1,180 3,777 (290) Adjustments related to non-operating income 1,326 (9,131) 8,961 (10,058) 10,174 Total adjustments 2,212 (3,017) 42,376 6,826 54,223 Adjusted EBITDA $ 58,351 $ 57,318 $ 204,953 $ 176,948 $ 258,965 Pre-acquisition Adjusted EBITDA 76 1,311 851 15,559 1,464 Acquisition Adjusted Pro Forma EBITDA $ 58,427 $ 58,629 $ 205,804 $ 192,507 $ 260,429 |
|
|
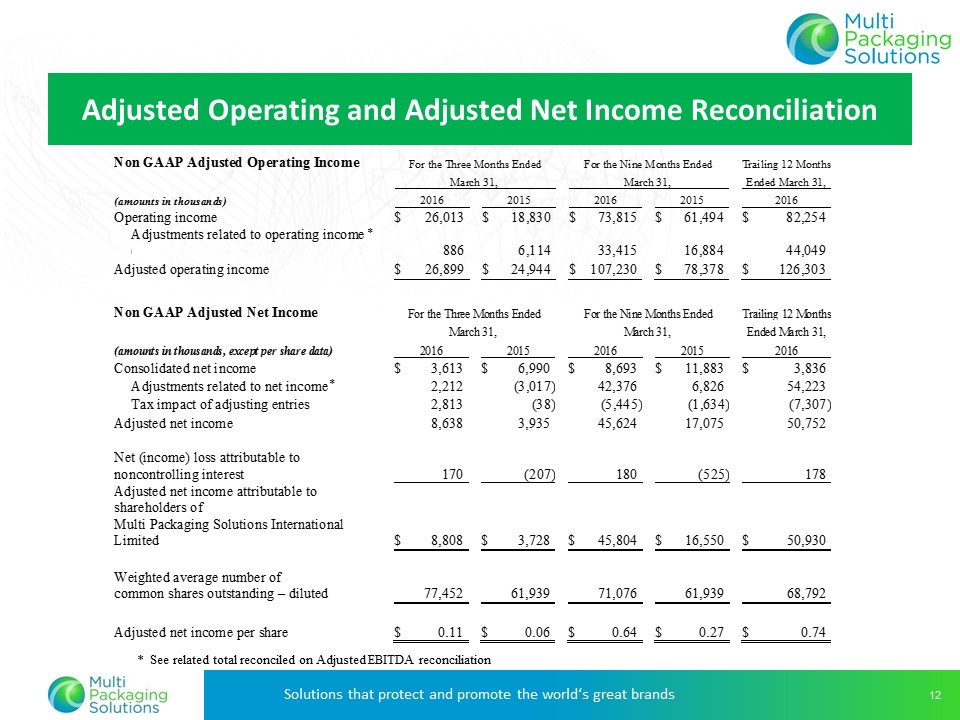
Multi packaging Solutions Solutions that protect and promote the world‘s great brands 12 Adjusted Operating and Adjusted Net Income Reconciliation * See related total reconciled on Adjusted EBITDA reconciliation Non GAAP Adjusted Operating Income For the Three Months Ended For the Nine Months Ended Trailing 12 Months March 31, March 31, Ended March 31, (amounts in thousands) 2016 2015 2016 2015 2016 Operating income $ 26,013 $ 18,830 $ 73,815 $ 61,494 $ 82,254 Adjustments related to operating income (A) 886 6,114 33,415 16,884 44,049 Adjusted operating income $ 26,899 $ 24,944 $ 107,230 $ 78,378 $ 126,303 Non GAAP Adjusted Net Income For the Three Months Ended For the Nine Months Ended Trailing 12 Months March 31, March 31, Ended March 31, (amounts in thousands, except per share data) 2016 2015 2016 2015 2016 Consolidated net income $ 3,613 $ 6,990 $ 8,693 $ 11,883 $ 3,836 Adjustments related to net income (B) 2,212 (3,017) 42,376 6,826 54,223 Tax impact of adjusting entries 2,813 (38) (5,445) (1,634) (7,307) Adjusted net income 8,638 3,935 45,624 17,075 50,752 Net (income) loss attributable to noncontrolling interest 170 (207) 180 (525) 178 Adjusted net income attributable to shareholders of Multi Packaging Solutions International Limited $ 8,808 $ 3,728 $ 45,804 $ 16,550 $ 50,930 Weighted average number of common shares outstanding – diluted 77,452 61,939 71,076 61,939 68,792 Adjusted net income per share $ 0.11 $ 0.06 $ 0.64 $ 0.27 $ 0.74 * * |
|
|
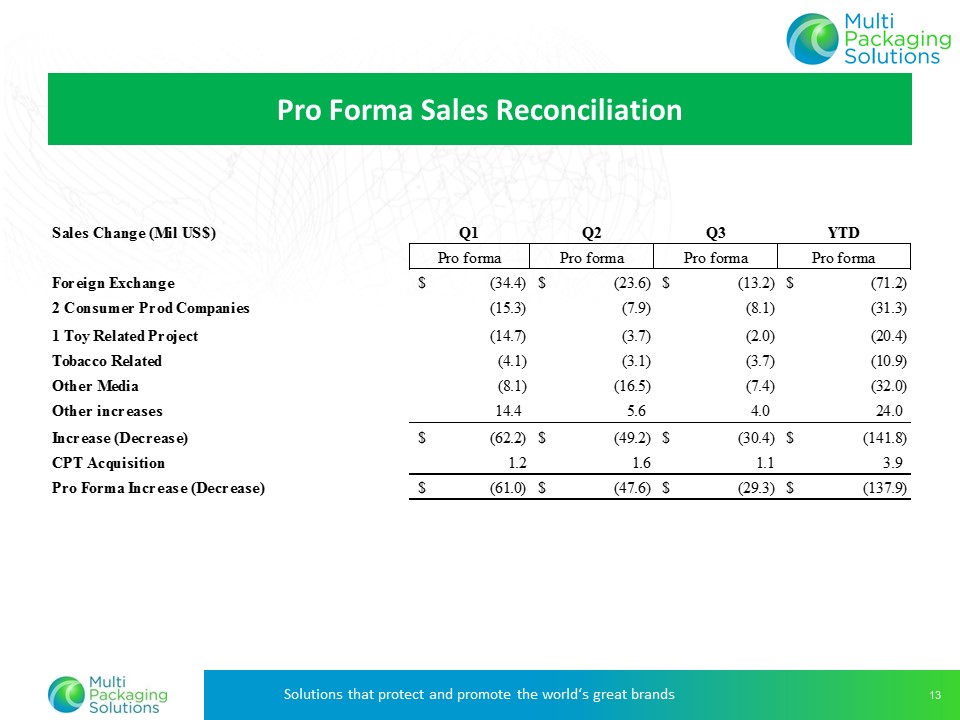
Multi packaging Solutions Solutions that protect and promote the world‘s great brands 13 Pro Forma Sales Reconciliation Sales Change (Mil US$) Q1 Q2 Q3 YTD Pro forma Pro forma Pro forma Pro forma Foreign Exchange $ (34.4) $ (23.6) $ (13.2) $ (71.2) 2 Consumer Prod Companies (15.3) (7.9) (8.1) (31.3) 1 Toy Related Project (14.7) (3.7) (2.0) (20.4) Tobacco Related (4.1) (3.1) (3.7) (10.9) Other Media (8.1) (16.5) (7.4) (32.0) Other increases 14.4 5.6 4.0 24.0 Increase (Decrease) $ (62.2) $ (49.2) $ (30.4) $ (141.8) CPT Acquisition 1.2 1.6 1.1 3.9 Pro Forma Increase (Decrease) $ (61.0) $ (47.6) $ (29.3) $ (137.9) |
|
|
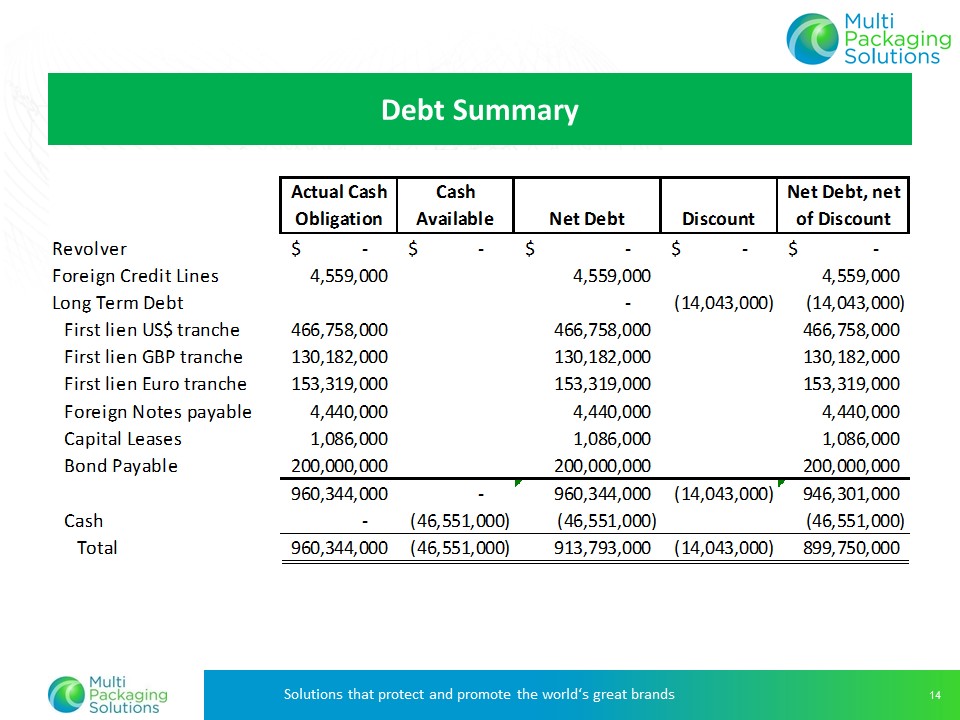
Multi packaging Solutions Solutions that protect and promote the world‘s great brands 14 Actual Cash Obligation Cash Available Net Debt Discount Net Debt, net of Discount Revolver $ ‐ $ ‐ $ ‐ $ ‐ $ ‐ Foreign Credit Lines 4,559,000 4,559,000 4,559,000 Long Term Debt ‐ (14,043,000) (14,043,000) First lien US$ tranche 466,758,000 466,758,000 466,758,000 First lien GBP tranche 130,182,000 130,182,000 130,182,000 First lien Euro tranche 153,319,000 153,319,000 153,319,000 Foreign Notes payable 4,440,000 4,440,000 4,440,000 Capital Leases 1,086,000 1,086,000 1,086,000 Bond Payable 200,000,000 200,000,000 200,000,000 960,344,000 ‐ 960,344,000 (14,043,000) 946,301,000 Cash ‐ (46,551,000) (46,551,000) (46,551,000) Total 9 60,344,000 (46,551,000) 913,793,000 (14,043,000) 899,750,000 Debt Summary |
|
|
Multi packaging Solutions Solutions that Protect and Promote the World’s Great Brands 3Q 2016 Earnings Webcast Thank you for your interest in Multi Packaging Solutions |