Attached files
| file | filename |
|---|---|
| 8-K - 8-K - FIRST UNITED CORP/MD/ | v439659_8k.htm |
Exhibit 99.1
Slide 1: Cover Slide
FIRST UNITED CORPORATION
2016 Annual Meeting of Shareholders Presentation
May 12, 2016
CARISSA RODEHEAVER
Slide 2: Carissa Rodeheaver
Good Morning fellow shareholders, and welcome to the 2016 Shareholders Meeting. I appreciate your interest in attending and for your support over the last year.
Slide 3: Forward-Looking Statements
Before we begin with our presentation, I would like to direct your attention to the Forward Looking Statement Disclosure, which is displayed on the screen for you.
Slide 4: Mission
This morning, we will discuss our strategic initiatives, the current and future direction of First United Corporation and will review highlights of our 2015 and first quarter 2016 financial performance.
Our focus in 2015 continued to be one of providing an uncommon commitment to service and solutions and our strategic objectives centered around this focus.
Slide 5: Story
The point of difference for our bank continues to be our unique size and our ability to provide customized financial solutions for all of the financial needs of our customers. As a community bank, we find that we are perfectly suited to serving the needs of our local, community oriented business owners. Like us, they are dedicated to serving the local communities. They value our willingness to listen, identify their needs and to provide the perfect financial solution.
Slide 6: Long-Term Strategies
It is only fitting that our strategic initiatives are designed with this in mind. We are focused on you, our shareholders and believe we can enhance your return by providing a unified experience for our customers through informed and educated associates, while also being active and visible in our communities. All of our strategies, goals and action plans are designed to culminate in an improved total return to you, our shareholders. I am pleased to report that our stock price improved by 37% during 2015, closing the year at $11.70. We have continued to trade in the low $11 range thus far in 2016. Our price continues to be somewhat volatile as our stock is not heavily traded. We believe that we will continue to see improvement in the price as our earnings increase over time. We believe it is growth in stock price that will drive your return for the foreseeable future. We will likely return to paying a dividend on our common stock after we have reduced the more expensive forms of capital on our balance sheet. Our first efforts at this were in February of this year when we repaid $10 million of the $30 million of our preferred stock.
I will now introduce Tonya Sturm, Senior Vice President and Chief Financial Officer, who will provide additional detail on our financial performance.
TONYA STURM
Slide 7: Tonya Sturm
Thank you, Carissa. Good Morning!
Slide 8: Deliver Market Return
As Carissa mentioned, one of our long-term strategies is to deliver a total market return to our shareholders through efficient and effective delivery channels.
Slide 9: 2015 Initiatives
At last year’s meeting, we discussed our 2015 initiatives which are to profitably grow high quality assets and improve our capital ratios while strengthening core earnings and fee income, which should provide a higher return to shareholders. Today, I will highlight our 2015 Financial Performance as well as our performance for the first quarter of 2016, which was just released on Monday. For more detail, I encourage you to read the discussion of our financial condition and results of operations in our 2015 Annual Report on Form 10-K and our most recent earnings release for the first quarter of 2016, which are available to all shareholders on our website.
Slide 10: Balance Sheet
The balance sheet is most impacted by the first two initiatives of profitably growing high quality assets and improving capital ratios.
Slide 11: Trend in Total Assets
Margin and core earnings are strongly influenced by asset growth and the composition of our asset mix. As you can see, total assets remained relatively flat from 2014 through 2015. During 2015, we used the cash flow from the investment portfolio to fund the loan growth.
Slide 12: Balance Sheet- Asset Mix
This next slide shows the composition, or asset mix. As we continue to see, the Bank is predominantly invested in loans. This can be seen in the green section of this chart. In 2015, we sold investments in order to reduce interest rate volatility and to provide funding for higher yielding loans, which reduced the percentage of investments slightly from 2014.
Slide 13: Trend in Loan Balances
2015 resulted in an increase in loan balances and both mortgage loan and commercial loan portfolios shared in this growth.
Residential mortgage loans grew by $21.1 million as our adjustable rate loan programs continued to be favored by our customers. For the longer-term, fixed rate loans, we continue to use Fannie Mae. Our commercial portfolio had net growth of $16.7 million despite payoffs of approximately $30.0 million during the year. As one of our 2015 initiatives was to profitably grow high quality assets, our commercial group was very busy in 2015 building new relationships with high quality borrowers.
As we closed 2015, the pipelines for both mortgage loans and commercial loans were robust which led to $21.0 million of net loan growth in the first quarter of 2016. Both of these portfolios continue to have very robust pipelines.
Slide 14: Loan Portfolio Composition
The composition of the loan portfolio is made up of residential mortgage and other consumer loans at 47% of total loans, or the purple and light blue sections. The Commercial portfolio, at 53% of total loans, is diversified in commercial real estate, commercial and industrial, and acquisition and development loans, or the dark blue, green and red sections in the chart.
Slide 15: Trends in Adversely Classified Assets
The main ratio we monitor with respect to asset quality is the coverage ratio. This ratio compares our exposure to substandard loans, investments, and other real estate owned, or OREO, to our tier one capital plus capital that has been set aside in the allowance for loan losses. It is essentially a measure of the risk that these adversely classified assets pose to our capital and is the red line represented on this chart. As a result of reducing each of the substandard asset classes, we have successfully reduced our adversely classified assets as a percentage of capital from a high of 162% in 2010 to 35% as of December 31, 2015. The blue portion of each bar represents the substandard loans, the purple represents other real estate owned and the green represents the downgraded investments in collateralized debt obligations.
Slide 16: Trend in Deposits
Total deposits increased $17.5 million in 2015. During 2015, we continued our strategic focus on shifting the mix of deposits from high cost certificates of deposit to lower cost core money market and demand deposit accounts. On this slide, this shift can be seen as the retail CDs and brokered deposits, or the red and green portions of the bars, have decreased from earlier years, and the core retail deposits, or the blue portion of the bars, have increased. The result of shifting the deposit mix was a lower cost of funds.
During 2015, the Insured Cash Sweep, or ICS, program was introduced. This program offers full FDIC insurance protection to demand deposit and savings or money market accounts. This is the perfect solution for those customers who value the insurance but need availability to access their funds without locking it up for a stated term.
For the first quarter 2016, we reported $17.0 million in deposit growth. This growth continued to be in lower cost core accounts as can be seen by the blue portion of the bar. Retail CDs, the red portion, declined slightly.
Slide 17: Capital Ratios
In March 2015, the new BASEL III capital rules were implemented. These rules set new standards for our capital calculations as well as introducing the new Common Equity Tier 1 ratio, or the green bar shown. We are pleased to report that our capital ratios increased nicely in 2015. The black bar on this chart represents those levels where an institution is considered to be well-capitalized by the banking regulators. Internal minimum ratios have been set to compensate for any inherent risk in the portfolio. As can be seen on this chart, all of our capital ratios well exceed the black bars.
Slide 18: Components of Capital
We continue to be focused on shifting the mix in our capital composition to higher levels of tangible common equity, which is represented by the dark blue portion of this chart. The red and green portions identify the qualifying trust preferred securities and the Series A Preferred Stock. In February 2016, we redeemed $10.0 million of the $30.0 million of our Series A Preferred Stock, which reduced the green portion slightly.
Slide 19: Earnings
Our third initiative was to strengthen core earnings and increase fee income. The Corporation’s earnings are driven by core components including net interest income, fee income and expenses. The most impactful of these is net interest income which is interest earned on loans and investments less interest paid on deposits and borrowings. To this, we add non-interest income, which includes trust and investments income and service charge income. Finally, we subtract operating expenses. Core income generally does not include gains and losses booked on the sale of investments and other real estate owned.
Slide 20: Net Interest Income
Net interest income is measured by the net interest margin. We continued to feel margin pressure during 2015 as the net interest margin remained flat for 2015 compared to 2014. Reductions in interest on deposits and long-term borrowings were offset by reduced interest income. Interest income on loans continued to be lower than prior years as we continued to see our existing loans re-price at lower rates and new loan production booked at lower rates due to the continued low interest rate environment.
While we did experience net growth in both mortgage and commercial loans, the mortgage portfolio tends to have lower rates than the commercial loans. Much of the 2015 commercial loan growth was booked late in the fourth quarter with little earnings impact in 2015, but provided increased balances for the first quarter of 2016. This resulted in an increase in the net interest margin to 3.23% for the first quarter of 2016.
We believe we can maintain this margin by strengthening the yield on loans and controlling the cost of deposits through deepening our relationships with our customers.
Slide 21: Providing for Loan Losses
Lower net charge-offs, as indicated by the red bar, as well as continued reductions in the level of classified assets were contributing factors to the lower provision expense in 2015. We believe that our continued recognition of losses in our portfolio, our early identification of problem loans and our solid allowance for loan loss methodology signify the reduced risk in our portfolio and that our capital levels provide sufficient protection for the identified risk and potential risk in our balance sheet.
Slide 22: Net Charge-Offs
We saw significant improvement in the ratio of net charge offs to average loans outstanding for 2015. This is a result of the improvement in asset quality that we have seen over the past several years.
Slide 23: Other Operating Income
Other operating income for 2015, excluding gains and losses, increased slightly over 2014 as we saw growth in our trust and investments income, service charge income due to new fees implemented late in 2015, and debit card income due to contract negotiations. These increases were partially offset by a decline in bank owned life insurance income which was driven by the receipt of a one-time death benefit in 2014.
Slide 24: Trust & Investments Income
Our Trust and Investments department posted revenues of $6.5 million in 2015 which reflects an increase of 4.9% over 2014. We expect our sales and administrative teams will continue to increase revenues in 2016.
Slide 25: Trust & Investments Assets
Revenue in Trust & Investments is primarily attributable to assets under management. The growth in market values and successful sales from our Trust and Investments sales team increased assets under management to $718 million in Trust and an additional $240 million in Investment Services.
Slide 26: Operating Expense
Operating expenses increased slightly in 2015. This increase was due to increases in salaries and benefits primarily due to increased pension and health care costs, and an increase in professional services due to legal expenses incurred for litigation. These increases were partially offset by a decrease in expenses due to reductions in valuation write-downs on OREO properties and a decrease in other expenses such as marketing, in house training and other miscellaneous expenses.
Opportunities to reduce costs in our banking network continue to stay “top of mind” through continued implementation of technology, evaluation of our branch network and branch transformations and through heightened monitoring of our spending.
Slide 27: Net Gains/(Losses), Securities Impairment Losses and Arbitration Recovery
This chart shows net gains or losses on investment securities, losses on securities for impairment charges and income from an arbitration settlement. These items netted to $9.1 million in 2015. This income is primarily attributable to an $11.6 million recovery received in November 2015 from an arbitration settlement. This settlement was received as a result of litigation proceedings relating to the impairment charges taken in prior years on the CDO investments and is a partial recovery of the $14.4 million of losses recorded in 2010, as seen on this chart. This recovery was partially offset by a $3.5 million loss on four CDO investments that were transferred, at fair market value, from the Bank to the Corporation in December 2015. The transfer of investments provided earning assets at the holding company level as well as potential cash flows.
Slide 28: Net Income Available to / Net (Loss) Attributable to Common Shareholders
Consolidated net income available to common shareholders for 2015 was $8.2 million compared to the net income available to common shareholders of $3.0 million in 2014. The increase in net income during 2015 was primarily attributable to the gains and losses discussed previously. Earnings per common share was $1.31 in 2015, an increase from the $.48 recorded in 2014.
On Monday, your Company announced earnings of $1.2 million for the quarter ended March 31, 2016, or earnings per common share of $.19, which resulted from maintaining net interest income, increased other operating income and reductions in non-interest expenses.
At this time, I will turn the remainder of the presentation over to Carissa. Thank you!
CARISSA RODEHEAVER
Slide 29: Carissa Rodeheaver
Thank you Tonya!
Slide 30: Employer of Choice
As you have seen, your bank has continued to improve asset quality and to grow capital. Our balance sheet is positioned to improve our earnings structure going forward. But, to grow earnings, we must deliver customer service that is unsurpassed by our banking competitors. Our other long-term strategies are designed with this in mind.
Slide 31: Employee Value Proposition
We know that our associates are at the very core of every banking experience and we are committed to hiring individuals who embody our core values and culture and we continue to develop those who have been exceeding customer expectations for years. We are nurturing a culture of associates who are passionate for the bank and care about helping customers.
Slide 32: Universal Banker
To do this, we believe our associates need to be educated and informed in order to provide solutions for all financial needs. This means that all associates need to be trained in a variety of financial areas and that our specialists for trust and investments, mortgage, commercial and treasury management need to be the best in the area. All of these customer contact associates strive to become trusted advisors to our customers. This is commonly referred to in the industry as the universal banker approach.
Slide 33: Communities
Our bankers are encouraged to be engaged and involved with their families and communities. This is part of our next strategic objective. We believe in the importance of being respected, corporate citizens and it is important to us to be visible and supportive of the towns and communities where we live and that we serve.
Slide 34: Communities
Our management team and associates are sought after members and officers of non-profit boards and it is not uncommon to see them coaching teams, leading boy scout and girl scout packs or volunteering their time to help others. We invest both time and money in our communities. Together, our associates were involved in over 450 groups and boards and volunteered over 25,000 hours of their time in the past year.
Slide 35: Investing Resources
First United associates genuinely care about our customers. During 2015, I challenged them to “Share the Love” and they did not disappoint me. Every community office and every department reached out to help our community friends and families. They collected food for shelters, volunteered in schools, held leadership positions for non-profit organizations, supported local animal shelters and even sponsored fund raisers for the United Way and the Ronald McDonald House. This challenge originally was intended to last for a month, but I am proud to share that I am still regularly notified of their generosity and caring and how they are entrenched in the communities where they live and our bank serves.
Slide 36: Investing Resources
In the last two months, First United participated in a food drive sponsored by the Maryland Bankers Association and we successfully collected over 13,000 pounds of food to donate to food shelters in each of our local communities. This is a natural part of our culture.
I would like to publicly thank each and every associate at First United Bank & Trust for their commitment to both the bank and to the communities that we serve. I sincerely believe that it is the people that make the difference in community banking.
Slide 37: Unified Banking Experience
Beyond our commitment to an educated and knowledgeable associate base and our love for our communities, our fourth strategy revolves around creating a unified banking experience. We want you to be able to manage your financial needs from home, from your mobile device or in our community office network and to feel the same unified experience. We are continuing to focus on technology and trying to simplify our digital channels.
Slide 38: Delivery Channel Usage
As you can see from this slide, more and more of our customers are utilizing some form of digital technology to perform their transactions. In 2015, only 34% of transactions involved either a teller or the traditional check while the remaining 66% involved ACH, the ATM, point of sale transactions using a debit card, or were conducted through the internet or mobile banking.
Slide 39: Mobile Banking
The number of mobile banking customers has increased over 780% since 2011, topping 8,600 in March 2016. Clearly, our customers are telling us that they are interested in using technology.
Slide 40: Technology Initiatives
Our 2016 technology initiatives are focused on the introduction of the new chip technology, mobile check deposit, enhanced ATM machines, electronic bill pay and the introduction of cash recyclers to our community office network.
Slide 41: Customer Engagement
Cash recyclers are designed to eliminate the need for vaults in our offices and to automate transactions, allowing our branch associates to be more customer-centric, engaging our customers in conversation, identifying financial needs and customizing solutions. To do this effectively, we have spent a considerable amount of time studying how to make our offices more technology friendly and being sure our associates can guide the digital experience. With technology, we continue to see improved efficiencies. These efficiencies allow us to analyze our locations and we expect to see consolidations, transitions and possibly even new locations to better serve the banking needs of our customers.
Slide 42: Branch of the Future
Most recently, we have consolidated two of our locations in Frederick, Maryland into a new location on East Street at the new Gateway to Frederick. This office, located in the historic Cannery building, is our inaugural branch of the future and opened late in April, with a ribbon cutting and grand opening celebration scheduled for next week.
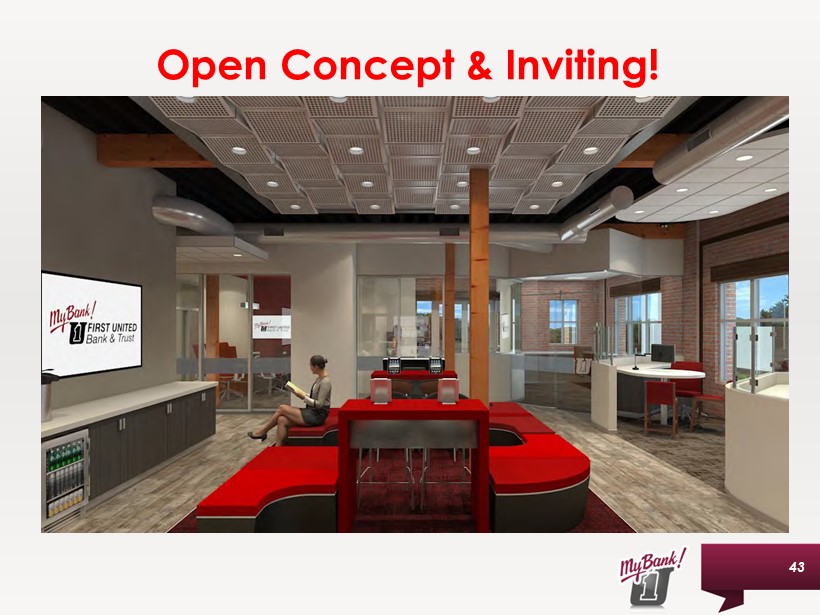
Slide 43: Open Concept
The design is open, inviting and incorporates all of the latest technology including an enhanced ATM, an electronic community board, a large touch screen for internet banking demonstrations as well as several electronic tablets for customers to independently engage in financial transactions.
Slide 44: Educational & Engaging
This new branch design facilitates a more comfortable, engaging dialogue between our customers and our associates. It is designed to allow our associates the time and to provide the equipment and technology for them to educate customers on our electronic transactions, while also permitting traditional banking for those customers not yet ready to engage electronically.
Over the next few years, we plan to renew and invigorate our brand and plan to update our existing locations to enhance our delivery methods. We want our community offices to provide a warm, welcoming and modern experience for our customers and to be a place where our associates love to work. We believe that banking should be an experience, not a transaction!
As we look to 2016 financial performance, we will focus on enhancing revenues through increased loan production and growth in our trust and investments income and our treasury management fee income. We are striving to hold expenses flat even though we have plans to increase brand awareness and will begin transforming the look and capabilities of our community office network.
Slide 45: Tribute to William B. Grant
Before we adjourn today’s meeting, the Board of Directors, Management and Associates would like to recognize and congratulate William B. Grant, former Chairman of the Board and Chief Executive Officer, on his retirement, January 2, 2016. His visionary leadership, dedication to associates, passion for community service, and friendship will always be part of the legacy he leaves at First United.
Bill’s leadership over the last twenty years has been rooted in integrity, always driven by a commitment to customer service. As the leader of over 370 employees, he has inspired confidence, optimism and an enthusiasm among associates. During his tenure as Chairman of the Board and CEO, and through Bill’s vision and leadership, the Bank has almost tripled in size as it has grown from $487 million in assets to its current $1.3 billion with a presence in seven counties in Maryland and West Virginia. His clear vision led us to our community oriented business owner strategy and helped us to capitalize on a team-centric model for delivering solutions to our customers. Our operations division grew from the second floor of our Oakland office to an entire operations center. The trust and investment department, which he was instrumental in establishing into our culture, has now grown to over $958 million in assets under management.
Bill’s career spanned over 4 decades of service through some of the best and some of the most challenging times in the history of the American banking system. Throughout his career, he led by example and lived by the vision of “uncommon commitment to service and solutions”. His leadership fostered a family oriented culture with a strong sense of customer and community service.
His legacy also includes an unwavering commitment to the Bank, the industry, and his community. He was an avid champion for the banking industry through his board membership and leadership roles with the American Bankers Association, Maryland Bankers Association and Federal Reserve Bank of Richmond. His commitment extended beyond banking as he served in leadership positions with Garrett Memorial Hospital, Leadership Maryland, Oakland Lions Club, West Virginia Wesleyan Board of Directors and the Garrett Choral Society, just to name a few.
Bill leaves us a strong independent community bank, financially sound with solid capital, solid liquidity and seasoned, well-trained associates. Bill, would you please stand? We all wish you the best in retirement!
Slide 46: Thank You
In conclusion, your Company remains committed to developing our associates, providing value to our customers, being a strong corporate citizen in our communities and ultimately, increasing the return to you, our shareholders. On behalf of the Board of Directors, the management and associates, I thank you for your attendance today and your confidence in First United Corporation!

First United Corporation Annual Shareholders’ Meeting May 12, 2016

Carissa Rodeheaver Chief Executive Officer and Chairman of the Board

Forward - Looking Statements Forward - looking statements in this presentation relating to First United Corporation’s plans, strategies, objectives, expectations, intentions and adequacy of resources, are made pursuant to the safe harbor provisions of the Private Securities Litigation Reform Act of 1995. The information contained herein should be read in conjunction with First United Corporation’s 2015 Annual Report on Form 10 - K filed with the Securities and Exchange Commission (“SEC”), which is available on the SEC’s website www.sec.gov or at First United Corporation’s website www.mybank4.com . Investors are cautioned that forward - looking statements, which are not historical fact, involve risks and uncertainties, including those detailed in First United Corporation’s 2015 Annual Report on Form 10 - K filed with the SEC under the section, ‘Risk Factors’ in Part 1, Item 1A. Such statements are subject to important factors that could cause actual results to differ materially from those contemplated by such statements. First United Corporation does not assume any duty to update any forward - looking statements. 3

Our Mission To enrich the lives of our customers, our employees and our shareholders through uncommon commitment to service and solution. 4

Our Story For over a century, our My Bank First United team has been serving our local communities and community oriented business owners in Maryland, West Virginia, Pennsylvania and Virginia. Our tweener size and team approach allows us to be small enough to get to know you, yet large enough to customize solutions for your lifetime of financial needs. Our goal is to provide value and to allow you to focus on what’s important to you . 5

1. Deliver a total market return to shareholders through efficient and effective delivery channels. 2. Utilize a seamless, omni - channel approach that provides a single, unified experience for the customer across all access channels. 3. Be the employer of choice for a customer - oriented, cross - trained, multi - functional staff . 4. Enhance visibility, engagement and support in the local communities within each market area. Our Long - Term Strategies 6

Tonya Sturm Senior Vice President and Chief Financial Officer

DELIVER A TOTAL MARKET RETURN TO SHAREHOLDERS THROUGH EFFICIENT AND EFFECTIVE DELIVERY CHANNELS 8

2015 Initiatives » Profitably grow high quality assets » Improve capital ratios » Strengthen core earnings and increase fee income » Higher return to Shareholders 9

BALANCE SHEET 10

Trend in Total Assets $300 $500 $700 $900 $1,100 $1,300 $1,500 $1,700 2011 2012 2013 2014 2015 $1,391 $1,321 $1,334 $1,332 $1,323 Millions 11

Balance Sheet - Asset Mix 4% 21% 66% 9% Cash and cash equivalents Investment securities and FHLB stock Loans Other assets December 2015 12

Trend in Net Loan Balances $300 $400 $500 $600 $700 $800 $900 $1,000 $1,100 2011 2012 2013 2014 2015 2016 Q1 $919 $859 $797 $828 $867 $888 Millions 13 (unaudited)

32% 13% 8% 44% 3% Commercial Real Estate Acquisition and Development Commercial and Industrial Residential Mortgage Consumer Installment December 2015 Loan Portfolio Composition 14
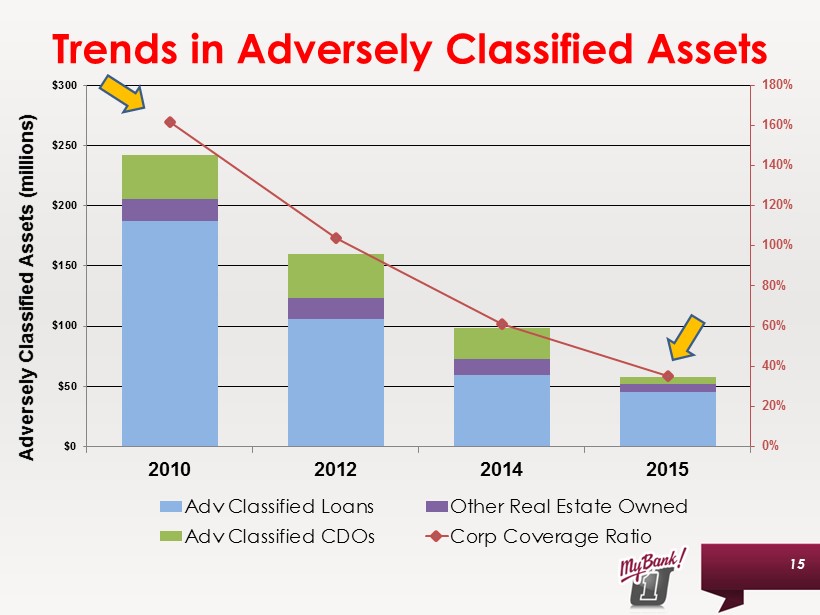
Trends in Adversely Classified Assets 0% 20% 40% 60% 80% 100% 120% 140% 160% 180% $0 $50 $100 $150 $200 $250 $300 2010 2012 2014 2015 Adversely Classified Assets (millions) Adv Classified Loans Other Real Estate Owned Adv Classified CDOs Corp Coverage Ratio 15

Trend in Deposits $0 $200 $400 $600 $800 $1,000 $1,200 2011 2012 2013 2014 2015 2016 Q1 Millions Core Retail CDs Brokered 16 $977 $999 $1,028 $977 $981 $1,016 (unaudited)

Corporation Remains Well - Capitalized 0% 2% 4% 6% 8% 10% 12% 14% 16% 18% 2011 2012 2013 2014 2015 CET1 Leverage Tier 1 Total Well - Capitalized 17

Components of Capital 18 52% 15% 14% (9)% 10% Tier 1: Common Equity, before AOCI Tier 1: Qualifying TRUPs Tier 1: Series A Preferred Stock Tier 1 Reductions: Goodwill, Disallowed Deferred Tax Asset Tier 2: Qualifying ALL, excess TRUPs December 2015

EARNINGS 19

Net Interest Income $38.3 $39.1 $38.2 $35.5 $35.6 2.96% 3.30% 3.25% 3.00% 3.04% 2.7% 2.8% 2.9% 3.0% 3.1% 3.2% 3.3% 3.4% $0 $10 $20 $30 $40 $50 2011 2012 2013 2014 2015 Net Interest Income (millions) Net Interest Income Net Interest Margin 20

$0 $2 $4 $6 $8 $10 $12 $14 $16 $18 $20 2011 2012 2013 2014 2015 Millions Provision Net Charge-offs Allowance Providing for Loan Losses 21
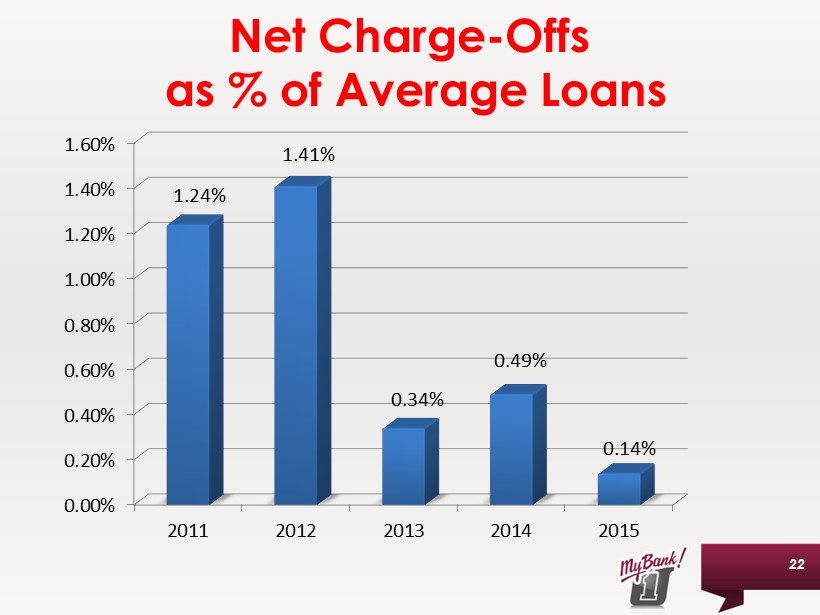
Net Charge - Offs as % of Average Loans 0.00% 0.20% 0.40% 0.60% 0.80% 1.00% 1.20% 1.40% 1.60% 2011 2012 2013 2014 2015 1.24% 1.41% 0.34% 0.49% 0.14% 22

Other Operating Income * $8 $10 $12 $14 $16 2010 2011 2012 2013 2014 2015 $15.4 $15.0 $13.7 $13.1 $12.9 $13.4 Millions * Excluding gains/(losses), securities impairment, arbitration recovery 23

Trust & Investments Revenue “WHAT MATTERS MOST” Trust . $0.0 $1.0 $2.0 $3.0 $4.0 $5.0 $6.0 $7.0 2011 2012 2013 2014 2015 $5.2 $5.4 $5.8 $6.1 $6.5 Millions 24

Trust and Investments Assets Under Management “WHAT MATTERS MOST” Trust . $0 $100 $200 $300 $400 $500 $600 $700 $800 2011 2012 2013 2014 2015 $595 $637 $675 $702 $718 $189 $215 $234 $237 $240 Millions Trust Assets Investment Assets 25

Operating Expense $8 $13 $18 $23 $28 $33 $38 $43 $48 2011 2012 2013 2014 2015 $43.4 $39.5 $42.4 $40.1 $41.1 Millions 26

Net Gains / (Losses), Securities Impairment Losses and Arbitration Recovery -$17 -$12 -$7 -$2 $3 $8 2010 2011 2012 2013 2014 2015 $(14.4) $2.3 $1.7 $0.2 $1.1 $9.1 Millions 27

Net Income Available to / Net (Loss) Attributable to Common Shareholders -$12 -$10 -$8 -$6 -$4 -$2 $0 $2 $4 $6 $8 $10 2010 2011 2012 2013 2014 2015 - $11.8 $2.0 $3.0 $4.7 $3.0 $8.2 Millions 28

Carissa Rodeheaver Chief Executive Officer and Chairman of the Board

BE THE EMPLOYER OF CHOICE FOR A CUSTOMER - ORIENTED, CROSS - TRAINED, MULTI - FUNCTIONAL STAFF 30

• Confidence • Passion • Curious and caring • Competence • Demonstrate mutual respect • Community oriented • Trustworthy • Family oriented • Focused Employee Value Proposition 31

Growing Universal Banker Approach • Successful execution of branch transformation • Stronger ties in local communities • Enriching trusted advisors commitment • Providing value to customers, associates and shareholders 32

ENHANCE VISIBILITY, ENGAGEMENT AND SUPPORT IN OUR LOCAL COMMUNITIES 33

Relationships with Organizations / Boards in each Market Area 34

Invest resources that provide financial education and other support to our communities 35 Preston County Middle School Girl Scouts of America

36 Frederick Rescue Mission Yough Glades Elementary School United Way Golf Tourney Invest resources that provide financial education and other support to our communities

PROVIDE A SINGLE, UNIFIED EXPERIENCE FOR THE CUSTOMER ACROSS ALL ACCESS CHANNELS USING A SEAMLESS, OMNI - CHANNEL APPROACH 37

Delivery Channel Usage ACH 19% Internet / Mobile 9% Point of Sale 38% Checks 11% Teller 23% 2015 38

Growth in Mobile Banking Customers 1,106 2,396 3,830 5,278 7,735 8,649 0 1,000 2,000 3,000 4,000 5,000 6,000 7,000 8,000 9,000 10,000 2011 2012 2013 2014 2015 Q1 16 39

Technology Initiatives 40

Customer Engagement Strategy Branch Built for Engagement! 41

First United’s Branch of the Future! 42
Open Concept & Inviting! 43

Educational & Engaging! 44

Tribute to William B. Grant 45

Thank you mybank4.com 888 - 692 - 2654