Attached files
| file | filename |
|---|---|
| 8-K - 8-K - Farmland Partners Inc. | a16-10831_18k.htm |
| EX-99.1 - EX-99.1 - Farmland Partners Inc. | a16-10831_1ex99d1.htm |
Exhibit 99.2
First Quarter 2016 Earnings Call Supplement May 10, 2016
Forward-Looking Statements 2 Some of the statements contained in this presentation, including statements regarding our portfolio development approach, our improvement projects and estimated costs and projected returns, our pending acquisitions and other investment opportunities, our future growth prospects and farmland investment characteristics and certain trends, constitute forward-looking statements within the meaning of the federal securities laws. Forward-looking statements relate to expectations, beliefs, projections, future plans and strategies, anticipated events or trends and similar expressions concerning matters that are not historical facts. In some cases, you can identify forward-looking statements by the use of forward-looking terminology such as “may,” “will,” “should,” “expects,” “intends,” “plans,” “anticipates,” “believes,” “estimates,” “projects,” “predicts,” or “potential” or the negative of these words or similar words, which are predictions of or indicate future events or trends and which do not relate solely to historical matters. You can also identify forward-looking statements by discussions of strategy, plans or intentions. The forward-looking statements contained in this presentation reflect our current views about future events and are subject to numerous known and unknown risks, uncertainties, assumptions and changes in circumstances, many of which are beyond our control, that may cause actual results to differ significantly from those expressed in any forward-looking statement. While forward-looking statements reflect our good faith beliefs, assumptions and expectations, they are not guarantees of future performance. Furthermore, we expressly disclaim any obligation to publicly update or revise any forward-looking statement to reflect changes in the underlying assumptions or factors, new information, data or methods, future events or other changes, except as required by law. For a further discussion of these and other factors that could cause our future results to differ significantly from any forward-looking statements, see the section entitled “Risk Factors” in our Annual Report on Form 10-K for the year ended December 31, 2015, and our other filings with the Securities and Exchange Commission. This presentation contains statistics and other data that has been obtained from or compiled from information made available by third parties. We believe that the information obtained from or compiled by third parties is reliable, but we have not independently verified such information.
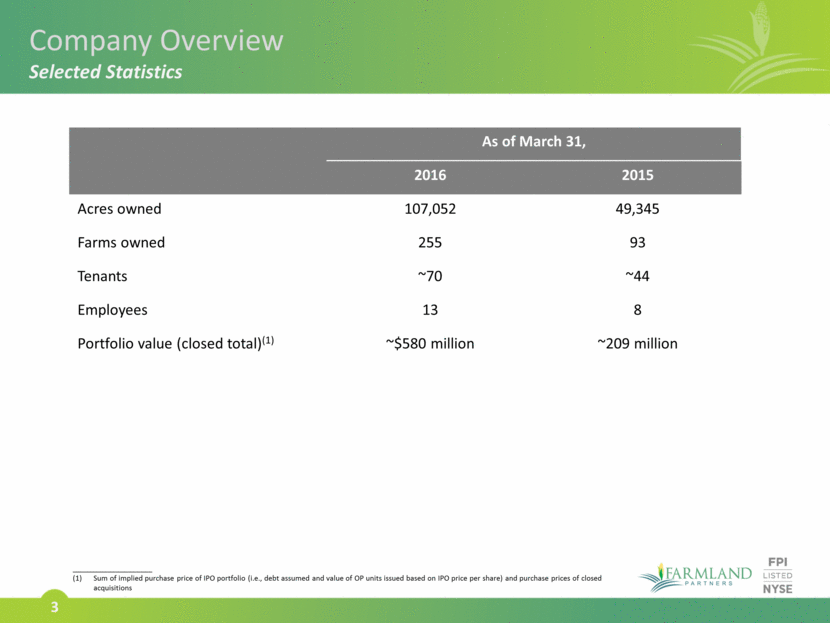
3 Company Overview Selected Statistics As of March 31, 2016 2015 Acres owned 107,052 49,345 Farms owned 255 93 Tenants ~70 ~44 Employees 13 8 Portfolio value (closed total)(1) ~$580 million ~209 million ____________________ Sum of implied purchase price of IPO portfolio (i.e., debt assumed and value of OP units issued based on IPO price per share) and purchase prices of closed acquisitions
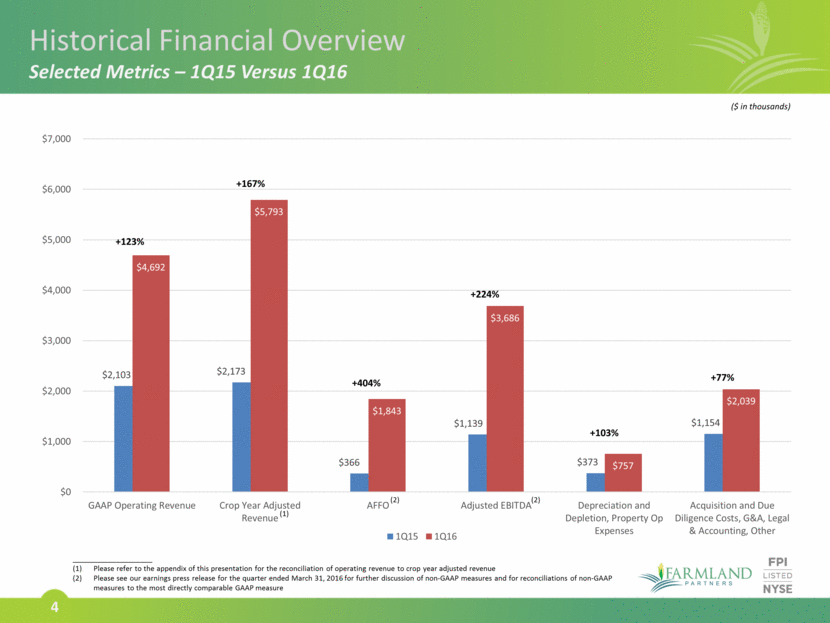
4 Historical Financial Overview Selected Metrics – 1Q15 Versus 1Q16 ($ in thousands) 1.98x 2014 total +123% +167% +224% +77% +103% +404% ____________________ Please refer to the appendix of this presentation for the reconciliation of operating revenue to crop year adjusted revenue Please see our earnings press release for the quarter ended March 31, 2016 for further discussion of non-GAAP measures and for reconciliations of non-GAAP measures to the most directly comparable GAAP measure (2) (2) (1) $2,103 $2,173 $366 $1,139 $373 $1,154 $4,692 $5,793 $1,843 $3,686 $757 $2,039 $0 $1,000 $2,000 $3,000 $4,000 $5,000 $6,000 $7,000 GAAP Operating Revenue Crop Year Adjusted Revenue AFFO Adjusted EBITDA Depreciation and Depletion, Property Op Expenses Acquisition and Due Diligence Costs, G&A, Legal & Accounting, Other 1Q15 1Q16
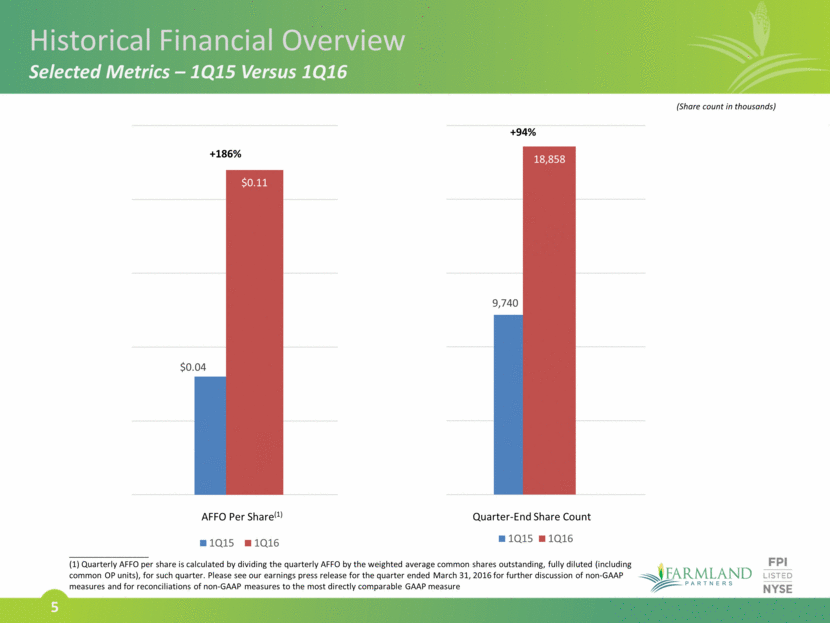
5 ____________________ (1) Quarterly AFFO per share is calculated by dividing the quarterly AFFO by the weighted average common shares outstanding, fully diluted (including common OP units), for such quarter. Please see our earnings press release for the quarter ended March 31, 2016 for further discussion of non-GAAP measures and for reconciliations of non-GAAP measures to the most directly comparable GAAP measure Historical Financial Overview Selected Metrics – 1Q15 Versus 1Q16 AFFO Per Share(1) Quarter-End Share Count +186% +94% (Share count in thousands) $0.04 $0.01 $0.11 $0.02 1Q15 1Q16 9,740 18,858 1Q15 1Q16
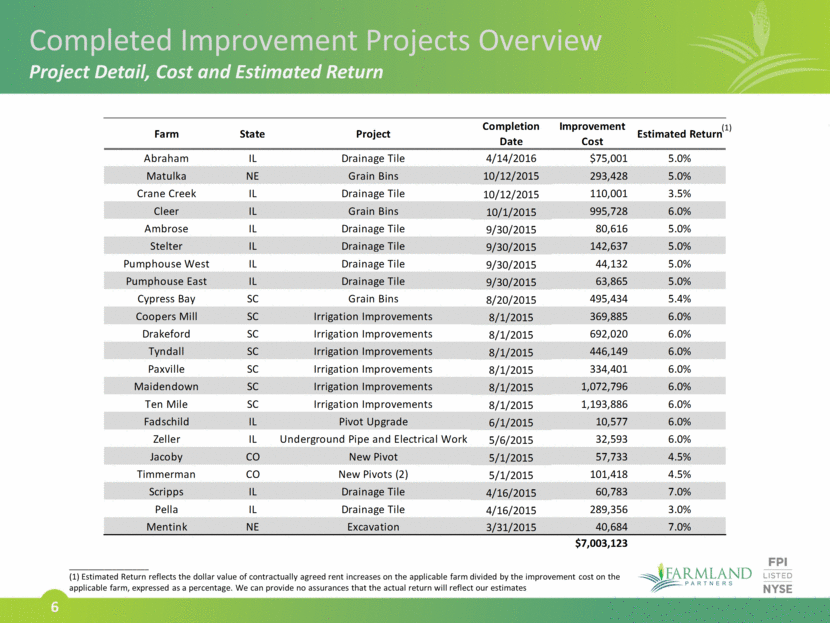
6 Completed Improvement Projects Overview Project Detail, Cost and Estimated Return ____________________ (1) Estimated Return reflects the dollar value of contractually agreed rent increases on the applicable farm divided by the improvement cost on the applicable farm, expressed as a percentage. We can provide no assurances that the actual return will reflect our estimates (1) Farm State Project Completion Date Improvement Cost Estimated Return Abraham IL Drainage Tile 4/14/2016 $75,001 5.0% Matulka NE Grain Bins 10/12/2015 293,428 5.0% Crane Creek IL Drainage Tile 10/12/2015 110,001 3.5% Cleer IL Grain Bins 10/1/2015 995,728 6.0% Ambrose IL Drainage Tile 9/30/2015 80,616 5.0% Stelter IL Drainage Tile 9/30/2015 142,637 5.0% Pumphouse West IL Drainage Tile 9/30/2015 44,132 5.0% Pumphouse East IL Drainage Tile 9/30/2015 63,865 5.0% Cypress Bay SC Grain Bins 8/20/2015 495,434 5.4% Coopers Mill SC Irrigation Improvements 8/1/2015 369,885 6.0% Drakeford SC Irrigation Improvements 8/1/2015 692,020 6.0% Tyndall SC Irrigation Improvements 8/1/2015 446,149 6.0% Paxville SC Irrigation Improvements 8/1/2015 334,401 6.0% Maidendown SC Irrigation Improvements 8/1/2015 1,072,796 6.0% Ten Mile SC Irrigation Improvements 8/1/2015 1,193,886 6.0% Fadschild IL Pivot Upgrade 6/1/2015 10,577 6.0% Zeller IL Underground Pipe and Electrical Work 5/6/2015 32,593 6.0% Jacoby CO New Pivot 5/1/2015 57,733 4.5% Timmerman CO New Pivots (2) 5/1/2015 101,418 4.5% Scripps IL Drainage Tile 4/16/2015 60,783 7.0% Pella IL Drainage Tile 4/16/2015 289,356 3.0% Mentink NE Excavation 3/31/2015 40,684 7.0% $7,003,123
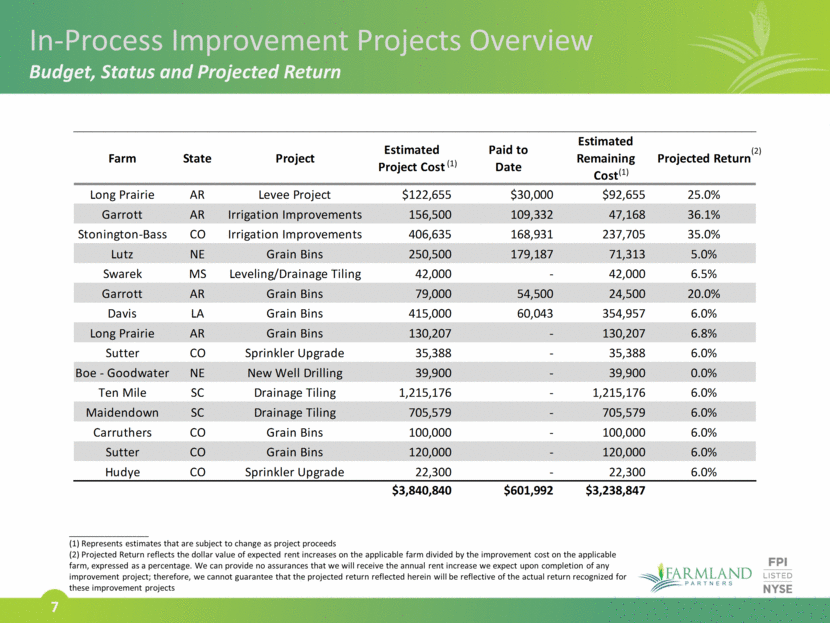
7 In-Process Improvement Projects Overview Budget, Status and Projected Return ____________________ (1) Represents estimates that are subject to change as project proceeds (2) Projected Return reflects the dollar value of expected rent increases on the applicable farm divided by the improvement cost on the applicable farm, expressed as a percentage. We can provide no assurances that we will receive the annual rent increase we expect upon completion of any improvement project; therefore, we cannot guarantee that the projected return reflected herein will be reflective of the actual return recognized for these improvement projects (2) (1) (1) Farm State Project Estimated Project Cost Paid to Date Estimated Remaining Cost Projected Return Long Prairie AR Levee Project $122,655 $30,000 $92,655 25.0% Garrott AR Irrigation Improvements 156,500 109,332 47,168 36.1% Stonington-Bass CO Irrigation Improvements 406,635 168,931 237,705 35.0% Lutz NE Grain Bins 250,500 179,187 71,313 5.0% Swarek MS Leveling/Drainage Tiling 42,000 - 42,000 6.5% Garrott AR Grain Bins 79,000 54,500 24,500 20.0% Davis LA Grain Bins 415,000 60,043 354,957 6.0% Long Prairie AR Grain Bins 130,207 - 130,207 6.8% Sutter CO Sprinkler Upgrade 35,388 - 35,388 6.0% Boe - Goodwater NE New Well Drilling 39,900 - 39,900 0.0% Ten Mile SC Drainage Tiling 1,215,176 - 1,215,176 6.0% Maidendown SC Drainage Tiling 705,579 - 705,579 6.0% Carruthers CO Grain Bins 100,000 - 100,000 6.0% Sutter CO Grain Bins 120,000 - 120,000 6.0% Hudye CO Sprinkler Upgrade 22,300 - 22,300 6.0% $3,840,840 $601,992 $3,238,847
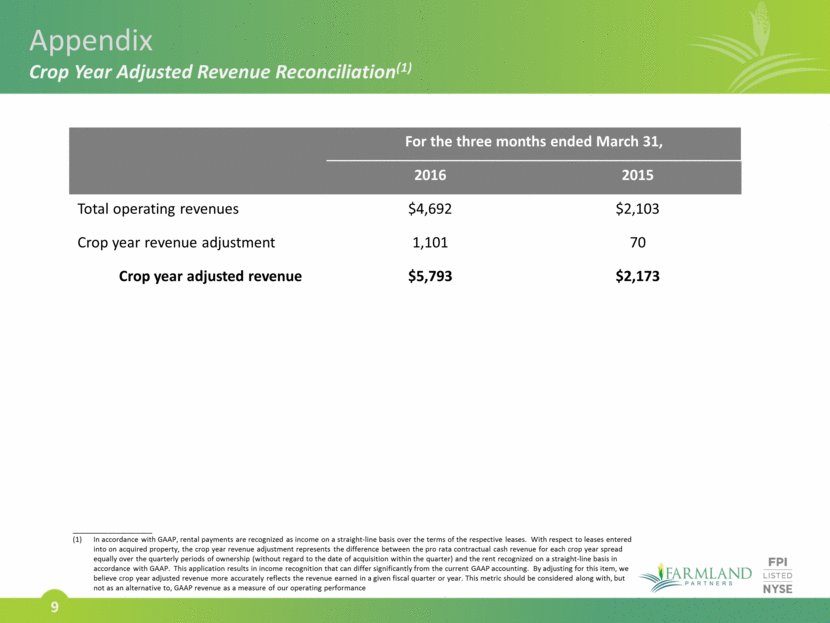
8 Appendix Crop Year Adjusted Revenue Reconciliation
9 Appendix Crop Year Adjusted Revenue Reconciliation(1) For the three months ended March 31, 2016 2015 Total operating revenues $4,692 $2,103 Crop year revenue adjustment 1,101 70 Crop year adjusted revenue $5,793 $2,173 In accordance with GAAP, rental payments are recognized as income on a straight-line basis over the terms of the respective leases. With respect to leases entered into on acquired property, the crop year revenue adjustment represents the difference between the pro rata contractual cash revenue for each crop year spread equally over the quarterly periods of ownership (without regard to the date of acquisition within the quarter) and the rent recognized on a straight-line basis in accordance with GAAP. This application results in income recognition that can differ significantly from the current GAAP accounting. By adjusting for this item, we believe crop year adjusted revenue more accurately reflects the revenue earned in a given fiscal quarter or year. This metric should be considered along with, but not as an alternative to, GAAP revenue as a measure of our operating performance