Attached files
| file | filename |
|---|---|
| 8-K - 8-K - FTI CONSULTING, INC | d158406d8k.htm |
Exhibit 99.1
FTI Consulting, Inc.
Current Investor Presentation
May 2016
Cautionary Note About Forward-Looking Statements
This presentation includes “forward-looking statements” within the meaning of Section 27A of the Securities Act of 1933, as amended, and Section 21E of the Securities Exchange Act of 1934, as amended, which involve uncertainties and risks. Forward-looking statements include statements concerning our plans, objectives, goals, strategies, future events, future revenues, future results and performance, expectations, plans or intentions relating to acquisitions and other matters, business trends and other information that is not historical, including statements regarding estimates of our medium-term growth targets or other future financial results. When used in this presentation, words such as “anticipates,” “estimates,” “expects,” “goals,” “intends,” “believes,” “forecasts,” “targets,” “objectives” and variations of such words or similar expressions are intended to identify forward-looking statements. All forward-looking statements, including, without limitation, estimates of our medium-term growth targets and our future financial results, are based upon our expectations at the time we make them and various assumptions. Our expectations, beliefs, projections and growth targets are expressed in good faith, and we believe there is a reasonable basis for them. However, there can be no assurance that management’s expectations, beliefs, estimates or growth targets will be achieved, and the Company’s actual results may differ materially from our expectations, beliefs, estimates and growth targets. The Company has experienced fluctuating revenues, operating income and cash flow in prior periods and expects that this will occur from time to time in the future. Other factors that could cause such differences include declines in demand for, or changes in, the mix of services and products that we offer, the mix of the geographic locations where our clients are located or where services are performed, adverse financial, real estate or other market and general economic conditions, which could impact each of our segments differently, the pace and timing of the consummation and integration of past and future acquisitions, the Company’s ability to realize cost savings and efficiencies, competitive and general economic conditions, retention of staff and clients and other risks described under the heading “Item 1A Risk Factors” in the Company’s most recent Form 10-K filed with the SEC and in the Company’s other filings with the SEC, including the risks set forth under “Risks Related to Our Reportable Segments” and “Risks Related to Our Operations.” We are under no duty to update any of the forward looking statements to conform such statements to actual results or events and do not intend to do so.
| 2 |
|
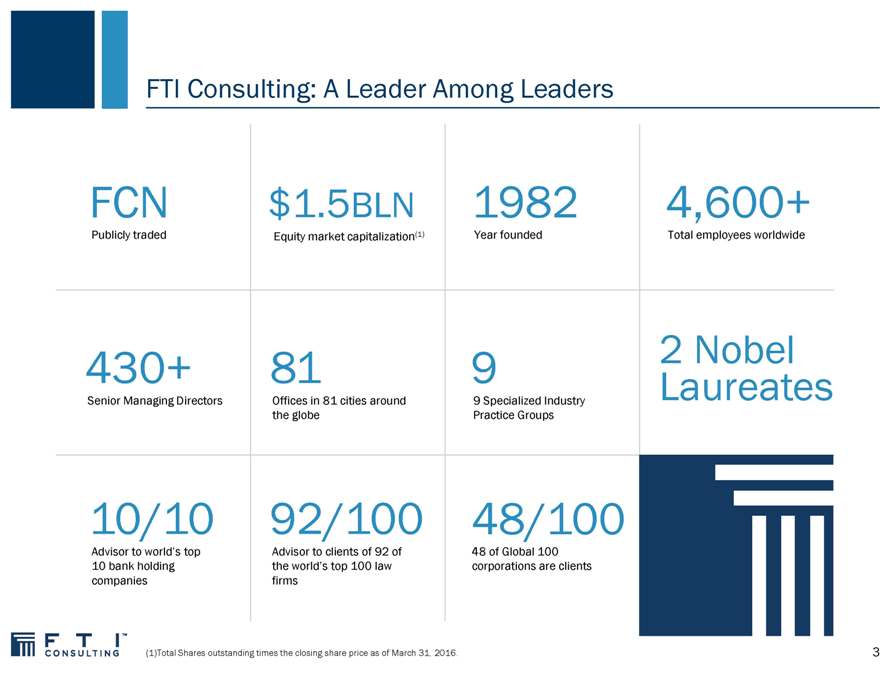
FTI Consulting: A Leader Among Leaders
FCN
Publicly traded
$1.5BLN
Equity market capitalization(1)
1982
Year founded
4,600+
Total employees worldwide
430+
Senior Managing Directors
81
Offices in 81 cities around the globe
9
9 Specialized Industry Practice Groups
| 2 |
|
Nobel Laureates |
10/10
Advisor to world’s top
10 bank holding companies
92/100
Advisor to clients of 92 of the world’s top 100 law firms
48/100
48 of Global 100 corporations are clients
(1)Total Shares outstanding times the closing share price as of March 31, 2016.
| 3 |
|
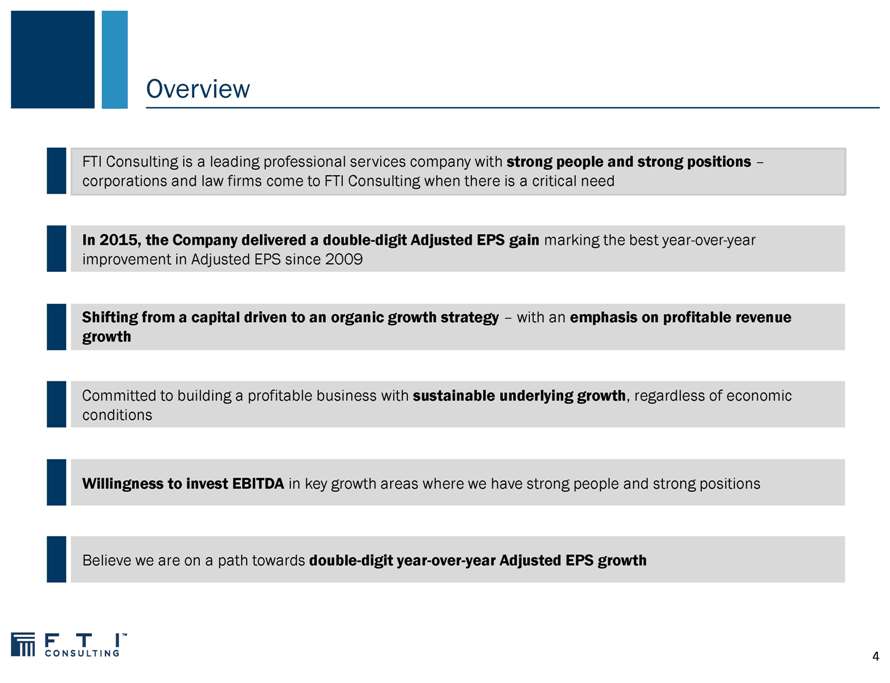
Overview
FTI Consulting is a leading professional services company with strong people and strong positions – corporations and law firms come to FTI Consulting when there is a critical need
In 2015, the Company delivered a double-digit Adjusted EPS gain marking the best year-over-year improvement in Adjusted EPS since 2009
Shifting from a capital driven to an organic growth strategy – with an emphasis on profitable revenue growth
Committed to building a profitable business with sustainable underlying growth, regardless of economic conditions
Willingness to invest EBITDA in key growth areas where we have strong people and strong positions
Believe we are on a path towards double-digit year-over-year Adjusted EPS growth
| 4 |
|
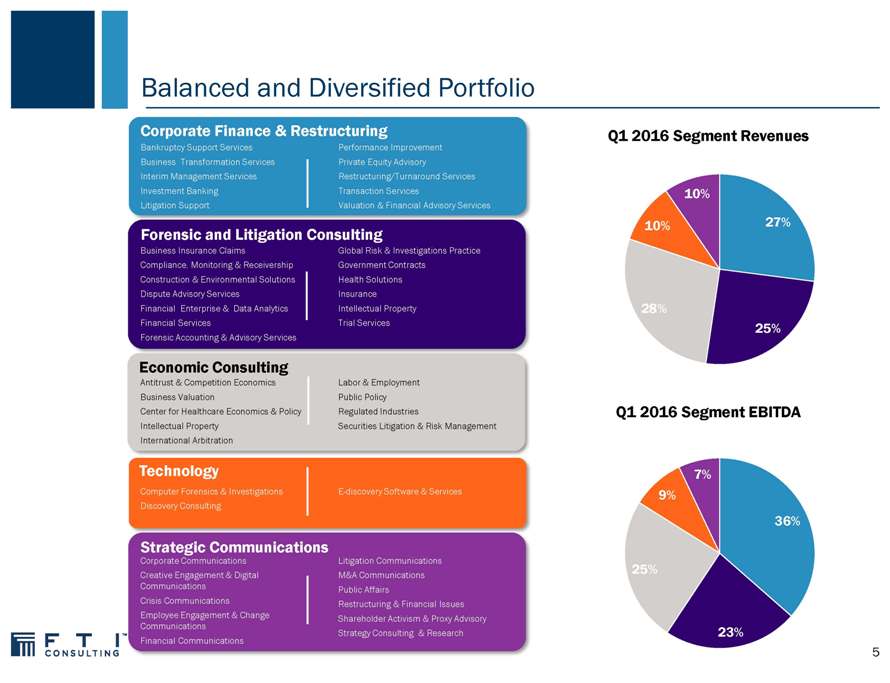
Balanced and Diversified Portfolio
Corporate Finance & Restructuring
Bankruptcy Support Services Performance Improvement Business Transformation Services Private Equity Advisory
Interim Management Services Restructuring/Turnaround Services Investment Banking Transaction Services Litigation Support Valuation & Financial Advisory Services
Forensic and Litigation Consulting
Business Insurance Claims Global Risk & Investigations Practice Compliance, Monitoring & Receivership Government Contracts Construction & Environmental Solutions Health Solutions Dispute Advisory Services Insurance Financial Enterprise & Data Analytics Intellectual Property Financial Services Trial Services Forensic Accounting & Advisory Services
Economic Consulting
Antitrust & Competition Economics Labor & Employment Business Valuation Public Policy Center for Healthcare Economics & Policy Regulated Industries
Intellectual Property Securities Litigation & Risk Management International Arbitration
Technology
Computer Forensics & Investigations E-discovery Software & Services Discovery Consulting
Strategic Communications
Corporate Communications Litigation Communications Creative Engagement & Digital M&A Communications Communications Public Affairs Crisis Communications Restructuring & Financial Issues Employee Engagement & Change Shareholder Activism & Proxy Advisory Communications Strategy Consulting & Research Financial Communications
Q1 2016 Segment Revenues
10%
10% 27%
28%
25%
Q1 2016 Segment EBITDA
7% 9%
36%
25%
23%
| 5 |
|
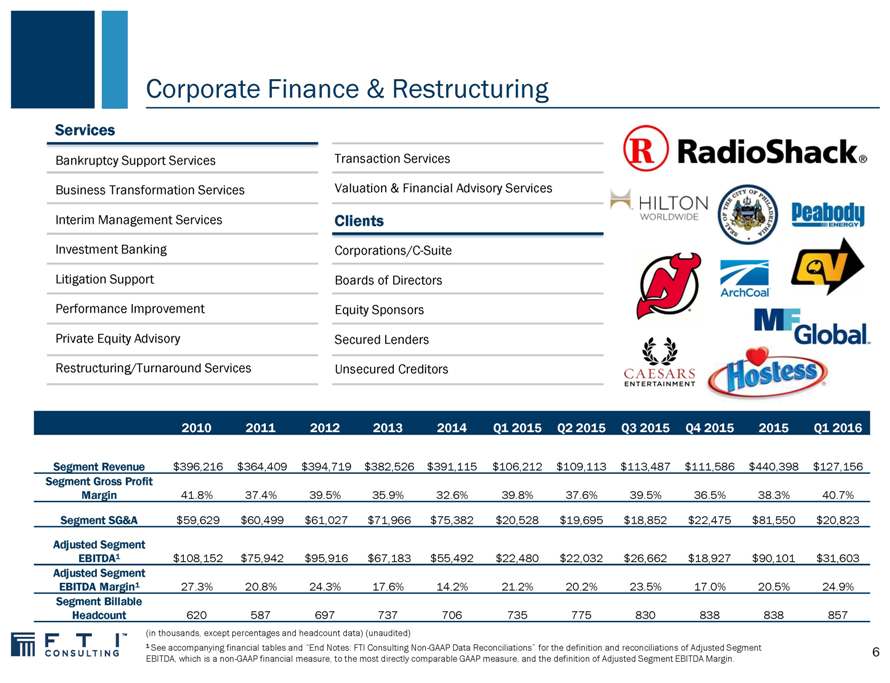
Corporate Finance & Restructuring
Services
Bankruptcy Support Services Business Transformation Services Interim Management Services Investment Banking Litigation Support Performance Improvement Private Equity Advisory Restructuring/Turnaround Services
Transaction Services
Valuation & Financial Advisory Services
Clients
Corporations/C-Suite Boards of Directors Equity Sponsors Secured Lenders Unsecured Creditors
2010 2011 2012 2013 2014 Q1 2015 Q2 2015 Q3 2015 Q4 2015 2015 Q1 2016
Segment Revenue $396,216 $364,409 $394,719 $382,526 $391,115 $106,212 $109,113 $113,487 $111,586 $440,398 $127,156
Segment Gross Profit
Margin 41.8% 37.4% 39.5% 35.9% 32.6% 39.8% 37.6% 39.5% 36.5% 38.3% 40.7%
Segment SG&A $59,629 $60,499 $61,027 $71,966 $75,382 $20,528 $19,695 $18,852 $22,475 $81,550 $20,823
Adjusted Segment
EBITDA1 $108,152 $75,942 $95,916 $67,183 $55,492 $22,480 $22,032 $26,662 $18,927 $90,101 $31,603
Adjusted Segment
EBITDA Margin1 27.3% 20.8% 24.3% 17.6% 14.2% 21.2% 20.2% 23.5% 17.0% 20.5% 24.9%
Segment Billable
Headcount 620 587 697 737 706 735 775 830 838 838 857
(in thousands, except percentages and headcount data) (unaudited)
1 See accompanying financial tables and “End Notes: FTI Consulting Non-GAAP Data Reconciliations” for the definition and reconciliations of Adjusted Segment
EBITDA, which is a non-GAAP financial measure, to the most directly comparable GAAP measure, and the definition of Adjusted Segment EBITDA Margin.
| 6 |
|
Corporate Finance & Restructuring (continued)
Segment Offering
The Corporate Finance & Restructuring segment focuses on strategic, operational, financial and capital needs of businesses by addressing the full spectrum of financial and transactional challenges faced by companies, boards, private equity sponsors, creditor constituencies and other stakeholders.
Medium–Term Initiatives
Reinforce core positions e.g., TMT, retail, company-side, interim management, creditor rights
Drive organic growth in new/adjacent businesses where we have the right to win, e.g., Office of the CFO, carve out
Drive overseas bets to fruition e.g., EMEA transaction advisory services, EMEA Tax
Focus on profitability enhancements e.g., geographic rationalization, cost control, engagement profitability improvements
Q1 2016 Form 10–Q Management’s Discussion & Analysis
Revenues increased $20.9 million, or 19.7%, to $127.2 million for the three months ended March 31, 2016, which included a 1.9% estimated negative impact from foreign currency translation.
? Excluding the estimated impact of foreign currency translation, revenues increased by $23.0 million, or 21.6%.
? This increase was primarily driven by higher demand and realized rates for the segment’s distressed service offerings in
North America.
Gross profit increased $9.4 million, or 22.3%, to $51.7 million for the three months ended March 31, 2016. Gross profit margin increased 0.9 percentage points for the three months ended March 31, 2016.
? Stronger demand, higher realized rates and success fees in North America distressed service offerings drove a majority of the increase.
Adjusted Segment EBITDA for the quarter was $31.6 million or
24.9% of revenues as compared to $22.5 million or 21.2% of revenues in the prior year quarter.
| 7 |
|
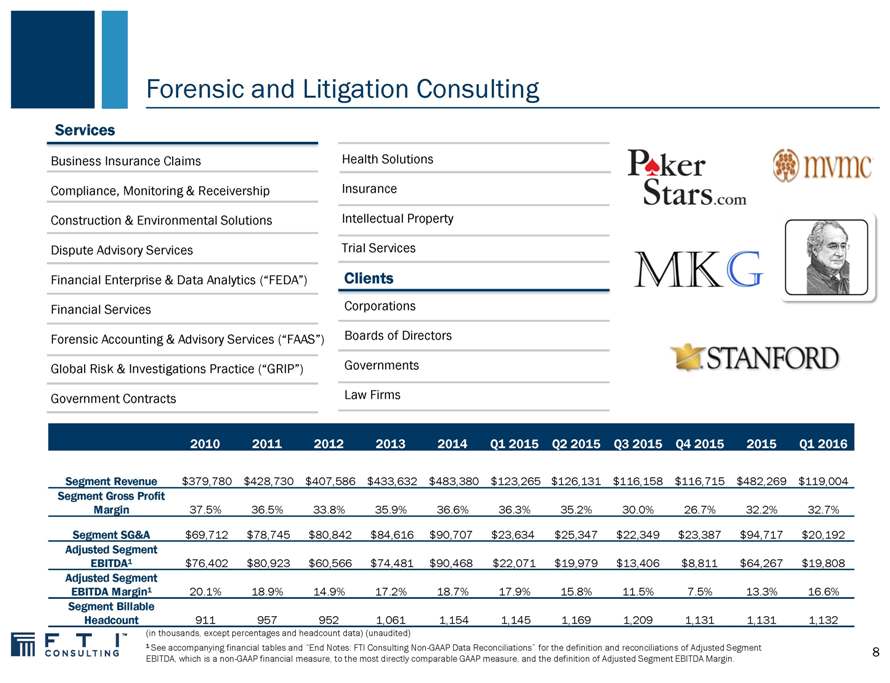
Forensic and Litigation Consulting
Services
Business Insurance Claims
Compliance, Monitoring & Receivership Construction & Environmental Solutions Dispute Advisory Services Financial Enterprise & Data Analytics (“FEDA”) Financial Services Forensic Accounting & Advisory Services (“FAAS”) Global Risk & Investigations Practice (“GRIP”) Government Contracts
Health Solutions Insurance Intellectual Property Trial Services
Clients
Corporations Boards of Directors Governments Law Firms
2010 2011 2012 2013 2014 Q1 2015 Q2 2015 Q3 2015 Q4 2015 2015 Q1 2016
Segment Revenue $379,780 $428,730 $407,586 $433,632 $483,380 $123,265 $126,131 $116,158 $116,715 $482,269 $119,004
Segment Gross Profit
Margin 37.5% 36.5% 33.8% 35.9% 36.6% 36.3% 35.2% 30.0% 26.7% 32.2% 32.7%
Segment SG&A $69,712 $78,745 $80,842 $84,616 $90,707 $23,634 $25,347 $22,349 $23,387 $94,717 $20,192
Adjusted Segment
EBITDA1 $76,402 $80,923 $60,566 $74,481 $90,468 $22,071 $19,979 $13,406 $8,811 $64,267 $19,808
Adjusted Segment
EBITDA Margin1 20.1% 18.9% 14.9% 17.2% 18.7% 17.9% 15.8% 11.5% 7.5% 13.3% 16.6%
Segment Billable
Headcount 911 957 952 1,061 1,154 1,145 1,169 1,209 1,131 1,131 1,132
(in thousands, except percentages and headcount data) (unaudited)
1 See accompanying financial tables and “End Notes: FTI Consulting Non-GAAP Data Reconciliations” for the definition and reconciliations of Adjusted Segment
EBITDA, which is a non-GAAP financial measure, to the most directly comparable GAAP measure, and the definition of Adjusted Segment EBITDA Margin.
| 8 |
|
Forensic and Litigation Consulting (continued)
Segment Offering
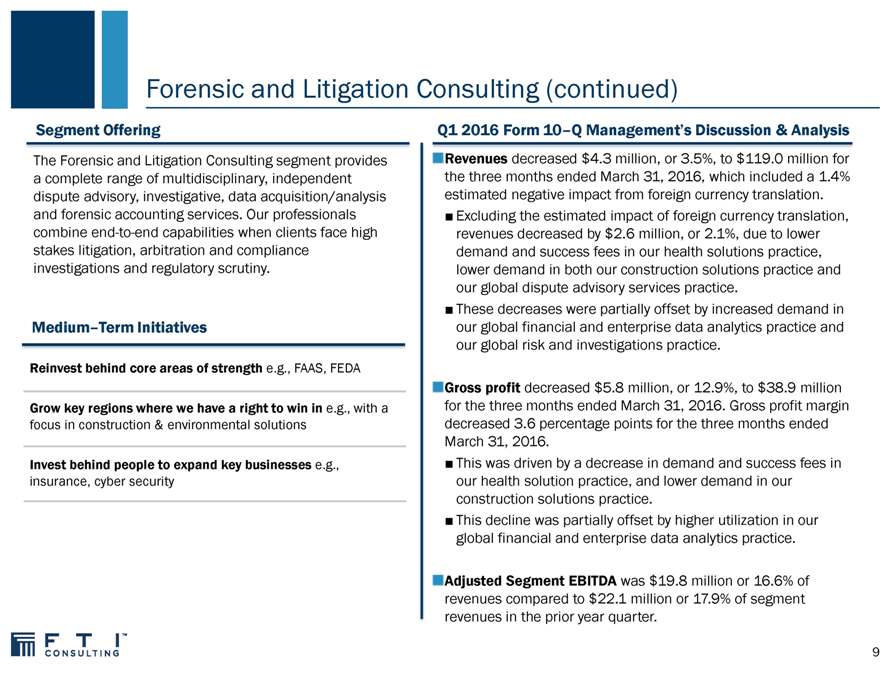
The Forensic and Litigation Consulting segment provides a complete range of multidisciplinary, independent dispute advisory, investigative, data acquisition/analysis and forensic accounting services. Our professionals combine end-to-end capabilities when clients face high stakes litigation, arbitration and compliance investigations and regulatory scrutiny.
Medium–Term Initiatives
Reinvest behind core areas of strength e.g., FAAS, FEDA
Grow key regions where we have a right to win in e.g., with a focus in construction & environmental solutions
Invest behind people to expand key businesses e.g., insurance, cyber security
Q1 2016 Form 10–Q Management’s Discussion & Analysis
Revenues decreased $4.3 million, or 3.5%, to $119.0 million for the three months ended March 31, 2016, which included a 1.4% estimated negative impact from foreign currency translation.
? Excluding the estimated impact of foreign currency translation, revenues decreased by $2.6 million, or 2.1%, due to lower demand and success fees in our health solutions practice, lower demand in both our construction solutions practice and our global dispute advisory services practice.
? These decreases were partially offset by increased demand in our global financial and enterprise data analytics practice and our global risk and investigations practice.
Gross profit decreased $5.8 million, or 12.9%, to $38.9 million for the three months ended March 31, 2016. Gross profit margin decreased 3.6 percentage points for the three months ended
March 31, 2016.
? This was driven by a decrease in demand and success fees in our health solution practice, and lower demand in our construction solutions practice.
? This decline was partially offset by higher utilization in our global financial and enterprise data analytics practice.
Adjusted Segment EBITDA was $19.8 million or 16.6% of revenues compared to $22.1 million or 17.9% of segment revenues in the prior year quarter.
9
Economic Consulting
Services
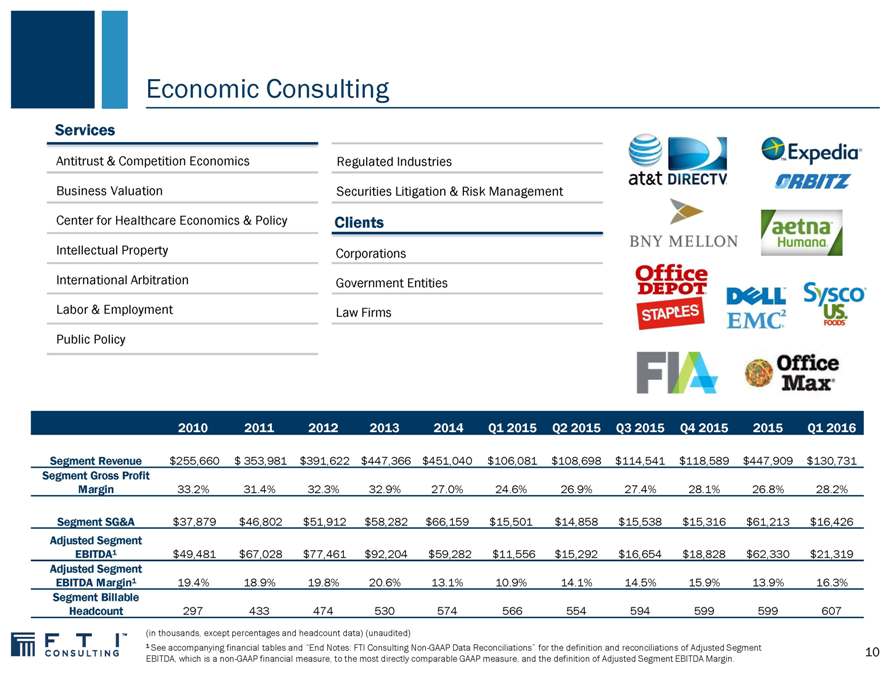
Antitrust & Competition Economics Business Valuation Center for Healthcare Economics & Policy Intellectual Property International Arbitration Labor & Employment Public Policy
Regulated Industries
Securities Litigation & Risk Management
Clients
Corporations
Government Entities
Law Firms
2010 2011 2012 2013 2014 Q1 2015 Q2 2015 Q3 2015 Q4 2015 2015 Q1 2016
Segment Revenue $255,660 $ 353,981 $391,622 $447,366 $451,040 $106,081 $108,698 $114,541 $118,589 $447,909 $130,731
Segment Gross Profit
Margin 33.2% 31.4% 32.3% 32.9% 27.0% 24.6% 26.9% 27.4% 28.1% 26.8% 28.2%
Segment SG&A $37,879 $46,802 $51,912 $58,282 $66,159 $15,501 $14,858 $15,538 $15,316 $61,213 $16,426
Adjusted Segment
EBITDA1 $49,481 $67,028 $77,461 $92,204 $59,282 $11,556 $15,292 $16,654 $18,828 $62,330 $21,319
Adjusted Segment
EBITDA Margin1 19.4% 18.9% 19.8% 20.6% 13.1% 10.9% 14.1% 14.5% 15.9% 13.9% 16.3%
Segment Billable
Headcount 297 433 474 530 574 566 554 594 599 599 607
(in thousands, except percentages and headcount data) (unaudited)
1 See accompanying financial tables and “End Notes: FTI Consulting Non-GAAP Data Reconciliations” for the definition and reconciliations of Adjusted Segment
EBITDA, which is a non-GAAP financial measure, to the most directly comparable GAAP measure, and the definition of Adjusted Segment EBITDA Margin.
10
Economic Consulting (continued)
Segment Offering
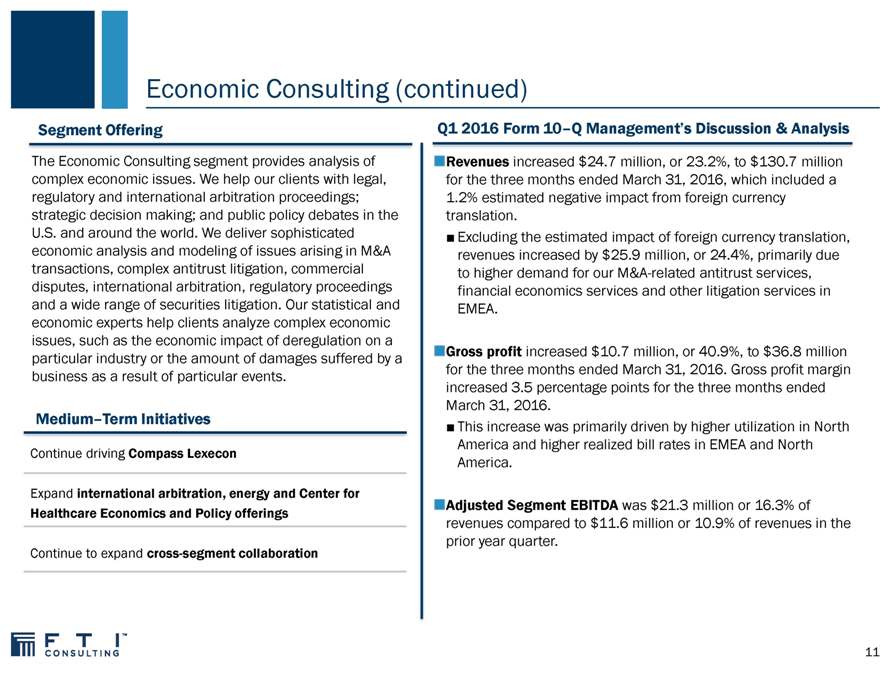
The Economic Consulting segment provides analysis of complex economic issues. We help our clients with legal, regulatory and international arbitration proceedings; strategic decision making; and public policy debates in the U.S. and around the world. We deliver sophisticated economic analysis and modeling of issues arising in M&A transactions, complex antitrust litigation, commercial disputes, international arbitration, regulatory proceedings and a wide range of securities litigation. Our statistical and economic experts help clients analyze complex economic issues, such as the economic impact of deregulation on a particular industry or the amount of damages suffered by a business as a result of particular events.
Medium–Term Initiatives
Continue driving Compass Lexecon
Expand international arbitration, energy and Center for Healthcare Economics and Policy offerings
Continue to expand cross-segment collaboration
Q1 2016 Form 10–Q Management’s Discussion & Analysis
Revenues increased $24.7 million, or 23.2%, to $130.7 million for the three months ended March 31, 2016, which included a 1.2% estimated negative impact from foreign currency translation.
? Excluding the estimated impact of foreign currency translation, revenues increased by $25.9 million, or 24.4%, primarily due to higher demand for our M&A-related antitrust services, financial economics services and other litigation services in EMEA.
Gross profit increased $10.7 million, or 40.9%, to $36.8 million for the three months ended March 31, 2016. Gross profit margin increased 3.5 percentage points for the three months ended March 31, 2016.
? This increase was primarily driven by higher utilization in North America and higher realized bill rates in EMEA and North America.
Adjusted Segment EBITDA was $21.3 million or 16.3% of revenues compared to $11.6 million or 10.9% of revenues in the prior year quarter.
11
Technology
Software & Services
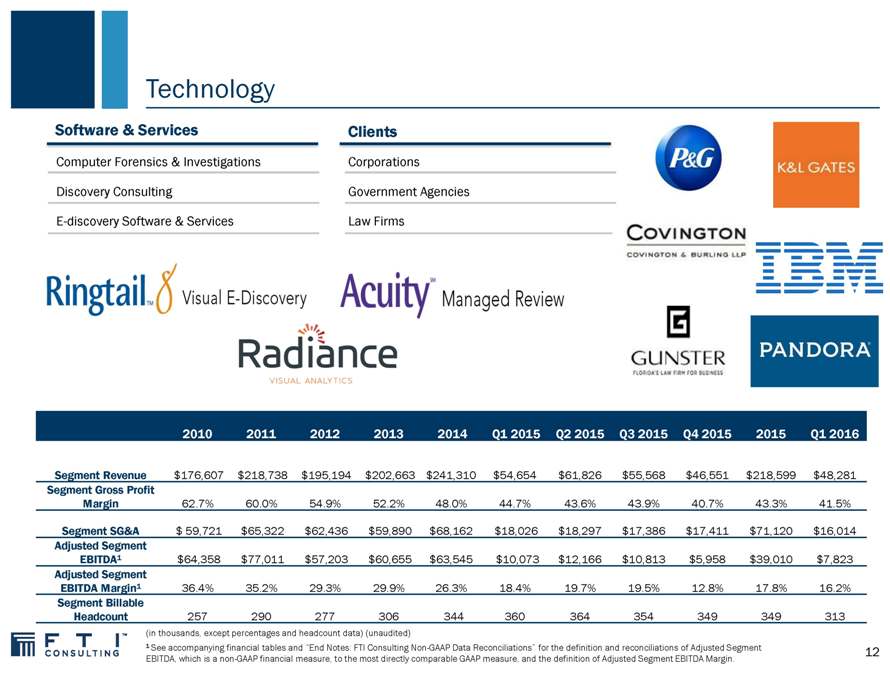
Computer Forensics & Investigations Discovery Consulting E-discovery Software & Services
Clients
Corporations
Government Agencies
Law Firms
2010 2011 2012 2013 2014 Q1 2015 Q2 2015 Q3 2015 Q4 2015 2015 Q1 2016
Segment Revenue $176,607 $218,738 $195,194 $202,663 $241,310 $54,654 $61,826 $55,568 $46,551 $218,599 $48,281
Segment Gross Profit
Margin 62.7% 60.0% 54.9% 52.2% 48.0% 44.7% 43.6% 43.9% 40.7% 43.3% 41.5%
Segment SG&A $ 59,721 $65,322 $62,436 $59,890 $68,162 $18,026 $18,297 $17,386 $17,411 $71,120 $16,014
Adjusted Segment
EBITDA1 $64,358 $77,011 $57,203 $60,655 $63,545 $10,073 $12,166 $10,813 $5,958 $39,010 $7,823
Adjusted Segment
EBITDA Margin1 36.4% 35.2% 29.3% 29.9% 26.3% 18.4% 19.7% 19.5% 12.8% 17.8% 16.2%
Segment Billable
Headcount 257 290 277 306 344 360 364 354 349 349 313
(in thousands, except percentages and headcount data) (unaudited)
1 See accompanying financial tables and “End Notes: FTI Consulting Non-GAAP Data Reconciliations” for the definition and reconciliations of Adjusted Segment
EBITDA, which is a non-GAAP financial measure, to the most directly comparable GAAP measure, and the definition of Adjusted Segment EBITDA Margin.
12
Technology (continued)
Segment Offering
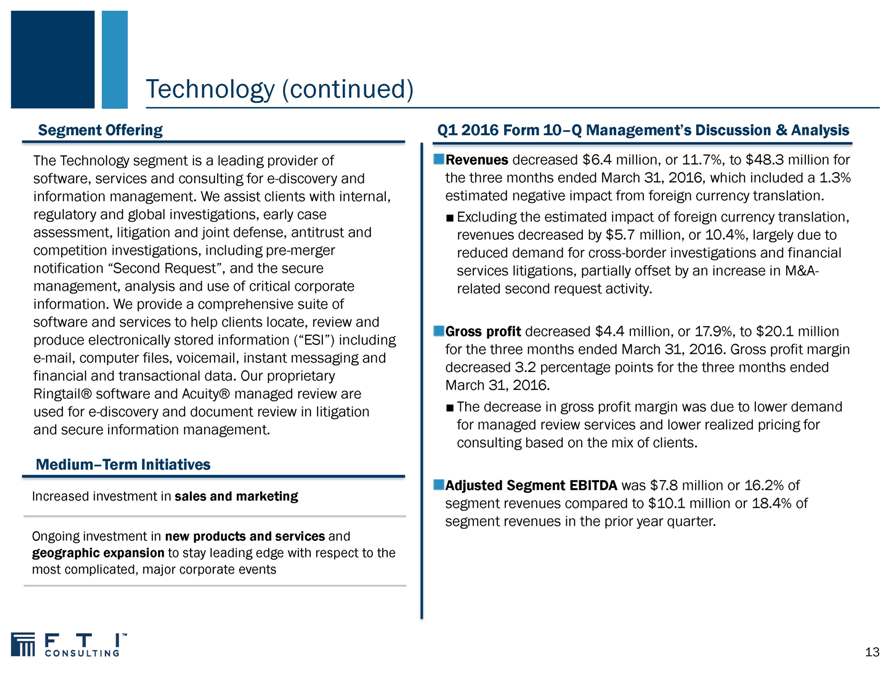
The Technology segment is a leading provider of software, services and consulting for e-discovery and information management. We assist clients with internal, regulatory and global investigations, early case assessment, litigation and joint defense, antitrust and competition investigations, including pre-merger notification “Second Request”, and the secure management, analysis and use of critical corporate information. We provide a comprehensive suite of software and services to help clients locate, review and produce electronically stored information (“ESI”) including e-mail, computer files, voicemail, instant messaging and financial and transactional data. Our proprietary Ringtail® software and Acuity® managed review are used for e-discovery and document review in litigation and secure information management.
Medium–Term Initiatives
Increased investment in sales and marketing
Ongoing investment in new products and services and geographic expansion to stay leading edge with respect to the most complicated, major corporate events
Q1 2016 Form 10–Q Management’s Discussion & Analysis
Revenues decreased $6.4 million, or 11.7%, to $48.3 million for the three months ended March 31, 2016, which included a 1.3% estimated negative impact from foreign currency translation.
? Excluding the estimated impact of foreign currency translation, revenues decreased by $5.7 million, or 10.4%, largely due to reduced demand for cross-border investigations and financial services litigations, partially offset by an increase in M&A-related second request activity.
Gross profit decreased $4.4 million, or 17.9%, to $20.1 million for the three months ended March 31, 2016. Gross profit margin decreased 3.2 percentage points for the three months ended March 31, 2016.
? The decrease in gross profit margin was due to lower demand for managed review services and lower realized pricing for consulting based on the mix of clients.
Adjusted Segment EBITDA was $7.8 million or 16.2% of segment revenues compared to $10.1 million or 18.4% of segment revenues in the prior year quarter.
13
Strategic Communications
Services
Corporate Communications
Creative Engagement & Digital Communications Crisis Communications Employee Engagement & Change Communications Financial Communications Litigation Communications M&A Communications Public Affairs Restructuring & Financial Issues
Shareholder Activism & Proxy Advisory
Strategy Consulting & Research
Clients
CEOs
CFOs
Chief Communications Officers Investor Relations Officers Boards of Directors
2010 2011 2012 2013 2014 Q1 2015 Q2 2015 Q3 2015 Q4 2015 2015 Q1 2016
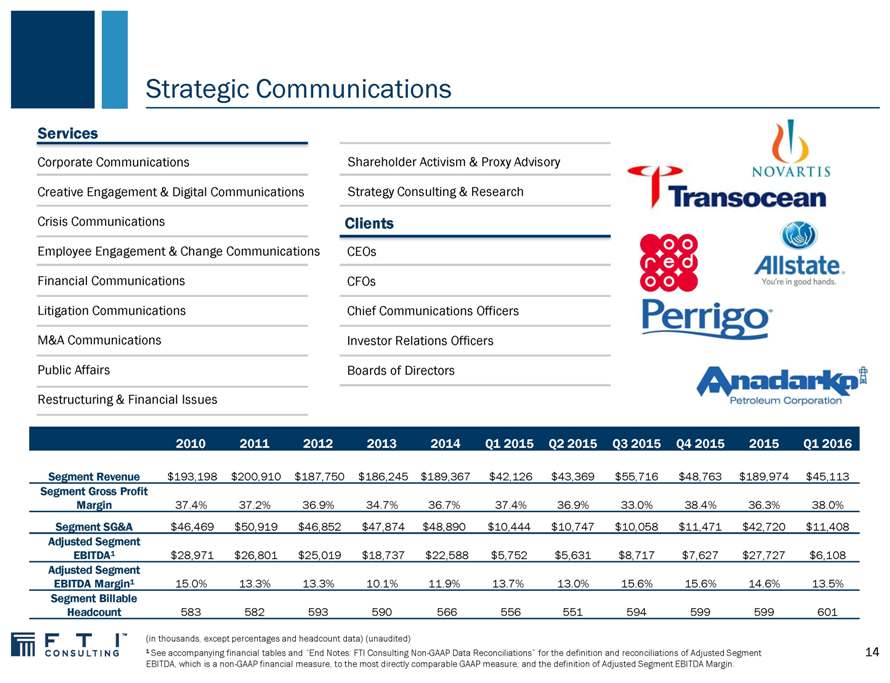
Segment Revenue $193,198 $200,910 $187,750 $186,245 $189,367 $42,126 $43,369 $55,716 $48,763 $189,974 $45,113
Segment Gross Profit
Margin 37.4% 37.2% 36.9% 34.7% 36.7% 37.4% 36.9% 33.0% 38.4% 36.3% 38.0% Segment SG&A $46,469 $50,919 $46,852 $47,874 $48,890 $10,444 $10,747 $10,058 $11,471 $42,720 $11,408
Adjusted Segment
EBITDA1 $28,971 $26,801 $25,019 $18,737 $22,588 $5,752 $5,631 $8,717 $7,627 $27,727 $6,108
Adjusted Segment
EBITDA Margin1 15.0% 13.3% 13.3% 10.1% 11.9% 13.7% 13.0% 15.6% 15.6% 14.6% 13.5%
Segment Billable
Headcount 583 582 593 590 566 556 551 594 599 599 601
(in thousands, except percentages and headcount data) (unaudited)
1 See accompanying financial tables and “End Notes: FTI Consulting Non-GAAP Data Reconciliations” for the definition and reconciliations of Adjusted Segment
EBITDA, which is a non-GAAP financial measure, to the most directly comparable GAAP measure, and the definition of Adjusted Segment EBITDA Margin.
14
Strategic Communications (continued)
Segment Offering
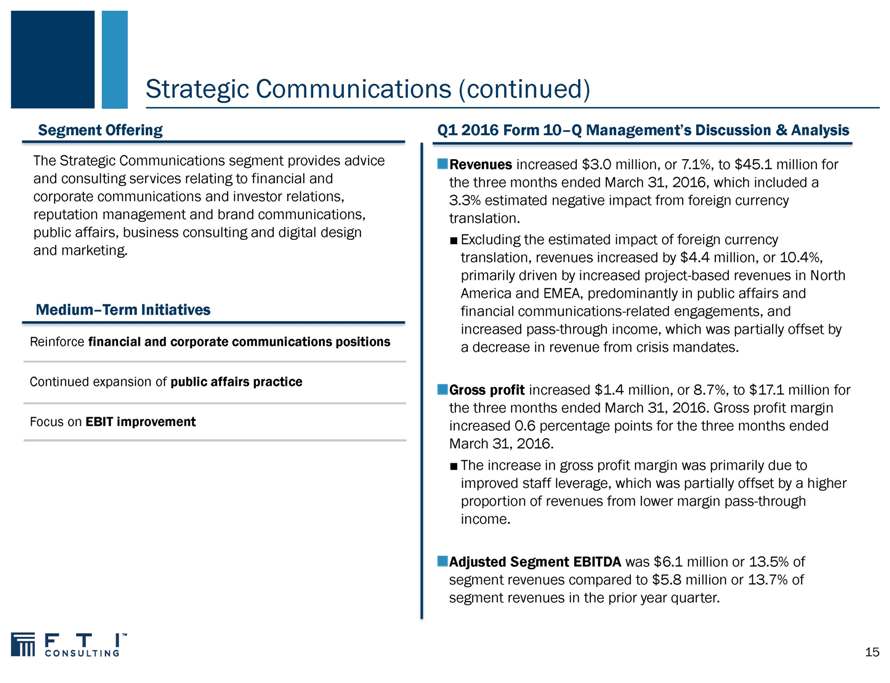
The Strategic Communications segment provides advice and consulting services relating to financial and corporate communications and investor relations, reputation management and brand communications, public affairs, business consulting and digital design and marketing.
Medium–Term Initiatives
Reinforce financial and corporate communications positions
Continued expansion of public affairs practice
Focus on EBIT improvement
Q1 2016 Form 10–Q Management’s Discussion & Analysis
Revenues increased $3.0 million, or 7.1%, to $45.1 million for the three months ended March 31, 2016, which included a 3.3% estimated negative impact from foreign currency translation.
? Excluding the estimated impact of foreign currency translation, revenues increased by $4.4 million, or 10.4%, primarily driven by increased project-based revenues in North America and EMEA, predominantly in public affairs and financial communications-related engagements, and increased pass-through income, which was partially offset by a decrease in revenue from crisis mandates.
Gross profit increased $1.4 million, or 8.7%, to $17.1 million for the three months ended March 31, 2016. Gross profit margin increased 0.6 percentage points for the three months ended March 31, 2016.
? The increase in gross profit margin was primarily due to improved staff leverage, which was partially offset by a higher proportion of revenues from lower margin pass-through income.
Adjusted Segment EBITDA was $6.1 million or 13.5% of segment revenues compared to $5.8 million or 13.7% of segment revenues in the prior year quarter.
15

Financial Overview
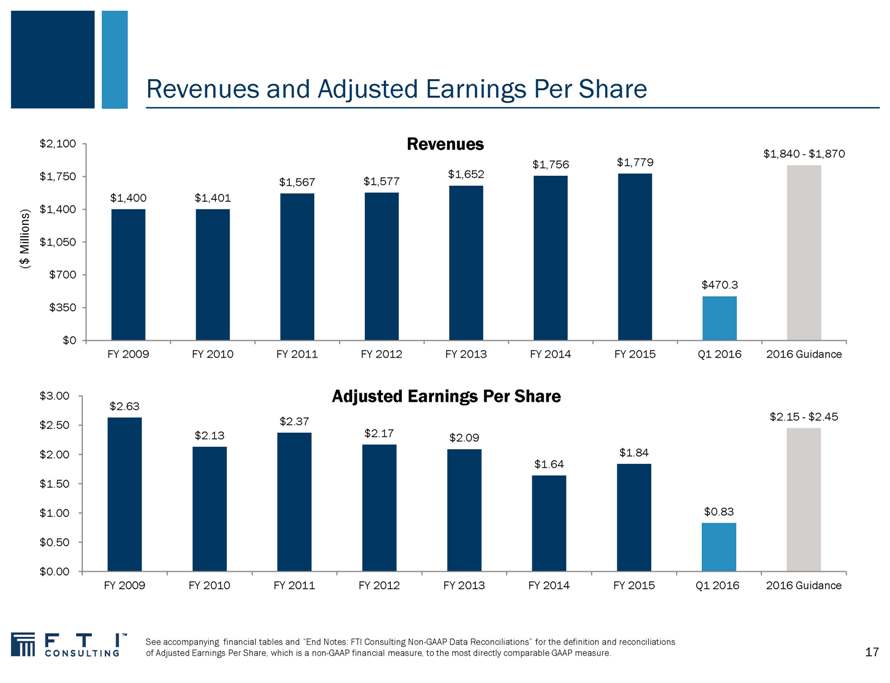
Revenues and Adjusted Earnings Per Share
$2,100 Revenues $1,840—$1,870 $1,756 $1,779 $1,750 $1,652 $1,567 $1,577 $1,400 $1,401 $1,400
Millions) $1,050 $ ( $700 $470.3 $350
$0
FY 2009 FY 2010 FY 2011 FY 2012 FY 2013 FY 2014 FY 2015 Q1 2016 2016 Guidance
$3.00 $2.63 Adjusted Earnings Per Share
$2.37 $2.15—$2.45
$2.50
$2.13 $2.17 $2.09
$2.00 $1.84
$1.64
$1.50
$1.00 $0.83
$0.50
$0.00
FY 2009 FY 2010 FY 2011 FY 2012 FY 2013 FY 2014 FY 2015 Q1 2016 2016 Guidance
See accompanying financial tables and “End Notes: FTI Consulting Non-GAAP Data Reconciliations” for the definition and reconciliations of Adjusted Earnings Per Share, which is a non-GAAP financial measure, to the most directly comparable GAAP measure.
17
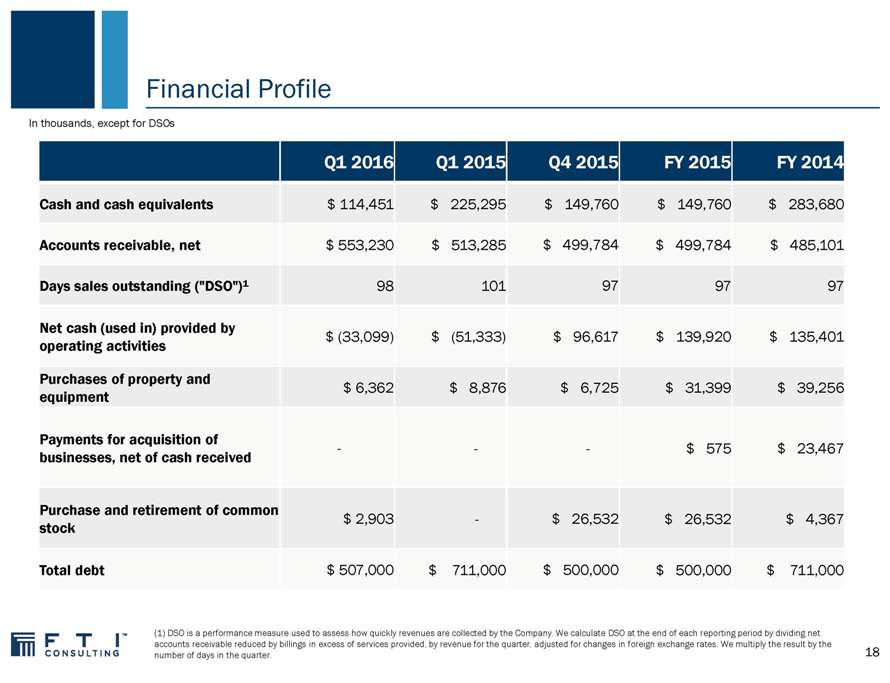
Financial Profile
In thousands, except for DSOs
Q1 2016 Q1 2015 Q4 2015 FY 2015 FY 2014
Cash and cash equivalents $ 114,451 $ 225,295 $ 149,760 $ 149,760 $ 283,680
Accounts receivable, net $ 553,230 $ 513,285 $ 499,784 $ 499,784 $ 485,101
Days sales outstanding (“DSO”)1 98 101 97 97 97
Net cash (used in) provided by $ (33,099) $ (51,333) $ 96,617 $ 139,920 $ 135,401 operating activities
Purchases of property and $ 6,362 $ 8,876 $ 6,725 $ 31,399 $ 39,256 equipment
Payments for acquisition of
— — — $ 575 $ 23,467 businesses, net of cash received
Purchase and retirement of common $ 2,903 — $ 26,532 $ 26,532 $ 4,367 stock
Total debt $ 507,000 $ 711,000 $ 500,000 $ 500,000 $ 711,000
(1) DSO is a performance measure used to assess how quickly revenues are collected by the Company. We calculate DSO at the end of each reporting period by dividing net accounts receivable reduced by billings in excess of services provided, by revenue for the quarter, adjusted for changes in foreign exchange rates. We multiply the result by the number of days in the quarter.
18

Appendix
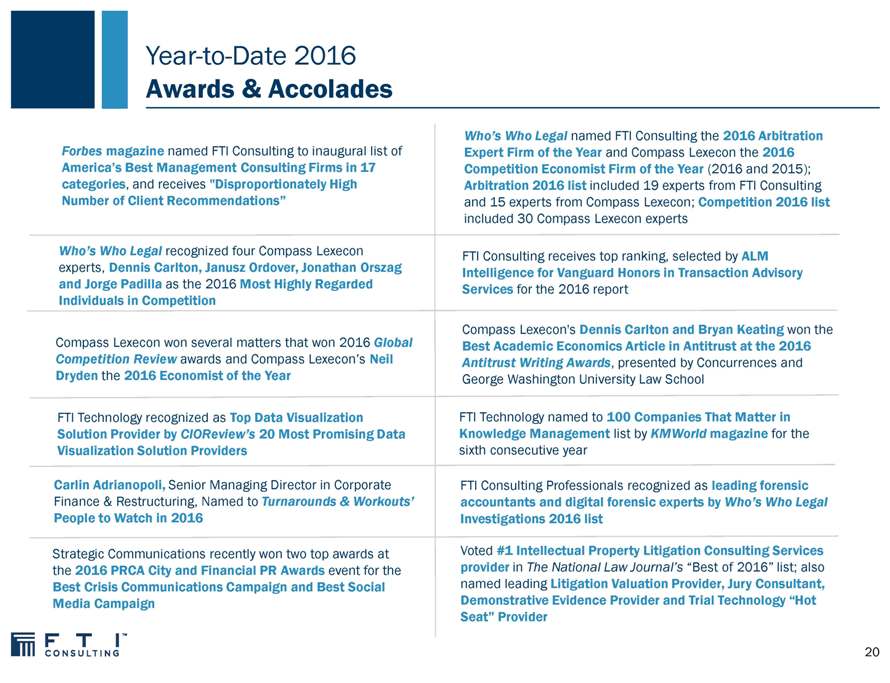
Year-to-Date 2016
Awards & Accolades
Forbes magazine named FTI Consulting to inaugural list of
America’s Best Management Consulting Firms in 17 categories, and receives “Disproportionately High
Number of Client Recommendations”
Who’s Who Legal recognized four Compass Lexecon experts, Dennis Carlton, Janusz Ordover, Jonathan Orszag and Jorge Padilla as the 2016 Most Highly Regarded Individuals in Competition
Compass Lexecon won several matters that won 2016 Global
Competition Review awards and Compass Lexecon’s Neil
Dryden the 2016 Economist of the Year
FTI Technology recognized as Top Data Visualization Solution Provider by CIOReview’s 20 Most Promising Data Visualization Solution Providers
Carlin Adrianopoli, Senior Managing Director in Corporate Finance & Restructuring, Named to Turnarounds & Workouts’
People to Watch in 2016
Strategic Communications recently won two top awards at the 2016 PRCA City and Financial PR Awards event for the Best Crisis Communications Campaign and Best Social Media Campaign
Who’s Who Legal named FTI Consulting the 2016 Arbitration Expert Firm of the Year and Compass Lexecon the 2016 Competition Economist Firm of the Year (2016 and 2015);
Arbitration 2016 list included 19 experts from FTI Consulting and 15 experts from Compass Lexecon; Competition 2016 list included 30 Compass Lexecon experts
FTI Consulting receives top ranking, selected by ALM Intelligence for Vanguard Honors in Transaction Advisory
Services for the 2016 report
Compass Lexecon’s Dennis Carlton and Bryan Keating won the Best Academic Economics Article in Antitrust at the 2016
Antitrust Writing Awards, presented by Concurrences and George Washington University Law School
FTI Technology named to 100 Companies That Matter in Knowledge Management list by KMWorld magazine for the sixth consecutive year
FTI Consulting Professionals recognized as leading forensic accountants and digital forensic experts by Who’s Who Legal Investigations 2016 list
Voted #1 Intellectual Property Litigation Consulting Services provider in The National Law Journal’s “Best of 2016” list; also named leading Litigation Valuation Provider, Jury Consultant,
Demonstrative Evidence Provider and Trial Technology “Hot Seat” Provider
20

Financial Tables
Q1 2016 – FY 2009 Reconciliations of Non-GAAP Financial Measures
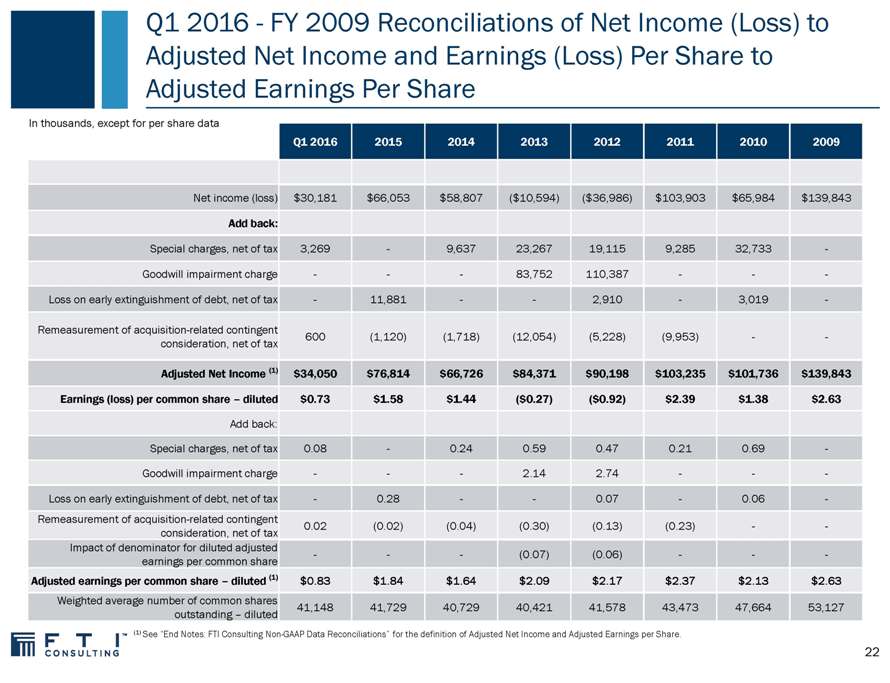
Q1 2016—FY 2009 Reconciliations of Net Income (Loss) to Adjusted Net Income and Earnings (Loss) Per Share to Adjusted Earnings Per Share
In thousands, except for per share data
Q1 2016 2015 2014 2013 2012 2011 2010 2009
Net income (loss) $30,181 $66,053 $58,807 ($10,594) ($36,986) $103,903 $65,984 $139,843
Add back:
Special charges, net of tax 3,269—9,637 23,267 19,115 9,285 32,733 —Goodwill impairment charge ——83,752 110,387 — — —Loss on early extinguishment of debt, net of tax—11,881 — 2,910 — 3,019 —
Remeasurement of acquisition-related contingent
600 (1,120) (1,718) (12,054) (5,228) (9,953)— —consideration, net of tax
Adjusted Net Income (1) $34,050 $76,814 $66,726 $84,371 $90,198 $103,235 $101,736 $139,843 Earnings (loss) per common share – diluted $0.73 $1.58 $1.44 ($0.27) ($0.92) $2.39 $1.38 $2.63
Add back:
Special charges, net of tax 0.08—0.24 0.59 0.47 0.21 0.69—
Goodwill impairment charge ——2.14 2.74— — —
Loss on early extinguishment of debt, net of tax—0.28 — 0.07 — 0.06 —Remeasurement of acquisition-related contingent 0.02 (0.02) (0.04) (0.30) (0.13) (0.23)— —consideration, net of tax Impact of denominator for diluted adjusted
——(0.07) (0.06)— — —earnings per common share
Adjusted earnings per common share – diluted (1) $0.83 $1.84 $1.64 $2.09 $2.17 $2.37 $2.13 $2.63
Weighted average number of common shares
41,148 41,729 40,729 40,421 41,578 43,473 47,664 53,127 outstanding – diluted
(1) See “End Notes: FTI Consulting Non-GAAP Data Reconciliations” for the definition of Adjusted Net Income and Adjusted Earnings per Share.
22
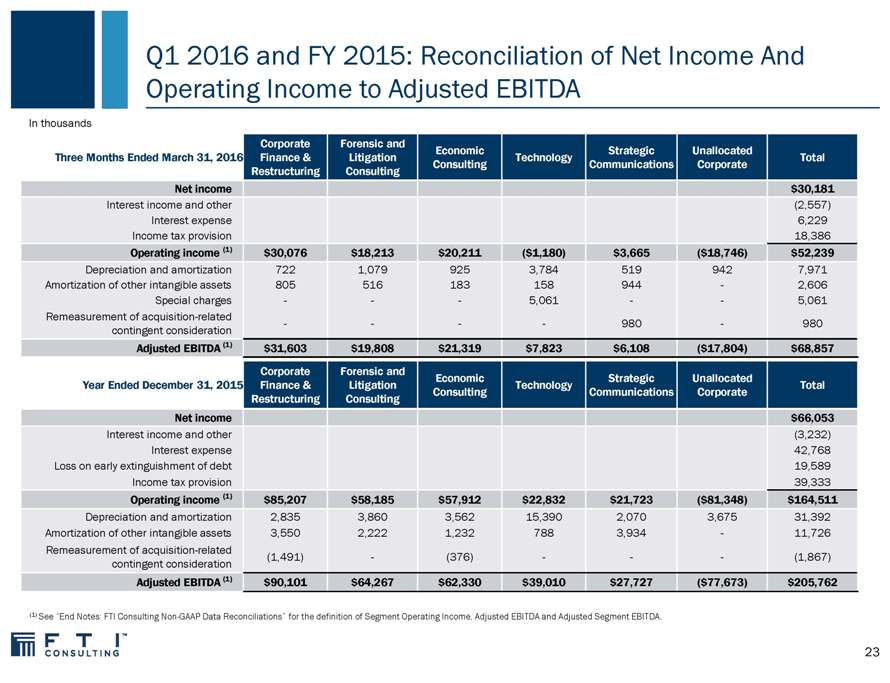
Q1 2016 and FY 2015: Reconciliation of Net Income And Operating Income to Adjusted EBITDA
In thousands
Corporate Forensic and
Economic Strategic Unallocated
Three Months Ended March 31, 2016 Finance & Litigation Technology Total Consulting Communications Corporate Restructuring Consulting Net income $30,181
Interest income and other (2,557) Interest expense 6,229 Income tax provision 18,386
Operating income (1) $30,076 $18,213 $20,211 ($1,180) $3,665 ($18,746) $52,239
Depreciation and amortization 722 1,079 925 3,784 519 942 7,971 Amortization of other intangible assets 805 516 183 158 944—2,606 Special charges ——5,061 — 5,061 Remeasurement of acquisition-related
— — 980—980 contingent consideration
Adjusted EBITDA (1) $31,603 $19,808 $21,319 $7,823 $6,108 ($17,804) $68,857 Corporate Forensic and Economic Strategic Unallocated Year Ended December 31, 2015 Finance & Litigation Technology Total Consulting Communications Corporate Restructuring Consulting Net income $66,053
Interest income and other (3,232) Interest expense 42,768 Loss on early extinguishment of debt 19,589 Income tax provision 39,333
Operating income (1) $85,207 $58,185 $57,912 $22,832 $21,723 ($81,348) $164,511
Depreciation and amortization 2,835 3,860 3,562 15,390 2,070 3,675 31,392 Amortization of other intangible assets 3,550 2,222 1,232 788 3,934 —11,726 Remeasurement of acquisition-related (1,491)—(376) ——(1,867) contingent consideration
Adjusted EBITDA (1) $90,101 $64,267 $62,330 $39,010 $27,727 ($77,673) $205,762
(1) See “End Notes: FTI Consulting Non-GAAP Data Reconciliations” for the definition of Segment Operating Income, Adjusted EBITDA and Adjusted Segment EBITDA.
23
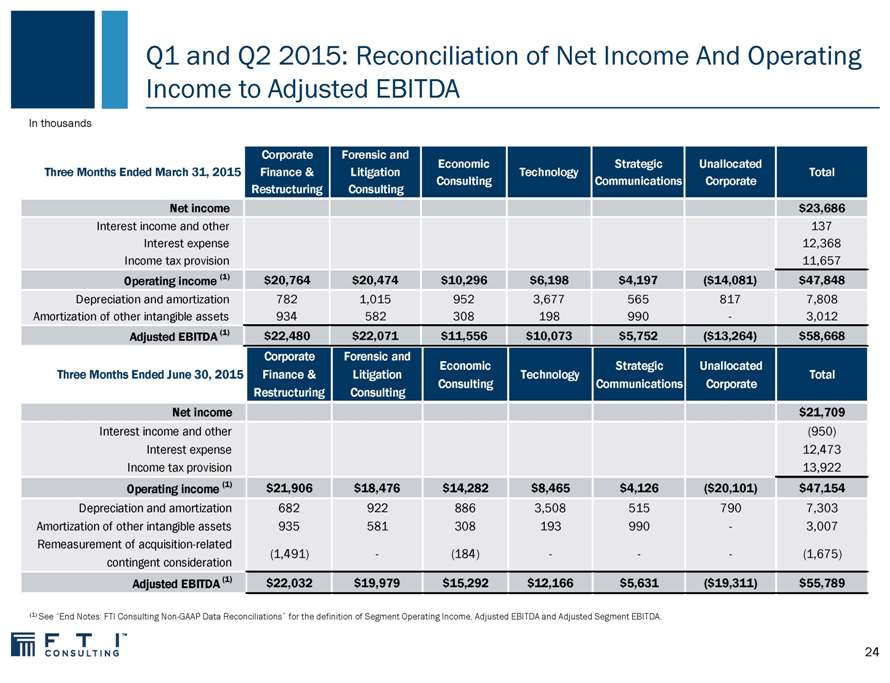
Q1 and Q2 2015: Reconciliation of Net Income And Operating Income to Adjusted EBITDA
In thousands
Corporate Forensic and
Economic Strategic Unallocated
Three Months Ended March 31, 2015 Finance & Litigation Technology Total Consulting Communications Corporate Restructuring Consulting Net income $23,686
Interest income and other 137 Interest expense 12,368 Income tax provision 11,657
Operating income (1) $20,764 $20,474 $10,296 $6,198 $4,197 ($14,081) $47,848
Depreciation and amortization 782 1,015 952 3,677 565 817 7,808 Amortization of other intangible assets 934 582 308 198 990—3,012
Adjusted EBITDA (1) $22,480 $22,071 $11,556 $10,073 $5,752 ($13,264) $58,668
Corporate Forensic and
Economic Strategic Unallocated
Three Months Ended June 30, 2015 Finance & Litigation Technology Total Consulting Communications Corporate Restructuring Consulting Net income $21,709
Interest income and other (950) Interest expense 12,473 Income tax provision 13,922
Operating income (1) $21,906 $18,476 $14,282 $8,465 $4,126 ($20,101) $47,154
Depreciation and amortization 682 922 886 3,508 515 790 7,303 Amortization of other intangible assets 935 581 308 193 990—3,007 Remeasurement of acquisition-related (1,491)—(184) ——(1,675) contingent consideration
Adjusted EBITDA (1) $22,032 $19,979 $15,292 $12,166 $5,631 ($19,311) $55,789
(1) See “End Notes: FTI Consulting Non-GAAP Data Reconciliations” for the definition of Segment Operating Income, Adjusted EBITDA and Adjusted Segment EBITDA.
24
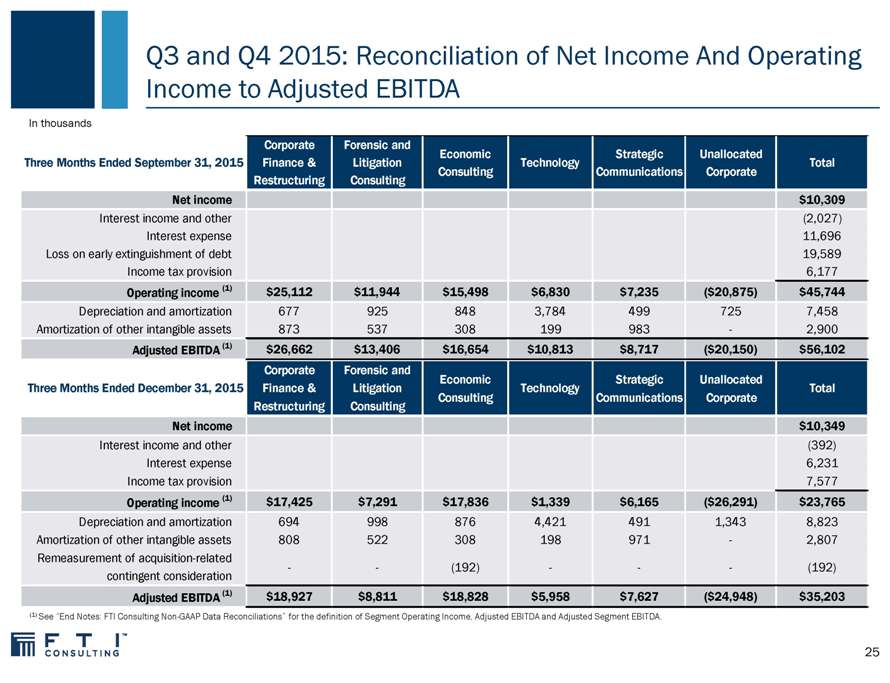
Q3 and Q4 2015: Reconciliation of Net Income And Operating Income to Adjusted EBITDA
In thousands
Corporate Forensic and
Economic Strategic Unallocated
Three Months Ended September 31, 2015 Finance & Litigation Technology Total Consulting Communications Corporate Restructuring Consulting Net income $10,309
Interest income and other (2,027) Interest expense 11,696 Loss on early extinguishment of debt 19,589 Income tax provision 6,177
Operating income (1) $25,112 $11,944 $15,498 $6,830 $7,235 ($20,875) $45,744
Depreciation and amortization 677 925 848 3,784 499 725 7,458 Amortization of other intangible assets 873 537 308 199 983—2,900
Adjusted EBITDA (1) $26,662 $13,406 $16,654 $10,813 $8,717 ($20,150) $56,102
Corporate Forensic and
Economic Strategic Unallocated
Three Months Ended December 31, 2015 Finance & Litigation Technology Total Consulting Communications Corporate Restructuring Consulting Net income $10,349
Interest income and other (392) Interest expense 6,231 Income tax provision 7,577
Operating income (1) $17,425 $7,291 $17,836 $1,339 $6,165 ($26,291) $23,765
Depreciation and amortization 694 998 876 4,421 491 1,343 8,823 Amortization of other intangible assets 808 522 308 198 971—2,807 Remeasurement of acquisition-related
— (192) ——(192) contingent consideration
Adjusted EBITDA (1) $18,927 $8,811 $18,828 $5,958 $7,627 ($24,948) $35,203
(1) See “End Notes: FTI Consulting Non-GAAP Data Reconciliations” for the definition of Segment Operating Income, Adjusted EBITDA and Adjusted Segment EBITDA.
25
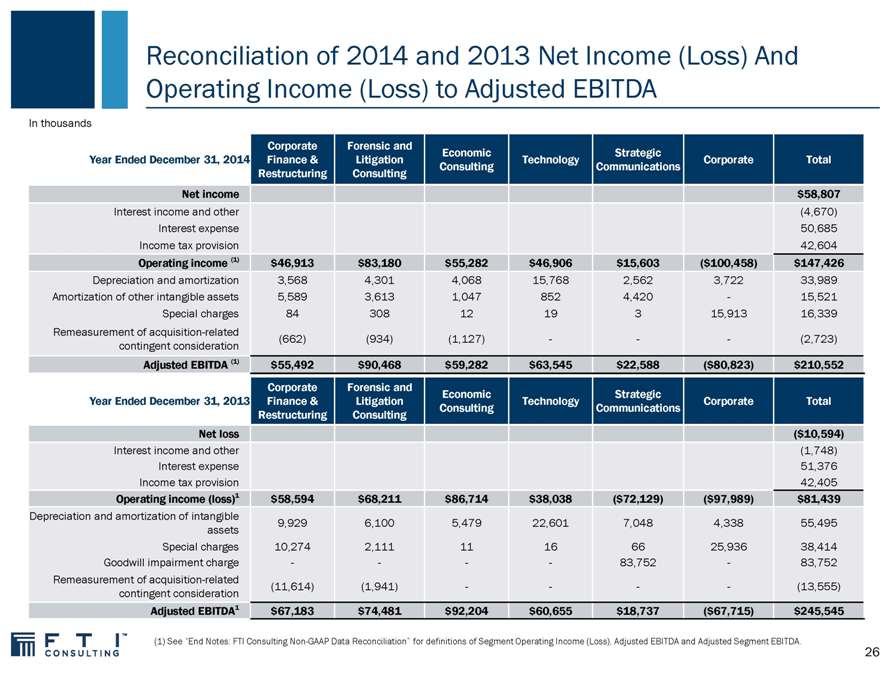
Reconciliation of 2014 and 2013 Net Income (Loss) And Operating Income (Loss) to Adjusted EBITDA
In thousands
Corporate Forensic and
Economic Strategic
Year Ended December 31, 2014 Finance & Litigation Technology Corporate Total Consulting Communications Restructuring Consulting Net income $58,807
Interest income and other (4,670) Interest expense 50,685 Income tax provision 42,604
Operating income (1) $46,913 $83,180 $55,282 $46,906 $15,603 ($100,458) $147,426
Depreciation and amortization 3,568 4,301 4,068 15,768 2,562 3,722 33,989 Amortization of other intangible assets 5,589 3,613 1,047 852 4,420 — 15,521 Special charges 84 308 12 19 3 15,913 16,339 Remeasurement of acquisition-related (662) (934) (1,127)——— (2,723) contingent consideration
Adjusted EBITDA (1) $55,492 $90,468 $59,282 $63,545 $22,588 ($80,823) $210,552 Corporate Forensic and Economic Strategic Year Ended December 31, 2013 Finance & Litigation Technology Corporate Total Consulting Communications Restructuring Consulting Net loss ($10,594)
Interest income and other (1,748) Interest expense 51,376 Income tax provision 42,405
Operating income (loss)1 $58,594 $68,211 $86,714 $38,038 ($72,129) ($97,989) $81,439
Depreciation and amortization of intangible
9,929 6,100 5,479 22,601 7,048 4,338 55,495 assets Special charges 10,274 2,111 11 16 66 25,936 38,414 Goodwill impairment charge———— 83,752 — 83,752 Remeasurement of acquisition-related (11,614) (1,941)———— (13,555) contingent consideration
Adjusted EBITDA1 $67,183 $74,481 $92,204 $60,655 $18,737 ($67,715) $245,545
(1) See “End Notes: FTI Consulting Non-GAAP Data Reconciliation” for definitions of Segment Operating Income (Loss), Adjusted EBITDA and Adjusted Segment EBITDA. 26
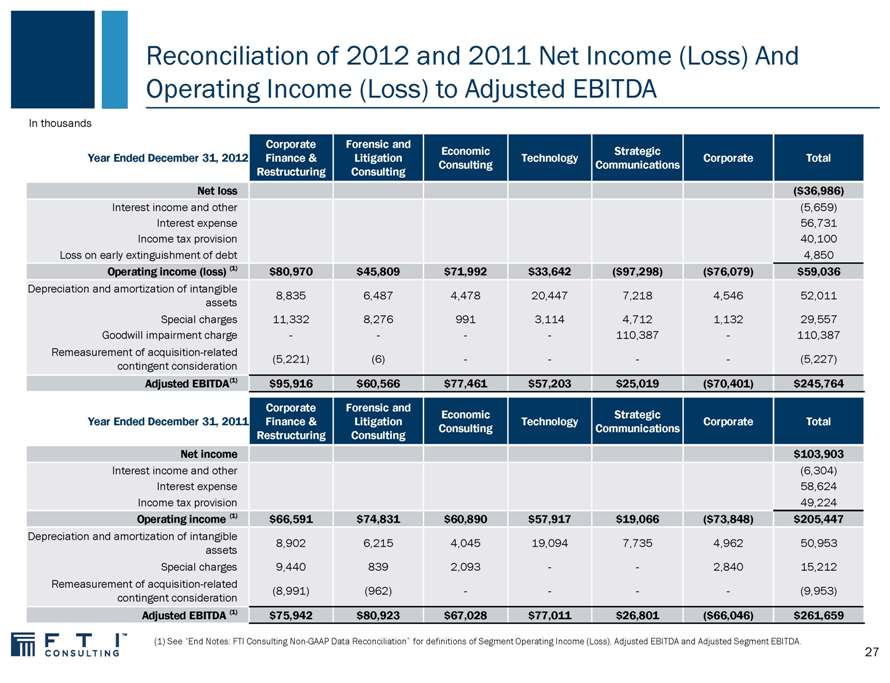
Reconciliation of 2012 and 2011 Net Income (Loss) And Operating Income (Loss) to Adjusted EBITDA
In thousands
Corporate Forensic and
Economic Strategic
Year Ended December 31, 2012 Finance & Litigation Technology Corporate Total Consulting Communications Restructuring Consulting Net loss ($36,986)
Interest income and other (5,659) Interest expense 56,731 Income tax provision 40,100 Loss on early extinguishment of debt 4,850
Operating income (loss) (1) $80,970 $45,809 $71,992 $33,642 ($97,298) ($76,079) $59,036
Depreciation and amortization of intangible
8,835 6,487 4,478 20,447 7,218 4,546 52,011 assets Special charges 11,332 8,276 991 3,114 4,712 1,132 29,557 Goodwill impairment charge———— 110,387 — 110,387 Remeasurement of acquisition-related (5,221) (6)———— (5,227) contingent consideration
Adjusted EBITDA(1) $95,916 $60,566 $77,461 $57,203 $25,019 ($70,401) $245,764 Corporate Forensic and Economic Strategic Year Ended December 31, 2011 Finance & Litigation Technology Corporate Total Consulting Communications Restructuring Consulting Net income $103,903
Interest income and other (6,304) Interest expense 58,624 Income tax provision 49,224
Operating income (1) $66,591 $74,831 $60,890 $57,917 $19,066 ($73,848) $205,447
Depreciation and amortization of intangible
8,902 6,215 4,045 19,094 7,735 4,962 50,953 assets Special charges 9,440 839 2,093 — 2,840 15,212 Remeasurement of acquisition-related (8,991) (962)———— (9,953) contingent consideration
Adjusted EBITDA (1) $75,942 $80,923 $67,028 $77,011 $26,801 ($66,046) $261,659
(1) See “End Notes: FTI Consulting Non-GAAP Data Reconciliation” for definitions of Segment Operating Income (Loss), Adjusted EBITDA and Adjusted Segment EBITDA. 27
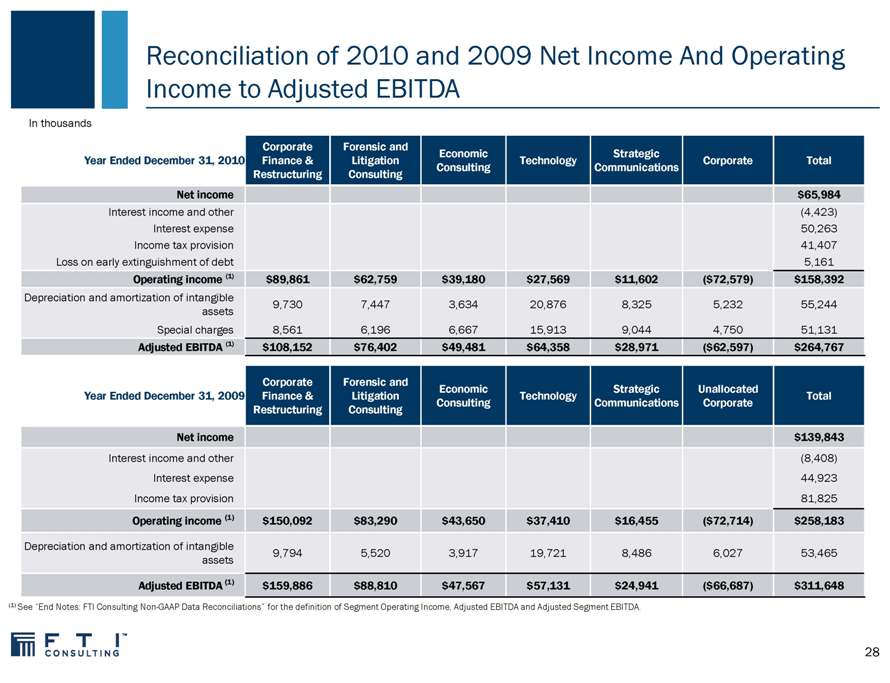
Reconciliation of 2010 and 2009 Net Income And Operating Income to Adjusted EBITDA
In thousands
Corporate Forensic and
Economic Strategic
Year Ended December 31, 2010 Finance & Litigation Technology Corporate Total Consulting Communications Restructuring Consulting Net income $65,984
Interest income and other (4,423) Interest expense 50,263 Income tax provision 41,407 Loss on early extinguishment of debt 5,161
Operating income (1) $89,861 $62,759 $39,180 $27,569 $11,602 ($72,579) $158,392
Depreciation and amortization of intangible
9,730 7,447 3,634 20,876 8,325 5,232 55,244 assets Special charges 8,561 6,196 6,667 15,913 9,044 4,750 51,131
Adjusted EBITDA (1) $108,152 $76,402 $49,481 $64,358 $28,971 ($62,597) $264,767
Corporate Forensic and
Economic Strategic Unallocated
Year Ended December 31, 2009 Finance & Litigation Technology Total Consulting Communications Corporate Restructuring Consulting
Net income $139,843
Interest income and other (8,408) Interest expense 44,923 Income tax provision 81,825
Operating income (1) $150,092 $83,290 $43,650 $37,410 $16,455 ($72,714) $258,183
Depreciation and amortization of intangible
9,794 5,520 3,917 19,721 8,486 6,027 53,465 assets
Adjusted EBITDA (1) $159,886 $88,810 $47,567 $57,131 $24,941 ($66,687) $311,648
(1) See “End Notes: FTI Consulting Non-GAAP Data Reconciliations” for the definition of Segment Operating Income, Adjusted EBITDA and Adjusted Segment EBITDA.
28
End Notes: FTI Consulting Non-GAAP Data Reconciliations
We define Adjusted Net Income and Adjusted Earnings per Diluted Share (“Adjusted EPS”) as Net Income and Earnings Per Diluted Share, respectively, excluding the impact of remeasurement of acquisition-related contingent consideration, special charges, goodwill impairment charges and losses on early extinguishment of debt. We use Adjusted Net Income for the purpose of calculating Adjusted EPS. Management uses Adjusted EPS to assess total Company operating performance on a consistent basis. We believe that this measure, when considered together with our GAAP financial results, provides management and investors with a more complete understanding of our business operating results, including underlying trends, by excluding the effects of remeasurement of acquisition-related contingent consideration, special charges, goodwill impairment charges and losses on early extinguishment of debt.
We define Segment Operating Income (Loss) as a segment’s share of consolidated operating income (loss). We define Total Segment Operating Income (Loss) as the total of Segment Operating Income (Loss) for all segments, which excludes unallocated corporate expenses. We use Segment Operating Income (Loss) for the purpose of calculating Adjusted Segment EBITDA (Loss). We define Adjusted EBITDA as consolidated net income (loss) before income tax provision, other non-operating income (expense), depreciation, amortization of intangible assets, remeasurement of acquisition-related contingent consideration, special charges, goodwill impairment charges and losses on early extinguishment of debt. We define Adjusted Segment EBITDA as a segment’s share of consolidated operating income (loss) before depreciation, amortization of intangible assets, remeasurement of acquisition-related contingent consideration, special charges and goodwill impairment charges. We define Total Adjusted Segment EBITDA as the total of Adjusted Segment EBITDA for all segments, which excludes unallocated corporate expenses. We define Adjusted EBITDA Margin as Adjusted EBITDA as a percentage of total revenues. We define Adjusted Segment EBITDA margin as Adjusted Segment EBITDA as a percentage of a segment’s share of revenue. We use Adjusted Segment EBITDA to internally evaluate the financial performance of our segments because we believe it is a useful supplemental measure which reflects current core operating performance and provides an indicator of the segment’s ability to generate cash. We also believe that these measures, when considered together with our GAAP financial results, provide management and investors with a more complete understanding of our operating results, including underlying trends, by excluding the effects of remeasurement of acquisition-related contingent consideration, special charges, and goodwill impairment charges. In addition, EBITDA and Adjusted EBITDA are common alternative measures of operating performance used by many of our competitors. It is used by investors, financial analysts, rating agencies and others to value and compare the financial performance of companies in our industry. Therefore, we also believe that these measures, considered along with corresponding GAAP measures, provide management and investors with additional information for comparison of our operating results to the operating results of other companies.
Non-GAAP financial measures are not defined in the same manner by all companies and may not be comparable to other similarly titled measures of other companies. Non-GAAP financial measures should be considered in addition to, but not as a substitute for or superior to, the information contained in our Consolidated Statements of Comprehensive Income (Loss).
29

Critical Thinking at the Critical Time ™