Attached files
| file | filename |
|---|---|
| 8-K - 8-K - Chaparral Energy, Inc. | cpr-8k_20160510.htm |
| EX-99.3 - EX-99.3 - Chaparral Energy, Inc. | cpr-ex993_170.htm |
| EX-99.2 - EX-99.2 - Chaparral Energy, Inc. | cpr-ex992_171.htm |
Exhibit 99.1

Confidential and Privileged Attorney Client Communication and Work Product Prepared at Direction of Counsel Subject to FRE 408 Preliminary Draft for Discussion Purposes Only Confidential and Privileged Attorney Client Communication and Work Product Prepared at Direction of Counsel Subject to FRE 408 Preliminary Draft for Discussion Purposes Only Corporate Presentation May 2016

Confidential and Privileged Attorney Client Communication and Work Product Prepared at Direction of Counsel Subject to FRE 408 Preliminary Draft for Discussion Purposes Only Cautionary Statement Regarding Forward-looking Statements This presentation contains "forward-looking statements" as defined under federal securities laws, including projections, plans and objectives. Words and phrases such as “is anticipated,” “is expected,” “is estimated,” “is planned,” “is scheduled,” “is targeted,” “believes,” “intends,” “objectives,” “projects,” “strategies,” and similar expressions are generally used to identify such forward-looking statements. However, the absence of these words does not mean the statement is not forward-looking. Although we believe that expectations reflected in such forward-looking statements are reasonable, no assurance can be given that such expectations will prove to be correct. In addition, these forward-looking statements are subject to certain risks, trends and uncertainties and other assumptions that are difficult to predict and may be beyond our control and could cause actual results to differ materially from those anticipated, estimated, expected or projected if one or more of these risks or uncertainties materializes or if underlying assumptions prove incorrect. Among those risks, trends and uncertainties are our ability to find oil and natural gas reserves that are economically recoverable, the volatility of oil and natural gas prices, the uncertain economic conditions in the United States and globally the decline in the values of our properties that have resulted and may in the future result in additional ceiling test write-downs, our ability to replace reserves and sustain production, our estimate of the sufficiency of our existing capital sources, our ability to raise additional capital to fund cash requirements for future operations, the uncertainties involved in prospect development and property acquisitions or dispositions and in projecting future rates of production or future reserves, the timing of development expenditures and drilling of wells, the impact of hurricanes and other natural disasters on our present and future operations, the impact of government regulation and the operating hazards attendant to the oil and natural gas business. In particular, careful consideration should be given to cautionary statements made in the various reports we have filed with the Securities and Exchange Commissions. In light of these risks, uncertainties and assumptions, the events described in the forward-looking statements might not occur or might occur to a different extent or at a different time than as described. All forward-looking statements in this presentation are made as of the date hereof and we undertake no duty (and expressly disclaim any such duty) to update or revise these forward-looking statements whether as a result of new information, future events or otherwise, except as required by applicable law. This presentation includes non-GAAP financial measures. You can find the reconciliations to comparable GAAP financial measures at the end of the presentation materials or in the “Investors” section of our website.

Confidential and Privileged Attorney Client Communication and Work Product Prepared at Direction of Counsel Subject to FRE 408 Preliminary Draft for Discussion Purposes Only Pure Mid-Continent Player 2 •Focus areas – STACK, Miss Lime and North Burbank •Approximately 425,000 net surface acres •Approximately 110,000 net surface acres in the STACK play •Approximately 50,000 net surface acres in the Miss Lime •Large inventory of repeatable drilling opportunities •Stable oil and cash flow growth from previous year’s EOR investment •Oil-rich portfolio with focus on high-return, oil-leveraged plays •Preliminary 2015 year end SEC reserves 156 MMBoe •Preliminary 2015 production 27.9 MBoe/d and Q4 Exit Rate of 25.5 MBoe/d

Confidential and Privileged Attorney Client Communication and Work Product Prepared at Direction of Counsel Subject to FRE 408 Preliminary Draft for Discussion Purposes Only Core Focus Areas 3 Q4 2015 Net Daily Production (Boe/d): ~9,035 Total Resource Potential: 213 MMBoe Active Operated Projects: 8 EOR MISS LIME Q4 2015 Net Daily Production (Boe/d): ~4,800 Net Surface Acres: 50,000 Gross Unrisked Drilling Locations: 460 Q4 2015 Net Daily Production (Boe/d): ~5,000 Net Surface Acres: 110,000 Total Net Play Acres: 314,500 Gross Unrisked Drilling Locations: 4,480 STACK

Confidential and Privileged Attorney Client Communication and Work Product Prepared at Direction of Counsel Subject to FRE 408 Preliminary Draft for Discussion Purposes Only Capital Plan ($MM) 4 Key EOR Areas Capital North Burbank $24 CO2 Purchases $7 Other Active CO2 Floods $13 CO2 Purchases $6 Conventional Fields $4 TOTAL EOR $41

Confidential and Privileged Attorney Client Communication and Work Product Prepared at Direction of Counsel Subject to FRE 408 Preliminary Draft for Discussion Purposes Only Unrisked Horizontal Drilling Inventory and Play Resource Potential 5 Play Net Acres Gross Locations Net Resource (MMBoe) STACK Oswego 87,000 1,050 95 Osage 107,500 1,485 155 Meramec 36,000 620 75 Woodford 84,000 1,325 140 Total STACK* 314,500 4,480 465 Miss Lime 50,000 460 80 Panhandle Marmaton 86,500 645 55 Woodford (non-STACK) HBP 810 85 Other Horizontal HBP 1,260 85 GRAND TOTAL 7,655 770

Confidential and Privileged Attorney Client Communication and Work Product Prepared at Direction of Counsel Subject to FRE 408 Preliminary Draft for Discussion Purposes Only Total Proved Reserve Summary by Reserve Category (1) (1)Preliminary 12/31/15 SEC Reserve Report run at Year-end 2015 SEC Pricing of $50.28/Bbl and $2.58/MMBtu (2)PNPC = Proved Developed Non-Producing, Waiting on Completion (drilled but not yet completed) (3)PDNPS = Proved Developed Non-Producing, Shut-in (4)PDNPB = Proved Developed Non-Producing, Behind-pipe Crude Oil (MMBbls) Natural Gas (Bcf) NGL (MMBbls) Total (MMBoe) PV-10 ($MM) Strip(*) PV-10 Value ($MM) PDP 36.9 120.9 8.8 65.8 572.4 479.3 PDNPC(2) 0.1 0.4 0.1 0.2 1.0 0.7 PDNPS(3) 2.3 4.3 0.2 3.2 25.0 22.6 PDNPB(4) 1.0 6.7 0.1 2.3 10.6 10.6 PUD 73.5 45.9 2.9 84.0 122.4 89.2 Total Proved 113.8 178.2 12.1 155.5 $731.4 $602.4

Confidential and Privileged Attorney Client Communication and Work Product Prepared at Direction of Counsel Subject to FRE 408 Preliminary Draft for Discussion Purposes Only Total Proved Reserve Summary by Reserve Category and Business Unit (1) (1)Preliminary 12/31/15 SEC Reserve Report run at Year-end 2015 SEC Pricing of $50.28/Bbl and $2.58/MMBtu (2)PNPC = Proved Developed Non-Producing, Waiting on Completion (drilled but not yet completed) (3)PDNPS = Proved Developed Non-Producing, Shut-in (4)PDNPB = Proved Developed Non-Producing, Behind-pipe Oil (MMBbls) Natural Gas (Bcf) NGL (MMBbls) Total (MMBoe) %of Total MMBoe PV-10 Value ($MM) Strip(*) PV-10 Value ($MM) E&P Areas PDP 10.8 113.0 6.9 36.6 23% 308.0 274.9 PDNPC(2) 0.1 0.4 0.1 0.2 0% 1.0 0.7 PDNPS(3) 0.3 4.2 0.2 1.2 1% 10.5 9.5 PDNPB(4) 0.3 5.7 0.1 1.3 1% 6.0 5.8 PUD 7.7 45.9 2.9 18.3 12% 9.6 6.7 Total Proved 19.2 169.2 10.2 57.6 37% $335.1 $297.6 EOR Areas PDP 26.1 7.9 1.9 29.2 19% 264.5 204.4 PDNPS(3) 2.0 0.1 0.0 2.0 1% 14.4 13.1 PDNPB(4) 0.7 1.0 0.0 0.9 1% 4.6 4.8 PUD 65.8 0.0 0.0 65.8 42% 112.8 82.5 Total Proved 94.6 9.0 1.9 97.9 63% $396.3 $304.8 Total Company 113.8 178.2 12.1 155.5 100% $731.4 $602.4

Confidential and Privileged Attorney Client Communication and Work Product Prepared at Direction of Counsel Subject to FRE 408 Preliminary Draft for Discussion Purposes Only Total Proved Reserve Summary by Play (1) (1)Preliminary 12/31/15 SEC Reserve Report run at Year-end 2015 SEC Pricing of $50.28/Bbl and $2.58/MMBtu
Oil (MMBbls) Natural Gas (Bcf) NGL (MMBbls) Total (MMBoe) %of Total MMBoe PV-10 Value ($MM) Strip(*) PV-10 Value ($MM) E&P Areas STACK Oswego 3.0 1.7 0.2 3.5 2% 44.9 39.9 STACK Osage 2.2 19.9 1.5 7.0 3% 29.0 25.1 STACK Meramec 0.8 5.3 0.7 2.4 2% 13.1 11.5 STACK Woodford 0.4 13.1 1.5 4.1 3% 25.3 23.4 Total STACK 6.4 40.0 3.9 17.0 10% $112.3 $99.9 Miss Lime 6.9 56.2 2.4 18.6 12% 99.1 87.2 Panhandle Marmaton 0.9 2.4 0.3 1.6 1% 16.1 12.6 Woodford Shale 0.4 1.7 0.2 0.9 1% 3.0 2.3 Other Horizontal 2.2 23.6 2.5 8.7 6% 47.8 42.8 Legacy E&P 2.4 45.3 0.9 10.8 7% 56.8 52.8 Total E&P Areas 19.2 169.2 10.2 57.6 37% $335.1 $297.6 EOR Project Areas Active EOR Projects 84.8 0.0 0.0 84.8 55% 317.4 242.3 Potential EOR Projects 9.8 9.0 1.9 13.1 8% 78.9 62.5 Total EOR Areas 94.6 9.0 1.9 97.9 63% $396.3 $304.8 Total Company 113.8 178.2 12.1 155.5 100% $731.4 $602.4
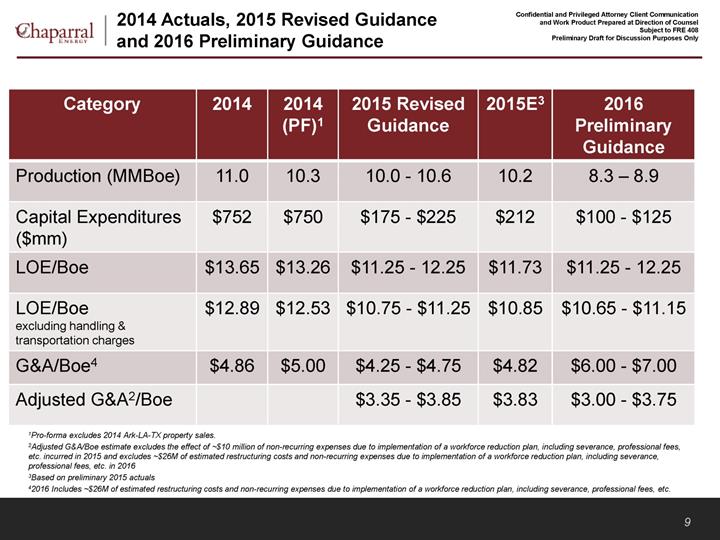
Confidential and Privileged Attorney Client Communication and Work Product Prepared at Direction of Counsel Subject to FRE 408 Preliminary Draft for Discussion Purposes Only 2014 Actuals, 2015 Revised Guidance and 2016 Preliminary Guidance 1Pro-forma excludes 2014 Ark-LA-TX property sales. 2Adjusted G&A/Boe estimate excludes the effect of ~$10 million of non-recurring expenses due to implementation of a workforce reduction plan, including severance, professional fees, etc. incurred in 2015 and excludes ~$26M of estimated restructuring costs and non-recurring expenses due to implementation of a workforce reduction plan, including severance, professional fees, etc. in 2016 3Based on preliminary 2015 actuals 42016 Includes ~$26M of estimated restructuring costs and non-recurring expenses due to implementation of a workforce reduction plan, including severance, professional fees, etc. 9 Category 2014 2014 (PF)1 2015 Revised Guidance 2015E3 2016 Preliminary Guidance Production (MMBoe) 11.0 10.3 10.0 - 10.6 10.2 8.3 – 8.9 Capital Expenditures ($mm) $752 $750 $175 - $225 $212 $100 - $125 LOE/Boe $13.65 $13.26 $11.25 - 12.25 $11.73 $11.25 - 12.25 LOE/Boe excluding handling & transportation charges $12.89 $12.53 $10.75 - $11.25 $10.85 $10.65 - $11.15 G&A/Boe4 $4.86 $5.00 $4.25 - $4.75 $4.82 $6.00 - $7.00 Adjusted G&A2/Boe $3.35 - $3.85 $3.83 $3.00 - $3.75

Confidential and Privileged Attorney Client Communication and Work Product Prepared at Direction of Counsel Subject to FRE 408 Preliminary Draft for Discussion Purposes Only Confidential and Privileged Attorney Client Communication and Work Product Prepared at Direction of Counsel Subject to FRE 408 Preliminary Draft for Discussion Purposes Only Core Focus Areas

Confidential and Privileged Attorney Client Communication and Work Product Prepared at Direction of Counsel Subject to FRE 408 Preliminary Draft for Discussion Purposes Only About the STACK 11 Geological Characteristics •Organic-rich Woodford Shale source •Multiple reservoir targets act as natural conduits for oil migration •Stratigraphic Trap •Nemaha Ridge inhibits eastward migration of hydrocarbons •Chester and Cherokee shales provide a stratigraphic top seal •Proven oil and gas development with historic production in the Sooner Trend Production Potential •Thick, 500’ - 650’ oil-saturated hydrocarbon column •Geological model and trap provides higher oil saturations •30 - 50% oil of total produced fluid •Multiple targets including Oswego, Meramec, Osage and Woodford •Complex carbonate-silt-shale stratigraphy conducive to horizontal drilling Chaparral Acreage Chaparral Acreage Nemaha Ri dge STACK
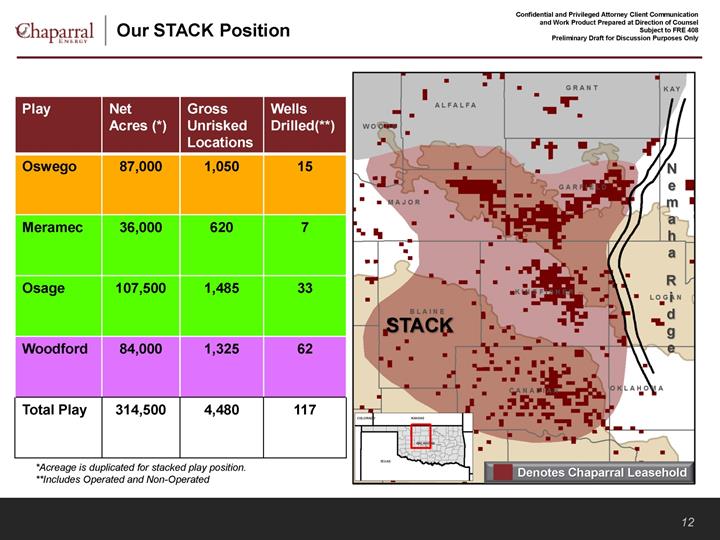
Confidential and Privileged Attorney Client Communication and Work Product Prepared at Direction of Counsel Subject to FRE 408 Preliminary Draft for Discussion Purposes Only Our STACK Position 12 Play Net Acres (*) Gross Unrisked Locations Wells Drilled(**) Oswego 87,000 1,050 15 Meramec 36,000 620 7 Osage 107,500 1,485 33 Woodford 84,000 1,325 62 Total Play 314,500 4,480 117

Confidential and Privileged Attorney Client Communication and Work Product Prepared at Direction of Counsel Subject to FRE 408 Preliminary Draft for Discussion Purposes Only 010020030040050060001002003004005006000255075100125150175200225250275300325350Mcf/d Bo/d PRODUCTION DAYS Oil BO/dGAS MCF/DSTACK Oswego Kingfisher Economics Economics reflect management estimates based on one-mile laterals (1) – Assumes multi-well PAD Development 13 % EUR per Year Year 1 - 21% Year 2 - 9% Year 3 - 6% Year 4 - 5% 34% 38% 60% 94% 159% 0%20%40%60%80%100%120%140%160%180%40/2.503/8/2016NYMEX50/3.0060/3.5070/4.00ROR % Rate of Return Capital allocated to play in current operating plan Type Curve Parameters •EUR: 351 Mboe •Oil %: 94% •D&C Cost(1): $2.7 million Oil •EUR: 329 MBbls •IP (30-day): 367 Bo/d •Initial Decline: 76% •b Factor: 1.4 Wet Gas •EUR: 133 MMcf •IP (30-day): 350 Mcf/d •Initial Decline: 91% •b Factor: 1.2 NGLs(a) •EUR: 13 MBbls •IP (30-day): 33 Bo/d •NGL Yield: 94 Bbls/MMcf •Gas Shrink Factor: 66% (a)After processing shrink

Confidential and Privileged Attorney Client Communication and Work Product Prepared at Direction of Counsel Subject to FRE 408 Preliminary Draft for Discussion Purposes Only 0200400600800100012000501001502002503003504004505000255075100125150175200225250275300325350Mcf/d Bo/d PRODUCTION DAYS Oil BO/dGAS MCF/DSTACK North Meramec Economics Economics reflect management estimates based on one-mile laterals (1) – Assumes multi-well PAD Development 14 Type Curve Parameters •EUR: 354 Mboe •Oil %: 53% •D&C Cost(1): $3.0 million Oil •EUR: 189 MBbls •IP (30-day): 358 Bo/d •Initial Decline: 85% •b Factor: 1.2 Wet Gas •EUR: 991 MMcf •IP (30-day): 908 Mcf/d •Initial Decline: 72% •b Factor: 1.5 NGLs(a) •EUR: 107 MBbls •IP (30-day): 98 Bo/d •NGL Yield: 108 Bbls/MMcf •Gas Shrink Factor: 80% (a)After processing shrink % EUR per Year Year 1 - 23% Year 2 - 9% Year 3 - 6% Year 4 - 5% 19% 22% 38% 62% 94% 0%10%20%30%40%50%60%70%80%90%100%40/2.503/8/2016NYMEX50/3.0060/3.5070/4.00ROR % Rate of Return Capital allocated to play in current operating plan

Confidential and Privileged Attorney Client Communication and Work Product Prepared at Direction of Counsel Subject to FRE 408 Preliminary Draft for Discussion Purposes Only 0100200300400500600700800900100001002003004005006007008000255075100125150175200225250275300325350Mcf/d Bo/d PRODUCTION DAYS Oil BO/dGAS MCF/DSTACK South Meramec Economics Economics reflect management estimates based on one-mile laterals (1) – Assumes multi-well PAD Development 15 Type Curve Parameters •EUR: 434 Mboe •Oil %: 67% •D&C Cost(1): $4.0 million Oil •EUR: 291 MBbls •IP (30-day): 551 Bo/d •Initial Decline: 85% •b Factor: 1.2 Wet Gas •EUR: 857 MMcf •IP (30-day): 786 Mcf/d •Initial Decline: 72% •b Factor: 1.5 NGLs(a) •EUR: 93 MBbls •IP (30-day): 85 Bo/d •NGL Yield: 108 Bbls/MMcf •Gas Shrink Factor: 80% (a)After processing shrink % EUR per Year Year 1 - 24% Year 2 - 9% Year 3 - 6% Year 4 - 5% 21% 24% 41% 69% 111% 0%20%40%60%80%100%120%40/2.503/8/2016NYMEX50/3.0060/3.5070/4.00ROR % Rate of Return Capital allocated to play in current operating plan

Confidential and Privileged Attorney Client Communication and Work Product Prepared at Direction of Counsel Subject to FRE 408 Preliminary Draft for Discussion Purposes Only 01002003004005006007008009001,0000501001502002500255075100125150175200225250275300325350Mcf/d Bo/d PRODUCTION DAYS Oil BO/dGAS MCF/DSTACK Osage Kingfisher Economics Economics reflect management estimates based on one-mile laterals (1) – Assumes multi-well PAD Development 16 Type Curve Parameters •EUR: 315 Mboe •Oil %: 52% •D&C Cost(1): $3.0 million Oil •EUR: 165 MBbls •IP (30-day): 174 Bo/d •Initial Decline: 73.7% •b Factor: 1.4 Wet Gas •EUR: 898 MMcf •IP (30-day): 806 Mcf/d •Initial Decline: 70.4% •b Factor: 1.4 NGLs(a) •EUR: 41 MBbls •IP (30-day): 37 Bo/d •NGL Yield: 46 Bbls/MMcf •Gas Shrink Factor: 75% (a)After processing shrink % EUR per Year Year 1 - 21% Year 2 - 9% Year 3 - 6% Year 4 - 5% 7% 9% 14% 23% 33% 0%5%10%15%20%25%30%35%40/2.503/8/2016NYMEX50/3.0060/3.5070/4.00ROR % Rate of Return
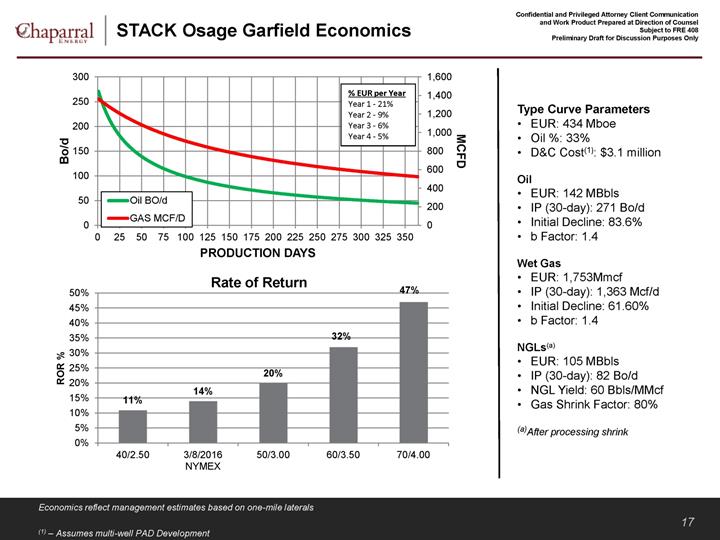
Confidential and Privileged Attorney Client Communication and Work Product Prepared at Direction of Counsel Subject to FRE 408 Preliminary Draft for Discussion Purposes Only 02004006008001,0001,2001,4001,6000501001502002503000255075100125150175200225250275300325350MCFD Bo/d PRODUCTION DAYS Oil BO/dGAS MCF/DSTACK Osage Garfield Economics Economics reflect management estimates based on one-mile laterals (1) – Assumes multi-well PAD Development 17 Type Curve Parameters •EUR: 434 Mboe •Oil %: 33% •D&C Cost(1): $3.1 million Oil •EUR: 142 MBbls •IP (30-day): 271 Bo/d •Initial Decline: 83.6% •b Factor: 1.4 Wet Gas •EUR: 1,753Mmcf •IP (30-day): 1,363 Mcf/d •Initial Decline: 61.60% •b Factor: 1.4 NGLs(a) •EUR: 105 MBbls •IP (30-day): 82 Bo/d •NGL Yield: 60 Bbls/MMcf •Gas Shrink Factor: 80% (a)After processing shrink % EUR per Year Year 1 - 21% Year 2 - 9% Year 3 - 6% Year 4 - 5% 11% 14% 20% 32% 47% 0%5%10%15%20%25%30%35%40%45%50%40/2.503/8/2016NYMEX50/3.0060/3.5070/4.00ROR % Rate of Return

Confidential and Privileged Attorney Client Communication and Work Product Prepared at Direction of Counsel Subject to FRE 408 Preliminary Draft for Discussion Purposes Only 02004006008001000120014000501001502002503003504004500255075100125150175200225250275300325350Mcf/d Bo/d PRODUCTION DAYS Oil BO/dGAS MCF/DSTACK East Canadian County Woodford Economics Economics reflect management estimates based on one-mile laterals (1) – Assumes multi-well PAD Development 18 Type Curve Parameters •EUR: 443 Mboe •Oil %: 59% •D&C Cost(1): $4.5 million Oil •EUR: 263 MBbls •IP (30-day): 367 Bo/d •Initial Decline: 75% •b Factor: 1.1 Wet Gas •EUR: 1,080 MMcf •IP (30-day): 1,088 Mcf/d •Initial Decline: 65% •b Factor: 1.1 NGLs(a) •EUR: 126 MBbls •IP (30-day): 127 Bo/d •NGL Yield: 117 Bbls/MMcf •Gas Shrink Factor: 62% (a)After processing shrink % EUR per Year Year 1 - 24% Year 2 - 11% Year 3 - 7% Year 4 - 5% 13% 17% 27% 44% 66% 0%10%20%30%40%50%60%70%40/2.503/8/2016NYMEX50/3.0060/3.5070/4.00ROR % Rate of Return Capital allocated to play in current operating plan
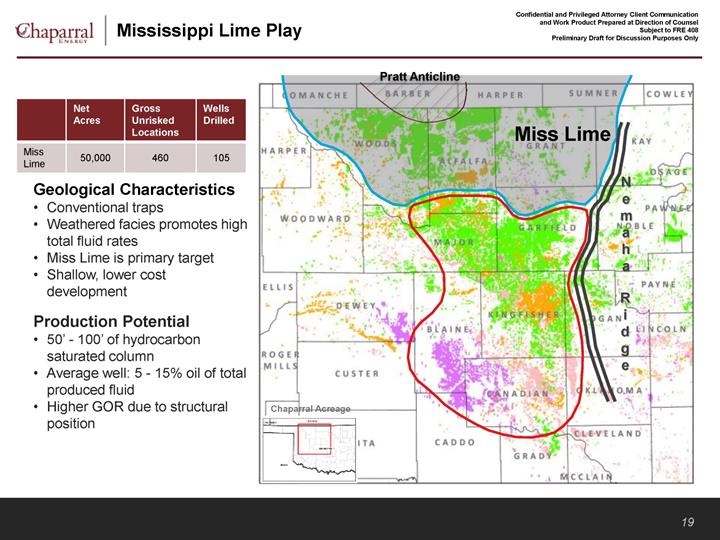
Confidential and Privileged Attorney Client Communication and Work Product Prepared at Direction of Counsel Subject to FRE 408 Preliminary Draft for Discussion Purposes Only Mississippi Lime Play 19 Net Acres Gross Unrisked Locations Wells Drilled Miss Lime 50,000 460 105

Confidential and Privileged Attorney Client Communication and Work Product Prepared at Direction of Counsel Subject to FRE 408 Preliminary Draft for Discussion Purposes Only Miss Lime Economics Economics reflect management estimates based on one-mile laterals. (1) – Assumes multi-well PAD Development 20 0200400600800100012000204060801001201401600255075100125150175200225250275300325350Mcf/d Bo/d Production Days Oil BO/dGAS MCF/DType Curve Parameters •EUR: 376 Mboe •Oil %: 46% •D&C Cost(1): $2.5 million Oil •EUR: 173 MBbls •IP (30-day) 136 Bo/d •Initial Decline: 66.8% •b Factor: 1.5 Wet Gas •EUR: 1,217 MMcf •IP (30-day) 958 Mcf/d •Initial Decline: 66.8% •b Factor: 1.5 NGLs(a) •EUR: 30 MBbls •IP (30-day) 24 Bo/d •NGL Yield: 25 Bbls/MMcf •Gas Shrink Factor: 80% (a)After processing shrink % EUR per Year Year 1 - 17% Year 2 - 9% Year 3 - 6% Year 4 - 5% 13% 16% 23% 34% 48% 0%10%20%30%40%50%60%40/2.503/8/2016NYMEX50/3.0060/3.5070/4.00ROR % Rate of Return

Confidential and Privileged Attorney Client Communication and Work Product Prepared at Direction of Counsel Subject to FRE 408 Preliminary Draft for Discussion Purposes Only Confidential and Privileged Attorney Client Communication and Work Product Prepared at Direction of Counsel Subject to FRE 408 Preliminary Draft for Discussion Purposes Only Triggered Seismicity Update

Confidential and Privileged Attorney Client Communication and Work Product Prepared at Direction of Counsel Subject to FRE 408 Preliminary Draft for Discussion Purposes Only Triggered Seismicity and Chaparral Impact February 16, 2016 OCC Directive •The OCC issued a Directive on February 16, 2016 to operators of SWD wells in Northwestern Oklahoma to reduce injection volumes by approximately 40% from 2015 levels. This area is the core of the Miss Lime play. •Chaparral’s total 2016 estimated Miss Lime production is ~ 3,800 BOE/D (16% of total estimated 2016 production – 34% oil) •2016 Operated production is ~ 2,600 BOE/D (11% of total estimated 2016 production – 35% oil) •2016 Non-Operated production is ~ 1,200 BOE/D (5% of total estimated 2016 production – 33% oil) •The February 2016 Directive will not impact Chaparral’s 2016 Operated Miss Lime Business Plan •Due to proactive measures taken by Chaparral in 2015 and normal production decline, current SWD injection volumes are below required OCC injection targets •Impact from the February 2016 Directive will be contained to Non-Operated production operated primarily by SD, MPO and privately held ARP Oklahoma •Currently assessing impact as each operator will seek to mitigate production loss and optimize reduction volumes •Net production impact is expected to not exceed 200 BO/D and 1.5MMCF/D (450 BOE/D) for 2016 (*) •The duration of reduced injection volumes is unknown, dependent upon resulting seismic activity in the area and within Oklahoma, and very much based upon the political climate. •STACK acreage is not impacted by the February 2016 OCC Directive, except for Major County where most Chaparral leases will expire by mid-2017 (Major County ~ 17k net acres – 12k will expire by mid-2017) (*) – current expectation less than 100 BOE/D impact 22

Confidential and Privileged Attorney Client Communication and Work Product Prepared at Direction of Counsel Subject to FRE 408 Preliminary Draft for Discussion Purposes Only Triggered Seismicity and Chaparral Impact (cont.) March 7, 2016 OCC Directive •The Directive expanded, for precautionary measures, the OCC Area of Interest (AOI) to include most of the industry recognized STACK Play. Included with this directive was a Central OK Area of Volume Reduction requesting operators with SWD wells to reduce injection volumes by approximately 40% from 2015 levels. •The Central OK Area of Volume Reduction included most of Kingfisher and Garfield counties, where we have 4 SWD wells. •This expanded outline is in an area that has not experienced triggered seismicity and has materially lower SWD injection volumes. •Impact to Chaparral Business Plan is minimal – less than 40 BOE/D. •The duration of reduced injection volumes is unknown, dependent upon resulting seismic activity in the area and within Oklahoma, and very much based upon the political climate. 23
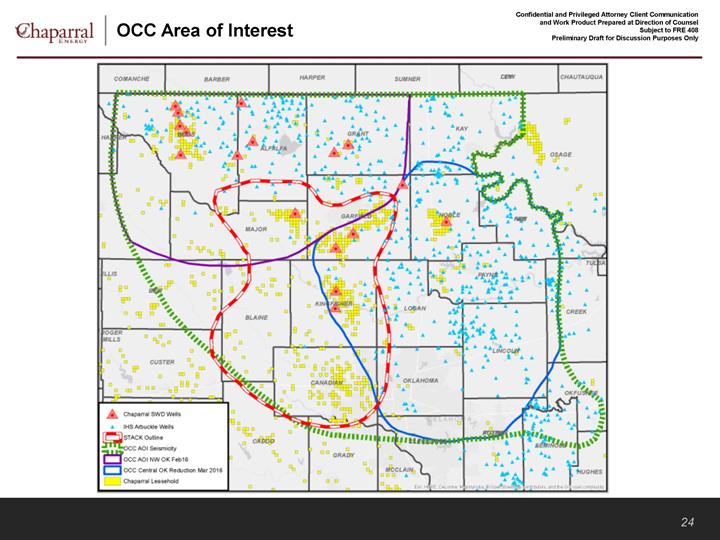
Confidential and Privileged Attorney Client Communication and Work Product Prepared at Direction of Counsel Subject to FRE 408 Preliminary Draft for Discussion Purposes Only OCC Area of Interest 24

Confidential and Privileged Attorney Client Communication and Work Product Prepared at Direction of Counsel Subject to FRE 408 Preliminary Draft for Discussion Purposes Only Confidential and Privileged Attorney Client Communication and Work Product Prepared at Direction of Counsel Subject to FRE 408 Preliminary Draft for Discussion Purposes Only CO2 EOR – Major Part of Growth Story

Confidential and Privileged Attorney Client Communication and Work Product Prepared at Direction of Counsel Subject to FRE 408 Preliminary Draft for Discussion Purposes Only Proven Performance Record 26 Field CO2 Initiation Production Prior to Injection (Bo/d) Q4 2015 Gross Production (Bo/d) Uplift Gross EUR (MMBo) Panhandle Area Camrick 2001 103 1,122 8.0 North Perryton 2006 21 548 3.4 Booker 2009 9 830 2.0 Farnsworth 2010 139 2,040 7.5 Central Oklahoma NW Velma Hoxbar 2010 78 284 1.2 Burbank Area Burbank 2013 1,372 2,853 88.3 TOTAL 1,722 7,677 110.4

Confidential and Privileged Attorney Client Communication and Work Product Prepared at Direction of Counsel Subject to FRE 408 Preliminary Draft for Discussion Purposes Only CO2 EOR Economics (1)– Pattern Development Cost - $500k/pattern (2)– Pattern Development Cost - $1.2M/pattern 27 $7.21 $3.85 $3.28 $1.92 $1.61 Well WorkField PersonnelElectricity & OtherFuelCO2 Recycle (Elect &Chem)Chemicals & OtherLOE of ~$18/BOE 56% Fixed 44% Variable $20.00 $1.00 $5.00 $1.00 $3.00 $- $5.00 $10.00 $15.00 $20.00 $25.00 $30.00MaintenanceCapitalNew CO2Royalty (13%)Production TaxLOEOil Price $/Bo ROR% $30.00 15% $40.00 36% $50.00 55% $60.00 73%

Confidential and Privileged Attorney Client Communication and Work Product Prepared at Direction of Counsel Subject to FRE 408 Preliminary Draft for Discussion Purposes Only Confidential and Privileged Attorney Client Communication and Work Product Prepared at Direction of Counsel Subject to FRE 408 Preliminary Draft for Discussion Purposes Only North Burbank CO2 EOR Development
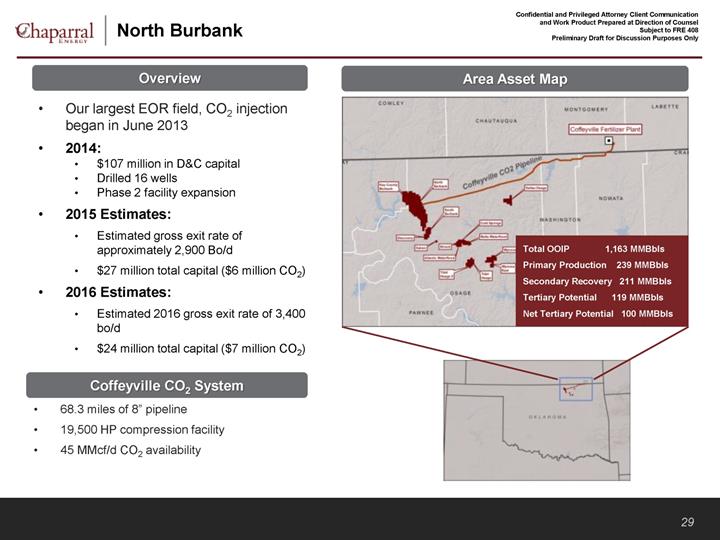
Confidential and Privileged Attorney Client Communication and Work Product Prepared at Direction of Counsel Subject to FRE 408 Preliminary Draft for Discussion Purposes Only North Burbank 29 •Our largest EOR field, CO2 injection began in June 2013 •2014: •$107 million in D&C capital •Drilled 16 wells •Phase 2 facility expansion •2015 Estimates: •Estimated gross exit rate of approximately 2,900 Bo/d •$27 million total capital ($6 million CO2) •2016 Estimates: •Estimated 2016 gross exit rate of 3,400 bo/d •$24 million total capital ($7 million CO2) Overview Area Asset Map •68.3 miles of 8” pipeline •19,500 HP compression facility •45 MMcf/d CO2 availability Coffeyville CO2 System Total OOIP 1,163 MMBbls Primary Production 239 MMBbls Secondary Recovery 211 MMBbls Tertiary Potential 119 MMBbls Net Tertiary Potential 100 MMBbls
Confidential and Privileged Attorney Client Communication and Work Product Prepared at Direction of Counsel Subject to FRE 408 Preliminary Draft for Discussion Purposes Only Confidential and Privileged Attorney Client Communication and Work Product Prepared at Direction of Counsel Subject to FRE 408 Preliminary Draft for Discussion Purposes Only P r eliminary 2015 Financial Highlights

Confidential and Privileged Attorney Client Communication and Work Product Prepared at Direction of Counsel Subject to FRE 408 Preliminary Draft for Discussion Purposes Only Financial Metrics per BOE 31 Production (Boe/d) $14.36 $14.35 $13.65 $10.85 $0.00$2.00$4.00$6.00$8.00$10.00$12.00$14.00$16.002012201320142015E*LOE/BoeTransportation and Processing/Boe$5.46 $5.53 $4.86 $3.83 $0.00$1.00$2.00$3.00$4.00$5.00$6.002012201320142015E* 12,464 13,715 16,375 15,121 9,032 9,247 9,428 8,579 3,415 3,729 4,285 4,246 - 5,000 10,000 15,000 20,000 25,000 30,000 35,0002012201320142015E*OilGasNGL24,911 26,691 30,088 27,946 $11.69 LOE/Boe EBITDA/Boe G&A/Boe (1) $37.03 $39.93 $41.45 $38.11 $0.00$5.00$10.00$15.00$20.00$25.00$30.00$35.00$40.00$45.002012201320142015E**Based on preliminary 2015 actuals (1) 2015 adjusted to exclude $10 million of other expenses (severance, etc.)

Confidential and Privileged Attorney Client Communication and Work Product Prepared at Direction of Counsel Subject to FRE 408 Preliminary Draft for Discussion Purposes Only Financial Summary * - Based on preliminary 2015 actuals ** 2015 excludes $10 million of other expenses (severance, etc.) 32 2 010 2 011 2 012 2 013 2 014 20 15E(*) Price Oil – Wellhead ($/Bbl) $76.45 $92.36 $90.87 $95.08 $90.50 $46.27 Gas – Wellhead ($/Mcf) $4.36 $4.08 $2.64 $3.48 $4.17 $2.43 NGL – Wellhead ($/Bbl) $55.66 $60.84 $34.05 $33.19 $34.86 $15.08 Production (MMBoe) 8.1 8.7 9.1 9.7 11.0 10.2 Oil (MMBbls) 3.7 4.3 4.6 5.0 6.0 5.5 Gas (Bcf) 23.7 21.6 19.8 20.3 20.6 18.8 NGL (MMBbls) 0.4 0.8 1.2 1.4 1.6 1.5 Financial Data ($mm) Operating Expenses Lease Operating Expenses $106 $121 $131 $140 $150 $119 Production and Ad Valorem Taxes 27 34 32 33 28 10 G&A ** (excludes noncash deferred comp) 30 42 50 54 53 41 Interest Expense $81 $97 $98 $97 $104 $112 Derivative Settlements $46 $(24) $37 $19 $2 $234 EBITDA $288 $313 $337 $389 $455 $389 Total Capital Expenditures $344 $336 $531 $681 $752 $212 Debt Senior Notes - Gross $950 $1,025 $1,250 $1,250 $1,250 $1,208 Credit Facility $0 $0 $25 $272 $347 $367 Proceeds from Asset Sales $0.4 $38 $46 $111 $291 $42
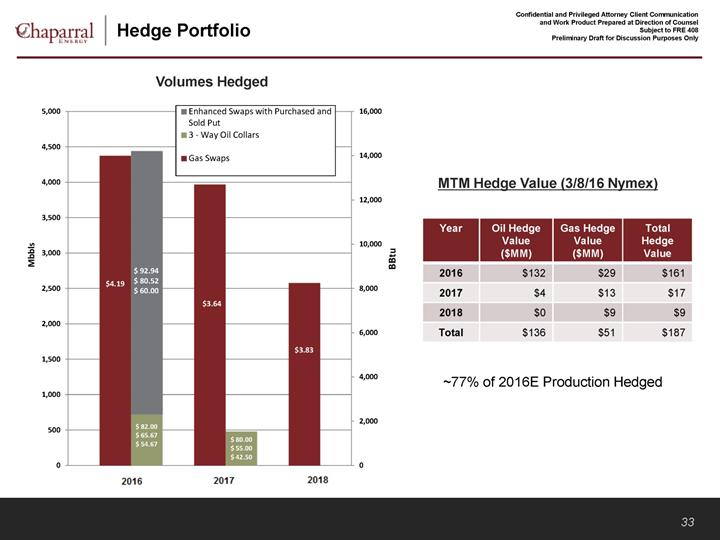
Confidential and Privileged Attorney Client Communication and Work Product Prepared at Direction of Counsel Subject to FRE 408 Preliminary Draft for Discussion Purposes Only 02,0004,0006,0008,00010,00012,00014,00016,00005001,0001,5002,0002,5003,0003,5004,0004,5005,000BBtuMbblsEnhanced Swaps with Purchased andSold Put3 - Way Oil CollarsGas Swaps$3.64 $ 82.00$ 65.67$ 54.67$3.64 $3.83 $ 92.94$ 80.52$ 60.00$ 80.00$ 55.00$ 42.50$4.19 Hedge Portfolio 33 Volumes Hedged ~77% of 2016E Production Hedged MTM Hedge Value (3/8/16 Nymex) Year Oil Hedge Value ($MM) Gas Hedge Value ($MM) Total Hedge Value 2016 $132 $29 $161 2017 $4 $13 $17 2018 $0 $9 $9 Total $136 $51 $187

Confidential and Privileged Attorney Client Communication and Work Product Prepared at Direction of Counsel Subject to FRE 408 Preliminary Draft for Discussion Purposes Only Confidential and Privileged Attorney Client Communication and Work Product Prepared at Direction of Counsel Subject to FRE 408 Preliminary Draft for Discussion Purposes Only S tatus Quo Business Plan

Confidential and Privileged Attorney Client Communication and Work Product Prepared at Direction of Counsel Subject to FRE 408 Preliminary Draft for Discussion Purposes Only Status Quo Business Plan – Assumptions 35 The following sets forth certain assumptions utilized by Chaparral in deriving its Status Quo Business Plan projections: E&P •E&P base production derived from proved developed producing (“PDP”) production and operating costs in Aries as forecasted by Chaparral’s reservoir engineers assigned to each region •PDP volumes are risked by 2% for all periods •E&P operated development wedge volumes risked from 10-20% EOR •EOR production and operating costs based on Company’s internal EOR model •EOR volumes are risked by 2% for all periods General Assumptions •Assumed NYMEX strip pricing as of March 8, 2016: •Annual cash G&A expense of approximately $27 million •Assumes no merit increases provided in 2016 •Forecast in future years excludes any potential incentive plans and merit increases (actual amounts to be determined) •Assumes approximately $26 million in estimated non-recurring restructuring expenses •Assumes no cash taxes during the forecast period •Current hedges included Status Quo Business Plan represents Company’s current views, however, given the volatility in commodity prices, the plan remains subject to change 2016E2017E2018E2019EOil ($/Bbl)$38.60$44.31$46.34$47.48Gas ($/MMBtu)$2.04$2.63$2.71$2.75

Confidential and Privileged Attorney Client Communication and Work Product Prepared at Direction of Counsel Subject to FRE 408 Preliminary Draft for Discussion Purposes Only 2016E-2019E Capital Expenditures Summary 36 $133 mm $50 mm $41 mm $28 mm $14 mm $46 mm Total Budget Capital Expenditures ($MM) $47 $54 $54 $54 $41 $35 $45 $43 $23 $20 $19 $18 $111 $109 $118 $115 $--$30$60$90$120$1502016E2017E2018E2019EE&PEOROther CapexNote: Other Capex includes Acquisitions, Workover, Infrastructure (PP&E) & Other, Capitalized Interest and Capitalized G&A

Confidential and Privileged Attorney Client Communication and Work Product Prepared at Direction of Counsel Subject to FRE 408 Preliminary Draft for Discussion Purposes Only 2016E-2019E Capital Expenditures Breakdown 37 $133 mm $50 mm $41 mm $28 mm $14 mm $46 mm Budget E&P Capital Expenditures ($MM) Budget EOR Capital Expenditures ($MM) $24 $18 $29 $28 $10 $9 $8 $7 $5 $6 $6 $6 $2 $2 $2 $1 $41 $35 $45 $43 $--$15$30$45$602016E2017E2018E2019EBurbankOther Active CO2 FloodsConventionalMidstreamGross Operated Wells SpudOswego3444Meramec8888Woodford1444Osage1------$4 $7 $7 $7 $16 $17 $17 $17 $4 $11 $11 $11 $15 $15 $15 $15 $6 $4 $4 $4 $47 $54 $54 $54 $2 $--$15$30$45$602016E2017E2018E2019EOswegoMeramecWoodfordOsageNon-OpCarryover CompletionsNote: During March 2016, the Company updated its business plan and the capital expenditures for 2016 and 2017, respectively, including approximately $9 million and $4 million related to the drilling of an additional 7 wells in 2016, 4 of which are projected to be completed in 2017, which the company included in its most recent business plan dated March 14, 2016. These expenditures were partially offset by a reduction of approximately $4 million of other costs in 2016. In addition, these additional drilling and completion expenses are expected to be recovered entirely by higher revenue due to higher production through 2019
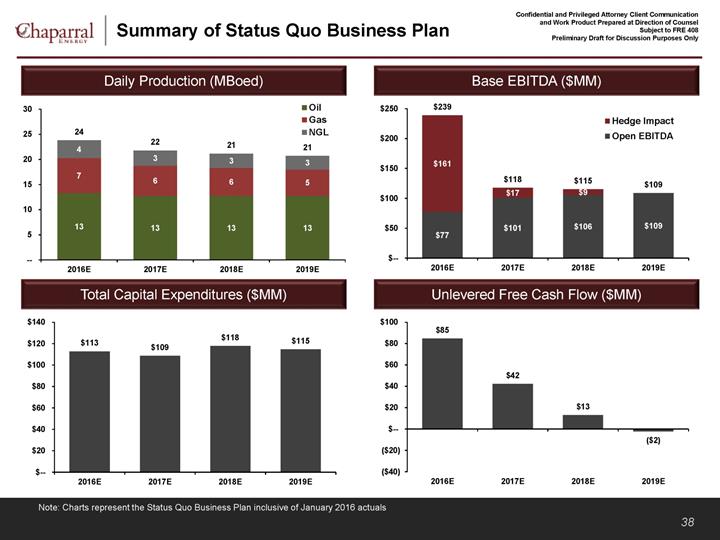
Confidential and Privileged Attorney Client Communication and Work Product Prepared at Direction of Counsel Subject to FRE 408 Preliminary Draft for Discussion Purposes Only Summary of Status Quo Business Plan 38 Total Capital Expenditures ($MM) Daily Production (MBoed) Base EBITDA ($MM) Unlevered Free Cash Flow ($MM) $113 $109 $118 $115 $--$20$40$60$80$100$120$1402016E2017E2018E2019E13 13 13 13 7 6 6 5 4 3 3 3 24 22 21 21 --510152025302016E2017E2018E2019EOilGasNGL$77 $101 $106 $109 $161 $17 $9 $239 $118 $115 $109 $--$50$100$150$200$2502016E2017E2018E2019EHedge ImpactOpen EBITDA$85 $42 $13 ($2)($40)($20)$--$20$40$60$80$1002016E2017E2018E2019ENote: Charts represent the Status Quo Business Plan inclusive of January 2016 actuals
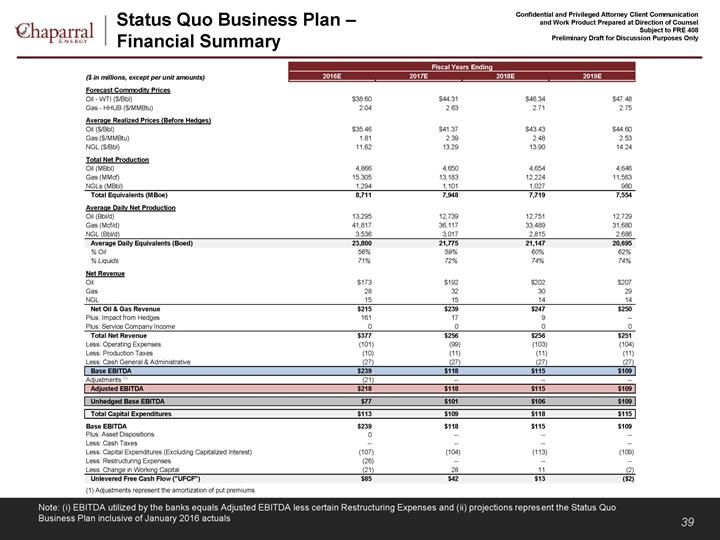
Confidential and Privileged Attorney Client Communication and Work Product Prepared at Direction of Counsel Subject to FRE 408 Preliminary Draft for Discussion Purposes Only Status Quo Business Plan – Financial Summary 39 Note: (i) EBITDA utilized by the banks equals Adjusted EBITDA less certain Restructuring Expenses and (ii) projections represent the Status Quo Business Plan inclusive of January 2016 actuals Fiscal Years Ending($ in millions, except per unit amounts)2016E2017E2018E2019EForecast Commodity PricesOil - WTI ($/Bbl)$38.60$44.31$46.34$47.48Gas - HHUB ($/MMBtu)2.042.632.712.75Average Realized Prices (Before Hedges)Oil ($/Bbl)$35.46$41.37$43.43$44.60Gas ($/MMBtu)1.812.392.482.53NGL ($/Bbl)11.6213.2913.9014.24Total Net ProductionOil (MBbl)4,8664,6504,6544,646Gas (MMcf)15,30513,18312,22411,563NGLs (MBbl)1,2941,1011,027980Total Equivalents (MBoe)8,7117,9487,7197,554Average Daily Net ProductionOil (Bbl/d)13,29512,73912,75112,729Gas (Mcf/d)41,81736,11733,48931,680NGL (Bbl/d)3,5363,0172,8152,686Average Daily Equivalents (Boed)23,80021,77521,14720,695% Oil56%59%60%62%% Liquids71%72%74%74%Net RevenueOil$173$192$202$207Gas28323029NGL15151414Net Oil & Gas Revenue$215$239$247$250Plus: Impact from Hedges161179--Plus: Service Company Income0000Total Net Revenue$377$256$256$251Less: Operating Expenses(101)(99)(103)(104)Less: Production Taxes(10)(11)(11)(11)Less: Cash General & Administrative(27)(27)(27)(27)Base EBITDA$239$118$115$109Adjustments (1)(21)------Adjusted EBITDA$218$118$115$109Unhedged Base EBITDA$77$101$106$109Total Capital Expenditures$113$109$118$115Base EBITDA$239$118$115$109Plus: Asset Dispositions0------Less: Cash Taxes--------Less: Capital Expenditures (Excluding Capitalized Interest)(107)(104)(113)(109)Less: Restructuring Expenses(26)------Less: Change in Working Capital(21)2811(2)Unlevered Free Cash Flow ("UFCF")$85$42$13($2)(1) Adjustments represent the amortization of put premiums

Confidential and Privileged Attorney Client Communication and Work Product Prepared at Direction of Counsel Subject to FRE 408 Preliminary Draft for Discussion Purposes Only Confidential and Privileged Attorney Client Communication and Work Product Prepared at Direction of Counsel Subject to FRE 408 Preliminary Draft for Discussion Purposes Only T o ta l Proved – Upside Pricing Scenario
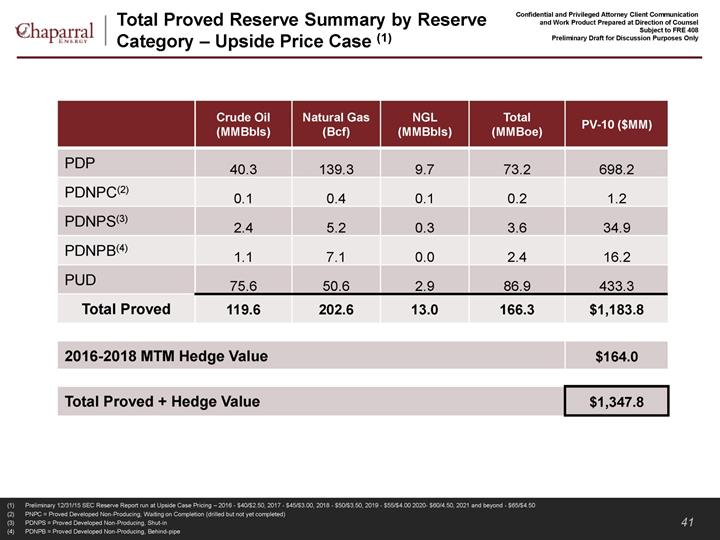
Confidential and Privileged Attorney Client Communication and Work Product Prepared at Direction of Counsel Subject to FRE 408 Preliminary Draft for Discussion Purposes Only Total Proved Reserve Summary by Reserve Category – Upside Price Case (1) (1)Preliminary 12/31/15 SEC Reserve Report run at Upside Case Pricing – 2016 - $40/$2.50, 2017 - $45/$3.00, 2018 - $50/$3.50, 2019 - $55/$4.00 2020- $60/4.50, 2021 and beyond - $65/$4.50 (2)PNPC = Proved Developed Non-Producing, Waiting on Completion (drilled but not yet completed) (3)PDNPS = Proved Developed Non-Producing, Shut-in (4)PDNPB = Proved Developed Non-Producing, Behind-pipe Crude Oil (MMBbls) Natural Gas (Bcf) NGL (MMBbls) Total (MMBoe) PV-10 ($MM) PDP 40.3 139.3 9.7 73.2 698.2 PDNPC(2) 0.1 0.4 0.1 0.2 1.2 PDNPS(3) 2.4 5.2 0.3 3.6 34.9 PDNPB(4) 1.1 7.1 0.0 2.4 16.2 PUD 75.6 50.6 2.9 86.9 433.3 Total Proved 119.6 202.6 13.0 166.3 $1,183.8 2016-2018 MTM Hedge Value $164.0 Total Proved + Hedge Value $1,347.8 41

Confidential and Privileged Attorney Client Communication and Work Product Prepared at Direction of Counsel Subject to FRE 408 Preliminary Draft for Discussion Purposes Only (1)Preliminary 12/31/15 SEC Reserve Report run at Upside Case Pricing – 2016 - $40/$2.50, 2017 - $45/$3.00, 2018 - $50/$3.50, 2019 - $55/$4.00 2020- $60/4.50, 2021 and beyond - $65/$4.50 (2)PNPC = Proved Developed Non-Producing, Waiting on Completion (drilled but not yet completed) (3)PDNPS = Proved Developed Non-Producing, Shut-in (4)PDNPB = Proved Developed Non-Producing, Behind-pipe Total Proved Reserve Summary by Reserve Category and Business Unit – Upside Price Case (1) O i l (MMBbls) N a tural Gas (Bcf) N GL (MMBbls) T o tal (MMBoe) % o f Total MMBoe PV- 1 0 Value ($MM) E&P Areas PDP 11.8 130.3 7.6 41.1 25% 380.3 PDNPC(2) 0.1 0.4 0.0 0.2 0% 1.2 PDNPS(3) 0.3 5.1 0.3 1.5 1% 13.6 PDNPB(4) 0.4 6.0 0.1 1.4 1% 8.3 PUD 7.7 50.6 2.9 19.1 11% 73.7 Total Proved 20.3 192.4 10.9 63.3 38% $477.1 EOR Areas PDP 28.5 8.9 2.1 32.1 19% 317.9 PDNPS(3) 2.1 0.1 0.0 2.1 1% 21.3 PDNPB(4) 0.8 1.2 0.0 1.0 1% 7.9 PUD 67.8 0.0 0.0 67.8 41% 359.6 Total Proved 99.2 10.2 2.1 103.0 62% $706.7 Total Company 119.5 202.6 13.0 166.3 100% $1,183.8
42

Confidential and Privileged Attorney Client Communication and Work Product Prepared at Direction of Counsel Subject to FRE 408 Preliminary Draft for Discussion Purposes Only (1)Preliminary 12/31/15 SEC Reserve Report run at Upside Case Pricing – 2016 - $40/$2.50, 2017 - $45/$3.00, 2018 - $50/$3.50, 2019 - $55/$4.00 2020- $60/4.50, 2021 and beyond - $65/$4.50 Total Proved Reserve Summary by Play – Upside Price Case (1) O i l (MMBbls) N a tural Gas (Bcf) N GL (MMBbls) T o tal (MMBoe) % o f Total MMBoe PV- 1 0 Value ($MM) E&P Areas STACK Oswego 3.1 1.7 0.2 3.6 2% 54.0 STACK Osage 2.2 19.8 1.4 6.9 5% 47.5 STACK Meramec 0.8 5.4 0.7 2.4 1% 18.6 STACK Woodford 0.4 13.1 1.5 4.1 2% 32.2 Total STACK 6.5 40.0 3.8 17.0 10% 152.3 Miss Lime 7.3 62.4 2.7 20.4 12% 147.0 Panhandle Marmaton 1.1 2.8 0.4 2.0 1% 18.7 Woodford Shale 0.4 1.6 0.2 0.8 1% 5.3 Other Horizontal 2.2 26.0 2.8 9.3 6% 66.3 Legacy E&P 2.8 59.6 1.0 13.8 8% 87.5 Total E&P Areas 20.3 192.4 10.9 63.3 38% $477.1 EOR Project Areas Active EOR Projects 87.6 0.0 0.0 87.6 53% 592.9 Potential EOR Projects 11.6 10.2 2.1 15.4 9% 113.8 Total EOR Areas 99.2 10.2 2.1 103.0 62% $706.7 Total Company 119.5 202.6 13.0 166.3 100% $1,183.8 43

Confidential and Privileged Attorney Client Communication and Work Product Prepared at Direction of Counsel Subject to FRE 408 Preliminary Draft for Discussion Purposes Only Illustrative Proved Reserve Roll-Forward Note: The illustrative reserve values above represent an estimate of future reserve values and the Company cannot guarantee that these values will be achieved Reserve Category May 2016 November 2016 May 2017 November 2017 May 2018 PDP $491 $478 $467 $472 $465 PDNP 22 22 24 22 21 PUD 126 164 174 201 218 Total Proved $639 $664 $665 $695 $704 •Based on certain simplifying assumptions, the Company has estimated its proved reserve value over time assuming March 8, 2016 NYMEX strip prices •Assumes the development pace as laid out in the Status Quo Business Plan I llustrative Reserve Value Over Time (PV-9 ) ($MM) Commodity 2016 2017 2018 2019 2020+ WTI Oil Price ($/Bbl) $38.58 $44.31 $46.34 $47.48 $48.37 HHUB Natural Gas Price ($/MMBtu) $2.03 $2.63 $2.71 $2.75 $2.83 M arch 8, 2016 NYMEX Strip Price 44

Confidential and Privileged Attorney Client Communication and Work Product Prepared at Direction of Counsel Subject to FRE 408 Preliminary Draft for Discussion Purposes Only Confidential and Privileged Attorney Client Communication and Work Product Prepared at Direction of Counsel Subject to FRE 408 Preliminary Draft for Discussion Purposes Only A dditional G&A Detail

Confidential and Privileged Attorney Client Communication and Work Product Prepared at Direction of Counsel Subject to FRE 408 Preliminary Draft for Discussion Purposes Only Run Rate G&A Expense1 46 (1)Represents employees and related compensation as of March 10, 2016 (2)Benefits assumed to be 21% of employee wages (3)Cash G&A expense in business plan includes other administrative expenses Employee1Compensation ($MM)1FunctionCountWagesBenefits2Total3Corporate Support25$2.3$0.5$2.8EH&S90.8 0.2 1.0 Executive42.2 0.5 2.7 Field Operations50.8 0.2 1.0 Finance & Accounting342.7 0.6 3.3 Information Systems151.7 0.4 2.1 Land / Land Administration181.9 0.4 2.3 Petrotechnical Staff / Support668.0 1.7 9.7 Total176$20.5$4.3$24.8
Private and Confidential – Subject to FRE 408 For Discussion Purposes Only Preliminary and Subject to Material Change Private and Confidential – Subject to FRE 408 For Discussion Purposes Only Preliminary and Subject to Material Change M IP & Existing Equity Agreement M ay 2016

Private and Confidential – Subject to FRE 408 For Discussion Purposes Only Preliminary and Subject to Material Change Management Incentive Plan (“MIP”) 1 Agreed Terms Total Award •10.00% of reorganized equity reserved for Management and New Board Upfront Grant •5.25%, vesting based on reasonable time and performance metrics as agreed by the New Board •Distribution of Upfront Grant to the Senior Management Team and the New Board Reserve •4.75%, to be allocated by New Board Chaparral Value Creation Plan (“CVCP”) •Maximum Potential Amount: 4.00% •Term: 4 years •Structure: 5 tranches with IRR range of 25-80% •Other: CVCP to be awarded to Management and New Board using the same distribution as Upfront Grant

Private and Confidential – Subject to FRE 408 For Discussion Purposes Only Preliminary and Subject to Material Change Reorganized Equity Allocation 2 Agreed Terms Senior Notes •100.00% of reorganized equity, subject to dilution from MIP and Warrants Existing Equity •Warrants for 7.50% of the fully diluted reorganized equity, subject to dilution only from MIP •Strike price at an equity value that results in a par plus accrued recovery to the Senior Notes (i.e. reorganized equity value of $1.208B plus accrued interest) •Interest accrues semi-annually at the non default rate over the life of the warrant, on the basis of the weighted average coupon on the Senior Notes •Tenor: 4 years from Plan Effective Date
PJT Partners Tudor, Pickering, Holt & Co. Milbank, Tweed, Hadley & McCloy Project Coyote RESTRUCTURING PROPOSAL COMPARISON April 26, 2016Confidential Subject to FRE 408 -- For Discussion Purposes Only Preliminary and Subject to Material Change

Term Sheet ComparisonConfidential Subject to FRE 408 -- For Discussion Purposes Only Preliminary and Subject to Material Change ` RBL Proposal (April 20) Ad Hoc Group Proposal (April 25) Illustrative Cram Treatment 1st Lien Conforming RBL Amount >Approximately $150 million (1) >$300 million borrowing base >Undrawn (1) >$150 million borrowing base (2) >N/A Tenor >3.5-year >5-year >N/A Grid Rate >L + 300 – 400 bps >L + 200 – 300 bps >N/A Redeter-mination >6 to 9-month holiday from emergence (first Spring 2017) >24-month holiday from emergence (first Fall 2018) >N/A Financial Covenants >Max. Total Leverage TBD >Min. Current Ratio 1.0x >Min. Asset Coverage TBD >Min. Liquidity $25 million(3) >TBD >N/A Fee >1.0% Upfront / OID >0.5% >N/A Takeback (provided to original RBL lenders) Amount >$100 million (4) >$275 million (4) >$445.4 million (2) Rate >L + 1200 bps >1% LIBOR floor >1% Amortization (begins yr. 2) >L + 500 bps >1% Amortization (begins yr. 2) >4.50% >1% Amortization (begins yr. 2) Tenor >4-year >6-year >7-year Fee >1.5% Upfront / OID >0.5% >None Note: Hedges terminated and monetization proceeds (to the extent permitted to be set-off) utilized to partially repay RBL. (1)Following paydown with excess balance sheet cash. (2)Equivalent to current drawn amount less hedge set-off, updated for April filing. (3)With anti-hoarding provision. (4)Fully drawn at emergence.
DISCUSSION MATERIALSApril 2016S T R I C T L Y P R I V A T E A N D C O N F I D E N T I A LCHA P ARRA L ENERGY INCJP Morgan

C O N F I D E N T I A LThis presentation was prepared exclusively for the benefit and internal use of the J.P. Morgan client to whom it is directly addressed and delivered (includingsuch client’s subsidiaries, the “Company”) in order to assist the Company in evaluating, on a preliminary basis, the feasibility of a possible transaction ortransactions and does not carry any right of publication or disclosure, in whole or in part, to any other party. This presentation is for discussion purposes onlyand is incomplete without reference to, and should be viewed solely in conjunction with, the oral briefing provided by J.P. Morgan. Neither this presentationnor any of its contents may be disclosed or used for any other purpose without the prior written consent of J.P. Morgan.This term sheet is being provided in furtherance of settlement discussions and is entitled to protection under Rule 408 of the Federal Rules of Evidence andany similar federal or state rule of evidence. The transactions described in this summary are subject in all respects to, among other things, execution anddelivery of definitive documentation and satisfaction or waiver of the conditions precedent set forth therein.The information in this presentation is based upon any management forecasts supplied to us and reflects prevailing conditions and our views as of this date,all of which are accordingly subject to change. J.P. Morgan’s opinions and estimates constitute J.P. Morgan’s judgment and should be regarded asindicative, preliminary and for illustrative purposes only. In preparing this presentation, we have relied upon and assumed, without independent verification,the accuracy and completeness of all information available from public sources or which was provided to us by or on behalf of the Company or which wasotherwise reviewed by us. In addition, our analyses are not and do not purport to be appraisals of the assets, stock, or business of the Company or any otherentity. J.P. Morgan makes no representations as to the actual value which may be received in connection with a transaction nor the legal, tax or accountingeffects of consummating a transaction. Unless expressly contemplated hereby, the information in this presentation does not take into account the effects of apossible transaction or transactions involving an actual or potential change of control, which may have significant valuation and other effects.Notwithstanding anything herein to the contrary, the Company and each of its employees, representatives or other agents may disclose to any and allpersons, without limitation of any kind, the U.S. federal and state income tax treatment and the U.S. federal and state income tax structure of the transactionscontemplated hereby and all materials of any kind (including opinions or other tax analyses) that are provided to the Company relating to such tax treatmentand tax structure insofar as such treatment and/or structure relates to a U.S. federal or state income tax strategy provided to the Company by J.P. Morgan.J.P. Morgan's policies on data privacy can be found at http://www.jpmorgan.com/pages/privacy.J.P. Morgan’s policies prohibit employees from offering, directly or indirectly, a favorable research rating or specific price target, or offering to change a ratingor price target, to a subject company as consideration or inducement for the receipt of business or for compensation. J.P. Morgan also prohibits its researchanalysts from being compensated for involvement in investment banking transactions except to the extent that such participation is intended to benefitinvestors.IRS Circular 230 Disclosure: JPMorgan Chase & Co. and its affiliates do not provide tax advice. Accordingly, any discussion of U.S. tax mattersincluded herein (including any attachments) is not intended or written to be used, and cannot be used, in connection with the promotion,marketing or recommendation by anyone not affiliated with JPMorgan Chase & Co. of any of the matters addressed herein or for the purpose ofavoiding U.S. tax-related penalties.J.P. Morgan is the marketing name for the Corporate and Investment Banking activities of JPMorgan Chase Bank, N.A., JPMS (member, NYSE),J.P. Morgan PLC authorized by the Prudential Regulation Authority and regulated by the Financial Conduct Authority and the Prudential Regulation Authorityand their investment banking affiliates.This presentation does not constitute a commitment by any J.P. Morgan entity to underwrite, subscribe for or place any securities or to extend or arrangecredit or to provide any other services.Copyright 2016 JPMorgan Chase & Co. All rights reserved.D I S C U S S I O N M A T E R I A L SCHA P ARRA L ENERGY INCJP Morgan

C O N F I D E N T I A LIndicative terms and conditionsIndicative terms and conditions (subject to continuing review, diligence and approval)Borrower: Chaparral Energy, L.L.C. et. al. (including any and all existing and future subsidiaries of the Parent) (the “Borrowers”)Parent Guarantor: Chaparral Energy, Inc. (the “Parent” and with the Borrowers, the “Loan Parties”)Security: n First priority perfected liens on at least 95% of the PV-9 of proved oil and gas reserves (including title on 90% of the PV-9)n Pledge of substantially all personal property of the Borrower and each Guarantor (including cash pursuant to DACAs)n PV-9 to be determined using Administrative Agent’s price deckFacility: Type Max Commitment Maturity Coupon Comm. Fee OID/Upfront feeExit RBL credit facility(“Exit RBL”)$300mm($150mm drawn at close)3.5 years L + 300-400 bps (with grid based onutilization)50 bps 100 bpsExit second out termloan (“Exit TL”)$100mm(fully-drawn at close)4 years L + 1200 bps (with LIBOR floor of 1%) N/A 150 bpsTerm LoanAmortization:n 1.00% per annum based on original principal amount of the Exit TL starting in year 2Borrowing base: n The Exit RBL to be subject to a borrowing base with advance rates customary for transactions of this type and customary borrowing baseprovisions (subject to the below), including:n First redetermination to occur May of 2017 and semi-annually thereafter (with 1 interim redetermination permitted between scheduledredeterminations for each of (x) Borrower and (y) Administrative Agent or Required RBL Lenders)n Insufficient title will result in a borrowing base decreaseFinancialcovenants:n Maximum Total Leverage Ratio TBDn Minimum Current Ratio of 1.0xn Minimum Asset Coverage Ratio TBDn Minimum Liquidity (including unrestricted cash on hand and revolver availability) $25mm with anti-hoardingDocumentation: Documentation to be prepared by counsel to the Administrative AgentTerms: n Representations, covenants, events of default and other terms not specified herein shall be usual and customary for RBL facilitiesn Asset sales and hedge unwinds not permitted to exceed an aggregate amount of 2.5% of the borrowing base in between redeterminationsn Permit second out term loan; no additional baskets for junior lien or unsecured debtUse of proceeds: To (i) fund (A) emergence from Chapter 11 and (B) deemed repayment of all borrowings under the pre-petition RBL facility and (ii) provideworking capital and for other general corporate purposes of the Loan PartiesReportingrequirements:Usual and customary for transactions of this type, including:n Borrower-prepared mid-year reserve reportn Year-end reserve report prepared by Cawley, Gillespie & Associates, Inc.n Receipt of audited year-end financial statementsn Receipt of quarterly unaudited financial statementsn 5 years of quarterly detailed projections, reasonably acceptable to the Lenders and the Administrative Agentn Receipt of quarterly compliance certificatesD I S C U S S I O N M A T E R I A L S1CHA P ARRA L ENERGY INC JP Morgan

C O N F I D E N T I A LIndicative terms and conditionsIndicative terms and conditions (subject to continuing review, diligence and approval)Conditions precedentto closing and initialloan:Usual and customary for transactions of this type, including:n The Exit Facility Documentation, Plan of Reorganization and the order (or orders) of the Bankruptcy Court confirming the Plan ofReorganization shall be reasonably satisfactory to each of Lead Arranger and Administrative Agent in terms of its treatment andreleasesn The order (or orders) confirming the Plan of Reorganization shall be final and not stayedn Effective Date under the Plan shall have occurredn Administrative Agent’s reasonable satisfaction that the claims against or interests in the Borrower and the Guarantors have beensatisfied or otherwise addressed as set forth in the Plann Pro forma financials as of closing daten Receipt of documentation required for applicable “know your customer” and anti-money laundering rules and regulationsn Guarantees shall have been executed and all documents required to perfect security interest in the collateral shall have been executedand delivered and, in each case, all such guarantees and documents shall be in full force and effectn Execution and delivery of the Exit Facility Documentation; delivery of customary opinions and closing documentationn Receipt of reasonably satisfactory title opinions with respect to at least 90% of the PV-9 value of proved oil and gas properties in theinitial Reserve Reportn Receipt of all necessary governmental and third party consents and approvalsn Receipt of evidence of pro forma unrestricted cash (together with unused commitments under the Exit RBL) of not less than an amountto be mutually agreedn All representations and warranties in the Exit Facility Documentation shall be true and correct in all material respects and there shall beno defaultn All fees required to be paid on the Closing Date (incl. reasonable and documented out-of-pocket expenses) shall have been paidn Closing of the Facility shall have occurred on or before a date to be mutually agreedn Such other terms and provisions as may be reasonably required by the Lead Arranger and Administrative AgentConditions precedentto each creditextension:Usual and customary for transactions of this typePre-Petition Hedges: n This proposal assumes that all pre-petition hedges to be terminated to provide a source of repayment of pre-petition RBLSole lead arrangerand bookrunner:n JPMorgan Chase Bank, N.A.Administrative agent: n JPMorgan Chase Bank, N.A.D I S C U S S I O N M A T E R I A L S2JPMorgan