Attached files
| file | filename |
|---|---|
| 8-K - 8-K - Walgreens Boots Alliance, Inc. | d169711d8k.htm |
Fixed income investor presentation May 2016 Exhibit 99.1
Statements in these materials that are not historical are forward-looking statements made based on current market, business and regulatory expectations and involve risks, uncertainties and assumptions that could cause actual results to vary materially. Except to the extent required by the law, we undertake no obligation to update publicly any forward-looking statement after this presentation, whether as a result of new information, future events, changes in assumptions or otherwise. Please see the “Cautionary note regarding forward-looking statements” on the attached Appendix and our latest 10-K for a discussion of risk factors as they relate to forward-looking statements. This document and any related presentation does not constitute an offer or invitation to subscribe for or purchase any securities, and it should not be construed as an offering document. Any decision to purchase securities in the context of a proposed offering, if any, should be made on the basis of information contained in the offering document published in relation to such an offering. This presentation does not constitute a recommendation regarding any securities of Walgreens Boots Alliance, Inc. Walgreens Boots Alliance, Inc. has filed a registration statement (including a prospectus) with the SEC. Before you invest in securities that may be offered by Walgreens Boots Alliance, Inc. in the future, if any, you should read the prospectus in that registration statement and the prospectus supplement for any such offering and the other documents Walgreens Boots Alliance, Inc. has filed with the SEC for more complete information about Walgreens Boots Alliance, Inc. and any such potential offering. You may get these documents for free by visiting EDGAR on the SEC website at http://www.sec.gov. Alternatively, you may request a copy of the prospectus by calling Walgreens Boots Alliance, Inc. at +1 (847) 315-2922 or by contacting any underwriter or any dealer participating in any offering. Today’s presentation includes certain non-GAAP financial measures. These measures may be different from non-GAAP financial measures used by other companies. The presentation of this financial information, which is not prepared under any comprehensive set of accounting rules or principles, is not intended to be considered in isolation of, or as a substitute for, the financial information prepared and presented in accordance with GAAP. We refer you to the Appendix of these presentation materials for reconciliations to the most directly comparable GAAP financial measures and related information. All financial data for interim and LTM periods is unaudited. Forward-looking statements and general notice
Agenda Company highlights 4 WBA segments and brands overview11 Pending Rite Aid acquisition overview19 Q&A23 Appendix24
Company highlights
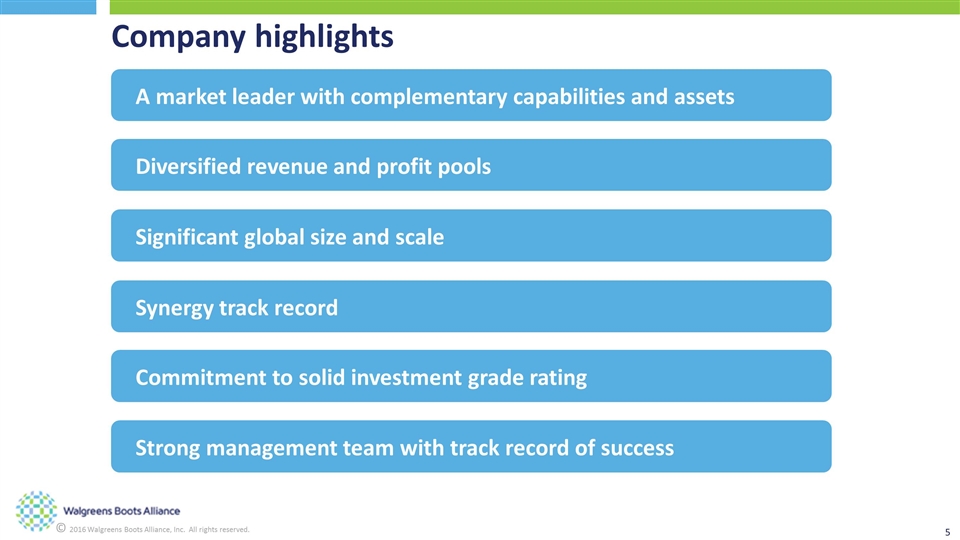
Company highlights 10 A market leader with complementary capabilities and assets Significant global size and scale Diversified revenue and profit pools Synergy track record Commitment to solid investment grade rating Strong management team with track record of success
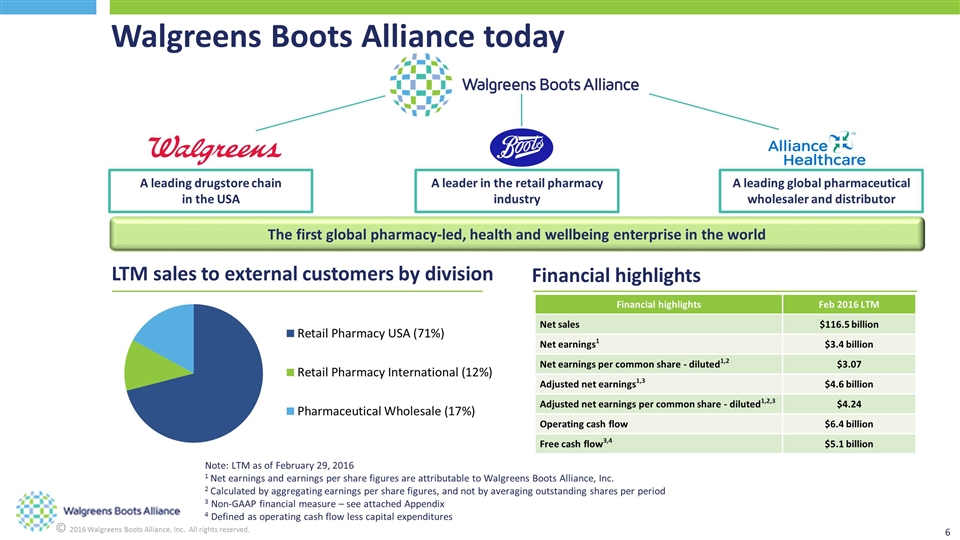
LTM sales to external customers by division Financial highlights A leader in the retail pharmacy industry A leading global pharmaceutical wholesaler and distributor A leading drugstore chain in the USA The first global pharmacy-led, health and wellbeing enterprise in the world Walgreens Boots Alliance today Note: LTM as of February 29, 2016 1 Net earnings and earnings per share figures are attributable to Walgreens Boots Alliance, Inc. 2 Calculated by aggregating earnings per share figures, and not by averaging outstanding shares per period 3 Non-GAAP financial measure – see attached Appendix 4 Defined as operating cash flow less capital expenditures Financial highlights Feb 2016 LTM Net sales $116.5 billion Net earnings1 $3.4 billion Net earnings per common share - diluted1,2 $3.07 Adjusted net earnings1,3 $4.6 billion Adjusted net earnings per common share - diluted1,2,3 $4.24 Operating cash flow $6.4 billion Free cash flow3,4 $5.1 billion
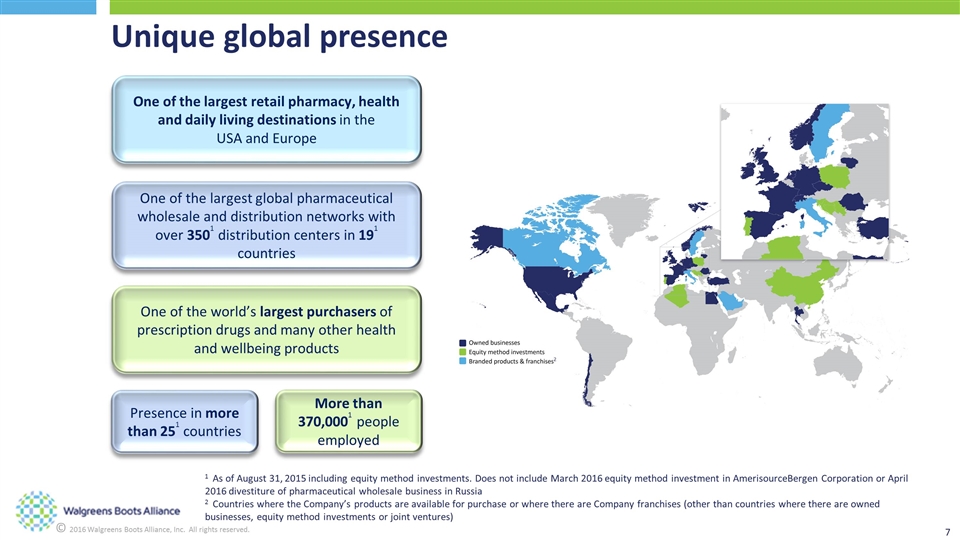
Unique global presence One of the largest global pharmaceutical wholesale and distribution networks with over 3501 distribution centers in 191 countries One of the largest retail pharmacy, health and daily living destinations in the USA and Europe One of the world’s largest purchasers of prescription drugs and many other health and wellbeing products Presence in more than 251 countries More than 370,0001 people employed 1 As of August 31, 2015 including equity method investments. Does not include March 2016 equity method investment in AmerisourceBergen Corporation or April 2016 divestiture of pharmaceutical wholesale business in Russia 2 Countries where the Company’s products are available for purchase or where there are Company franchises (other than countries where there are owned businesses, equity method investments or joint ventures) 2 2
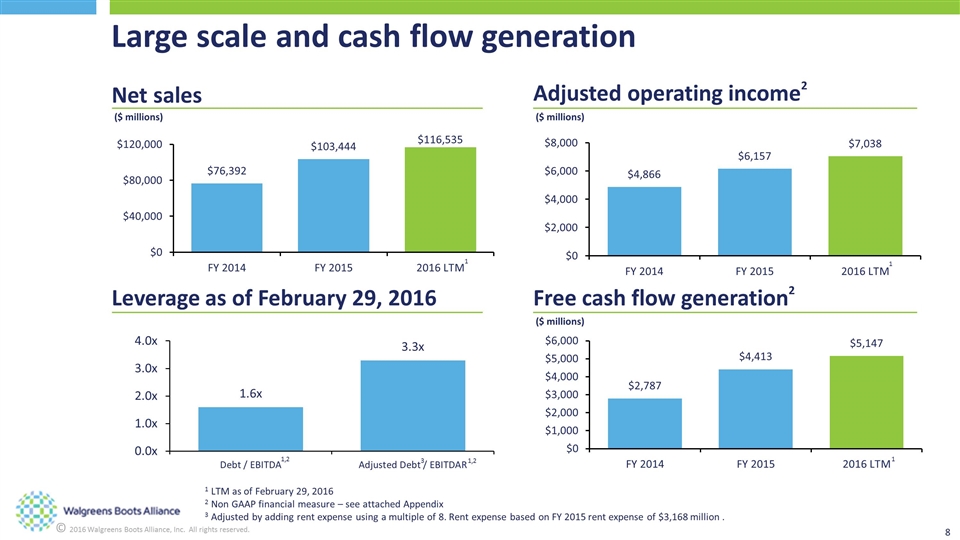
Large scale and cash flow generation Net sales Adjusted operating income2 Leverage as of February 29, 2016 Free cash flow generation2 1 LTM as of February 29, 2016 2 Non GAAP financial measure – see attached Appendix 3 Adjusted by adding rent expense using a multiple of 8. Rent expense based on FY 2015 rent expense of $3,168 million . 1,2 ($ millions) ($ millions) ($ millions) 1,2 3 1 1 1
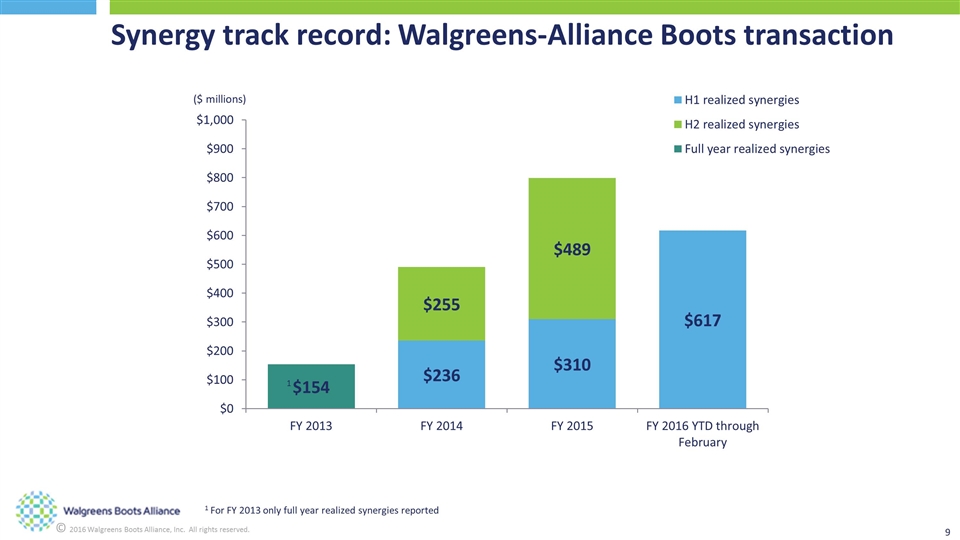
Synergy track record: Walgreens-Alliance Boots transaction ($ millions) 1 For FY 2013 only full year realized synergies reported 1
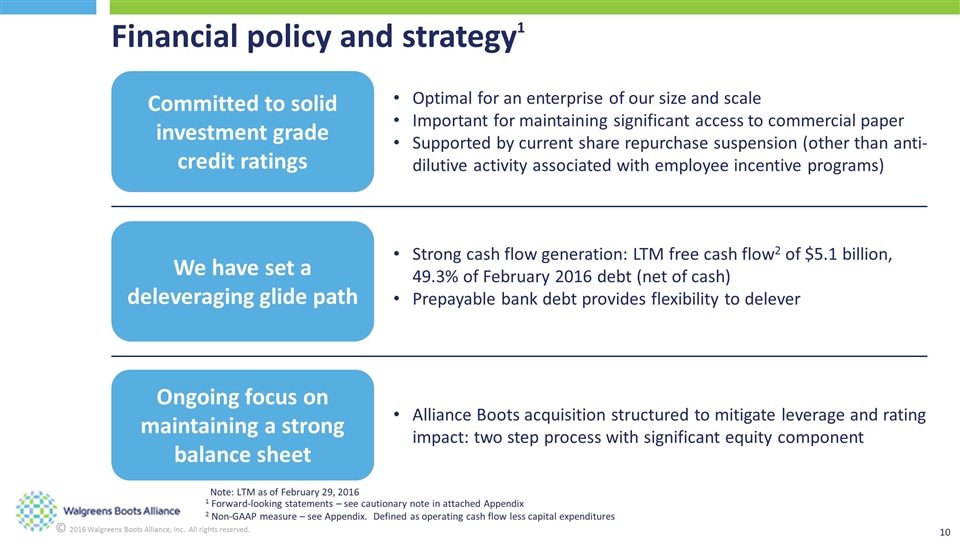
Financial policy and strategy1 Committed to solid investment grade credit ratings Optimal for an enterprise of our size and scale Important for maintaining significant access to commercial paper Supported by current share repurchase suspension (other than anti-dilutive activity associated with employee incentive programs) We have set a deleveraging glide path Strong cash flow generation: LTM free cash flow2 of $5.1 billion, 49.3% of February 2016 debt (net of cash) Prepayable bank debt provides flexibility to delever Ongoing focus on maintaining a strong balance sheet Alliance Boots acquisition structured to mitigate leverage and rating impact: two step process with significant equity component Note: LTM as of February 29, 2016 1 Forward-looking statements – see cautionary note in attached Appendix 2 Non-GAAP measure – see Appendix. Defined as operating cash flow less capital expenditures
WBA segments and brands overview
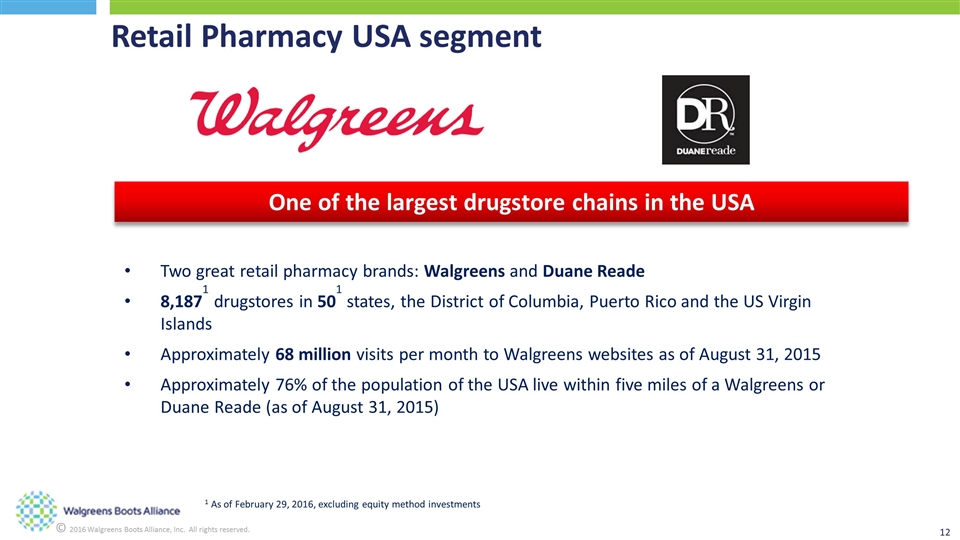
Retail Pharmacy USA segment Two great retail pharmacy brands: Walgreens and Duane Reade 8,1871 drugstores in 501 states, the District of Columbia, Puerto Rico and the US Virgin Islands Approximately 68 million visits per month to Walgreens websites as of August 31, 2015 Approximately 76% of the population of the USA live within five miles of a Walgreens or Duane Reade (as of August 31, 2015) One of the largest drugstore chains in the USA 1 As of February 29, 2016, excluding equity method investments
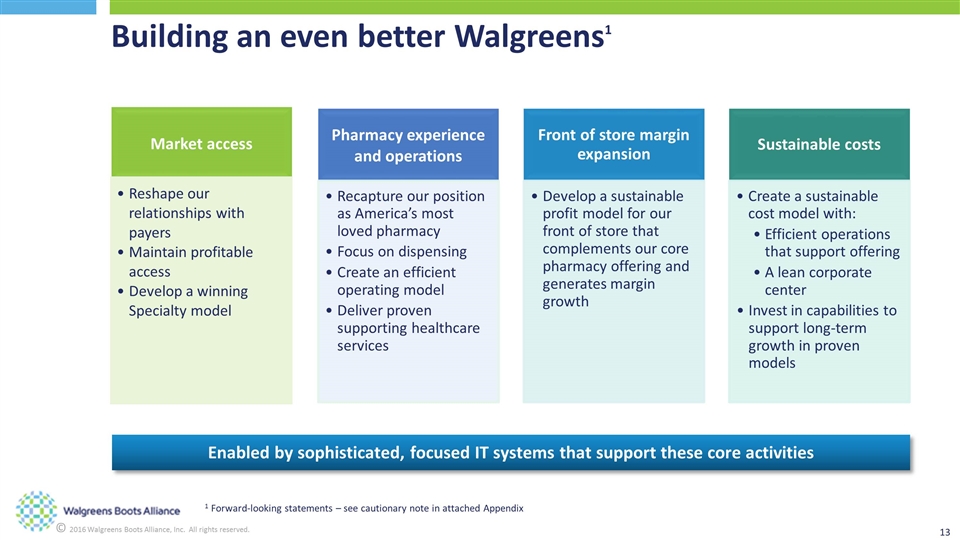
Building an even better Walgreens1 Enabled by sophisticated, focused IT systems that support these core activities 1 Forward-looking statements – see cautionary note in attached Appendix Recapture our position as America’s most loved pharmacy Focus on dispensing Front of store margin expansion Develop a sustainable profit model for our front of store that complements our core pharmacy offering and generates margin growth Sustainable costs Create a sustainable cost model with: A lean corporate center Invest in capabilities to support long-term growth in proven models Reshape our relationships with payers Create an efficient operating model Deliver proven supporting healthcare services Maintain profitable access Develop a winning Specialty model Efficient operations that support offering Pharmacy experience and operations Market access
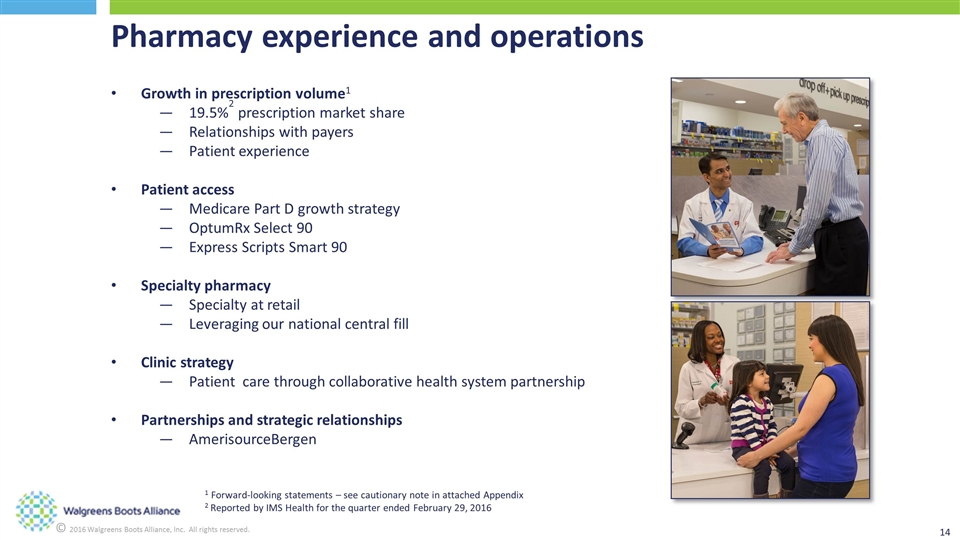
Pharmacy experience and operations Growth in prescription volume1 19.5%2 prescription market share Relationships with payers Patient experience Patient access Medicare Part D growth strategy OptumRx Select 90 Express Scripts Smart 90 Specialty pharmacy Specialty at retail Leveraging our national central fill Clinic strategy Patient care through collaborative health system partnership Partnerships and strategic relationships AmerisourceBergen 1 Forward-looking statements – see cautionary note in attached Appendix 2 Reported by IMS Health for the quarter ended February 29, 2016
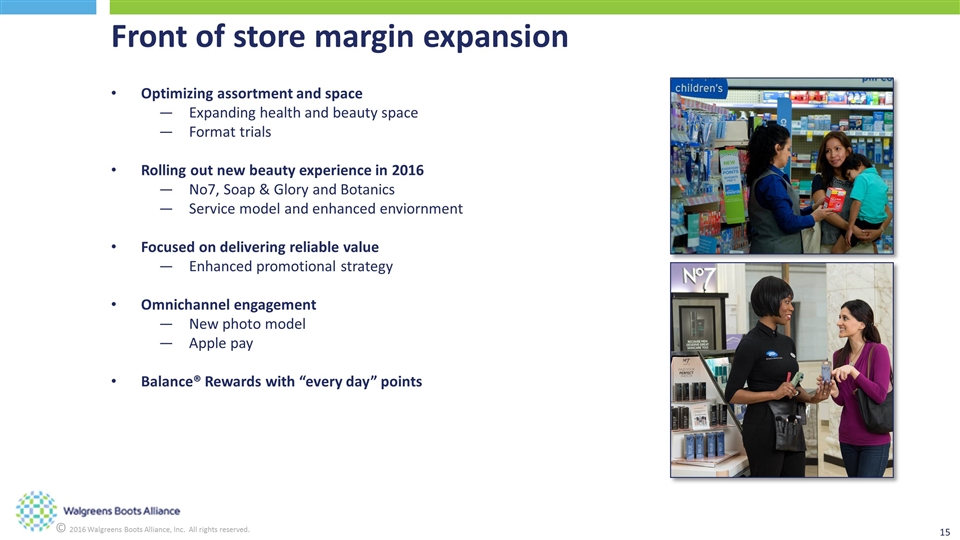
Front of store margin expansion Optimizing assortment and space Expanding health and beauty space Format trials Rolling out new beauty experience in 2016 No7, Soap & Glory and Botanics Service model and enhanced enviornment Focused on delivering reliable value Enhanced promotional strategy Omnichannel engagement New photo model Apple pay Balance® Rewards with “every day” points
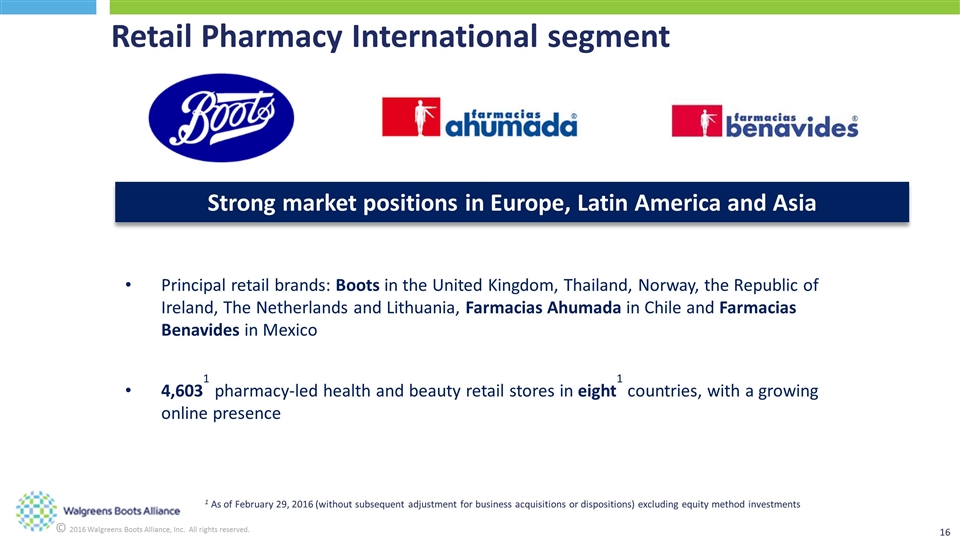
Retail Pharmacy International segment Strong market positions in Europe, Latin America and Asia Principal retail brands: Boots in the United Kingdom, Thailand, Norway, the Republic of Ireland, The Netherlands and Lithuania, Farmacias Ahumada in Chile and Farmacias Benavides in Mexico 4,6031 pharmacy-led health and beauty retail stores in eight1 countries, with a growing online presence 1 As of February 29, 2016 (without subsequent adjustment for business acquisitions or dispositions) excluding equity method investments
Pharmaceutical Wholesale segment A leading pharmaceutical wholesaler in Europe Mainly operating under the Alliance Healthcare brand A network of 3021 distribution centers delivering medicines, other healthcare products and related services to more than 140,0002 pharmacies, doctors, health centers and hospitals each year in 121 countries Value added services: Alphega Pharmacy, Alloga, Alcura and Skills in healthcare 1 As of August 31, 2015 (without subsequent adjustment for business acquisitions or dispositions) excluding equity method investments 2 For 12 months ended August 31, 2015 (without any subsequent adjustment for business acquisitions or dispositions) excluding equity method investments
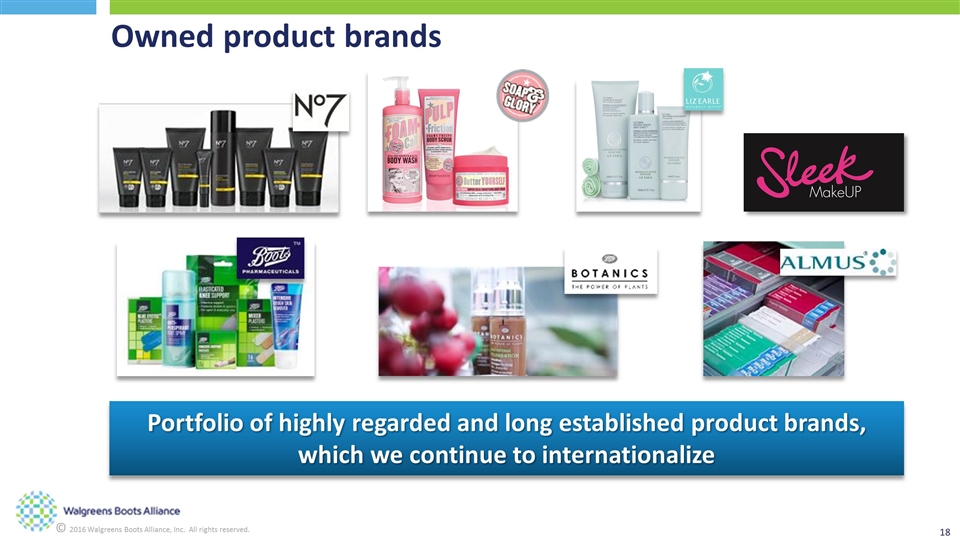
Owned product brands Portfolio of highly regarded and long established product brands, which we continue to internationalize
Pending Rite Aid acquisition overview
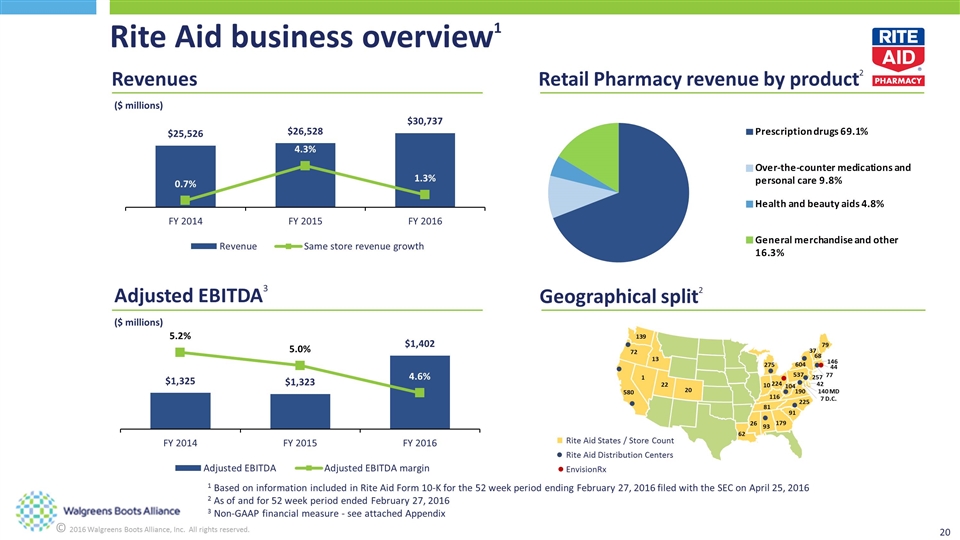
Rite Aid business overview1 Revenues Retail Pharmacy revenue by product2 Adjusted EBITDA3 ($ millions) ($ millions) Geographical split2 104 139 37 190 22 81 91 72 224 604 1 225 26 275 79 62 116 10 13 179 20 580 93 537 68 146 44 77 257 42 140 MD 7 D.C. Rite Aid States / Store Count Rite Aid Distribution Centers EnvisionRx 1 Based on information included in Rite Aid Form 10-K for the 52 week period ending February 27, 2016 filed with the SEC on April 25, 2016 2 As of and for 52 week period ended February 27, 2016 3 Non-GAAP financial measure - see attached Appendix
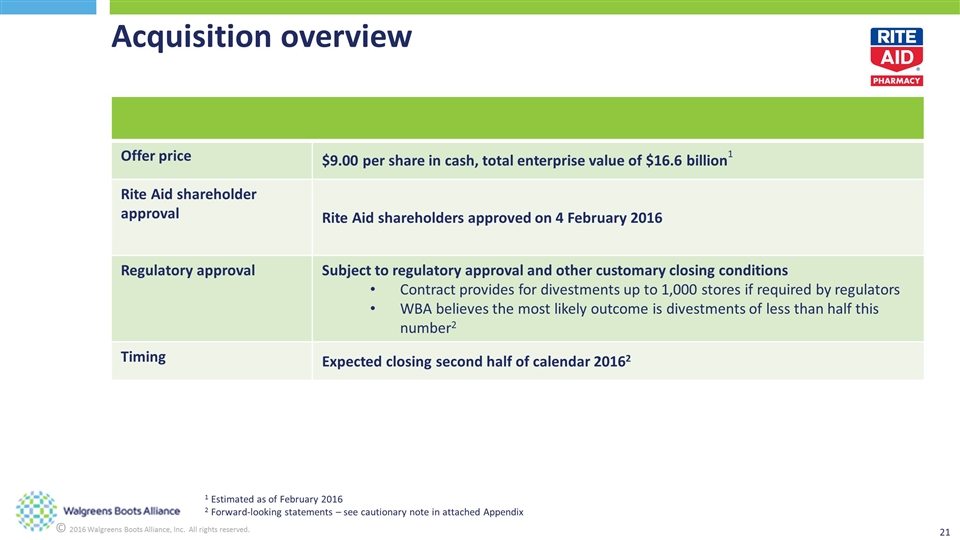
Acquisition overview Offer price $9.00 per share in cash, total enterprise value of $16.6 billion1 Rite Aid shareholder approval Rite Aid shareholders approved on 4 February 2016 Regulatory approval Subject to regulatory approval and other customary closing conditions Contract provides for divestments up to 1,000 stores if required by regulators WBA believes the most likely outcome is divestments of less than half this number2 Timing Expected closing second half of calendar 20162 1 Estimated as of February 2016 2 Forward-looking statements – see cautionary note in attached Appendix
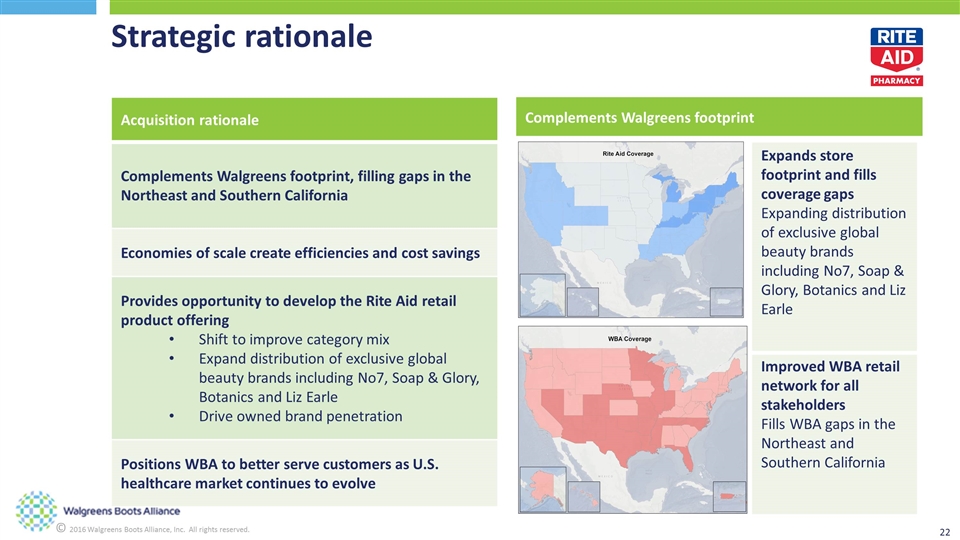
Strategic rationale Acquisition rationale Complements Walgreens footprint, filling gaps in the Northeast and Southern California Economies of scale create efficiencies and cost savings Provides opportunity to develop the Rite Aid retail product offering Shift to improve category mix Expand distribution of exclusive global beauty brands including No7, Soap & Glory, Botanics and Liz Earle Drive owned brand penetration Positions WBA to better serve customers as U.S. healthcare market continues to evolve Expands store footprint and fills coverage gaps Expanding distribution of exclusive global beauty brands including No7, Soap & Glory, Botanics and Liz Earle Improved WBA retail network for all stakeholders Fills WBA gaps in the Northeast and Southern California Complements Walgreens footprint
Q&A
Appendix
The following information provides reconciliations of the supplemental non-GAAP financial measures, as defined under SEC rules, presented in this presentation to the most directly comparable financial measures calculated and presented in accordance with generally accepted accounting principles in the United States (GAAP). The company has provided these non-GAAP financial measures in the presentation, which are not calculated or presented in accordance with GAAP, as supplemental information in addition to the financial measures that are calculated and presented in accordance with GAAP. These supplemental non-GAAP financial measures are presented because management has evaluated the company’s financial results both including and excluding the adjusted items and believes that the non-GAAP financial measures presented provide additional perspective and insights when analyzing the core operating performance of the Company’s business from period to period and trends in the company’s historical operating results. The company does not provide a non-GAAP reconciliation for non-GAAP estimates on a forward-looking basis where it is unable to provide a meaningful or accurate calculation or estimation of reconciling items and the information is not available without unreasonable effort. The supplemental non-GAAP financial measures presented should not be considered superior to, as a substitute for or as an alternative to, and should be considered in conjunction with, the GAAP financial measures presented in the presentation.
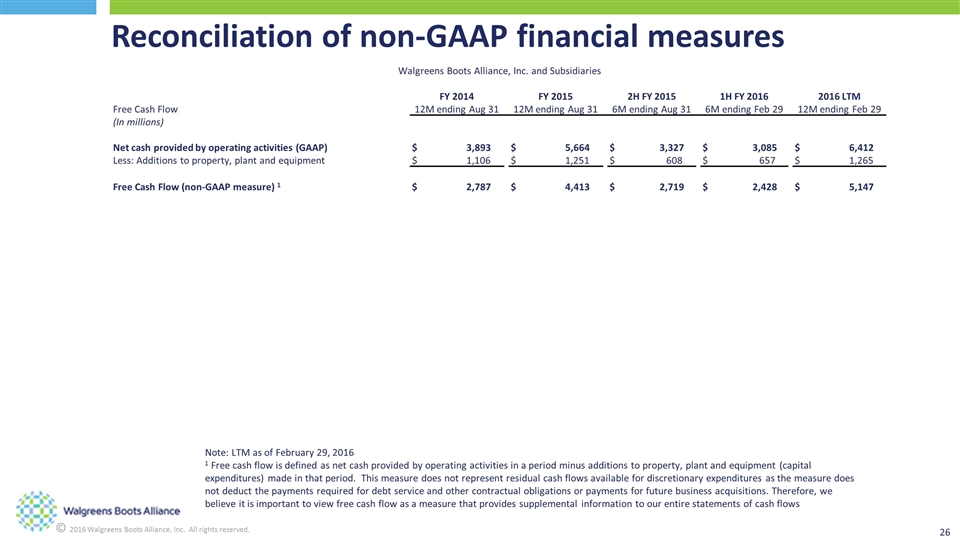
Reconciliation of non-GAAP financial measures Note: LTM as of February 29, 2016 1 Free cash flow is defined as net cash provided by operating activities in a period minus additions to property, plant and equipment (capital expenditures) made in that period. This measure does not represent residual cash flows available for discretionary expenditures as the measure does not deduct the payments required for debt service and other contractual obligations or payments for future business acquisitions. Therefore, we believe it is important to view free cash flow as a measure that provides supplemental information to our entire statements of cash flows Walgreens Boots Alliance, Inc. and Subsidiaries FY 2014 FY 2015 2H FY 2015 1H FY 2016 2016 LTM Free Cash Flow 12M ending Aug 31 12M ending Aug 31 6M ending Aug 31 6M ending Feb 29 12M ending Feb 29 (In millions) Net cash provided by operating activities (GAAP) $ 3,893 $ 5,664 $ 3,327 $ 3,085 $ 6,412 Less: Additions to property, plant and equipment $ 1,106 $ 1,251 $ 608 $ 657 $ 1,265 Free Cash Flow (non-GAAP measure) 1 $ 2,787 $ 4,413 $ 2,719 $ 2,428 $ 5,147
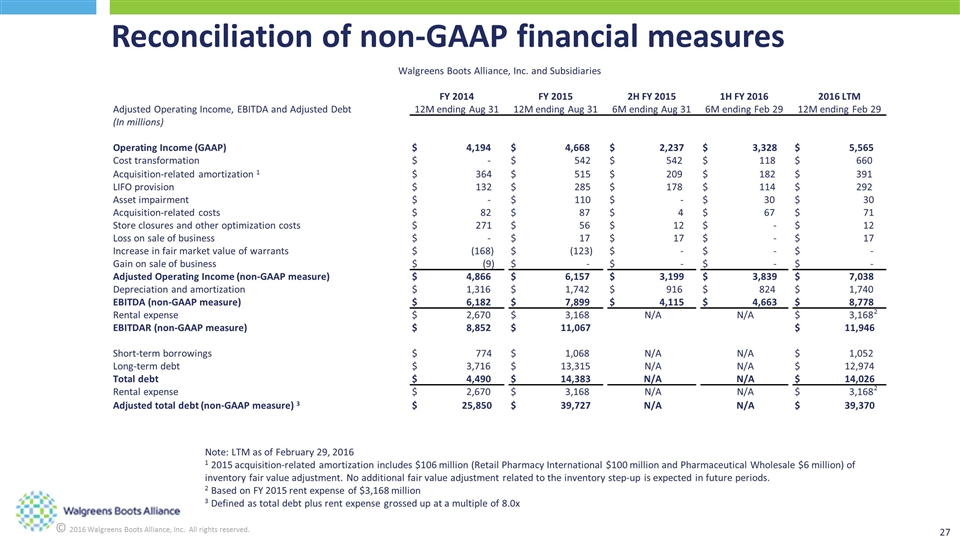
Walgreens Boots Alliance, Inc. and Subsidiaries FY 2014 FY 2015 2H FY 2015 1H FY 2016 2016 LTM Adjusted Operating Income, EBITDA and Adjusted Debt 12M ending Aug 31 12M ending Aug 31 6M ending Aug 31 6M ending Feb 29 12M ending Feb 29 (In millions) Operating Income (GAAP) $ 4,194 $ 4,668 $ 2,237 $ 3,328 $ 5,565 Cost transformation $ - $ 542 $ 542 $ 118 $ 660 Acquisition-related amortization 1 $ 364 $ 515 $ 209 $ 182 $ 391 LIFO provision $ 132 $ 285 $ 178 $ 114 $ 292 Asset impairment $ - $ 110 $ - $ 30 $ 30 Acquisition-related costs $ 82 $ 87 $ 4 $ 67 $ 71 Store closures and other optimization costs $ 271 $ 56 $ 12 $ - $ 12 Loss on sale of business $ - $ 17 $ 17 $ - $ 17 Increase in fair market value of warrants $ (168) $ (123) $ - $ - $ - Gain on sale of business $ (9) $ - $ - $ - $ - Adjusted Operating Income (non-GAAP measure) $ 4,866 $ 6,157 $ 3,199 $ 3,839 $ 7,038 Depreciation and amortization $ 1,316 $ 1,742 $ 916 $ 824 $ 1,740 EBITDA (non-GAAP measure) $ 6,182 $ 7,899 $ 4,115 $ 4,663 $ 8,778 Rental expense $ 2,670 $ 3,168 N/A N/A $ 3,168 EBITDAR (non-GAAP measure) $ 8,852 $ 11,067 $ 11,946 Short-term borrowings $ 774 $ 1,068 N/A N/A $ 1,052 Long-term debt $ 3,716 $ 13,315 N/A N/A $ 12,974 Total debt $ 4,490 $ 14,383 N/A N/A $ 14,026 Rental expense $ 2,670 $ 3,168 N/A N/A $ 3,168 Adjusted total debt (non-GAAP measure) 3 $ 25,850 $ 39,727 N/A N/A $ 39,370 Note: LTM as of February 29, 2016 1 2015 acquisition-related amortization includes $106 million (Retail Pharmacy International $100 million and Pharmaceutical Wholesale $6 million) of inventory fair value adjustment. No additional fair value adjustment related to the inventory step-up is expected in future periods. 2 Based on FY 2015 rent expense of $3,168 million 3 Defined as total debt plus rent expense grossed up at a multiple of 8.0x Reconciliation of non-GAAP financial measures 2 2
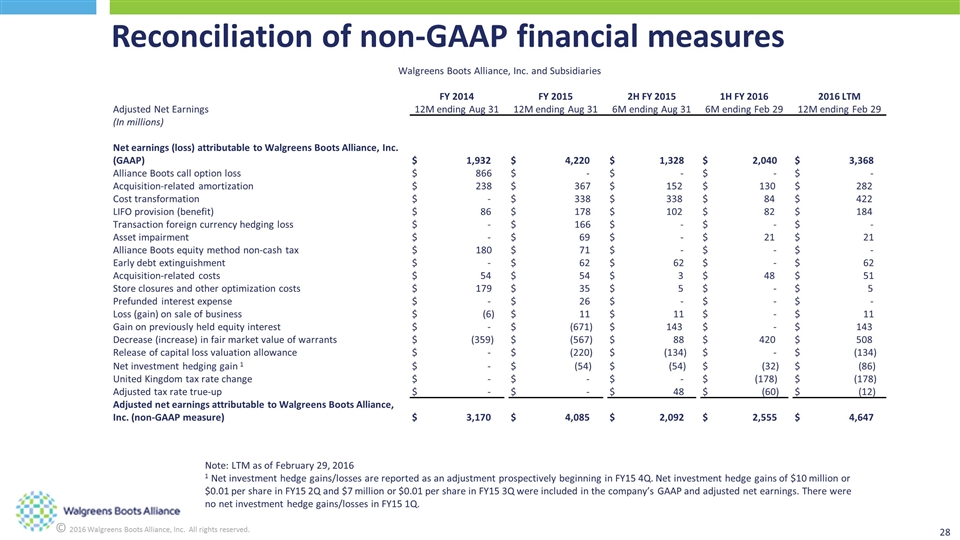
Note: LTM as of February 29, 2016 1 Net investment hedge gains/losses are reported as an adjustment prospectively beginning in FY15 4Q. Net investment hedge gains of $10 million or $0.01 per share in FY15 2Q and $7 million or $0.01 per share in FY15 3Q were included in the company’s GAAP and adjusted net earnings. There were no net investment hedge gains/losses in FY15 1Q. Reconciliation of non-GAAP financial measures Walgreens Boots Alliance, Inc. and Subsidiaries FY 2014 FY 2015 2H FY 2015 1H FY 2016 2016 LTM Adjusted Net Earnings 12M ending Aug 31 12M ending Aug 31 6M ending Aug 31 6M ending Feb 29 12M ending Feb 29 (In millions) Net earnings (loss) attributable to Walgreens Boots Alliance, Inc. (GAAP) $ 1,932 $ 4,220 $ 1,328 $ 2,040 $ 3,368 Alliance Boots call option loss $ 866 $ - $ - $ - $ - Acquisition-related amortization $ 238 $ 367 $ 152 $ 130 $ 282 Cost transformation $ - $ 338 $ 338 $ 84 $ 422 LIFO provision (benefit) $ 86 $ 178 $ 102 $ 82 $ 184 Transaction foreign currency hedging loss $ - $ 166 $ - $ - $ - Asset impairment $ - $ 69 $ - $ 21 $ 21 Alliance Boots equity method non-cash tax $ 180 $ 71 $ - $ - $ - Early debt extinguishment $ - $ 62 $ 62 $ - $ 62 Acquisition-related costs $ 54 $ 54 $ 3 $ 48 $ 51 Store closures and other optimization costs $ 179 $ 35 $ 5 $ - $ 5 Prefunded interest expense $ - $ 26 $ - $ - $ - Loss (gain) on sale of business $ (6) $ 11 $ 11 $ - $ 11 Gain on previously held equity interest $ - $ (671) $ 143 $ - $ 143 Decrease (increase) in fair market value of warrants $ (359) $ (567) $ 88 $ 420 $ 508 Release of capital loss valuation allowance $ - $ (220) $ (134) $ - $ (134) Net investment hedging gain 1 $ - $ (54) $ (54) $ (32) $ (86) United Kingdom tax rate change $ - $ - $ - $ (178) $ (178) Adjusted tax rate true-up $ - $ - $ 48 $ (60) $ (12) Adjusted net earnings attributable to Walgreens Boots Alliance, Inc. (non-GAAP measure) $ 3,170 $ 4,085 $ 2,092 $ 2,555 $ 4,647
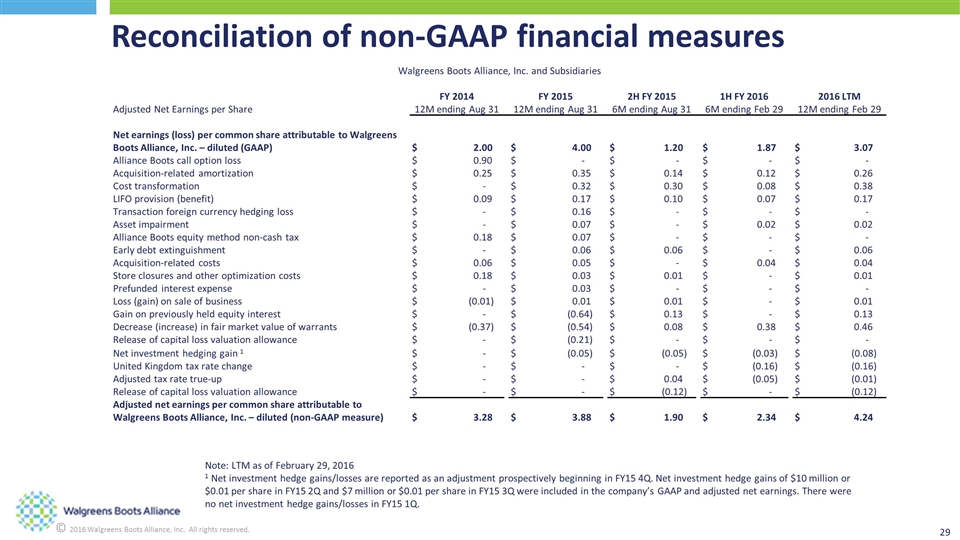
Note: LTM as of February 29, 2016 1 Net investment hedge gains/losses are reported as an adjustment prospectively beginning in FY15 4Q. Net investment hedge gains of $10 million or $0.01 per share in FY15 2Q and $7 million or $0.01 per share in FY15 3Q were included in the company’s GAAP and adjusted net earnings. There were no net investment hedge gains/losses in FY15 1Q. Reconciliation of non-GAAP financial measures Walgreens Boots Alliance, Inc. and Subsidiaries FY 2014 FY 2015 2H FY 2015 1H FY 2016 2016 LTM Adjusted Net Earnings per Share 12M ending Aug 31 12M ending Aug 31 6M ending Aug 31 6M ending Feb 29 12M ending Feb 29 Net earnings (loss) per common share attributable to Walgreens Boots Alliance, Inc. – diluted (GAAP) $ 2.00 $ 4.00 $ 1.20 $ 1.87 $ 3.07 Alliance Boots call option loss $ 0.90 $ - $ - $ - $ - Acquisition-related amortization $ 0.25 $ 0.35 $ 0.14 $ 0.12 $ 0.26 Cost transformation $ - $ 0.32 $ 0.30 $ 0.08 $ 0.38 LIFO provision (benefit) $ 0.09 $ 0.17 $ 0.10 $ 0.07 $ 0.17 Transaction foreign currency hedging loss $ - $ 0.16 $ - $ - $ - Asset impairment $ - $ 0.07 $ - $ 0.02 $ 0.02 Alliance Boots equity method non-cash tax $ 0.18 $ 0.07 $ - $ - $ - Early debt extinguishment $ - $ 0.06 $ 0.06 $ - $ 0.06 Acquisition-related costs $ 0.06 $ 0.05 $ - $ 0.04 $ 0.04 Store closures and other optimization costs $ 0.18 $ 0.03 $ 0.01 $ - $ 0.01 Prefunded interest expense $ - $ 0.03 $ - $ - $ - Loss (gain) on sale of business $ (0.01) $ 0.01 $ 0.01 $ - $ 0.01 Gain on previously held equity interest $ - $ (0.64) $ 0.13 $ - $ 0.13 Decrease (increase) in fair market value of warrants $ (0.37) $ (0.54) $ 0.08 $ 0.38 $ 0.46 Release of capital loss valuation allowance $ - $ (0.21) $ - $ - $ - Net investment hedging gain 1 $ - $ (0.05) $ (0.05) $ (0.03) $ (0.08) United Kingdom tax rate change $ - $ - $ - $ (0.16) $ (0.16) Adjusted tax rate true-up $ - $ - $ 0.04 $ (0.05) $ (0.01) Release of capital loss valuation allowance $ - $ - $ (0.12) $ - $ (0.12) Adjusted net earnings per common share attributable to Walgreens Boots Alliance, Inc. – diluted (non-GAAP measure) $ 3.28 $ 3.88 $ 1.90 $ 2.34 $ 4.24
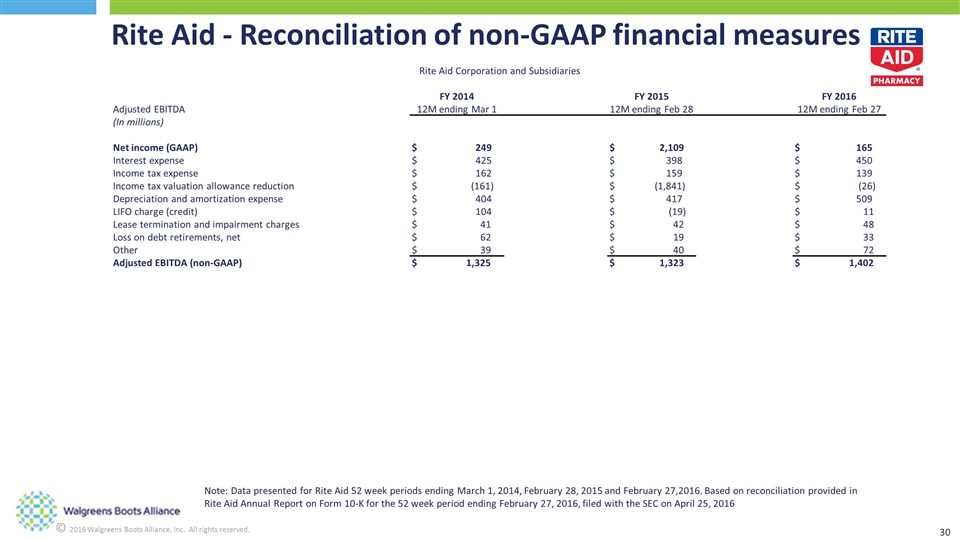
Rite Aid - Reconciliation of non-GAAP financial measures Note: Data presented for Rite Aid 52 week periods ending March 1, 2014, February 28, 2015 and February 27,2016. Based on reconciliation provided in Rite Aid Annual Report on Form 10-K for the 52 week period ending February 27, 2016, filed with the SEC on April 25, 2016 Rite Aid Corporation and Subsidiaries FY 2014 FY 2015 FY 2016 Adjusted EBITDA 12M ending Mar 1 12M ending Feb 28 12M ending Feb 27 (In millions) Net income (GAAP) $ 249 $ 2,109 $ 165 Interest expense $ 425 $ 398 $ 450 Income tax expense $ 162 $ 159 $ 139 Income tax valuation allowance reduction $ (161) $ (1,841) $ (26) Depreciation and amortization expense $ 404 $ 417 $ 509 LIFO charge (credit) $ 104 $ (19) $ 11 Lease termination and impairment charges $ 41 $ 42 $ 48 Loss on debt retirements, net $ 62 $ 19 $ 33 Other $ 39 $ 40 $ 72 Adjusted EBITDA (non-GAAP) $ 1,325 $ 1,323 $ 1,402
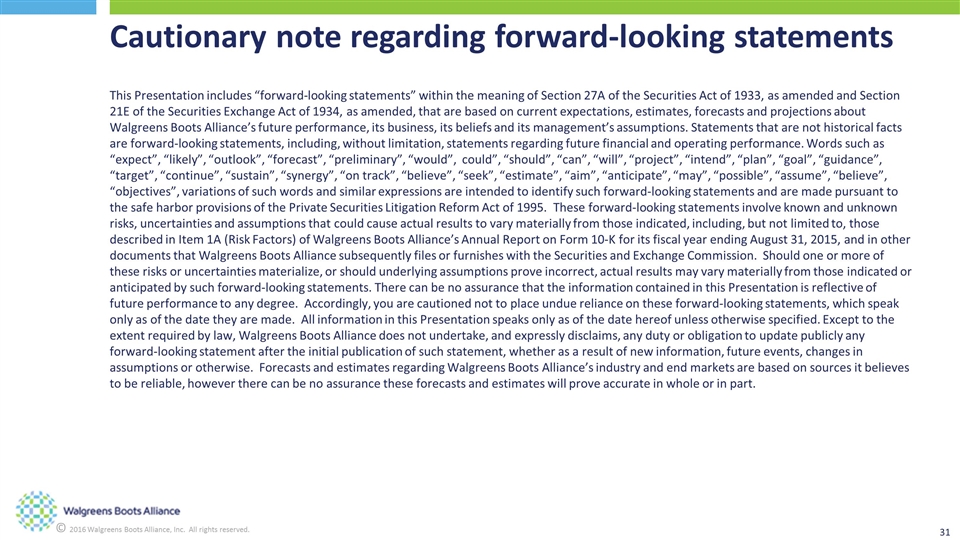
This Presentation includes “forward‐looking statements” within the meaning of Section 27A of the Securities Act of 1933, as amended and Section 21E of the Securities Exchange Act of 1934, as amended, that are based on current expectations, estimates, forecasts and projections about Walgreens Boots Alliance’s future performance, its business, its beliefs and its management’s assumptions. Statements that are not historical facts are forward-looking statements, including, without limitation, statements regarding future financial and operating performance. Words such as “expect”, “likely”, “outlook”, “forecast”, “preliminary”, “would”, could”, “should”, “can”, “will”, “project”, “intend”, “plan”, “goal”, “guidance”, “target”, “continue”, “sustain”, “synergy”, “on track”, “believe”, “seek”, “estimate”, “aim”, “anticipate”, “may”, “possible”, “assume”, “believe”, “objectives”, variations of such words and similar expressions are intended to identify such forward-looking statements and are made pursuant to the safe harbor provisions of the Private Securities Litigation Reform Act of 1995. These forward‐looking statements involve known and unknown risks, uncertainties and assumptions that could cause actual results to vary materially from those indicated, including, but not limited to, those described in Item 1A (Risk Factors) of Walgreens Boots Alliance’s Annual Report on Form 10-K for its fiscal year ending August 31, 2015, and in other documents that Walgreens Boots Alliance subsequently files or furnishes with the Securities and Exchange Commission. Should one or more of these risks or uncertainties materialize, or should underlying assumptions prove incorrect, actual results may vary materially from those indicated or anticipated by such forward-looking statements. There can be no assurance that the information contained in this Presentation is reflective of future performance to any degree. Accordingly, you are cautioned not to place undue reliance on these forward-looking statements, which speak only as of the date they are made. All information in this Presentation speaks only as of the date hereof unless otherwise specified. Except to the extent required by law, Walgreens Boots Alliance does not undertake, and expressly disclaims, any duty or obligation to update publicly any forward-looking statement after the initial publication of such statement, whether as a result of new information, future events, changes in assumptions or otherwise. Forecasts and estimates regarding Walgreens Boots Alliance’s industry and end markets are based on sources it believes to be reliable, however there can be no assurance these forecasts and estimates will prove accurate in whole or in part. Cautionary note regarding forward-looking statements
