Attached files
| file | filename |
|---|---|
| 8-K - 8-K - AMERICAN SCIENCE & ENGINEERING, INC. | a16-10916_18k.htm |
| EX-99.1 - EX-99.1 - AMERICAN SCIENCE & ENGINEERING, INC. | a16-10916_1ex99d1.htm |
Exhibit 99.2
May 9, 2016 American Science and Engineering, Inc. Q4 and Fiscal Year 2016 Earnings Call Presentation
Diane Basile Senior Vice President, CFO and Treasurer
Safe Harbor Statement ©2016 American Science and Engineering, Inc. The foregoing presentation contains statements concerning AS&E’s financial performance, markets and business operations that may be considered “forward-looking” under applicable securities laws. AS&E wishes to caution readers of this presentation that actual results might differ materially from those projected in any forward-looking statements. Factors which might cause actual results to differ materially from those projected in the forward-looking statements contained herein include the following: significant reductions, delays or cancellations (in full or in part) in procurements of the Company’s systems by the United States and other governments; disruption in the supply of any source component incorporated into AS&E's products; litigation seeking to restrict the use of intellectual property used by the Company; limitations under certain laws on the Company’s ability to protect its own intellectual property; potential product liability claims against the Company; global political trends and events which affect public perception of the threat presented by drugs, explosives and other contraband; global economic developments and the ability of governments and private organizations to fund purchases of the Company’s products to address such threats; the potential insufficiency of Company resources, including human resources, capital, plant and equipment and management systems, to accommodate any future growth; technical problems and other delays that could impact new product development and the Company’s ability to adapt to changes in technology and customer requirements; competitive pressures; lengthy sales cycles both in United States government procurement and procurement abroad; future delays in federal funding, the market price of the company's stock prevailing from time to time, the nature of other investment opportunities presented to the company from time to time, the company's cash flows from operations and market and general economic conditions. These and certain other factors which might cause actual results to differ materially from those projected are detailed from time to time in AS&E’s periodic reports and registration statements filed with the Securities and Exchange Commission, which important factors are incorporated herein by reference. AS&E undertakes no obligation to update forward looking statements to reflect changed assumptions, the occurrence of unanticipated events, or changes in future operating results, financial condition or business over time. Readers are further advised to review the “Risk Factors” set forth in the Company’s most recent Form 10-Q and Form 10-K, which further detail and supplement the factors described in this Safe Harbor Statement. Among other disclosures, the Risk Factors disclose risks pertaining to that portion of the Company’s business that is dependent on United States government contracting as well as international customers. 3
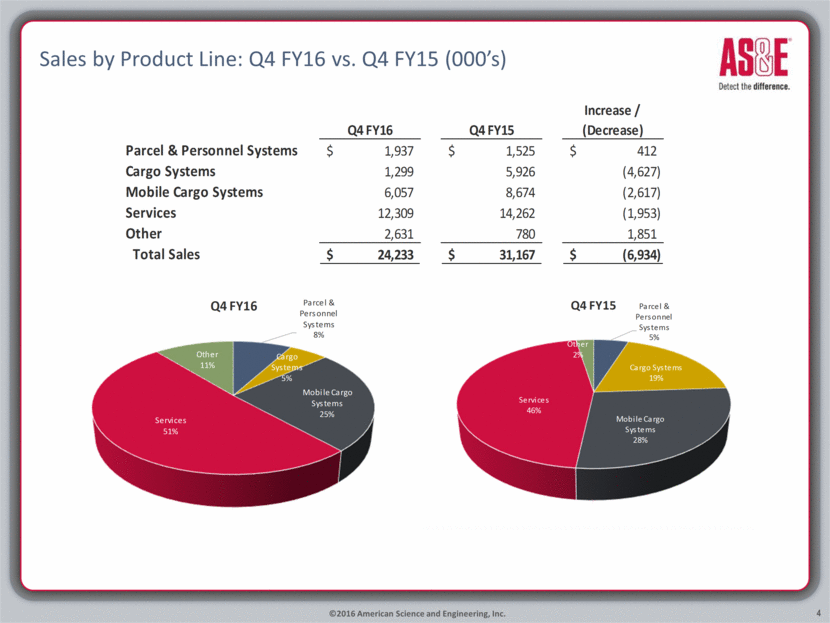
Sales by Product Line: Q4 FY16 vs. Q4 FY15 (000’s) 4 ©2016 American Science and Engineering, Inc. Increase / Q4 FY16 Q4 FY15 (Decrease) Parcel & Personnel Systems 1,937 $ 1,525 $ 412 $ Cargo Systems 1,299 5,926 (4,627) Mobile Cargo Systems 6,057 8,674 (2,617) Services 12,309 14,262 (1,953) Other 2,631 780 1,851 Total Sales 24,233 $ 31,167 $ (6,934) $ Parcel & Personnel Systems 8% Cargo Systems 5% Mobile Cargo Systems 25% Services 51% Other 11% Q4 FY16 Parcel & Personnel Systems 5% Cargo Systems 19% Mobile Cargo Systems 28% Services 46% Other 2% Q4 FY15
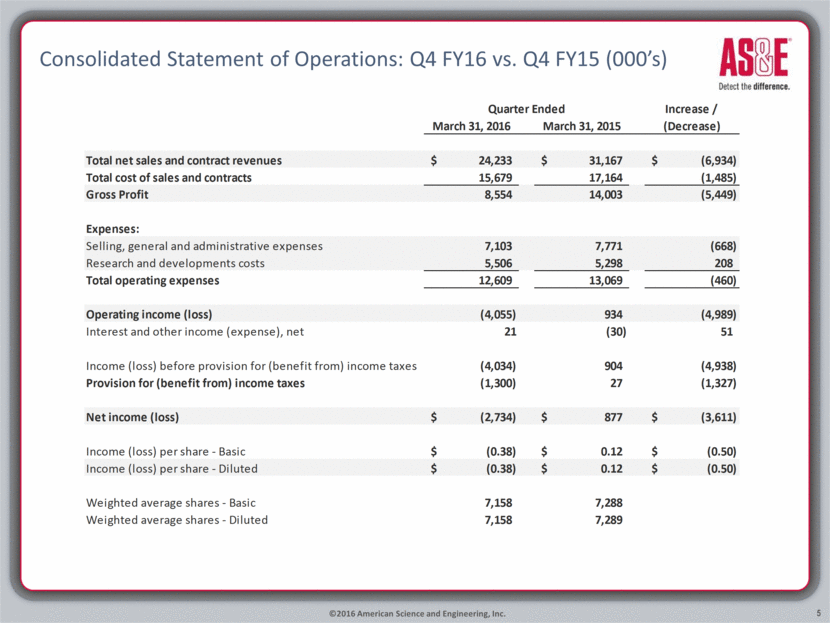
Consolidated Statement of Operations: Q4 FY16 vs. Q4 FY15 (000’s) 5 ©2016 American Science and Engineering, Inc. Increase / March 31, 2016 March 31, 2015 (Decrease) Total net sales and contract revenues 24,233 $ 31,167 $ (6,934) $ Total cost of sales and contracts 15,679 17,164 (1,485) Gross Profit 8,554 14,003 (5,449) Expenses: Selling, general and administrative expenses 7,103 7,771 (668) Research and developments costs 5,506 5,298 208 Total operating expenses 12,609 13,069 (460) Operating income (loss) (4,055) 934 (4,989) Interest and other income (expense), net 21 (30) 51 Income (loss) before provision for (benefit from) income taxes (4,034) 904 (4,938) Provision for (benefit from) income taxes (1,300) 27 (1,327) Net income (loss) (2,734) $ 877 $ (3,611) $ Income (loss) per share - Basic (0.38) $ 0.12 $ (0.50) $ Income (loss) per share - Diluted (0.38) $ 0.12 $ (0.50) $ Weighted average shares - Basic 7,158 7,288 Weighted average shares - Diluted 7,158 7,289 Quarter Ended
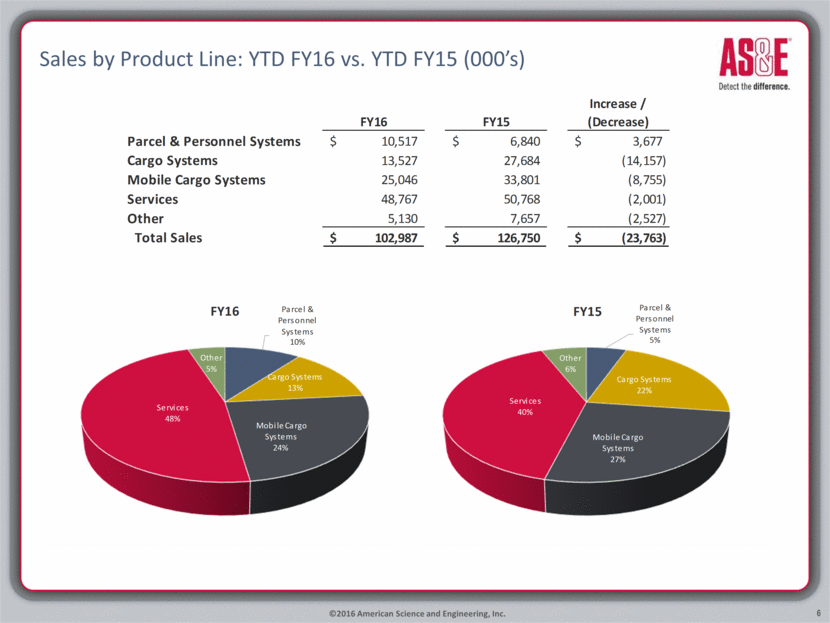
Sales by Product Line: YTD FY16 vs. YTD FY15 (000’s) 6 ©2016 American Science and Engineering, Inc. Increase / FY16 FY15 (Decrease) Parcel & Personnel Systems 10,517 $ 6,840 $ 3,677 $ Cargo Systems 13,527 27,684 (14,157) Mobile Cargo Systems 25,046 33,801 (8,755) Services 48,767 50,768 (2,001) Other 5,130 7,657 (2,527) Total Sales 102,987 $ 126,750 $ (23,763) $ Parcel & Personnel Systems 10% Cargo Systems 13% Mobile Cargo Systems 24% Services 48% Other 5% FY16 Parcel & Personnel Systems 5% Cargo Systems 22% Mobile Cargo Systems 27% Services 40% Other 6% FY15
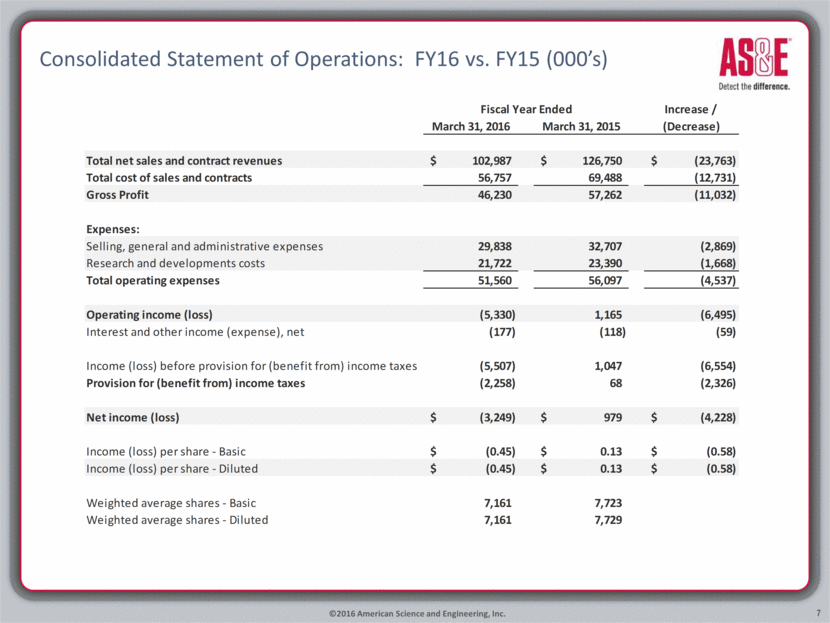
Consolidated Statement of Operations: FY16 vs. FY15 (000’s) 7 ©2016 American Science and Engineering, Inc. Increase / March 31, 2016 March 31, 2015 (Decrease) Total net sales and contract revenues 102,987 $ 126,750 $ (23,763) $ Total cost of sales and contracts 56,757 69,488 (12,731) Gross Profit 46,230 57,262 (11,032) Expenses: Selling, general and administrative expenses 29,838 32,707 (2,869) Research and developments costs 21,722 23,390 (1,668) Total operating expenses 51,560 56,097 (4,537) Operating income (loss) (5,330) 1,165 (6,495) Interest and other income (expense), net (177) (118) (59) Income (loss) before provision for (benefit from) income taxes (5,507) 1,047 (6,554) Provision for (benefit from) income taxes (2,258) 68 (2,326) Net income (loss) (3,249) $ 979 $ (4,228) $ Income (loss) per share - Basic (0.45) $ 0.13 $ (0.58) $ Income (loss) per share - Diluted (0.45) $ 0.13 $ (0.58) $ Weighted average shares - Basic 7,161 7,723 Weighted average shares - Diluted 7,161 7,729 Fiscal Year Ended
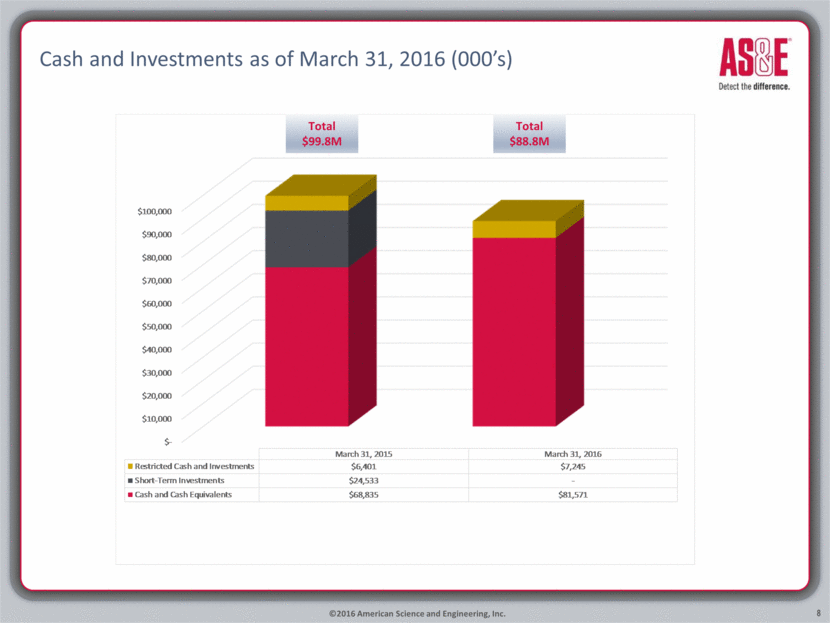
Cash and Investments as of March 31, 2016 (000’s) 8 ©2016 American Science and Engineering, Inc. Total $99.8M Total $88.8M $- $10,000 $20,000 $30,000 $40,000 $50,000 $60,000 $70,000 $80,000 $90,000 $100,000 March 31, 2015 March 31, 2016 Restricted Cash and Investments $6,401 $7,245 Short-Term Investments $24,533 - Cash and Cash Equivalents $68,835 $81,571
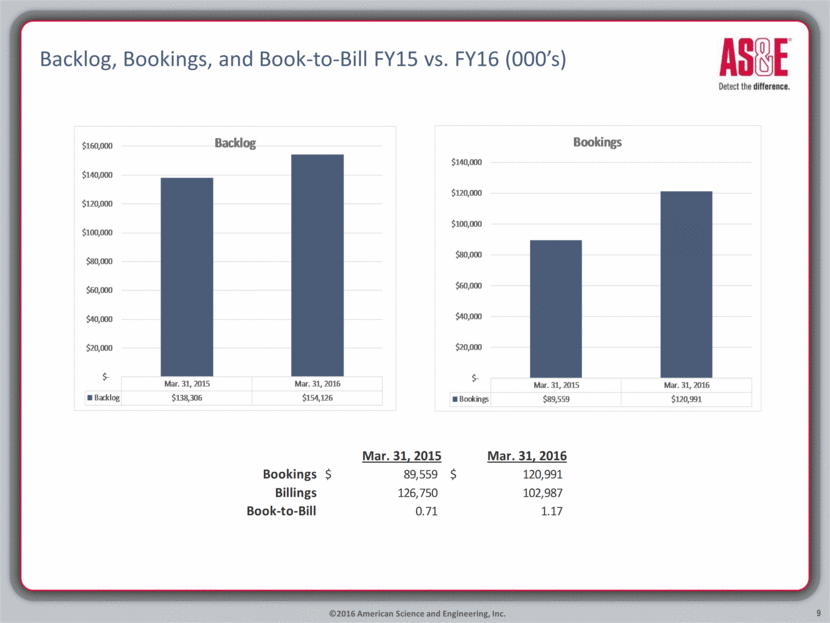
Backlog, Bookings, and Book-to-Bill FY15 vs. FY16 (000’s) 9 ©2016 American Science and Engineering, Inc. Mar. 31, 2015 Mar. 31, 2016 Bookings 89,559 $ 120,991 $ Billings 126,750 102,987 Book-to-Bill 0.71 1.17 Mar. 31, 2015 Mar. 31, 2016 Backlog $138,306 $154,126 $- $20,000 $40,000 $60,000 $80,000 $100,000 $120,000 $140,000 $160,000 Backlog Mar. 31, 2015 Mar. 31, 2016 Bookings $89,559 $120,991 $- $20,000 $40,000 $60,000 $80,000 $100,000 $120,000 $140,000 Bookings
Charles P. Dougherty, President and CEO
Global markets ©2016 American Science and Engineering, Inc. 11

Global markets ©2016 American Science and Engineering, Inc. 12

Global markets ©2016 American Science and Engineering, Inc. 13

Global markets ©2016 American Science and Engineering, Inc. 14

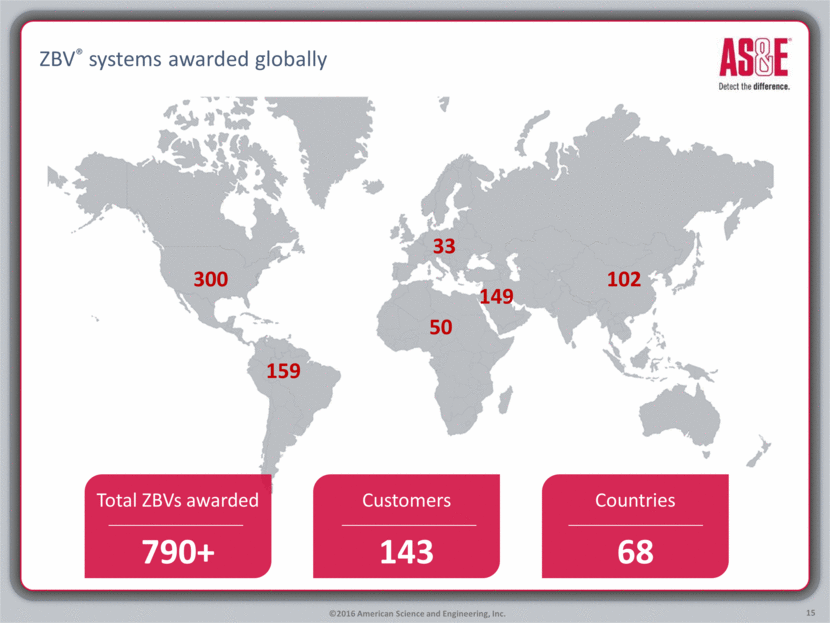
ZBV® systems awarded globally ©2016 American Science and Engineering, Inc. 300 159 50 33 149 102 Total ZBVs awarded 790+ Countries 68 Customers 143 15
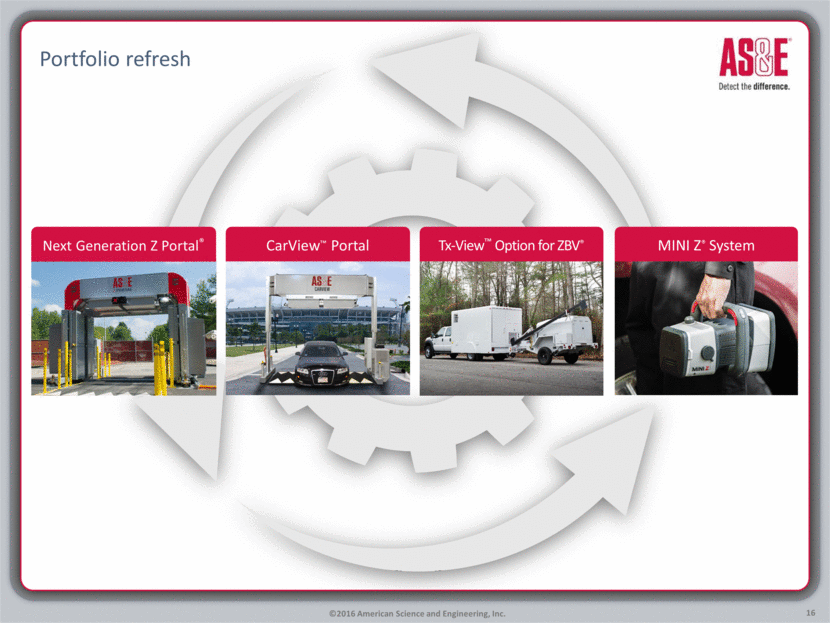
Portfolio refresh ©2016 American Science and Engineering, Inc. Tx-View™ Option for ZBV® MINI Z® System CarView™ Portal Next Generation Z Portal® 16
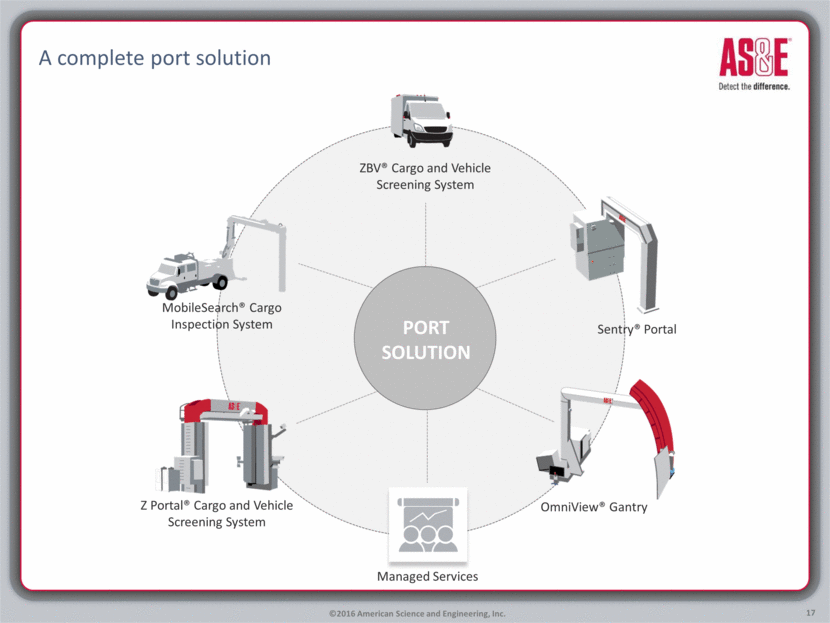
A complete port solution ©2016 American Science and Engineering, Inc. Managed Services OmniView® Gantry Sentry® Portal ZBV® Cargo and Vehicle Screening System MobileSearch® Cargo Inspection System Z Portal® Cargo and Vehicle Screening System PORT SOLUTION 17
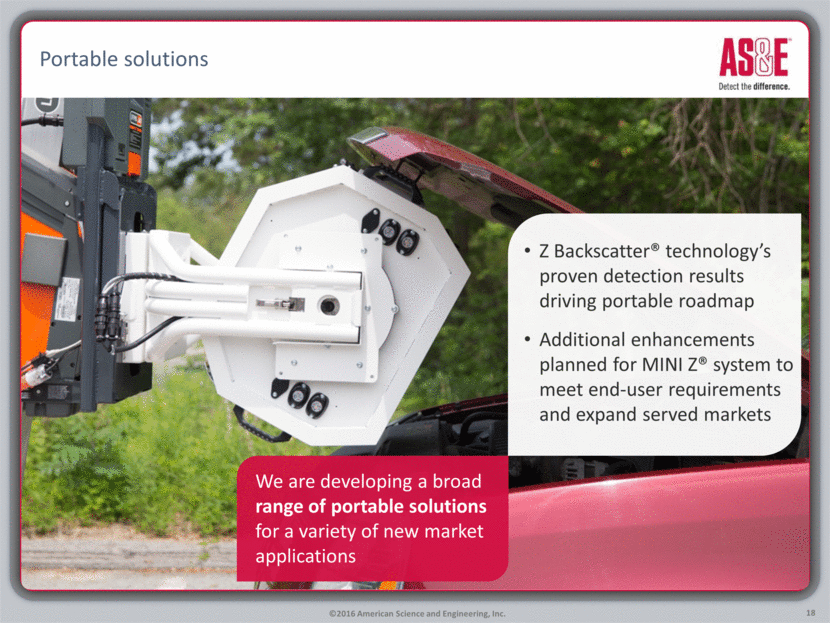
Portable solutions ©2016 American Science and Engineering, Inc. Z Backscatter® technology’s proven detection results driving portable roadmap Additional enhancements planned for MINI Z® system to meet end-user requirements and expand served markets We are developing a broad range of portable solutions for a variety of new market applications 18
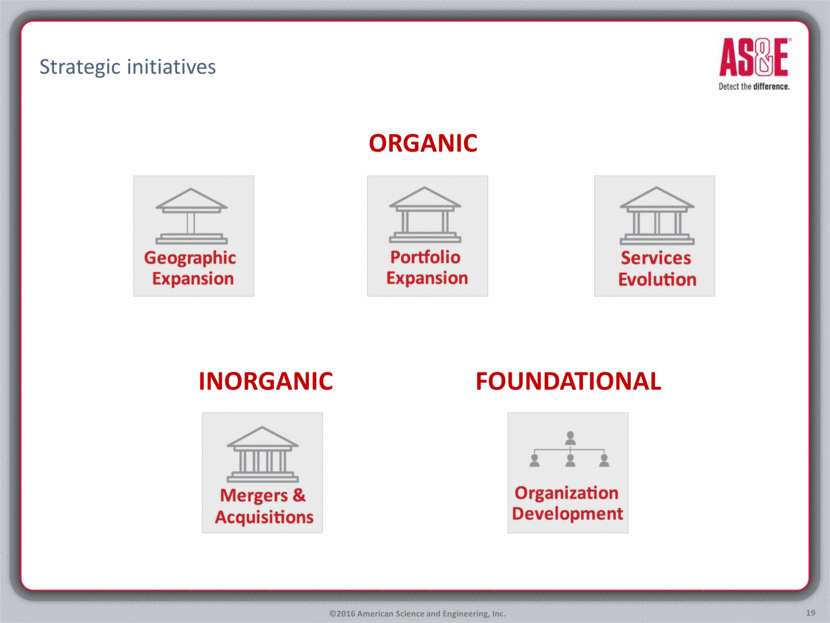
Strategic initiatives ©2016 American Science and Engineering, Inc. ORGANIC INORGANIC FOUNDATIONAL 19
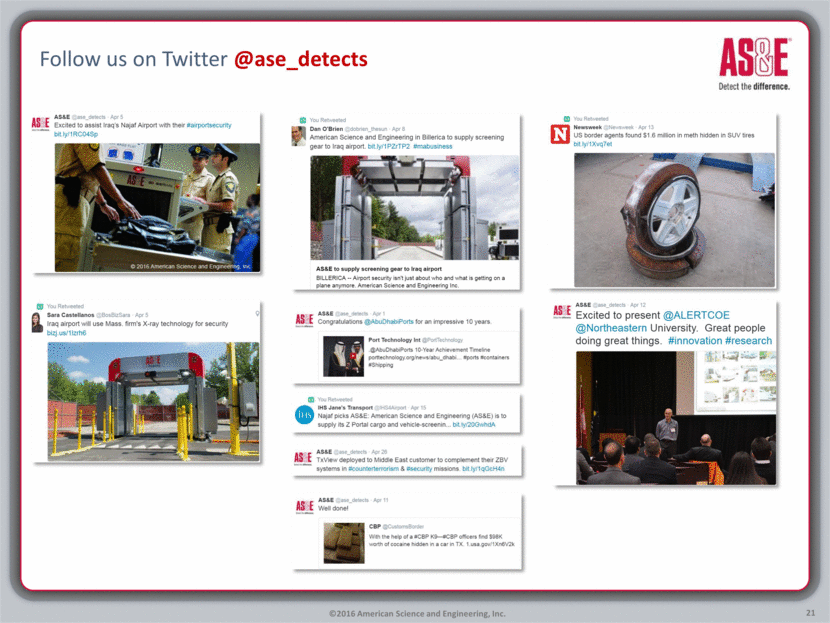
VALUES Q & A An audio replay and a copy of the presentation slides will be available on the AS&E website at ir.as-e.com. Learn more about AS&E products and technologies at www.as-e.com and follow us on Twitter @ase_detects ©2016 American Science and Engineering, Inc. 20
Follow us on Twitter @ase_detects ©2016 American Science and Engineering, Inc. 21