Exhibit 99.2
ALLENEX AB (PUBL)
INTERIM REPORT JANUARY - MARCH 2016
For the January-March
period
| |
• |
|
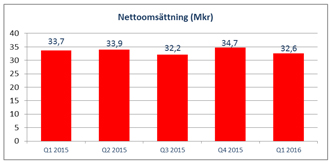
Net sales for the period totaled SEK 32.6 million (33.7). |
| |
• |
|
Operating profit (EBIT) for the period was SEK 1.7 million (5.8). |
| |
• |
|
Operating margin for the period was 5 percent (17). |
| |
• |
|
Earnings after tax for the period amounted to SEK 0.4 million (5.5). |
| |
• |
|
Earnings per share, basic and diluted for the period was SEK 0.00 (0.05). |
Significant events in the
first quarter and after the end of the reporting period
| |
• |
|
On February 9, 2016, CareDx, Inc. announced revised terms of its offer to the shareholders of Allenex AB. The Board of Directors’ recommendation to the shareholders of Allenex to accept the offer remained
unchanged. |
| |
• |
|
On April 8, 2016, CareDx, Inc. announced that the offer to the shareholders of Allenex AB had been accepted by shareholders representing a total of 118 207 862 shares, equivalent to around 98.3 percent of the
number of outstanding shares, and that the offer is unconditional. CareDx intends to initiate compulsory acquisition of the remaining shares in the company and in conjunction with this will push for the share to be delisted from NASDAQ Stockholm.
|
President and CEO Anders Karlsson’s commentary on the first quarter 2016:
“We continue to see an increase in sales in the USA, which was up more than 10 percent in the first quarter compared to last year. It is
gratifying that the investments in market development that we initiated two years ago continue to drive sales in the company’s single largest market. Although revenues and EBIT were down overall, it should be noted that the first quarter 2015
was unusually strong and that Easter this year was in the month of March. After the end of the reporting period, CareDx Inc. completed the acquisition of Allenex. The combined company will be able to offer a strong portfolio of diagnostic products
benefitting transplantation both before and after the transplant.”
For more information, please contact:
Anders Karlsson, CEO, tel:+46(0)70 918 00 10 or email: anders.karlsson@allenex.se
1 (11)
OPERATIONS
Allenex is a life science company that develops, manufactures, markets and sells products on the global market that facilitate safer transplantation of blood
stem cells and organs. Allenex is listed on NASDAQ OMX Stockholm, Small Cap, (ticker: ALNX). On April 14, 2016, Allenex became a subsidiary of CareDx Inc. There are 57 persons employed in Allenex including subsidiaries.
SALES
Net sales for the first quarter amounted to SEK
32.6 million (33.7), corresponding to a decrease of around three percent compared to the same period last year. The assessment is that this discrepancy is caused by variability between different quarters, both this year and last year.
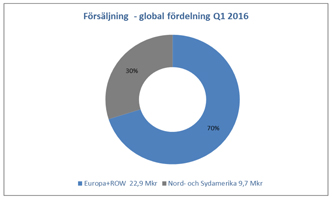
North American continues to increase in importance for Allenex, accounting for 30 percent of Allenex total sales for the
quarter, while the corresponding figure for the first quarter 2015 was 25.5 percent. Growth in this region is primarily driven by new customers in the SBT segment, however, sales of SSP products also contributed positively. Sales in North America in
the first quarter increased by 11 percent in local currency (USD) compared to the same period last year.
Sales in Europe decreased by seven percent in
local currency compared to the first quarter 2015, which was unusually strong. However, in Poland, Belgium and Turkey, for example, the first quarter 2016 was strong, particularly for traditional SSP products, while other countries, such as Italy
and Germany had a somewhat weaker start to the year. India and China, both developing markets, showed lower sales for the quarter than the same period last year.
The validation process tends to be relatively long, usually taking from 6 to 15 months. At the period end, 44 laboratories had converted, partially or fully,
to SBT Resolver™ (25 in North American and 19 in Europa/Asia), and a number of laboratories at the validation stage.
Allenex products are distributed via direct sales through a proprietary sales organization in key markets such as the USA,
Germany and in the Nordic region. They are also distributed via partnerships with local distributors in other markets. Registration processes are ongoing for the company’s products in a number of countries, with work underway to secure strong
local sales/distribution partners in these markets. This has intensified in that the competitors One Lambda and Life Technologies, which were acquired by Thermo Fisher Scientific in recent years, have now chosen to consolidate their operations to
one distributor in certain markets.
CUSTOMER GROUPS
Allenex customers largely constitute laboratories active in transplantation diagnostics. Today, there are three different technologies on the market for HLA
typing (SSP, SSO and SBT), where the most common typing method globally, in terms of volume, is SSO. However, most laboratories use SSP typing, either as a primary or supplementary method. The size of the laboratory and its level of automation
determines to what extent the respective methods are used. Today, the largest laboratories mainly utilize automated solutions (SBT and SSO) as their primary technology, while smaller laboratories generally prefer SSP typing. Subsequently, the choice
of typing technology is a key parameter for customer categorization.
In the USA, in particular, there are larger laboratories where SBT typing is used
for clinical typing. In total, around 70 of the 200 HLA laboratories use SBT technology clinically, and of these, 25 laboratories (around 36 percent) have so far chosen Allenex as SBT supplier. Of the 70 laboratories that use SBT technology, around
10 - 15 of them type over 1 500 tissue samples each per year, with a few typing even more than that. These are the laboratories that Allenex has initially chosen to target, as they hold high value as reference customers, which is important in
this segment. Among these large laboratories, Allenex currently has four customers. In Europe, the trend is that larger laboratories or consortiums of laboratories are becoming more active. This is the case in particular in Germany, where a few
really large laboratories are taking a more extensive hold of the typing market.
2 (11)
MARKET PERFORMANCE
Traditional SSP typing is still a key technology in the vast majority of HLA laboratories worldwide. Although the technology has been around for 25 years, it
still generates steady sales in most markets and in this market Allenex SSP products continue to win an increasingly larger share of the market. The technology is easily adapted to meet today’s needs and thanks to this flexibility Allenex
continues to regard it as an important part of the company’s product mix for the foreseeable future. Despite this, there are of course challenges to address, in particular from the more automated technologies such as SSO, SBT and real-time PCR.
Allenex strategy is to introduce SBT Resolver™ to the largest and most automated HLA laboratories in the U.S. and Europe, to then, in a second
phase, focus on converting mid-sized laboratories from competing products. A number of the largest laboratories have very high volumes as they conduct tests for national or regional typing registers. Major register typing laboratories conduct HLA
typing tests on more than 5 000 individuals per year and are very careful in their evaluation of new suppliers.
In recent years, two new advanced
technologies have been tested. These are Next Generation Sequencing (NGS), which primarily targets laboratories that conduct register typing, and real-time PCR (also called qPCR), which is mainly used for typing deceased donors prior to an organ
transplant. To date, these two technologies are used on a limited scale, however usage is expected to increase in the coming years. It is believed that NGS will primarily compete with SSO and SBT, while Real-Time PCR is expected to mainly compete
with SSP and SSO.
PRODUCT DEVELOPMENT
Allenex SSP products
are updated on an ongoing basis and the strategy is to offer as close to total solutions as possible. Product development is also done on a continuous basis, enabling the company to maintain its leading position in the SSP market. Allenex continues
to develop the current product line to secure high performance SSP typing. The company is also reviewing solutions tailored to laboratories looking for SSP technology with the option of increased automation that can be used as a complement to SSO
and SBT technologies. In 2012, Allenex introduced Olerup SSP® Add-ons, a complement to the automated technologies (SSO and SBT). In 2014, additional Olerup SSP® products were introduced with the aim of meeting customer demands for improved HLA typing with traditional SSP technology.
In 2014, active development began at Allenex on a completely new product group for HLA typing based on real-time PCR (q-PCR) methodology. The starting point
for the development work is SSP technology, which is at the core of the Allenex product range today. The new product QTYPE® will primarily focus on low-resolution typing in conjunction with
organ
transplantation and typing that either requires ease of administration and expedient results, or where high-resolution typing is not a requirement, such as in family donor screenings prior to
stem cell transplants. Allenex new product is based on hydrolysis probes, commonly referred to as TAQMAN® technology, and differs from the existing products on the market. This technology has
a number of significant advantages over melt curve technology. Among other benefits, there is greater opportunity to update the products as new alleles are identified. Furthermore, typing with
TaqMan® technology is significantly faster.
QTYPE® will initially compete with traditional SSP typing, a sector where Allenex has products today,
as well as with existing real-time solutions, but also with SSO. In SSP, the company expects to challenge other suppliers and win market share. Great opportunity to win market share is also seen in the SSO segment where One Lambda is dominant today.
When transplanting organs from deceased donors it is of key importance to be able to expediently carry out HLA typing to find an appropriate recipient. Real-time PCR is a more automated method that provides faster results with a lesser proportion of
manual work compared to SSP. Typing with QTYPE® will take around one hour compared to the up to three hours it takes to do traditional SSP typing. In this context, SSO typing is relatively
slow, taking 5 - 7 hours to conduct. Besides organ transplantation, the method has applications in other types of medical conditions.
QTYPE® was introduced at the end of April 2015 at the European HLA congress, EFI, in Geneva. At the end of September 2015, QTYPE® was also
presented to the American market at the corresponding American HLA congress, ASHI, in Savannah, Georgia. It is currently estimated that the new product will start generating sales in the early third quarter 2016.
The distribution agreement between Conexio Genomics and Allenex subsidiary Olerup SSP AB runs through April 2018. In addition to the distribution of SBT
Resolver™, the contract with Conexio Genomics includes two new products for Next Generation Sequencing (NGS), reagents and software. Also included is Gamma Type™, a product for typing of the Gamma block, an area that previously was not
possible to analyze using traditional methods. The introduction of Gamma Type™ began during the first six months of 2015 and the plan is to successively introduce the NGS portfolio over the next two years.
SIGNIFICANT EVENTS IN ALLENEX
Significant events in the first
quarter
| |
• |
|
On February 9, 2016, CareDx, Inc. announced revised terms of its offer to the shareholders of Allenex AB. The Board of Directors’ recommendation to the shareholders of Allenex to accept the offer remains
unchanged. |
3 (11)
Significant events after the period end
| |
• |
|
On April 8, 2016, CareDx, Inc. announced that the offer to the shareholders of Allenex AB had been accepted by shareholders representing a total of 118 207 862 shares, equivalent to around 98.3 percent of the
number of outstanding shares, and that the offer is unconditional. CareDx intends to initiate compulsory acquisition of the remaining shares in the company and in conjunction with this will push for the share to be delisted from NASDAQ Stockholm.
|
OPERATING RESULTS
Consolidated operating
profit for the first three months amounted to SEK 1.7 million (5.8). The Swedish krona strengthened against USD during the first quarter, while weakening against EUR mid-quarter. These effects offset each other and currency fluctuations during
the quarter have not had any substantial impact on net revenues. In the corresponding period in 2015, currency fluctuations had a positive effect on revenues resulting from a weaker Swedish krona.
Unrealized currency gains included in other expenses are substantially lower compared to the first quarter 2015, amounting to SEK 0 million (3.2). Realized
currency effects, resulting from the purchase of raw materials and consumables in USD and EUR, are also substantially lower compared to the first quarter 2015, and are included in other expenses at
SEK -0.2 million (0.9). Currency effects impacting net financial items is substantially lower compared to the first quarter 2015, amounting to SEK 0 million (2.1). Costs for other external services
are included in other expenses and have increased compared to the first quarter 2015, amounting to SEK 2.1 million (1.8), at the same time employee remuneration costs have decreased compared to the first quarter 2015, amounting to SEK
12.1 million (12.6).
FINANCIAL POSITION, CASH FLOW AND FINANCING
New product development expenses of SEK 2.3 million (3.0), were capitalized during the period, leaving a closing balance on March 31, 2016 of SEK
17.9 million (5.8). The capitalization concerns the development QTYPE® a new product for HLA typing based on real-time PCR (qPCR) methodology.
The operations of Allenex are financed by shareholders’ equity and loans. Interest-bearing liabilities amounted to SEK 107.6 million (110.9). The
consolidated equity/assets ratio was 57 percent (58). Consolidated equity was SEK 210.2 million (201.1), corresponding to SEK 1.75 per share (1.67). Equity increased by SEK 0.7 million in the first quarter 2016. Equity decreased by
SEK 20 million in the corresponding period in 2015, mainly due to the acquisition of the minority holdings in the group. Cash and cash equivalents amounted to SEK 3.1 million (6.1).
Cash flow from operating activities for the first quarter was SEK 3.1 (3.4). Investing activities includes
investments in capitalized assets of SEK 2.3 million. Financing activities included loan amortization of SEK 5.5 million and SEK 4 million in loans raised.
RISKS AND UNCERTAINTIES
Allenex has long been a
well-established business with well-known products in the field of genomic HLA typing based on SSP technology, with a significant market share. At the same time, the company faces market risk in the form of competition from other manufacturers, the
transition to more automated typing processes as well as new technologies, which may make it difficult for the company to maintain market share and margins.
Operational risk is primarily tied to the company’s ability to constantly update its product range and to produce continually updated HLA test kits in
pace with market demand.
Products sold and distributed on the basis of cooperation agreements with other companies increase the opportunity of
strengthening market position and profitability, while they also carry increased risk due to commitments in terms of resource investments and costs resulting from such agreements. In particular, the SBT products from the Australian company Conexio
Genomics are expected to achieve significant sales. At the same time, this involves significant competition and market risk. The ability to deliver the right quality on time has both a short- and long-term significance for the business. For example,
the inability of the partner to deliver due to production downtime could have a substantial negative effect on sales. Under the terms of the agreement with Conexio, Allenex has committed to a minimum purchase level.
In 2014 and 2015 significant development work was conducted on the new product QTYPE® based on
real-time PCR methodology. It is expected that the product will successively generate significant sales. There is a risk that this will take longer than previously planned and that the product will not achieve the success expected. This in turn may
have a negative impact on the value of intangible and other assets.
The transplantation test
XM-ONE® is predominantly established as a research product for larger medical centers. Work is underway to get the product established in broader clinical use. This has proven to take longer
than planned and there is a risk that the product may not attain the success anticipated. This in turn could have a negative on the value of the company’s intangible and other assets. To date,
XM-ONE® is virtually alone in its field and has significant patent protection. However, work is ongoing at the company’s competitors to establish similar testing methods. There is a risk,
therefore, that the company’s competitors may challenge the position that XM-ONE® has on the market.
4 (11)
Allenex has a significant exposure to exchange rate fluctuations due to the fact that most of the company’s
revenues are in EUR and USD, while costs are partly in SEK. This entails a currency risk for the company. Allenex does not conduct currency hedging activities.
Attracting and maintaining qualified personnel for development, production, marketing, sales, logistics and administration is essential to group performance.
The value of the company is partly dependent on its ability to maintain and protect patents, other intellectual property rights and specific expertise.
Patent protection for medical, medtech and biotech products can be uncertain and involve complex legal and technical issues. Patents must usually be sought and maintained in several jurisdictions, and issued patents may be challenged, invalidated
and circumvented. For Allenex, or its subsidiaries, this may mean the loss of or shortened patent protection, which in turn may mean that the company cannot prevent competitors from marketing similar products. The uncertainty associated with patents
and patent litigation and other patent processes, may have a negative impact on the competitiveness of Allenex and its subsidiaries, which in turn may have a negative effect on their business.
Both clinical trials and the marketing and sales of products pose a significant risk in terms of product liability. When deemed necessary, the company obtains
product liability insurance. No assurance can be given that insurance will cover future claims against Allenex or its subsidiaries.
In certain cases, the
company is dependent on approval through clinical trials or decisions from public authorities. There are no guarantees that the company will achieve satisfactory results in such trials, or that the required regulatory approval will be granted
The group’s customer relations are stable and long-term, with historically low credit losses. Credit evaluations are carried out on new customers. Credit
risk is currently assessed as low, but any change in a negative direction could impact the company’s results and financial position.
Part of the
financing was raised at variable interest rates, therefore rising interest rates could lead to lower returns for the company, which in turn could affect the company’s results and financial position.
Based on the current circumstances, Allenex is of the opinion that it has sufficient liquidity to conduct its operations according to current plans. There is
a risk that market conditions and sales will develop negatively, which may have a negative effect on liquidity. The group’s ability to refinance maturing loans may also be adversely impacted by group performance and overall conditions in the
financial markets.
The company’s cash and cash equivalents are placed in liquid assets with low credit risk.
No significant changes in risk assessment have been made compared to the annual report 2015, pages 27-28.
FINANCIAL INSTRUMENTS
Allenex financial instruments consist of trade account receivable, cash and cash equivalents, trade accounts payable, accrued supplier expenses and
interest-bearing liabilities. Liabilities to credit institutions have variable interest rates. Liabilities to shareholders and SSP Primers AB have fixed interest rates, which essentially correspond to current market rates. Other financial assets and
liabilities have short life spans. The fair value of all financial instruments is deemed to approximate the book value. Allenex has not netted any financial assets or liabilities and has not entered into any offset agreements.
TRANSACTIONS WITH RELATED PARTIES
Transactions with related
parties are shown in Note 10 of the Allenex 2015 Annual Report. No substantial changes occurred in the content or scope of these transactions for the period.
PARENT COMPANY
Revenues for the period amounted to SEK
0.7 million (0.7). Operating loss for the quarter was SEK 3.0 million (-3.2). The company’s long-term intragroup receivables amounted to SEK 161.7 million (88.1). Cash and cash equivalents totaled SEK 0.8 million (1.1). Cash
flow from operations was SEK 0.1 million (-3.2). At the period end, the parent company had 4 employees (4).
SHARE AND SHAREHOLDERS
|
|
|
|
|
|
|
|
|
| PRINCIPAL OWNERS, MARCH 31,
2016 |
|
NO. SHARES |
|
|
OWNERSHIP
STAKE % |
|
| Midroc Invest AB |
|
|
43 678 850 |
|
|
|
36.3 |
|
| Ålandsbanken ABP (Finland) |
|
|
38 945 781 |
|
|
|
32.4 |
|
| Xenella Holding AB *) |
|
|
11 174 755 |
|
|
|
9.3 |
|
| Handelsbanken Liv |
|
|
6 816 152 |
|
|
|
5.7 |
|
| Avanza Bank AB |
|
|
4 838 585 |
|
|
|
4.0 |
|
| Nordnet Pensionsförsäkring AB |
|
|
2 427 292 |
|
|
|
2.0 |
|
| Other |
|
|
12 407 033 |
|
|
|
10.3 |
|
|
|
|
|
|
|
|
|
|
| TOTAL |
|
|
120 288 448 |
|
|
|
100.0 |
|
|
|
|
|
|
|
|
|
|
| *) |
Xenella Holding AB is jointly owned by Midroc Invest AB and FastPartner AB (publ). |
ACCOUNTING PRINCIPLES
Allenex applies International Financial Reporting Standards (IFRS) as adopted by the EU and the Swedish Annual Accounts Act. This interim report was prepared
in accordance with IAS 34 and the Annual Accounts Act for the group and for the parent company. The accounting principles and methods of calculation applied for the group and the parent company are consistent with those used in the preparation of
the most recent Annual Report, with the exception of the impairment of intangible assets, which previously were written down in pace with sales. These are now amortized on a straight line basis over the remaining useful life.
|
|
|
|
|
ANNUAL GENERAL MEETING |
|
|
|
|
The Allenex General Meeting will take place on Thursday, May 19, 2016 at Allenex, Franzéngatan 5, Stockholm. |
|
|
|
|
Stockholm, May 6, 2016 |
|
|
| Anders Karlsson |
|
|
|
|
| Chief Executive Officer |
|
|
|
|
|
|
The information in this interim report is such that Allenex AB (publ) is required to disclose under the Securities Market Act and/or the Financial Instruments Trading Act. This report and earlier
financial reports are available on www.allenex.com |
|
|
|
|
This yearend report has not been subject to review by the auditors of Allenex. |
|
|
|
|
|
|
|
This information was released for publication on May 6, 2016 at 12.30 CET
|
6 (11)
Consolidated statement of comprehensive income summary
|
|
|
|
|
|
|
|
|
|
|
|
|
| |
|
2016 |
|
|
2015 |
|
|
2015 |
|
| In SEK thousand |
|
JAN-MARCH |
|
|
JAN-MARCH |
|
|
JAN-DEC |
|
| Net sales |
|
|
32 612 |
|
|
|
33 701 |
|
|
|
134 548 |
|
| Change in inventories |
|
|
-1 084 |
|
|
|
-1 390 |
|
|
|
4 092 |
|
| Capitalized work for own account |
|
|
700 |
|
|
|
490 |
|
|
|
2 354 |
|
| Other revenues |
|
|
656 |
|
|
|
1 095 |
|
|
|
3 481 |
|
|
|
|
|
|
|
|
|
|
|
|
|
|
|
|
|
32 885 |
|
|
|
33 896 |
|
|
|
144 475 |
|
| Raw materials and consumables |
|
|
-7 703 |
|
|
|
-7 759 |
|
|
|
-29 272 |
|
| Other expenses |
|
|
-10 342 |
|
|
|
-6 728 |
|
|
|
-38 323 |
|
| Cost of employee remuneration |
|
|
-12 050 |
|
|
|
-12 582 |
|
|
|
-48 582 |
|
|
|
|
|
| Depreciation/Amortization |
|
|
-1 109 |
|
|
|
-1 006 |
|
|
|
-4 130 |
|
|
|
|
|
|
|
|
|
|
|
|
|
|
| Operating results |
|
|
1 681 |
|
|
|
5 821 |
|
|
|
24 168 |
|
|
|
|
|
| Other financial expenses and income |
|
|
-1670 |
|
|
|
830 |
|
|
|
-5 421 |
|
|
|
|
|
|
|
|
|
|
|
|
|
|
| Results after financial items |
|
|
11 |
|
|
|
6 651 |
|
|
|
18 927 |
|
| Taxes |
|
|
407 |
|
|
|
-1 105 |
|
|
|
-3 795 |
|
|
|
|
|
|
|
|
|
|
|
|
|
|
| Net income for the period |
|
|
417 |
|
|
|
5 546 |
|
|
|
15 132 |
|
|
|
|
|
| Other comprehensive results for the period |
|
|
|
|
|
|
|
|
|
| Components that will not be reclassified to net results |
|
|
— |
|
|
|
— |
|
|
|
— |
|
|
|
|
|
| Components that will be reclassified to net results |
|
|
— |
|
|
|
— |
|
|
|
— |
|
|
|
|
|
| Translation differences for the period |
|
|
300 |
|
|
|
-6 003 |
|
|
|
-7 139 |
|
|
|
|
|
|
|
|
|
|
|
|
|
|
| Comprehensive results for the period |
|
|
717 |
|
|
|
-457 |
|
|
|
7 993 |
|
|
|
|
|
| Results for the period attributable to: |
|
|
|
|
|
|
|
|
|
|
|
|
|
|
|
|
|
|
|
|
|
|
|
|
|
| Owners of the parent company |
|
|
417 |
|
|
|
5 546 |
|
|
|
15 132 |
|
| Non-controlling interests |
|
|
0 |
|
|
|
0 |
|
|
|
— |
|
|
|
|
|
|
|
|
|
|
|
|
|
|
| Comprehensive results for the period attributable to: |
|
|
|
|
|
|
|
|
|
|
|
|
| Owners of the parent company |
|
|
717 |
|
|
|
-457 |
|
|
|
7 993 |
|
| Non-controlling interests |
|
|
0 |
|
|
|
0 |
|
|
|
— |
|
|
|
|
|
|
|
|
|
|
|
|
|
|
| Earnings per share, basic and diluted, SEK |
|
|
0.00 |
|
|
|
0.05 |
|
|
|
0.13 |
|
| Average number of outstanding shares, basic and diluted |
|
|
120 288 448 |
|
|
|
120 288 448 |
|
|
|
120 288 448 |
|
| Number of shares at the period end |
|
|
120 288 448 |
|
|
|
120 288 448 |
|
|
|
120 288 448 |
|
7 (11)
Consolidated statement of financial position
|
|
|
|
|
|
|
|
|
|
|
|
|
| |
|
2016 |
|
|
2015 |
|
|
2015 |
|
| In SEK thousand |
|
MARCH 31 |
|
|
MARCH 31 |
|
|
DEC 31 |
|
| Assets |
|
|
|
|
|
|
|
|
|
|
|
|
| Goodwill |
|
|
215 041 |
|
|
|
215 086 |
|
|
|
214 962 |
|
| Other intangible assets |
|
|
75 896 |
|
|
|
66 896 |
|
|
|
74 340 |
|
| Tangible assets |
|
|
3 656 |
|
|
|
3 141 |
|
|
|
3 481 |
|
| Deferred tax assets |
|
|
3 796 |
|
|
|
2 992 |
|
|
|
2 935 |
|
|
|
|
|
|
|
|
|
|
|
|
|
|
| Total non-current assets |
|
|
298 389 |
|
|
|
288 115 |
|
|
|
295 718 |
|
| Inventories |
|
|
44 376 |
|
|
|
35 810 |
|
|
|
41 269 |
|
| Current receivables |
|
|
20 038 |
|
|
|
17 909 |
|
|
|
18 593 |
|
| Cash and cash equivalents |
|
|
3 108 |
|
|
|
6 097 |
|
|
|
4 294 |
|
|
|
|
|
|
|
|
|
|
|
|
|
|
| Total current assets |
|
|
67 521 |
|
|
|
59 816 |
|
|
|
64 156 |
|
| Total assets |
|
|
365 910 |
|
|
|
347 931 |
|
|
|
359 874 |
|
|
|
|
|
| Equity and liabilities |
|
|
|
|
|
|
|
|
|
|
|
|
| Equity |
|
|
210 220 |
|
|
|
201 053 |
|
|
|
209 503 |
|
| Interest-bearing non-current liabilities |
|
|
97 500 |
|
|
|
95 937 |
|
|
|
87 870 |
|
| Deferred tax liabilities |
|
|
16 733 |
|
|
|
14 123 |
|
|
|
16 394 |
|
| Interest-bearing current liabilities |
|
|
10 173 |
|
|
|
14 961 |
|
|
|
21 113 |
|
| Non-interest bearing current liabilities |
|
|
31 283 |
|
|
|
21 857 |
|
|
|
24 994 |
|
|
|
|
|
|
|
|
|
|
|
|
|
|
| Total equity and liabilities |
|
|
365 910 |
|
|
|
347 931 |
|
|
|
359 874 |
|
|
|
|
|
| Consolidated statement of changes in equity |
|
|
|
|
|
|
|
|
|
|
|
|
|
|
|
|
| |
|
2016 |
|
|
2015 |
|
|
2015 |
|
| In SEK thousand |
|
MARCH 31 |
|
|
MARCH 31 |
|
|
DEC 31 |
|
| Opening balance |
|
|
209 503 |
|
|
|
220 480 |
|
|
|
220 480 |
|
| Dividends paid to non-controlling interests |
|
|
— |
|
|
|
— |
|
|
|
— |
|
| Acquisition of minority holdings in subsidiaries |
|
|
— |
|
|
|
-18 970 |
|
|
|
-18 970 |
|
| Comprehensive results for the period |
|
|
717 |
|
|
|
-457 |
|
|
|
7 993 |
|
|
|
|
|
|
|
|
|
|
|
|
|
|
| Closing balance |
|
|
210 220 |
|
|
|
201 053 |
|
|
|
209 503 |
|
| Of which attributable to: |
|
|
|
|
|
|
|
|
|
|
|
|
|
|
|
|
|
|
|
|
|
|
|
|
|
| Owners of the parent company |
|
|
210 220 |
|
|
|
201 053 |
|
|
|
209 503 |
|
| Non-controlling interests |
|
|
0 |
|
|
|
0 |
|
|
|
— |
|
|
|
|
|
|
|
|
|
|
|
|
|
|
|
|
|
|
| Consolidated statement of cash flows |
|
|
|
|
|
|
|
|
|
|
|
|
|
|
|
|
| |
|
2016 |
|
|
2015 |
|
|
2015 |
|
| In SEK thousand |
|
JAN-MARCH |
|
|
JAN-MARCH |
|
|
JAN-DEC |
|
| Operating income |
|
|
1681 |
|
|
|
5 821 |
|
|
|
24 168 |
|
| Adjustment for items not included in the cash flow |
|
|
1 134 |
|
|
|
-1 712 |
|
|
|
-503 |
|
| Financial items |
|
|
-686 |
|
|
|
-650 |
|
|
|
-3 181 |
|
| Taxes paid |
|
|
-168 |
|
|
|
-371 |
|
|
|
-1 565 |
|
|
|
|
|
|
|
|
|
|
|
|
|
|
| Cash flow from operations before changes in working capital |
|
|
1 960 |
|
|
|
3 088 |
|
|
|
18 919 |
|
|
|
|
|
| Increase (-)/Decrease(+) in inventories |
|
|
-3 189 |
|
|
|
1 390 |
|
|
|
-3 053 |
|
| Increase (-)/Decrease(+) in operating receivables |
|
|
-1 410 |
|
|
|
-669 |
|
|
|
-641 |
|
| Increase (-)/Decrease(+) in operating liabilities |
|
|
5 803 |
|
|
|
-400 |
|
|
|
-528 |
|
|
|
|
|
|
|
|
|
|
|
|
|
|
| Cash flow from operating activities |
|
|
3 164 |
|
|
|
3 409 |
|
|
|
14 697 |
|
|
|
|
|
| Cash flow from investing activities
1) |
|
|
-2 799 |
|
|
|
-9 077 |
|
|
|
-14 045 |
|
| Cash flow from financing activities
1) |
|
|
-1 533 |
|
|
|
4 500 |
|
|
|
-3 715 |
|
|
|
|
|
|
|
|
|
|
|
|
|
|
| Cash flow for the period |
|
|
-1 168 |
|
|
|
-1 168 |
|
|
|
-3 063 |
|
|
|
|
|
| Cash and cash equivalents at the start of the period |
|
|
4 294 |
|
|
|
7 323 |
|
|
|
7 323 |
|
| Exchange rate differences in cash and cash equivalents |
|
|
-18 |
|
|
|
-58 |
|
|
|
-34 |
|
|
|
|
|
|
|
|
|
|
|
|
|
|
| Cash and cash equivalents at the period end |
|
|
3 108 |
|
|
|
6 097 |
|
|
|
4 294 |
|
| 1) |
In 2016, investing activities includes investments in capitalized assets of SEK 2.3 million as well as the acquisition of tangible fixed assets of SEK 0.5 million. In 2016, financing activities includes a newly
raised shareholder loan of SEK 4 million and SEK 5.5 million in amortization payments. In 2015, investing activities included the acquisition of minority holdings for SEK 20 million less a debt to SSP Primers of SEK 14 million,
net SEK 6 million, and investments in capitalized assets of SEK 3.0million. In 2015, financing activities included a new bank loan of SEK 10 million, amortization of SEK 1.5 million as well as the repayment of a loan of SEK
4 million to SSP Primers. |
8 (11)
Parent company income statement
|
|
|
|
|
|
|
|
|
|
|
|
|
| |
|
2016 |
|
|
2015 |
|
|
2015 |
|
| In SEK thousand |
|
JAN-MARCH |
|
|
JAN-MARCH |
|
|
JAN-DEC |
|
| Revenues |
|
|
687 |
|
|
|
687 |
|
|
|
2 749 |
|
| Other external costs |
|
|
-1 943 |
|
|
|
-1 893 |
|
|
|
-8 186 |
|
| Personnel costs |
|
|
-1 728 |
|
|
|
-1 992 |
|
|
|
-8 281 |
|
| Depreciation/amortization |
|
|
-29 |
|
|
|
-27 |
|
|
|
-112 |
|
|
|
|
|
|
|
|
|
|
|
|
|
|
| Operating results |
|
|
-3 013 |
|
|
|
-3 225 |
|
|
|
-13 830 |
|
| Other financial expenses and income |
|
|
-591 |
|
|
|
-463 |
|
|
|
-2 135 |
|
|
|
|
|
|
|
|
|
|
|
|
|
|
| Results after financial items |
|
|
-3 604 |
|
|
|
-3 688 |
|
|
|
-15 965 |
|
| Appropriations |
|
|
|
|
|
|
|
|
|
|
|
|
| Group contributions received |
|
|
— |
|
|
|
— |
|
|
|
22 959 |
|
| Group contributions paid |
|
|
— |
|
|
|
— |
|
|
|
-2 762 |
|
|
|
|
|
|
|
|
|
|
|
|
|
|
| Results before tax |
|
|
-3 604 |
|
|
|
-3 688 |
|
|
|
4 232 |
|
| Taxes |
|
|
0 |
|
|
|
0 |
|
|
|
0 |
|
|
|
|
|
|
|
|
|
|
|
|
|
|
| Results for the year |
|
|
-3 604 |
|
|
|
-3 688 |
|
|
|
4 232 |
|
|
|
|
|
| Parent company statement of comprehensive income |
|
|
|
|
|
|
|
|
|
|
|
|
| Results for the period |
|
|
-3 604 |
|
|
|
-3 688 |
|
|
|
4 232 |
|
| Other comprehensive results for the period |
|
|
— |
|
|
|
— |
|
|
|
— |
|
|
|
|
|
|
|
|
|
|
|
|
|
|
| Comprehensive results for the period |
|
|
-3 604 |
|
|
|
-3 688 |
|
|
|
4 232 |
|
Parent company balance sheet
|
|
|
|
|
|
|
|
|
| |
|
2016 |
|
|
2015 |
|
| In SEK thousand |
|
MARCH 31 |
|
|
DEC 31 |
|
| Assets |
|
|
|
|
|
|
|
|
| Tangible assets |
|
|
84 |
|
|
|
84 |
|
| Participations in group companies |
|
|
77 378 |
|
|
|
77 378 |
|
| Non-current intra-group receivables |
|
|
161 650 |
|
|
|
159 656 |
|
| Deferred tax assets |
|
|
1 626 |
|
|
|
1 626 |
|
|
|
|
|
|
|
|
|
|
| Total non-current assets |
|
|
240 738 |
|
|
|
238 744 |
|
|
|
|
| Current receivables |
|
|
12 853 |
|
|
|
11 502 |
|
| Cash and bank |
|
|
808 |
|
|
|
2 144 |
|
|
|
|
|
|
|
|
|
|
| Total current assets |
|
|
13 661 |
|
|
|
13 646 |
|
|
|
|
| Total assets |
|
|
254 399 |
|
|
|
252 390 |
|
|
|
|
| Equity and liabilities |
|
|
|
|
|
|
|
|
| Equity |
|
|
165 770 |
|
|
|
169 375 |
|
| Non-current liabilities |
|
|
31 000 |
|
|
|
31 870 |
|
| Current liabilities |
|
|
57 630 |
|
|
|
51 145 |
|
|
|
|
|
|
|
|
|
|
| Total equity and liabilities |
|
|
254 399 |
|
|
|
252 390 |
|
|
|
|
| Changes in equity, parent company |
|
|
|
|
|
|
|
|
|
|
|
|
|
|
|
|
|
| Opening balance |
|
|
169 375 |
|
|
|
165 143 |
|
| Results for the period |
|
|
-3 604 |
|
|
|
4 232 |
|
|
|
|
|
|
|
|
|
|
| Closing balance |
|
|
165 771 |
|
|
|
169 375 |
|
9 (11)
Key figures, Group
|
|
|
|
|
|
|
|
|
| |
|
2016 |
|
|
2015 |
|
| |
|
JAN-MARCH |
|
|
JAN-MARCH |
|
| Net sales, SEK thousand |
|
|
32 612 |
|
|
|
33 701 |
|
| Operating income, SEK thousand |
|
|
1 681 |
|
|
|
5 821 |
|
| Earnings after tax, SEK thousand |
|
|
417 |
|
|
|
5 546 |
|
| Earnings per share, basic and diluted, SEK |
|
|
0.0 |
|
|
|
0.0 |
|
| Equity per share, SEK |
|
|
1.75 |
|
|
|
1.67 |
|
| Equity/assets ratio, % |
|
|
57 |
|
|
|
58 |
|
| Return on equity, % |
|
|
0 |
|
|
|
0 |
|
| Average number of employees |
|
|
57 |
|
|
|
55 |
|
| Number of shares outstanding at the period end |
|
|
120 288 448 |
|
|
|
120 288 448 |
|
| Average number of shares outstanding |
|
|
120 288 448 |
|
|
|
120 288 448 |
|
| Share price at the period-end, SEK |
|
|
2.5 |
|
|
|
2.1 |
|
| Market cap, SEK thousand |
|
|
300 721 |
|
|
|
252 606 |
|
Definitions:
|
|
|
|
|
| Earnings per share |
|
Earnings after tax attributable to the owners of the parent company divided by the average number of outstanding shares. |
|
|
| Equity per share |
|
Equity divided by the number of outstanding shares at the period end. |
|
|
| Equity/assets ratio |
|
Equity at the period-end in relation to total assets. |
|
|
| Return on equity |
|
Results attributable to parent company shareholders divided by equity attributable to the owners of the parent. |
|
|
| Operating margin |
|
Earnings before financial items divided by net sales |
For a more detailed glossary see annual report 2015 page 66
10 (11)
Allenex and subsidiaries
PRODUCTION AND R&D COMPANIES
SALES & DISTRIBUTION COMPANIES

Olerup SSP AB is world leading in the development of kits for genomic HLA typing, based on SSP technology.
The product is used prior to a transplantation to match the donor and recipient. The better the match the lower the risk of complications following transplantation. HLA typing is a standard procedure prior to hematopoietic stem cell transplantation
(bone marrow transplantation) and is also used in conjunction with organ transplants (kidney, lung, heart, etc.). In 2011, Olerup SSP entered into an exclusive global agreement (excl. Australia, New Zealand and Taiwan) with Conexio Genomics, Perth,
Australia. The agreement runs through April 2018, at least. Allenex ownership stake in Olerup SSP AB is 100 percent. For more information visit www.olerup-ssp.com
Olerup GmbH, based in Vienna, is responsible for sales, distribution and logistics in Europe and the rest of
the world excluding North, Central and South America as well as the Nordic region. Sales encompass Olerup SSP’s HLA typing products and AbSorber’s XM-ONE® transplantation test.
Furthermore, from mid-year 2011, the company also sells and distributes products from the Australian company Conexio Genomics. Sales are conducted by a proprietary sales team in Germany, Austria, Belgium, the Netherlands and Slovenia. Sales in other
markets are handled by distributors. The company is owned by Olerup International AB, a wholly-owned company of Allenex AB. For more information visit www.olerup.com

AbSorber develops products that facilitate successful transplantation. AbSorber’s transplantation test XM-ONE®, identifies antibodies that play a key role in rejection reactions. The company’s research portfolio also includes a patented AB0 column for transplantations between people of different
blood groups and an AB0 diagnostic test that measures the occurrence of blood group antibodies. Allenex ownership stake of AbSorber is 100 percent. For more information visit www.absorber.se

Olerup Inc., domiciled in West Chester, PA, USA, is responsible for the sales, distribution and logistics of Olerup SSP
and AbSorber products. Furthermore, since mid-2011, the company sells and distributes products from the Australian company Conexio Genomics. The company has its own sales organization in the US, while sales in Canada and Central and South America
are handled by distributors. Olerup Inc., is a wholly-owned company of AbSorber AB. For more information visit www.olerup.com
11 (11)