Attached files
| file | filename |
|---|---|
| 8-K - 8-K - PACIFIC MERCANTILE BANCORP | pmbcinvestorpresentationma.htm |
| EX-99.2 - EXHIBIT 99.2 - PACIFIC MERCANTILE BANCORP | pmbcinvestorpresentationpr.htm |

INVESTOR PRESENTAT ION M A Y 2 0 1 6 1
This presentation contains statements regarding our expectations, beliefs and views about our future financial performance and our business, trends and expectations regarding the markets in which we operate, and our future plans. Those statements constitute “forward-looking statements” within the meaning of Section 27A of the Securities Act of 1933, as amended, and Section 21E of the Securities Exchange Act of 1934, as amended, can be identified by the fact that they do not relate strictly to historical or current facts. Often, they include words such as “believe,” “expect,” “anticipate,” “intend,” “plan,” “estimate,” “project,” or words of similar meaning, or future or conditional verbs such as “will,” “would,” “should,” “could,” or “may”. Forward-looking statements are based on current information available to us and our assumptions about future events over which we do not have control. Moreover, our business and our markets are subject to a number of risks and uncertainties which could cause our actual financial performance in the future, and the future performance of our markets (which can affect both our financial performance and the market prices of our shares), to differ, possibly materially, from our expectations as set forth in the forward-looking statements contained in this presentation. In addition to the risk of incurring loan losses, which is an inherent risk of the banking business, these risks and uncertainties include, but are not limited to, the following: the risk that the economic recovery in the United States, which is still relatively fragile, will be adversely affected by domestic or international economic conditions, which could cause us to incur additional loan losses and adversely affect our results of operations in the future; the risk that our results of operations in the future will continue to be adversely affected by our exit from the wholesale residential mortgage lending business and the risk that our commercial banking business will not generate the additional revenues needed to fully offset the decline in our mortgage banking revenues within the next two to three years; the risk that our interest margins and, therefore, our net interest income will be adversely affected by changes in prevailing interest rates; the risk that we will not succeed in further reducing our remaining nonperforming assets, in which event we would face the prospect of further loan charge-offs and write-downs of other real estate owned and would continue to incur expenses associated with the management and disposition of those assets; the risk that we will not be able to manage our interest rate risks effectively, in which event our operating results could be harmed; the prospect that government regulation of banking and other financial services organizations will increase, causing our costs of doing business to increase and restricting our ability to take advantage of business and growth opportunities. Additional information regarding these and other risks and uncertainties to which our business is subject are contained in our Annual Report on Form 10-K for the year ended December 31, 2015 which is on file with the SEC as well as subsequent Quarterly Reports on Form 10-Q that we file with the SEC. Due to these and other risks and uncertainties to which our business is subject, you are cautioned not to place undue reliance on the forward-looking statements contained in this news release, which speak only as of its date, or to make predictions about our future financial performance based solely on our historical financial performance. We disclaim any obligation to update or revise any of the forward-looking statements as a result of new information, future events or otherwise, except as may be required by law. FORWARD LOOKING STATEMENTS 2

CORPORATE OVERVIEW _________________________________ PACIFIC MERCANTILE BANK IS A COMMUNITY-BASED COMMERCIAL BANK SERVING SOUTHERN CALIFORNIA Bank founded in 1999 $1.1 billion in total assets 9 offices in Southern California Focused on serving small- and middle-market businesses 33% owned by Carpenter Community BancFund CORPORATE HEADQUARTERS COSTA MESA, CALIFORNIA 3
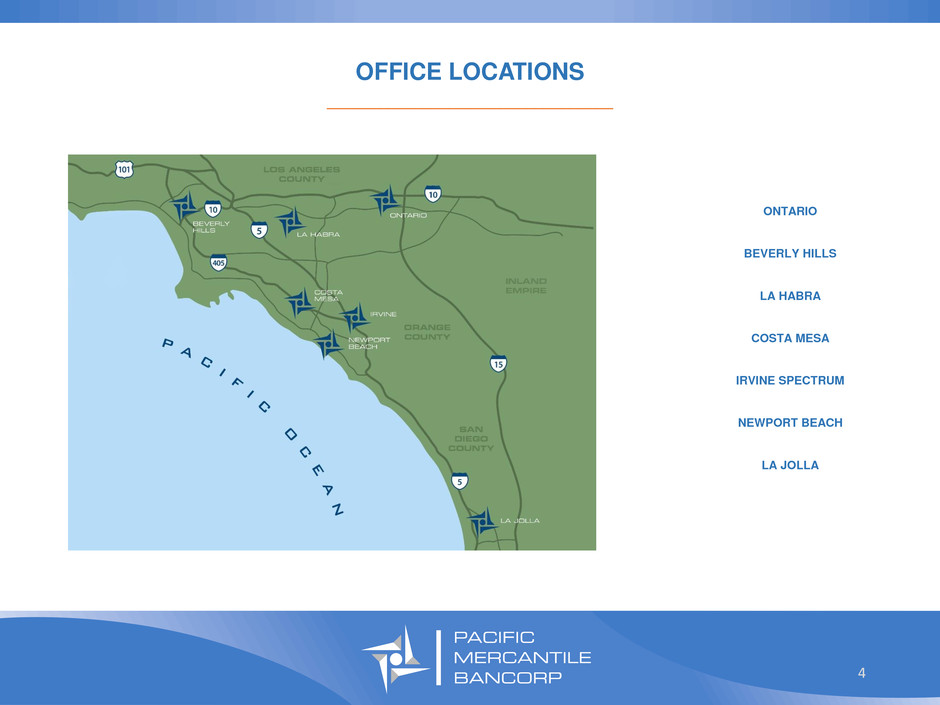
OFFICE LOCATIONS _________________________________ ONTARIO BEVERLY HILLS LA HABRA COSTA MESA IRVINE SPECTRUM NEWPORT BEACH LA JOLLA 4

INVESTOR HIGHLIGHTS _________________________________ Turnaround Bank in Attractive Growth Markets Comprehensive Client Engagement Outstanding Growth Market of Southern California Technology Entertainment Small/Medium Enterprises Improving Operational Leverage High insider ownership (approximately 40%) Opportunity to capitalize on late-stage turnaround transitioning to growth story Past Charge-offs Driving Significant Recovery Opportunities DTA Recovery in Q4 2015 Discounted Valuation Trading at 1.3x TBV 5

CORE MARKET OVERVIEW _________________________________ Southern California A LARGE ATTRACTIVE MARKET * Source: National Venture Capital Association ** Source: California Employment Development Department *** LA 5-County Area consists of Los Angeles, Orange, Riverside, San Bernardino and Ventura Counties **** Source: Los Angeles County Economic Development Corporation 5th largest market for VC investment in 2015 * Large addressable market for small- and middle-market banking 97,000 businesses with fewer than 500 employees** LA 5-County Area*** Expected to Add 158,000 Jobs in 2016 (2.1% employment growth)**** 6

Banker Position Past Financial Institutions Years of Banking Experience Tom Vertin President & CEO Silicon Valley Bank (CA Division Manager) 32 Curt Christianssen Chief Financial Officer Carpenter & Company Bank of Manhattan, Eldorado Bank 30 Bob Sjogren Chief Operating Officer Carpenter & Company Nixon Peabody, FDIC Sr. Examiner 27 Curtis Birkmann Chief Technology Officer Bank of Manhattan 7 Maxwell Sinclair Chief Compliance Officer Pacific Mercantile Bank California Bank & Trust 26 STRONG EXECUTIVE TEAM _________________________________ 7
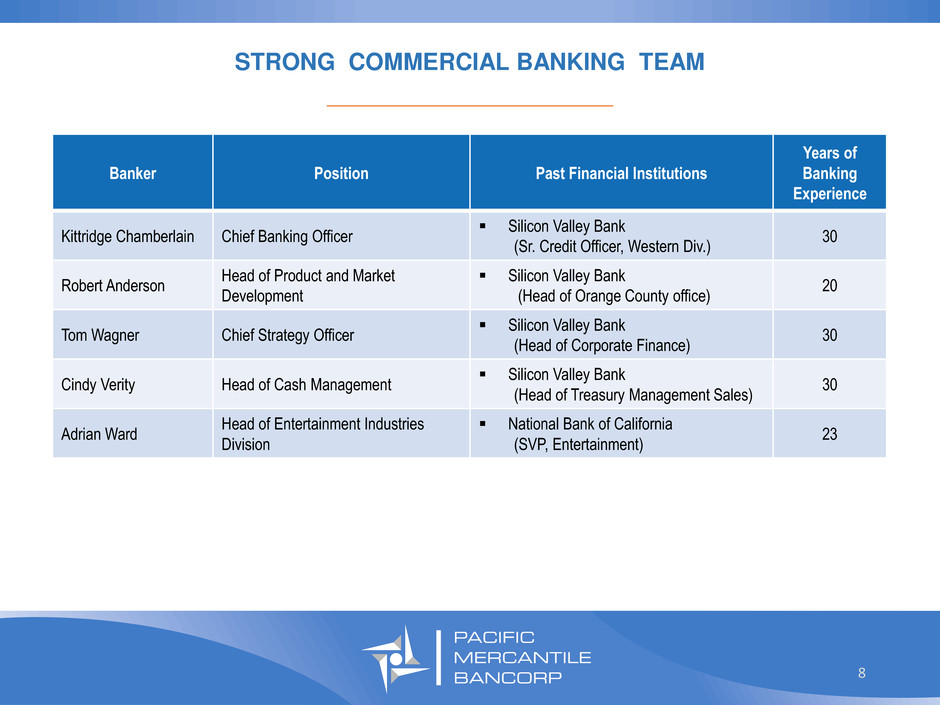
STRONG COMMERCIAL BANKING TEAM _________________________________ Banker Position Past Financial Institutions Years of Banking Experience Kittridge Chamberlain Chief Banking Officer Silicon Valley Bank (Sr. Credit Officer, Western Div.) 30 Robert Anderson Head of Product and Market Development Silicon Valley Bank (Head of Orange County office) 20 Tom Wagner Chief Strategy Officer Silicon Valley Bank (Head of Corporate Finance) 30 Cindy Verity Head of Cash Management Silicon Valley Bank (Head of Treasury Management Sales) 30 Adrian Ward Head of Entertainment Industries Division National Bank of California (SVP, Entertainment) 23 8
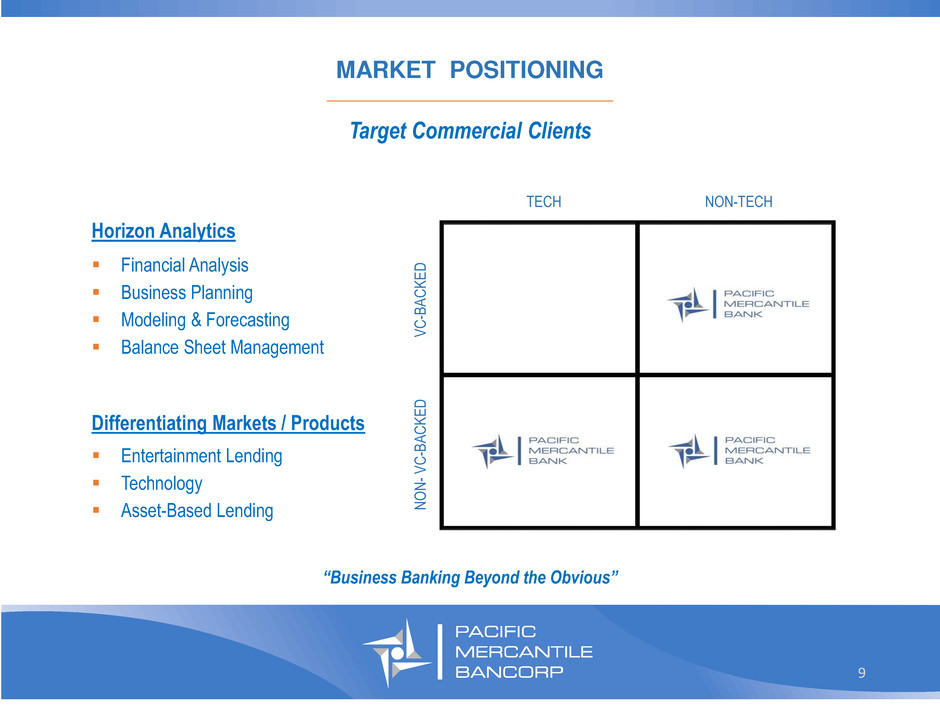
MARKET POSITIONING _________________________________ Differentiating Markets / Products Entertainment Lending Technology Asset-Based Lending Horizon Analytics Financial Analysis Business Planning Modeling & Forecasting Balance Sheet Management “Business Banking Beyond the Obvious” Target Commercial Clients TECH NON-TECH V C -B A CK E D NO N - V C -B A CK E D 9

Entertainment Banking _________________________________ 10 Project Financing for Independent Film and TV Production Favorable Characteristics Perceived risk is greater than actual risk Repayment of loan not dependent on box office success Limited competition provides opportunity for higher yields Production company sells distribution rights to movie or TV show before production starts PMBC underwrites loan based on expected cash flow from distribution rights Bonding company ensures production is completed Completion of production triggers payment for distribution rights Cash received from distribution rights used for repayment of loan Standard Transaction Overview Key Statistics Avg. yield (ex. fees) Prime + 1.25% Upfront fees 0.5%-1.0% Average exposure $1.3 million Average term 12-18 months Avg. NCOs <1 bp
BALANCE SHEET OVERVIEW: Loans, Deposits, Asset Quality, Capital 11

LOAN PORTFOLIO FOCUS ON RELATIONSHIP LENDING _________________________________ CRE: all other, 16.7% CRE: owner- occupied, 23.9% Commercial, 39.6% Residential: multi-family, 8.4% Single-family, 5.7% Other, 5.7% $ 840 Million as of March 31, 2016 12

Commercial Lines of Credit Total Commitments and Line Utilization Trends _________________________________ $301.7 $312.6 $323.2 $321.7 $347.3 $332.6 $123.4 $151.6 $140.3 $180.3 $152.6 $178.2 71.0% 67.3% 69.7% 64.1% 69.5% 65.1% 60.0% 62.0% 64.0% 66.0% 68.0% 70.0% 72.0% $250 $350 $450 $550 4Q14 1Q15 2Q15 3Q15 4Q15 1Q16 TOTAL C&I OUTSTANDING UNUSED C&I COMMITMENTS C&I LINE UTILIZATION RATE ($ in m ill io n s) Significant volatility in utilization rate impacting growth trend in C&I outstandings 13

STRONG GROWTH IN RELATIONSHIP LOANS _________________________________ $169 $174 $170 $191 $197 $213 $212 $203 $198 $196 $201 $188 $226 $229 $253 $265 $302 $313 $323 $322 $347 $333 47.8% 51.6% 51.3% 55.1% 56.3% 61.4% 62.4% 63.2% 62.7% 63.0% 63.5% 45% 47% 49% 51% 53% 55% 57% 59% 61% 63% 65% $100 $150 $200 $250 $300 $350 $400 $450 $500 $550 $600 3Q13 4Q13 1Q14 2Q14 3Q14 4Q14 1Q15 2Q15 3Q15 4Q15 1Q16 CRE OWNER-OCCUPIED C&I RELATIONSHIP LOANS AS A PERCENTAGE OF TOTAL LOANS 14 ($ in m ill io n s)
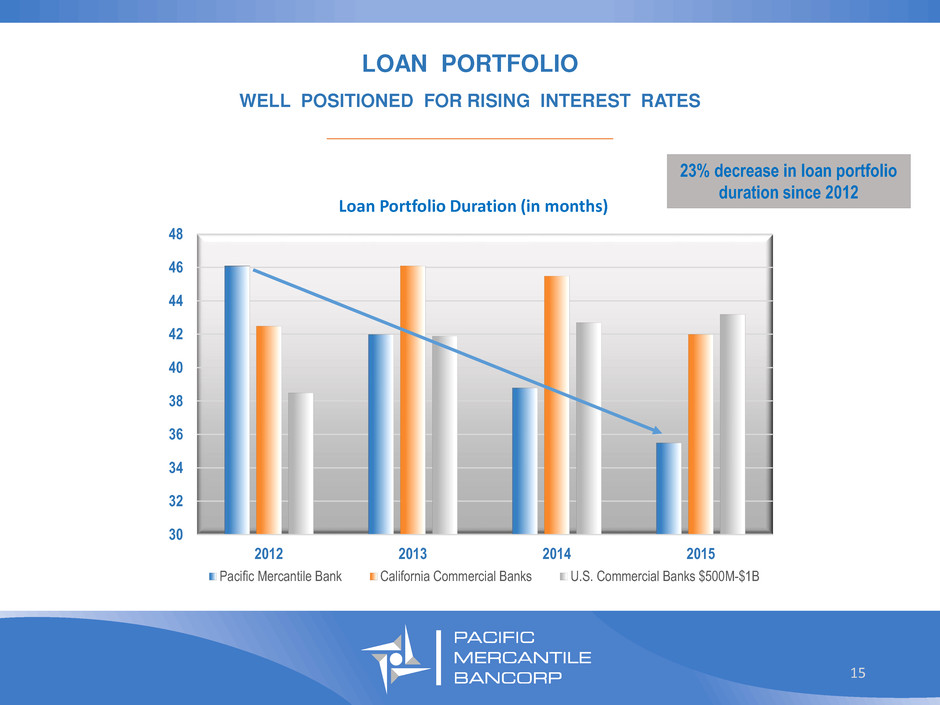
LOAN PORTFOLIO WELL POSITIONED FOR RISING INTEREST RATES _________________________________ 30 32 34 36 38 40 42 44 46 48 2012 2013 2014 2015 Loan Portfolio Duration (in months) Pacific Mercantile Bank California Commercial Banks U.S. Commercial Banks $500M-$1B 23% decrease in loan portfolio duration since 2012 15

DEPOSIT COMPOSITION FOCUSED ON CORE DEPOSITS _________________________________ $934 Million as of March 31, 2016 Continuing to attract non-interest bearing deposits Shifted balances out of CDs into savings and money market accounts Savings and money market balances tend to be stickier and less price sensitive than CDs Non-interest bearing 29% Interest checking 6% Savings/Money Market 38% Certificates of Deposit 27% Core Deposits as a Percentage of Total Deposits 16 61% 65% 64% 68% 69% 73% 60% 62% 64% 66% 68% 70% 72% 74% 4Q15 1Q15 2Q15 3Q15 4Q15 1Q16

ASSET QUALITY TRENDS _________________________________ 73% OF NPAS RELATE TO TWO CREDITS 0.58% 0.52% 0.61% 1.15% 0.89% 1.36% 1.36% 1.17% 1.04% 2.10% 0.35% 0.38% 0.35% 0.23% 0.16% 0.00% 0.50% 1.00% 1.50% 2.00% 2.50% 3.00% 3.50% 1Q15 2Q15 3Q15 4Q15 1Q16 NPAS/TOTAL ASSETS Other Two Credits PMAR 0.14% 0.04% 0.01% -0.05% 0.01% -0.10% 0.00% 0.10% 0.20% 0.30% 0.40% 0.50% 1Q15 2Q15 3Q15 4Q15 1Q16 NCOS/GROSS LOANS 17

STRONG CAPITAL POSITION _________________________________ 0.0% 2.0% 4.0% 6.0% 8.0% 10.0% 12.0% 14.0% 16.0% 18.0% TOTAL CAPITAL RATIO TIER 1 CAPITAL RATIO COMMON EQUITY TIER 1 CAPITAL RATIO 16.7% 15.5% 14.0% 10.0% 8.0% 6.5% PMBC WELL-CAPITALIZED REQUIREMENT 18 As of March 31, 2016

OUTLOOK 19

SIGNIFICANT CHANGES IN THE CALIFORNIA LANDSCAPE _________________________________ RBC acquisition of City National Bank Pacific Premier Bancorp acquisitions of Independence Bank and Security Bank of California Western Alliance acquisition of Bridge Bank PacWest Bancorp acquisition of Square 1 Bank California United Bank merger with 1st Enterprise Bank Disruption creating opportunities to add customers and productive banking teams 20

Strategic Changes to Operating Model _________________________________ Transitioning from full branches to smaller banking offices in certain markets Cash management products and commercial client base reduce need for full-service branches Cost savings from transition will be redeployed into more production staff Planned addition of relationship managers during 2016 21

2016 OUTLOOK _________________________________ Targeting double-digit loan growth Continued focus on growing commercial banking relationships Expanded production staff will enable deeper penetration of core markets Expectation for improving net interest margin Cost of funds declining Loan-to-deposit ratio increasing Higher non-interest income New commercial customers using more treasury management products Relatively stable expense levels Continuing expense discipline Increase in production staff cost offset by office transition Meaningful recovery opportunities should keep provision requirements modest for 2016 Steady increase in profitability 22

I n v e s t o r R e l a t i o n s : C u r t C h r i s t i a n s s e n ( 7 1 4 ) 4 3 8 - 2 5 3 1 C u r t . c h r i s t i a n s s e n @ p m b a n k . c o m 23
APPENDIX 1Q16 Financial Statements 24

1Q16 Consolidated Statements of Income (Dollars and numbers of shares in thousands, except per share data) (Unaudited) _______________________________ 25 Three Months Ended March 31, 2016 December 31, 2015 March 31, 2015 Mar '16 vs Dec '15 % Change Mar '16 vs Mar '15 % Change Total interest income $ 9,954 $ 9,858 $ 9,471 1.0 % 5.1 % Total interest expense 1,251 1,280 1,322 (2.3 )% (5.4 )% Net interest income 8,703 8,578 8,149 1.5 % 6.8 % Provision for loan and lease losses 420 — — 100.0 % 100.0 % Net interest income after provision for loan losses 8,283 8,578 8,149 (3.4 )% 1.6 % Non-interest income: Service fees on deposits and other banking services 255 242 212 5.4 % 20.3 % Net gain on sale of small business administration loans 40 — — 100.0 % 100.0 % Other non-interest income 459 384 670 19.5 % (31.5 )% Total non-interest income 754 626 882 20.4 % (14.5 )% Non-interest expense: Salaries & employee benefits 5,687 5,343 5,908 6.4 % (3.7 )% Occupancy and equipment 1,168 1,149 1,053 1.7 % 10.9 % Professional Fees 550 604 628 (8.9 )% (12.4 )% OREO expenses (70 ) 137 102 (151.1 )% (168.6 )% FDIC Expense 195 230 352 (15.2 )% (44.6 )% Other non-interest expense 1,025 1,226 1,073 (16.4 )% (4.5 )% Total non-interest expense 8,555 8,689 9,116 (1.5 )% (6.2 )% Income (loss) from continuing operations before income taxes 482 515 (85 ) (6.4 )% (667.1 )% Income tax (benefit) expense 198 (11,551 ) — (101.7 )% 100.0 % Net income (loss) 284 12,066 (85 ) (97.6 )% (434.1 )% Accumulated undeclared dividends on preferred stock — — (309 ) — % (100.0 )% Net income (loss) allocable to common shareholders $ 284 $ 12,066 $ (394 ) (97.6 )% (172.1 )% Basic income (loss) per common share: Net income (loss) available to common shareholders $ 0.01 $ 0.53 $ (0.02 ) (98.1 )% (150.0 )% Diluted income (loss) per common share: Net income (loss) available to common shareholders $ 0.01 $ 0.53 $ (0.02 ) (98.1 )% (150.0 )% Weighted average number of common shares outstanding: Basic 22,873 22,824 19,617 0.2 % 16.6 % Diluted 23,006 22,973 19,617 0.1 % 17.3 % Ratios from continuing operations(1): Return on average assets 0.11 % 4.44 % (0.03 )% Return on average equity 0.83 % 39.04 % (0.29 )% Efficiency ratio 90.46 % 94.40 % 100.94 %
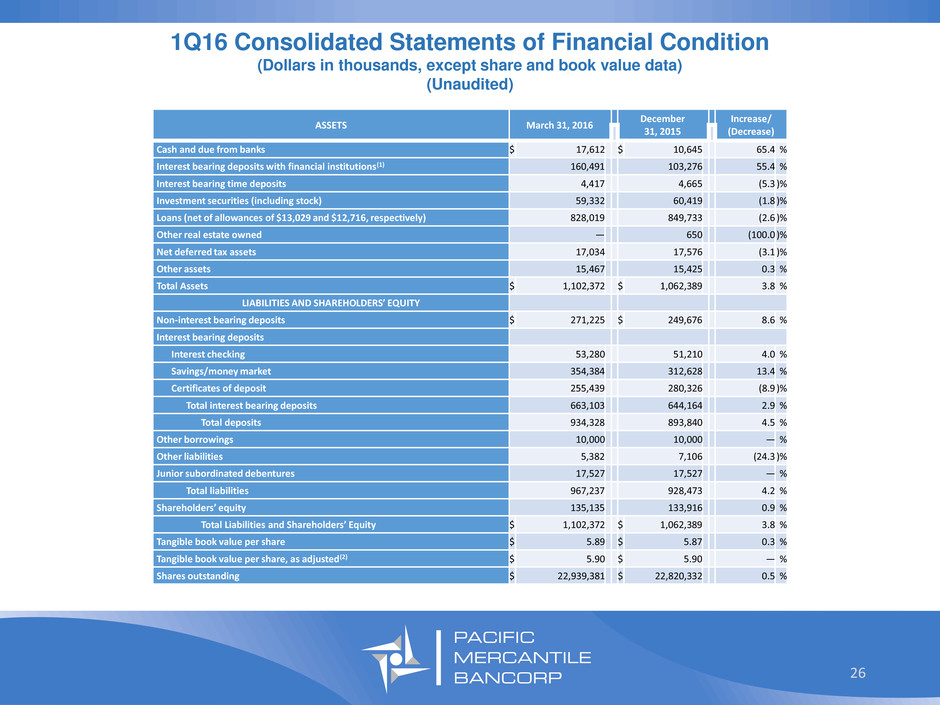
1Q16 Consolidated Statements of Financial Condition (Dollars in thousands, except share and book value data) (Unaudited) _______________________________ 26 ASSETS March 31, 2016 December 31, 2015 Increase/ (Decrease) Cash and due from banks $ 17,612 $ 10,645 65.4 % Interest bearing deposits with financial institutions(1) 160,491 103,276 55.4 % Interest bearing time deposits 4,417 4,665 (5.3 )% Investment securities (including stock) 59,332 60,419 (1.8 )% Loans (net of allowances of $13,029 and $12,716, respectively) 828,019 849,733 (2.6 )% Other real estate owned — 650 (100.0 )% Net deferred tax assets 17,034 17,576 (3.1 )% Other assets 15,467 15,425 0.3 % Total Assets $ 1,102,372 $ 1,062,389 3.8 % LIABILITIES AND SHAREHOLDERS’ EQUITY Non-interest bearing deposits $ 271,225 $ 249,676 8.6 % Interest bearing deposits Interest checking 53,280 51,210 4.0 % Savings/money market 354,384 312,628 13.4 % Certificates of deposit 255,439 280,326 (8.9 )% Total interest bearing deposits 663,103 644,164 2.9 % Total deposits 934,328 893,840 4.5 % Other borrowings 10,000 10,000 — % Other liabilities 5,382 7,106 (24.3 )% Junior subordinated debentures 17,527 17,527 — % Total liabilities 967,237 928,473 4.2 % Shareholders’ equity 135,135 133,916 0.9 % Total Liabilities and Shareholders’ Equity $ 1,102,372 $ 1,062,389 3.8 % Tangible book value per share $ 5.89 $ 5.87 0.3 % Tangible book value per share, as adjusted(2) $ 5.90 $ 5.90 — % Shares outstanding $ 22,939,381 $ 22,820,332 0.5 %
