Attached files
| file | filename |
|---|---|
| EX-99.1 - EXHIBIT 99.1 - GAIN Capital Holdings, Inc. | ex99103-31x16earningsrelea.htm |
| 8-K - 8-K - GAIN Capital Holdings, Inc. | form8-kq12016earnings.htm |
Financial and Operating Results First Quarter 2016 May 2016

GAIN Capital 2 Safe Harbor Statement Forward Looking Statements In addition to historical information, this earnings presentation contains "forward-looking" statements that reflect management's expectations for the future. A variety of important factors could cause results to differ materially from such statements.. These factors are noted throughout GAIN Capital's annual report on Form 10-K/A for the year ended December 31, 2015, as filed with the Securities and Exchange Commission on May 2, 2016, and include, but are not limited to, the actions of both current and potential new competitors, fluctuations in market trading volumes, financial market volatility, evolving industry regulations, errors or malfunctions in GAIN Capital’s systems or technology, rapid changes in technology, effects of inflation, customer trading patterns, the success of our products and service offerings, our ability to continue to innovate and meet the demands of our customers for new or enhanced products, our ability to successfully integrate assets and companies we have acquired, our ability to effectively compete, changes in tax policy or accounting rules, fluctuations in foreign exchange rates and commodity prices, adverse changes or volatility in interest rates, as well as general economic, business, credit and financial market conditions, internationally or nationally, and our ability to continue paying a quarterly dividend in light of future financial performance and financing needs. The forward-looking statements included herein represent GAIN Capital’s views as of the date of this release. GAIN Capital undertakes no obligation to revise or update publicly any forward-looking statement for any reason unless required by law. Non-GAAP Financial Measures This presentation contains various non-GAAP financial measures, including adjusted EBITDA, adjusted net income, adjusted EPS and various “pro forma” non-GAAP measures. These non-GAAP financial measures have certain limitations, including that they do not have a standardized meaning and, therefore, our definitions may be different from similar non-GAAP financial measures used by other companies and/or analysts. Thus, it may be more difficult to compare our financial performance to that of other companies. We believe our reporting of these non-GAAP financial measures assists investors in evaluating our historical and expected operating performance. However, because these are not measures of financial performance calculated in accordance with GAAP, such measures should be considered in addition to, but not as a substitute for, other measures of our financial performance reported in accordance with GAAP, such as net income.

GAIN Capital 3 First Quarter Overview • Q1 and TTM 2016 results demonstrate strength and operating leverage of GAIN’s business • Retail segment delivering with improved quality of customer trading volume • Margin improvement reflects successful execution of synergy plan and partner optimization efforts • Return of capital to shareholders continued with increased rate of share buybacks and repurchase of convertible notes

GAIN Capital 4 First Quarter 2016 Financial and Operating Results • Financial Results • Net revenue: $115.6 million • Adjusted EBITDA(1): $31.7 million • Net income: $8.4 million • Adjusted net income(2): $16.9 million • Earnings per share: $0.17 • Adjusted earnings per share(3): $0.35 • Free cash flow per share(4): $0.58 • Operating Metrics(5) • Average daily OTC trading volume: $13.5 billion • Average daily futures contracts: 38,275 • Customer assets: $876.0 million • ECN average daily volume: $8.3 billion (1) Adjusted EBITDA is a non-GAAP financial measure that represents our earnings before interest, taxes, depreciation, amortization and other one-time items. A reconciliation of net income to adjusted EBITDA is available in the appendix to this presentation. (2) Adjusted net income is a non-GAAP financial measure that represents net income excluding the impact of one-time items. A reconciliation of GAAP net income to adjusted net income is available in the appendix to this presentation. (3) Adjusted EPS is a non-GAAP financial measure that represents net income per share excluding the impact of one-time items. A reconciliation of GAAP EPS to adjusted EPS is available in the appendix to this presentation. (4) Free cash flow per share is a non-GAAP financial measure and represents operating cash flows less capital expenditures. A reconciliation of cash flow from operating activities to free cash flow per share is available in the appendix to this presentation. (5) Definitions for operating metrics are available in the appendix to this presentation.

GAIN Capital 5 Retail • For the quarter, generated $96.7 million of revenue and over $36 million of adjusted EBITDA, representing a margin of 38% • Trailing twelve months: • Revenue: ~$375 million • Adjusted EBITDA: ~$108 million • Revenue & volume diversification continues • TTM non-FX revenue and volume contribution: • Revenue: 51% (FX: 49%) • Volume: 39% (FX: 61%) • Partnership optimization • Q1 referral fee per million: $42/mm • PF Q1 2015: $62/mm • Indirect volume contribution: 46% Key Takeaway: Q1 2016 retail results demonstrate GAIN is well-positioned to generate Adjusted EBITDA and cash flow in a variety of market conditions Retail Financial & Operating Results Three M onths Ended M arch 31, TTM 2016 2015 (1 ) 3/31/2016 Trading Revenue $94.7 $70.7 $365.8 Other Retail Revenue 2.0 2.6 9.1 Total Revenue $96.7 $73.3 $374.9 Em ployee Com p & Ben 16.7 12.2 72.0 Marketing 6.2 4.2 28.1 Referral Fees 16.6 22.6 81.2 Other Operating Exp. 20.9 11.3 86.0 Adjusted EBITDA $36.3 $23.0 $107.6 % Margin 38% 31% 29% Operating M etrics ADV (bns) $13.5 $14.2 $15.2 Active Accounts 136,559 99,017 136,559 Client Assets $639.0 $599.0 $639.0 PnL/m m $110 $79 $93 Note: Dollars in millions, except where noted otherwise. Columns may not add due to rounding. (1) As restated for Q1 2015 See the Company’s Form 10-Q/A filed on May 3, 2016 for additional information. FX 49% Indices 23% Equities 9% Commodities & Other 19% TTM Revenue by Product Type

GAIN Capital 6 Institutional • For the quarter, generated revenue and adjusted EBITDA of $7.1 million and $1.5 million, respectively • Trailing twelve months: • Revenue: $32 million • Adjusted EBITDA: $8 million • GTX’s ECN-based business continues to drive institutional segment results • Average daily volume up 7% year-over-year in a quarter when many peers saw declines over Q1 2015 • Launch of high-speed binary market data protocols allowing customers to trade and make markets on the GTX ECN more quickly • Build-out of London data center to improve footprint in Europe Key Takeaway: GTX continuing to gain traction with banks, hedge funds and other professional investors Insitutional Financial & Operating Results Three M onths Ended M arch 31, TTM 2016 2015 (1 ) 3/31/2016 ECN $4.8 $6.2 $21.0 Swap Dealer 2.3 3.9 11.0 Total Revenue $7.1 $10.1 $32.0 Em ployee Com p & Ben 3.2 4.0 14.5 Other Operating Exp. 2.4 2.6 9.5 Adjusted EBITDA $1.5 $3.5 $8.0 % Margin 21% 35% 25% Operating M etrics ECN ADV (bns) $8.3 $7.9 $7.3 Swap Dealer ADV (bns) 2.9 3.8 3.0 Note: Dollars in millions, except where noted otherwise. Columns may not add due to rounding. (1) As restated for Q1 2015 See the Company’s Form 10-Q/A filed on May 3, 2016 for additional information. $7.9 $7.7 $6.8 $6.4 $8.3 $3.8 $2.8 $3.0 $2.8 $2.9 $11.7 $10.6 $9.8 $9.2 $11.2 ($1.0) $1.0 $3.0 $5.0 $7.0 $9.0 $11.0 $13.0 $15.0 Q1 2015 Q2 2015 Q3 2015 Q4 2015 Q1 2016 ECN Swap Dealer Institutional Quarterly ADV

GAIN Capital 7 Futures • For the quarter, generated revenue $12.2 million and adjusted EBITDA of $1.0 million • Trailing twelve months: • Revenue: $46.5 million • Adj. EBITDA: $3.6 million • Client engagement continues to grow • Client assets of $237.0 million • Nearly 9,000 active accounts • Over 38,000 average daily contracts • Revenue per contract of $5.23 represents an 8% increase over Q1 2015 • Focusing efforts on higher commission opportunities • Driven by direct marketing initiatives Key Takeaway: The Futures segment continues to be a meaningful contributor to revenue and we expect margins to improve as we focus on client acquisition via both the direct and indirect channels Futures Financial & Operating Results Three M onths Ended M arch 31, TTM 2016 2015 (1 ) 3/31/2016 Revenue $12.2 $11.5 $46.5 Em ployee Com p & Ben 3.0 2.5 11.1 Marketing 0.2 0.3 0.8 Referral Fees 4.1 3.9 16.6 Other Operating Exp. 4.0 3.6 14.4 Adjusted EBITDA $1.0 $1.2 $3.6 % Margin 8% 10% 8% Operating M etrics Avg. Daily Contracts 38,275 39,034 34,499 Active Accounts 8,890 8,562 8,890 Client Assets $237.0 $228.0 $237.0 Revenue/Contract $5.23 $4.84 $5.37 Note: Dollars in millions, except where noted otherwise. Columns may not add due to rounding. (1) As restated for Q1 2015 See the Company’s Form 10-Q/A filed on May 3, 2016 for additional information.

GAIN Capital 8 Operating Expenses Note: Dollars in millions. Columns may not add due to rounding. Q1 2015 operating expenses shown on a pro forma basis based on the simple addition of GAIN Capital and City Index. (1) As restated for the first three quarters of 2015. See the Company’s Form 10-Q/A filed on May 3, 2016 for additional information. • Q1 operating expenses continued to demonstrate GAIN’s execution on its cost- cutting plan, driven by: • City Index synergies ($45 million of run-rate savings by Q4 2016) • Partnership optimization • Referral fee per million for the quarter: $42/mm • 23% year-over-year drop in total operating expenses • 11% drop in quarterly fixed operating expenses for same period 2015 (1 ) 2016 Q1 Q2 Q3 Q4 Q1 Fixed em ployee com p & benefits 25.8$ 23.3$ 22.0$ 21.9$ 21.2$ Marketing 9.0 8.4 7.4 6.8 6.4 Trading 8.8 8.1 8.9 7.8 8.4 Fixed G&A 13.7 14.1 15.3 14.8 14.8 Com m s & Tech 5.9 5.8 5.6 4.8 5.3 Fixed Operating Expenses 63.2$ 59.7$ 59.2$ 56.1$ 56.1$ Bad Debt and other variable 5.0 1.2 3.4 1.5 1.8 Referral Fees 33.0 29.5 28.6 18.8 20.7 Variable em ployee com p & benefits 7.3 7.6 6.8 2.7 5.2 Total Operating Expenses 108.5$ 98.0$ 98.0$ 79.1$ 83.8$ $63.2 $59.7 $59.2 $56.1 $56.1 $- $10.0 $20.0 $30.0 $40.0 $50.0 $60.0 $70.0 Q1 15 Q2 15 Q3 15 Q4 15 Q1 16 Fixed Operating Expenses
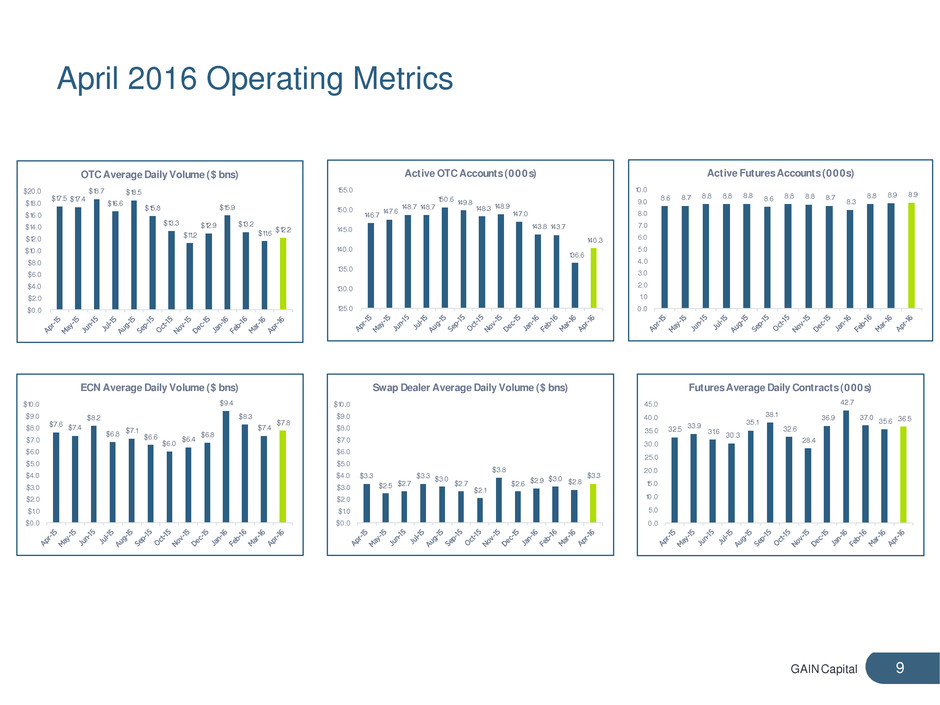
GAIN Capital 9 April 2016 Operating Metrics $17.5 $17.4 $18.7 $16.6 $18.5 $15.8 $13.3 $11.2 $12.9 $15.9 $13.2 $11.6 $12.2 $0.0 $2.0 $4.0 $6.0 $8.0 $10.0 $12.0 $14.0 $16.0 $18.0 $20.0 OTC Average Daily Volume ($ bns) 146.7 147.6 148.7 148.7 150.6 149.8 148.3 148.9 147.0 143.8 143.7 136.6 140.3 125.0 130.0 135.0 140.0 145.0 150.0 155.0 Active OTC Accounts (000s) 8.6 8.7 8.8 8.8 8.8 8.6 8.8 8.8 8.7 8.3 8.8 8.9 8.9 0.0 1.0 2.0 3.0 4.0 5.0 6.0 7.0 8.0 9.0 10.0 Active Futures Accounts (000s) $7.6 $7.4 $8.2 $6.8 $7.1 $6.6 $6.0 $6.4 $6.8 $9.4 $8.3 $7.4 $7.8 $0.0 $1.0 $2.0 $3.0 $4.0 $5.0 $6.0 $7.0 $8.0 $9.0 $10.0 ECN Average Daily Volume ($ bns) $3.3 $2.5 $2.7 $3.3 $3.0 $2.7 $2.1 $3.8 $2.6 $2.9 $3.0 $2.8 $3.3 $0.0 $1.0 $2.0 $3.0 $4.0 $5.0 $6.0 $7.0 $8.0 $9.0 $10.0 Swap Dealer Average Daily Volume ($ bns) 32.5 33.9 31.6 30.3 35.1 38.1 32.6 28.4 36.9 42.7 37.0 35.6 36.5 0.0 5.0 10.0 15.0 20.0 25.0 30.0 35.0 40.0 45.0 Futures Average Daily Contracts (000s)

GAIN Capital 10 Return of Capital • For the quarter, GAIN returned $7.6 million to investors via buybacks and dividends • Buybacks: $5.2 million • Equity: $3.5 million • Convertible: $1.7 million • Dividends: $2.4 million • Share repurchase • Repurchased 500,000 shares at an average price of $7.05 • Represents an increase of 29% from Q4 2015 repurchase of 388,095 shares • Convertible note buyback • For the quarter, GAIN repurchased $1.85 million of principal amount of convertible notes due December 2018 at an average price of $92.77 • Quarterly dividend • $0.05 per share quarterly dividend approved • Record date: June 13, 2016 • Payment date: June 20, 2016

GAIN Capital 11 Closing Remarks • Q1 2016 demonstrates strength and operating leverage of GAIN’s business • 3rd straight quarter with EBITDA >$20 million • Successful first full year with City Index • TTM Revenue: $451 million • TTM Adj. EBITDA: $92 million (20% margin) • Expect margins to improve during 2016 as we continue to execute on our synergy plan • Actively returning capital to shareholders via share buybacks, convertible note repurchases and dividends • As a result of GAIN’s cost reduction and capital management efforts we expect to drive significant shareholder value in FY 2016 and beyond

GAIN Capital Appendix 12

GAIN Capital 13 Consolidated Statement of Operations Note: Dollars in millions, except per share data. Columns may not add due to rounding. (1) As restated for Q1 2015. See the Company’s Form 10-Q/A filed on May 3, 2016 for additional information. (2) Earnings per share includes an adjustment for the redemption value of the NCI put option. Three Months Ended March 31, 2016 2015(1 ) Revenue Retail revenue 95.0$ 72.9$ Institutional revenue 6.7 9.9 Futures revenue 12.0 11.5 Other revenue 1.6 (1.4) Total non interest revenue 115.3 93.0 Interest revenue 0.3 0.3 Interest expense 0.1 0.3 Total net interest revenue 0.2 - Net revenue 115.6$ 93.0$ Expenses Em ployee com pensation and benefits 26.4 22.1 Selling and m arketing 6.4 4.6 Referral Fees 20.7 26.6 Trading expenses 8.4 7.0 General and adm inistrative 16.0 9.4 Depreciation and am ortization 3.2 2.0 Purchased intangible am ortization 3.9 2.2 Com m unications and technology 5.3 2.8 Bad debt provision 0.6 3.3 Acquisition expenses - - Restructuring expenses 0.8 - Integration expenses 0.8 0.1 Settlem ent expense 9.4 - Total operating expense 101.9 79.9 Operating profit 13.7 13.1 Interest expense on long term borrowings 2.6 1.5 Incom e before incom e tax expense 11.1 11.6 Incom e tax expense 2.3 5.7 Equity in net loss of affiliate (0.0) - Net incom e 8.7 5.8 Net incom e attributable to non-controlling interests 0.3 0.3 Net incom e applicable to Gain Capital Holdings Inc. 8.4$ 5.5$ Earnings per com m on share (2) Basic $0.17 $0.11 Diluted $0.17 $0.11 W eighted averages com m on shares outstanding used in com puting earnings per com m on share: Basic 48,622,816 43,206,628 Diluted 48,983,880 44,150,505

GAIN Capital 14 Consolidated Balance Sheet Note: Dollars in millions. Columns may not add due to rounding. As of 3/31/2016 12/31/2015 ASSETS: Cash and cash equivalents 189.7$ 171.9$ Cash and securities held for custom ers 876.0 920.6 Receivables from brokers 120.0 121.2 Prepaid assets 6.1 7.8 Property and equipm ent - net of accum ulated depreciation 32.3 30.4 Intangible assets, net 86.0 91.5 Goodwill 33.7 34.0 Other assets 53.1 47.2 Total assets 1,396.9$ 1,424.6$ LIABILITIES AND SHAREHOLDERS' EQUITY: Payables to custom ers 876.0$ 920.6$ Accrued com pensation & benefits 8.9 12.4 Accrued expenses and other liabilities 66.2 51.6 Incom e tax payable 5.8 1.1 Convertible senior notes 121.2 121.7 Total liabilities 1,078.1$ 1,107.4$ Non-controlling interest 11.3$ 11.0$ Shareholders' Equity 307.5 306.1 Total liabilities and shareholders' equity 1,396.9$ 1,424.6$
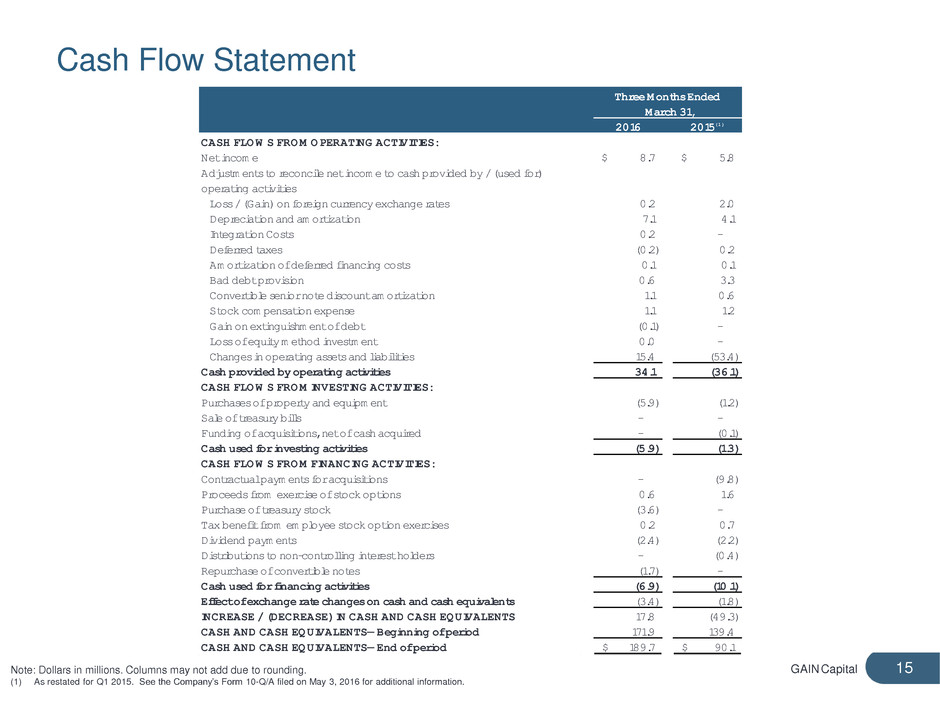
GAIN Capital 15 Cash Flow Statement Note: Dollars in millions. Columns may not add due to rounding. (1) As restated for Q1 2015. See the Company’s Form 10-Q/A filed on May 3, 2016 for additional information. Three Months Ended March 31, 2016 2015(1 ) CASH FLOW S FROM OPERATING ACTIVITIES: Net incom e 8.7$ 5.8$ Adjustm ents to reconcile net incom e to cash provided by / (used for) operating activities Loss / (Gain) on foreign currency exchange rates 0.2 2.0 Depreciation and am ortization 7.1 4.1 Integration Costs 0.2 - Deferred taxes (0.2) 0.2 Am ortization of deferred financing costs 0.1 0.1 Bad debt provision 0.6 3.3 Convertible senior note discount am ortization 1.1 0.6 Stock com pensation expense 1.1 1.2 Gain on extinguishm ent of debt (0.1) - Loss of equity m ethod investm ent 0.0 - Changes in operating assets and liabilities 15.4 (53.4) Cash provided by operating activities 34.1 (36.1) CASH FLOW S FROM INVESTING ACTIVITIES: Purchases of property and equipm ent (5.9) (1.2) Sale of treasury bills - - Funding of acquisitions, net of cash acquired - (0.1) Cash used for investing activities (5.9) (1.3) CASH FLOW S FROM FINANCING ACTIVITIES: Contractual paym ents for acquisitions - (9.8) Proceeds from exercise of stock options 0.6 1.6 Purchase of treasury stock (3.6) - Tax benefit from em ployee stock option exercises 0.2 0.7 Dividend paym ents (2.4) (2.2) Distributions to non-controlling interest holders - (0.4) Repurchase of convertible notes (1.7) - Cash used for financing activities (6.9) (10.1) Effect of exchange rate changes on cash and cash equivalents (3.4) (1.8) INCREASE / (DECREASE) IN CASH AND CASH EQUIVALENTS 17.8 (49.3) CASH AND CASH EQUIVALENTS— Beginning of period 171.9 139.4 CASH AND CASH EQUIVALENTS— End of period 189.7$ 90.1$

GAIN Capital 16 Current Liquidity Note: Dollars in millions. Columns may not add due to rounding. (1) Reflects cash that would be received from brokers following the close-out of all open positions. (2) The convertible senior notes are excluded given their long-dated maturity. As of 3/31/2016 12/31/2015 Cash and cash equivalents $189.7 $171.9 Receivables from banks and brokers (1) 120.0 121.2 Free Operating Cash $309.7 $293.1 Less: Minim um regulatory capital requirem ents (121.4) (114.5) Free Cash Available (2) $188.3 $178.6

GAIN Capital 17 Adjusted EBITDA & Margin Reconciliation Note: Dollars in millions. Columns may not add due to rounding. (1) As restated for Q1 2015. See the Company’s Form 10-Q/A filed on May 3, 2016 for additional information. (2) Adjusted EBITDA margin is calculated as adjusted EBITDA divided by net revenue. Three M onths Ended M arch 31, 2016 2015 (1 ) Net Revenue 115.6$ 93.0$ Net Incom e 8.4 5.5 Net Incom e Margin % 7% 6% Net Incom e 8.4$ 5.5$ Depreciation & am ortization 3.2 2.0 Purchase intangible am ortization 3.9 2.2 Interest expense on long term borrowings 2.6 1.5 Incom e tax expense 2.3 5.7 Restructuring 0.8 - Integration costs 0.8 0.1 Legal settlem ent 9.4 - Bad debt related to SNB event in January of 2015 - 2.5 Net incom e attributable to non-controlling interest 0.3 0.3 Adjusted EBITDA 31.7$ 19.8$ Adjusted EBITDA Margin % (2) 27% 21%

GAIN Capital 18 Adjusted Net Income and EPS Reconciliation Note: Dollars in millions, except per share and share data. Columns may not add due to rounding. (1) As restated for Q1 2015. See the Company’s Form 10-Q/A filed on May 3, 2016 for additional information. (2) Assumes 22% tax rate. Three M onths Ended M arch 31, 2016 2015 (1 ) Net Incom e $8.4 $5.5 Incom e Tax 2.3 5.7 Non-controlling interest 0.3 0.3 Pre-Tax Incom e $11.1 $11.6 Plus: Adjustm ents 11.0 2.6 Adjusted Pre-Tax Incom e $22.1 $14.2 Norm alized Incom e Tax (2) (4.9) (3.1) Non-controlling interest (0.3) (0.3) Adjusted Net Incom e $16.9 $10.8 Adjusted Earnings per Com m on Share: Basic $0.35 $0.25 Diluted $0.35 $0.24

GAIN Capital 19 Free Cash Flow per Share Reconciliation Three M onths Ended M arch 31, 2016 2015 (1 ) Cash Flows from Operating Activities $34.1 ($36.1) Less: Capital Expenditures (5.9) (1.2) Free Cash Flow $28.2 ($37.3) Free Cash Flow per Share $0.58 ($0.84) Diluted Shares Outstanding 48,983,880 44,150,505 Note: Dollars in millions, except per share and share data. Columns may not add due to rounding. (1) As restated for Q1 2015. See the Company’s Form 10-Q/A filed on May 3, 2016 for additional information.

GAIN Capital 20 Q1 2016 Key Financial Results Note: Dollars in millions, except per share data. Columns may not add due to rounding. (1) As restated Q1 2015. See the Company’s Form 10-Q/A filed on May 3, 2016 for additional information. (2) See page 17 for a reconciliation of GAAP net income to adjusted EBITDA. (3) See page 18 for a reconciliation of GAAP Net Income to adjusted net income. (4) See page 18 for a reconciliation of GAAP EPS to adjusted EPS. (5) See page 19 for a calculation of free cash flow per share. (6) Adjusted EBITDA margin is calculated as adjusted EBITDA divided by net revenue. Three Months Ended March 31, % Change 2016 2015(1) Q1 As Reported Net Revenue $115.6 $93.0 24% Operating Expenses (83.8) (73.2) 15% Adjusted EBITDA (2) $31.7 $19.8 60% Adjusted EBITDA Margin % (2)(6) 27% 21% 6 pts Net Incom e $8.4 $5.5 52% Adjusted Net Incom e(3) 16.9 10.8 57% GAAP EPS $0.17 $0.11 55% Adjusted EPS(4) 0.35 0.24 45% Pro Form a Net Revenue $115.6 $130.1 (11%) Operating Expenses (83.8) (108.5) (23%) Adjusted EBITDA (2) $31.7 $21.6 47% Adjusted EBITDA Margin % (2)(6) 27% 17% 10 pts

GAIN Capital 21 Corporate and Other Financial Results Three M onths Ended M arch 31, TTM 2016 2015 (1 ) 3/31/2016 Revenue ($0.5) ($1.9) ($2.3) Em ployee Com p & Ben 3.5 3.5 13.1 Other Operating Exp. 3.0 2.5 11.5 Adjusted EBITDA ($7.0) ($7.9) ($26.9) % Margin NA NA NA Note: Dollars in millions. Columns may not add due to rounding. (1) As restated for Q1 2015. See the Company’s Form 10-Q/A filed on May 3, 2016 for additional information.

GAIN Capital 22 Reconciliation of Segment Adjusted EBITDA to Income Before Income Tax Expense 3 M onths Ended M arch 31, 2016 2015 (1 ) Retail segm ent $36.3 $23.0 Institutional segm ent 1.5 3.5 Futures segm ent 1.0 1.2 Corporate and other (7.0) (7.9) Segm ent adjusted EBITDA $31.7 $19.8 Depreciation and am ortization $3.2 $2.0 Purchased intangible am ortization 3.9 2.2 Restructuring expenses 0.8 - Integration expenses 0.8 0.1 Legal settlem ents 9.4 - SNB bad debt provision - 2.5 Operating profit $13.7 $13.1 Interest expense on long term borrowings 2.6 1.5 Incom e before incom e tax expense $11.1 $11.6 Note: Dollars in millions. Columns may not add due to rounding. (1) As restated for Q1 2015. See the Company’s Form 10-Q/A filed on May 3, 2016 for additional information.

GAIN Capital 23 Pro Forma Reconciliation – Q1 2015(1) Note: Dollars in millions. Columns may not add due to rounding. (1) As restated for Q1 2015. See the Company’s Form 10-Q/A filed on May 3, 2016 for additional information. Q1 2015 Q2 2015 GAIN CITY TOTAL Retail 72.9$ 36.0$ 108.9$ Institutional 9.9 - 9.9 Futures 11.5 - 11.5 Operating revenue 94.3 36.0 130.3 Other (1.4)$ 1.1 (0.3) Net Interest 0.1 - 0.1 Net revenue 93.0 37.1 130.1 Net Incom e 5.5$ (4.0) 1.5 Depreciation & am ortization 2.0 2.4 4.4 Purchased intangible am ortization 2.2 3.1 5.3 Interest Expense 1.5 - 1.5 Incom e tax expense 5.7 - 5.7 Acquisition costs 0.0 - 0.0 Restructuring - 0.3 0.3 Integration Costs 0.1 - 0.1 Acquisition contingent consideration adjustm ent- - - Bad debt related to SNB event in January 15 2.5 - 2.5 Net incom e attributable to NCI 0.3 - 0.3 Adjusted EBITDA 19.8$ 1.8$ 21.6$
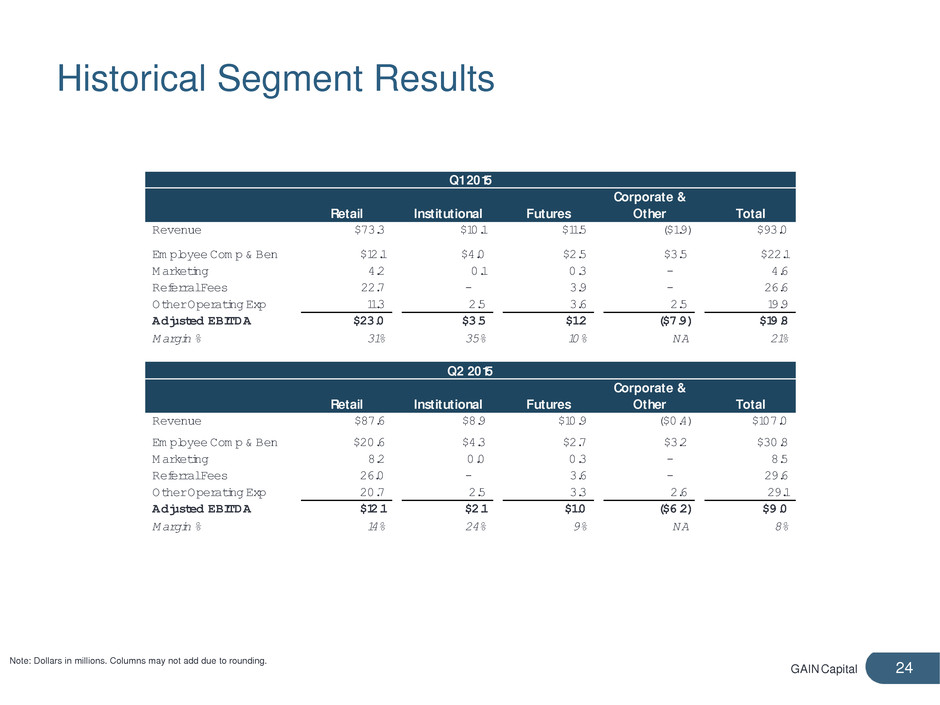
GAIN Capital 24 Historical Segment Results Q1 2015 Retail Institutional Futures Corporate & Other Total Revenue $73.3 $10.1 $11.5 ($1.9) $93.0 Em ployee Com p & Ben $12.1 $4.0 $2.5 $3.5 $22.1 Marketing 4.2 0.1 0.3 - 4.6 Referral Fees 22.7 - 3.9 - 26.6 Other Operating Exp 11.3 2.5 3.6 2.5 19.9 Adjusted EBITDA $23.0 $3.5 $1.2 ($7.9) $19.8 Margin % 31% 35% 10% NA 21% Q2 2015 Retail Institutional Futures Corporate & Other Total Revenue $87.6 $8.9 $10.9 ($0.4) $107.0 Em ployee Com p & Ben $20.6 $4.3 $2.7 $3.2 $30.8 Marketing 8.2 0.0 0.3 - 8.5 Referral Fees 26.0 - 3.6 - 29.6 Other Operating Exp 20.7 2.5 3.3 2.6 29.1 Adjusted EBITDA $12.1 $2.1 $1.0 ($6.2) $9.0 Margin % 14% 24% 9% NA 8% Note: Dollars in millions. Columns may not add due to rounding.

GAIN Capital 25 Historical Segment Results (cont.) Q3 2015 Retail Institutional Futures Corporate & Other Total Revenue $107.4 $8.7 $12.5 ($0.5) $128.1 Em ployee Com p & Ben $18.3 $3.9 $3.0 $3.5 $28.7 Marketing 7.2 0.0 0.2 - 7.4 Referral Fees 23.9 - 4.6 - 28.5 Other Operating Exp 24.3 2.4 3.7 3.0 33.4 Adjusted EBITDA $33.7 $2.4 $1.0 ($7.0) $30.1 Margin % 31% 28% 8% NA 24% Q4 2015 Retail Institutional Futures Corporate & Other Total Revenue $82.9 $7.4 $10.9 ($0.7) $100.5 Em ployee Com p & Ben $16.5 $3.1 $2.4 $2.9 $24.9 Marketing 6.6 - 0.2 - 6.8 Referral Fees 14.6 - 4.2 - 18.8 Other Operating Exp 20.0 2.2 3.4 2.9 28.5 Adjusted EBITDA $25.2 $2.1 $0.7 ($6.5) $21.5 Margin % 30% 28% 6% NA 21% Note: Dollars in millions. Columns may not add due to rounding.
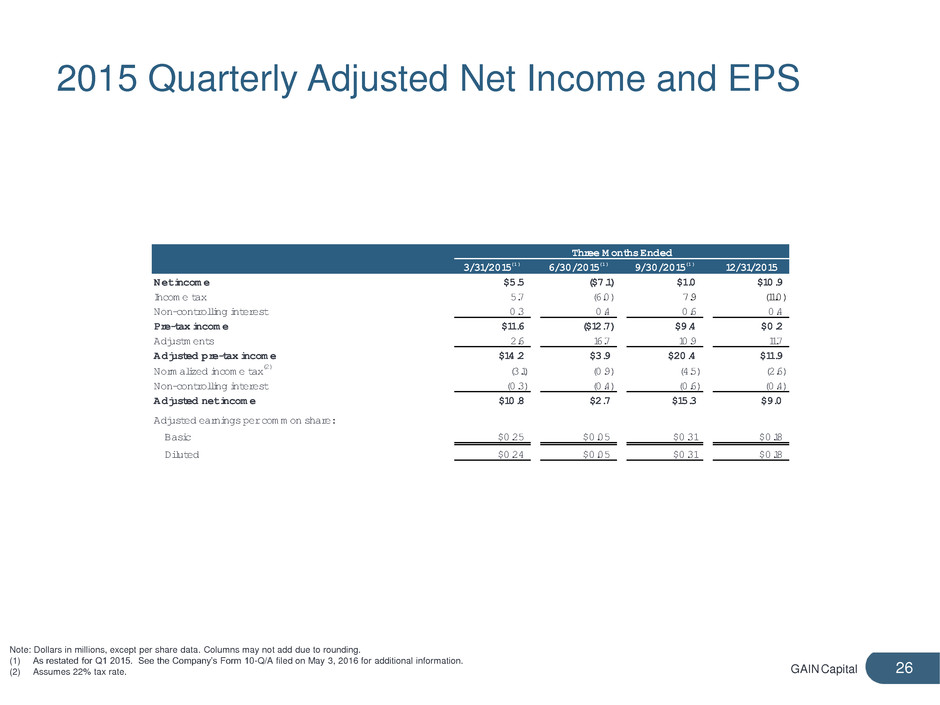
GAIN Capital 26 2015 Quarterly Adjusted Net Income and EPS Three M onths Ended 3/31/2015 (1 ) 6/30/2015 (1 ) 9/30/2015 (1 ) 12/31/2015 Net incom e $5.5 ($7.1) $1.0 $10.9 Incom e tax 5.7 (6.0) 7.9 (11.0) Non-controlling interest 0.3 0.4 0.6 0.4 Pre-tax incom e $11.6 ($12.7) $9.4 $0.2 Adjustm ents 2.6 16.7 10.9 11.7 Adjusted pre-tax incom e $14.2 $3.9 $20.4 $11.9 Norm alized incom e tax (2) (3.1) (0.9) (4.5) (2.6) Non-controlling interest (0.3) (0.4) (0.6) (0.4) Adjusted net incom e $10.8 $2.7 $15.3 $9.0 Adjusted earnings per com m on share: Basic $0.25 $0.05 $0.31 $0.18 Diluted $0.24 $0.05 $0.31 $0.18 Note: Dollars in millions, except per share data. Columns may not add due to rounding. (1) As restated for Q1 2015. See the Company’s Form 10-Q/A filed on May 3, 2016 for additional information. (2) Assumes 22% tax rate.

GAIN Capital 27 Retail OTC PnL/mm $84 $79 $110 $109 $94 $93 $110 $105 $0 $20 $40 $60 $80 $100 $120 Q1 14 Q2 14 Q3 14 Q4 14 Q1 15 Q2 15 Q3 15 Q4 15 Q1 16 Quarterly Trailing 12 Months Trailing 12 Months - Pro Forma
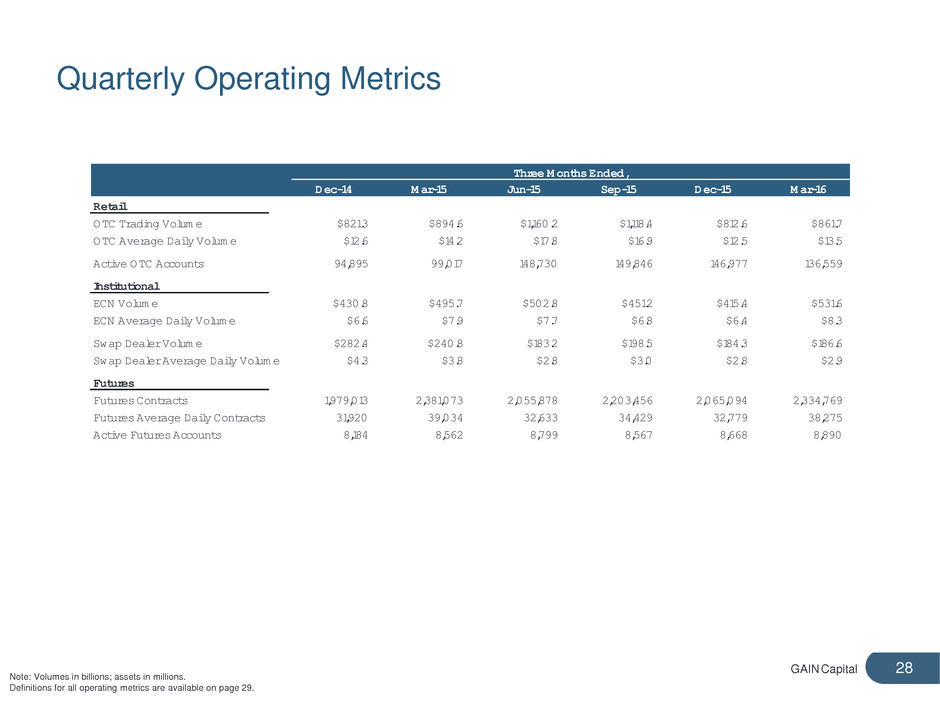
GAIN Capital 28 Quarterly Operating Metrics Note: Volumes in billions; assets in millions. Definitions for all operating metrics are available on page 29. Three M onths Ended, Dec-14 M ar-15 Jun-15 Sep-15 Dec-15 M ar-16 Retail OTC Trading Volum e $821.3 $894.6 $1,160.2 $1,118.4 $812.6 $861.7 OTC Average Daily Volum e $12.6 $14.2 $17.8 $16.9 $12.5 $13.5 Active OTC Accounts 94,895 99,017 148,730 149,846 146,977 136,559 Institutional ECN Volum e $430.8 $495.7 $502.8 $451.2 $415.4 $531.6 ECN Average Daily Volum e $6.6 $7.9 $7.7 $6.8 $6.4 $8.3 Swap Dealer Volum e $282.4 $240.8 $183.2 $198.5 $184.3 $186.6 Swap Dealer Average Daily Volum e $4.3 $3.8 $2.8 $3.0 $2.8 $2.9 Futures Futures Contracts 1,979,013 2,381,073 2,055,878 2,203,456 2,065,094 2,334,769 Futures Average Daily Contracts 31,920 39,034 32,633 34,429 32,779 38,275 Active Futures Accounts 8,184 8,562 8,799 8,567 8,668 8,890

GAIN Capital 29 Definition of Metrics • Active Accounts: Accounts who executed a transaction within the last 12 months • Trading Volume: Represents the U.S. dollar equivalent of notional amounts traded • Customer Assets: Represents amounts due to clients, including customer deposits and unrealized gains or losses arising from open positions

Financial and Operating Results First Quarter 2016 May 2016
