Attached files
| file | filename |
|---|---|
| 8-K - REALPAGE, INC. 8-K - RealPage, Inc. | a51334742.htm |
| EX-99.1 - EXHIBIT 99.1 - RealPage, Inc. | a51334742_ex991.htm |
| EX-99.2 - EXHIBIT 99.2 - RealPage, Inc. | a51334742_ex992.htm |
Exhibit 99.3

Q1 2016 EARNINGS MAY 2016
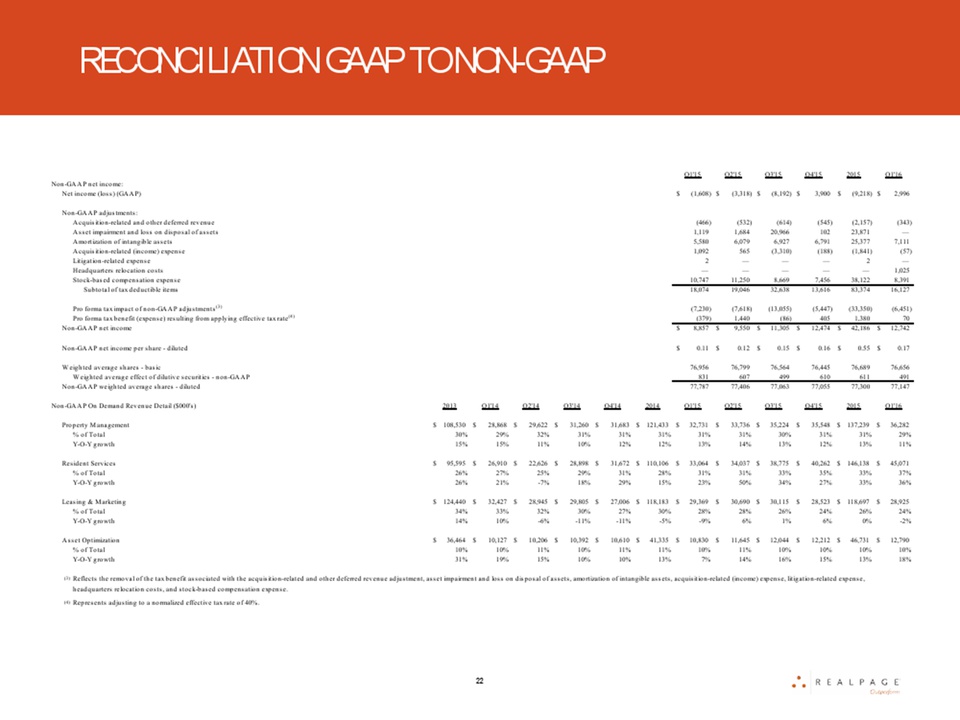
FORWARD-LOOKING STATEMENTS This presentation contains “forward-looking” statements relating to RealPage, Inc.’s expected, possible or assumed future results; its expectations regarding operating leverage, cash flow growth, margin expansion and return on invested capital; its expectations regarding innovating efforts; its opportunities to achieve synergies from its acquisition efforts; and its plans for implementing a balanced capital allocation strategy. These forward-looking statements are based on management's beliefs and assumptions and on information currently available to management. Forward-looking statements include all statements that are not historical facts and may be identified by terms such as “expects,” “believes,” “plans,” or similar expressions and the negatives of those terms. Those forward-looking statements involve known and unknown risks, uncertainties and other factors that may cause actual results, performance or achievements to be materially different from any future results, performance or achievements expressed or implied by the forward-looking statements. The company may be required to revise its results upon finalizing its review of quarterly and full year results, which could cause or contribute to such differences. Additional factors that could cause or contribute to such differences include, but are not limited to, the following: (a) the possibility that general economic conditions, including leasing velocity or uncertainty, could cause information technology spending, particularly in the rental housing industry, to be reduced or purchasing decisions to be delayed; (b) an increase in insurance claims; (c) an increase in customer cancellations; (d) the inability to increase sales to existing customers and to attract new customers; (e) RealPage, Inc.’s failure to integrate acquired businesses and any future acquisitions successfully or to achieve expected synergies; (f) the timing and success of new product introductions by RealPage, Inc. or its competitors; (g) changes in RealPage, Inc.’s pricing policies or those of its competitors; (h) legal or regulatory proceedings; (i) the inability to achieve revenue growth or to enable margin expansion; and (j) such other risks and uncertainties described more fully in documents filed with or furnished to the Securities and Exchange Commission (“SEC”) by RealPage Inc., including its Annual Report on Form 10-K previously filed with the SEC on February 29, 2016. All information provided in this release is as of the date hereof and RealPage Inc. undertakes no duty to update this information except as required by law. In addition to U.S. GAAP financials, this presentation includes certain non-GAAP financial measures. These historical non-GAAP measures are in addition to, not a substitute for or superior to, measures of financial performance prepared in accordance with GAAP. A reconciliation between GAAP and non-GAAP measures is included in the appendix to this presentation and is available on the Investor Relations portion of the website www.realpage.com. This presentation should also be used in conjunction with the company’s IR Fact Sheet and explanation of Non-GAAP Financial Measures, both previously furnished to the SEC by Form 8-K filed on May 4, 2016. RealPage is a registered trademark of RealPage, Inc. This presentation also contains additional trademarks and service marks of ours and of other companies. We do not intend our use or display of other companies’ trademarks or service marks to imply a relationship with, or endorsement or sponsorship of us by, these other companies. 2

STEVE WINN CHAIRMAN & CEO
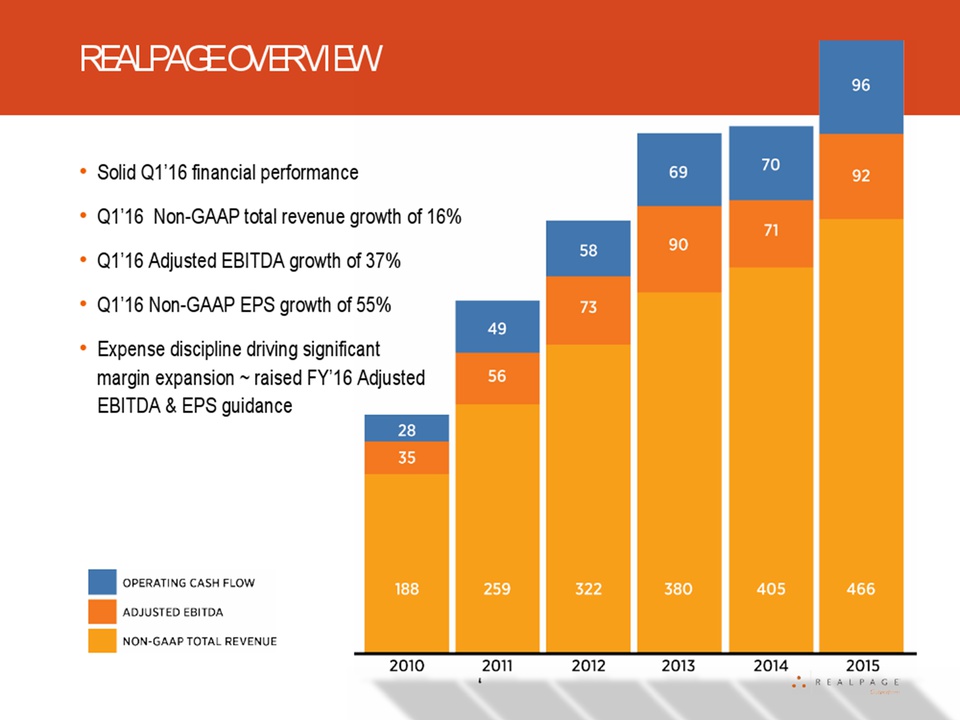
REALPAGE OVERVIEW Solid Q1’16 financial performance Q1’16 Non-GAAP total revenue growth of 16% Q1’16 Adjusted EBITDA growth of 37% Q1’16 Non-GAAP EPS growth of 55% Expense discipline driving significant margin expansion ~ raised FY’16 Adjusted EBITDA & EPS guidance 4
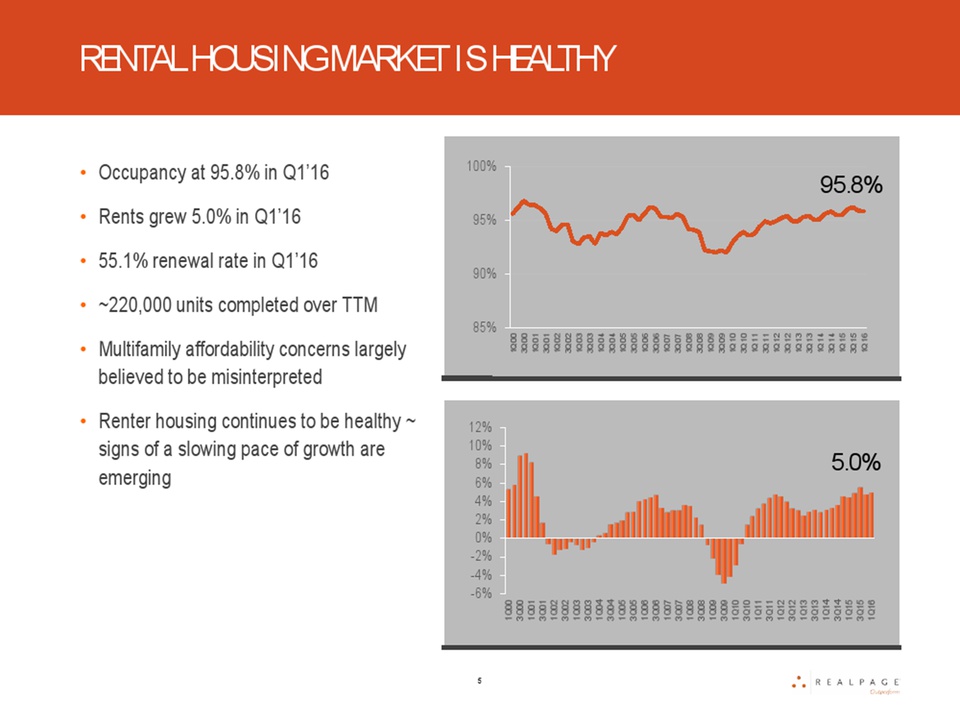
RENTAL HOUSING MARKET IS HEALTHY 95.8% 85% 90% 95% 100% 1Q00 3Q00 1Q01 3Q01 1Q02 3Q02 1Q03 3Q03 1Q04 3Q04 1Q05 3Q05 1Q06 3Q06 1Q07 3Q07 1Q08 3Q08 1Q09 3Q09 1Q10 3Q10 1Q11 3Q11 1Q12 3Q12 1Q13 3Q13 1Q14 3Q14 1Q15 3Q15 1Q16 5.0% -6% -4% -2% 0% 2% 4% 6% 8% 10% 12% 1Q00 3Q00 1Q01 3Q01 1Q02 3Q02 1Q03 3Q03 1Q04 3Q04 1Q05 3Q05 1Q06 3Q06 1Q07 3Q07 1Q08 3Q08 1Q09 3Q09 1Q10 3Q10 1Q11 3Q11 1Q12 3Q12 1Q13 3Q13 1Q14 3Q14 1Q15 3Q15 1Q16 Occupancy at 95.8% in Q1’16 Rents grew 5.0% in Q1’16 55.1% renewal rate in Q1’16 ~220,000 units completed over TTM Multifamily affordability concerns largely believed to be misinterpreted Renter housing continues to be healthy ~ signs of a slowing pace of growth are emerging 5
LEASING & MARKETING On demand revenue declined 2% YOY in Q1’16 Screening, online leasing and websites achieving solid growth Contact center headwinds continue Focusing innovation on: Optimize asset yields, reduce advertising spend and lower leasing agent labor costs Leverage leading live agent platform in rental housing Efficient marketing spend ~ higher quality leads Lead scoring and lifetime value of lease 6
PROPERTY MANAGEMENT On demand revenue grew 11% YOY in Q1’16 OneSite, Propertyware, Spend Management, Accounting & Smart Source achieving solid growth Focusing innovation on: Enterprise Accounting Platform flexibility, forecasting and advanced analytics across all asset classes – all based on actual data 7

RESIDENT SERVICES On demand revenue grew 36% YOY in Q1’16 Payments, Velocity & Renters Insurance achieving significant growth Whitepaper: RP data shows mandated renters insurance does NOT affect revenue NWP & Indatus contributed to growth 8

ASSET OPTIMIZATION On demand revenue grew 18% YOY in Q1’16 Growth driven by YieldStar® and Business Intelligence Two large NMHC top 50 customer wins Focusing innovation on: Expanding BI platform Buy / Sell side opportunity Expanding YieldStar® data set Leveraging deep data 9

NWP UPDATE Integration plan nearly complete Synergy opportunity is significant ~ perfect type of acquisition for RP Expect 5x – 6x Adjusted EBITDA post synergy Compelling ROIC 10
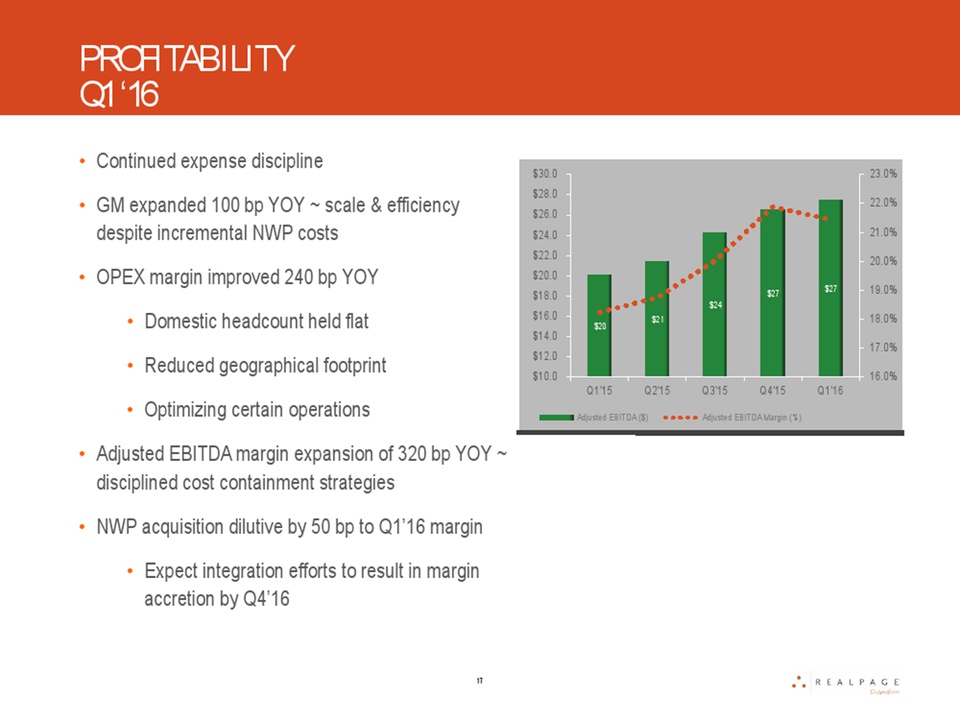
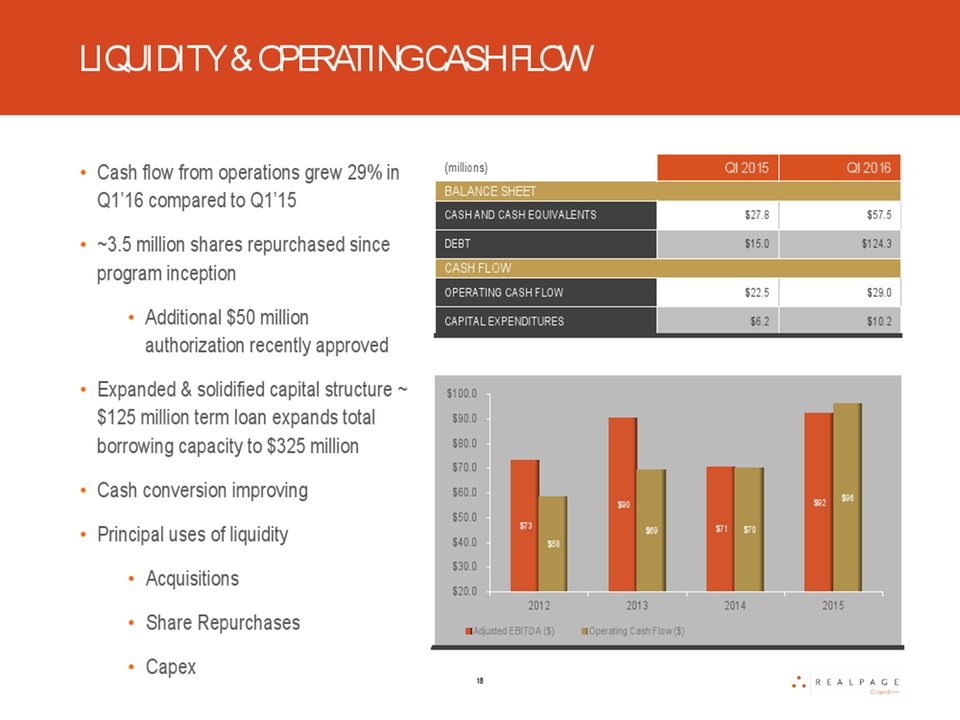
SUMMARY Expense efficiency initiatives driving significant Adjusted EBITDA margin expansion ~320 bp YOY Expect continued Adjusted EBITDA margin expansion marching towards goal of 30%+ Driving significant FCF ROIC ~ 23% for Q1’16 Underscores importance of organic and inorganic growth Balanced, flexible capital allocation philosophy Deploy opportunistically around acquisitions and share repurchases Repurchased 3.5 million shares since program inception BOD recently authorized incremental $50 million authorization Financial results were solid Invest in innovation while achieving margin expansion 11

BRYAN HILL CFO & TREASURER
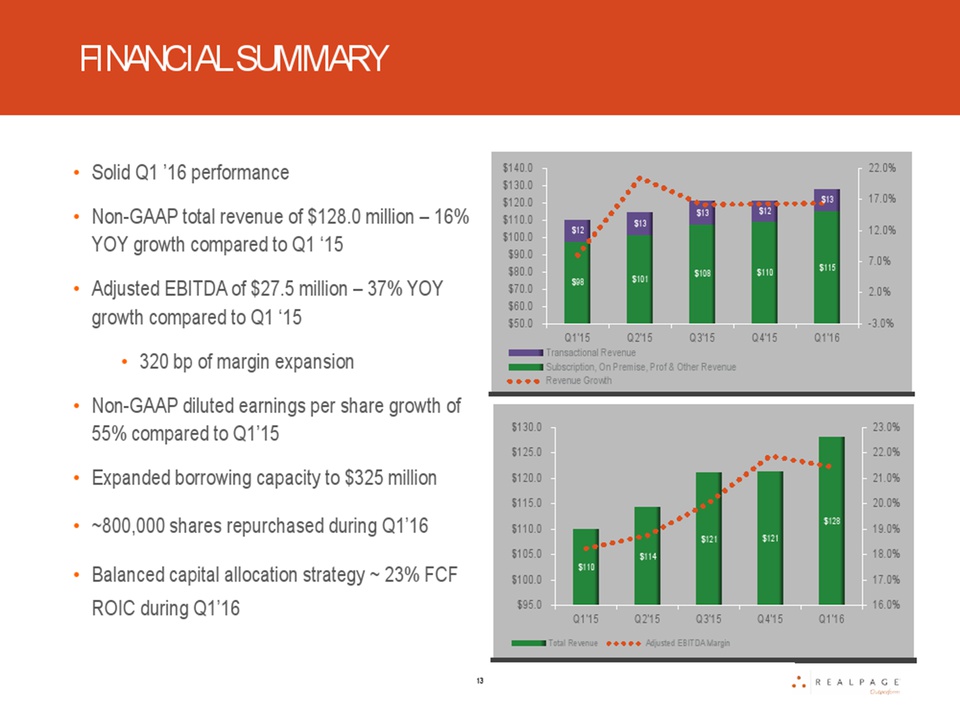
FINANCIAL SUMMARY Solid Q1 ’16 performance Non-GAAP total revenue of $128.0 million – 16% YOY growth compared to Q1 ‘15 Adjusted EBITDA of $27.5 million – 37% YOY growth compared to Q1 ‘15 320 bp of margin expansion Non-GAAP diluted earnings per share growth of 55% compared to Q1’15 Expanded borrowing capacity to $325 million ~800,000 shares repurchased during Q1’16 Balanced capital allocation strategy ~ 23% FCF ROIC during Q1’16 $98 $101 $108 $110 $115 $12 $13 $13 $12 $13 -3.0% 2.0% 7.0% 12.0% 17.0% 22.0% $50.0 $60.0 $70.0 $80.0 $90.0 $100.0 $110.0 $120.0 $130.0 $140.0 Q1'15 Q2'15 Q3'15 Q4'15 Q1'16 Transactional Revenue Subscription, On Premise, Prof & Other Revenue Revenue Growth $110 $114 $121 $121 $128 16.0% 17.0% 18.0% 19.0% 20.0% 21.0% 22.0% 23.0% $95.0 $100.0 $105.0 $110.0 $115.0 $120.0 $125.0 $130.0 Q1'15 Q2'15 Q3'15 Q4'15 Q1'16 Total Revenue Adjusted EBITDA Margin 13
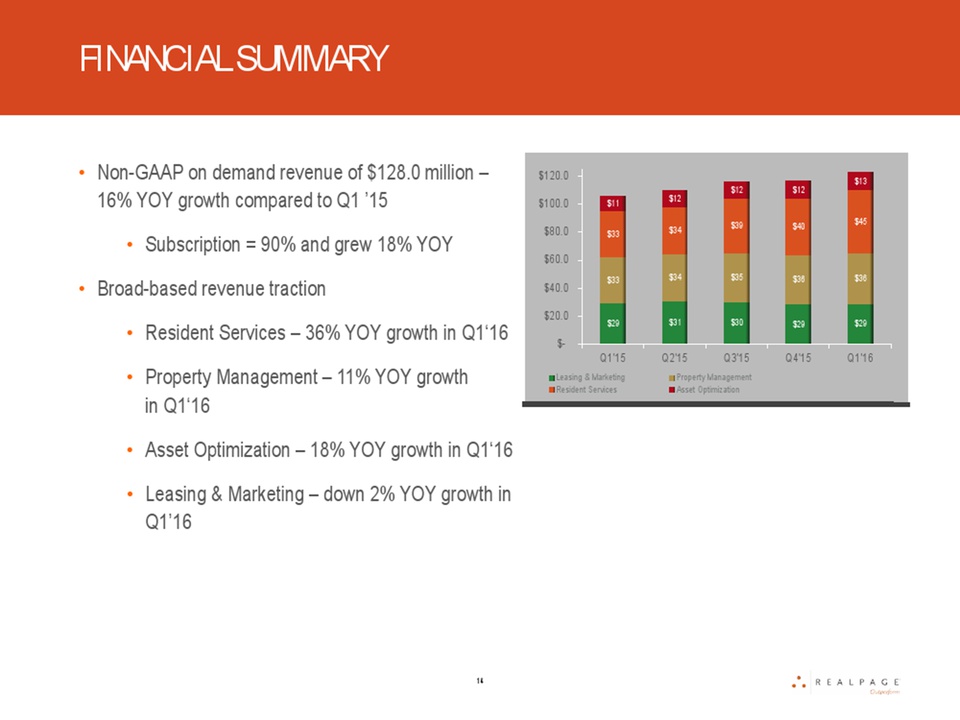
FINANCIAL SUMMARY •Non-GAAP on demand revenue of $128.0 million – 16% YOY growth compared to Q1 ’15 •Subscription = 90% and grew 18% YOY •Broad-based revenue traction •Resident Services – 36% YOY growth in Q1‘16 •Property Management – 11% YOY growth in Q1‘16 •Asset Optimization – 18% YOY growth in Q1‘16 •Leasing & Marketing – down 2% YOY growth in Q1’16 $29 $31 $30 $29 $29 $33 $34 $35 $36 $36 $33 $34 $39 $40 $45 $11 $12 $12 $12 $13 $- $20.0 $40.0 $60.0 $80.0 $100.0 $120.0 Q1'15 Q2'15 Q3'15 Q4'15 Q1'16 Leasing & Marketing Property Management Resident Services Asset Optimization 14
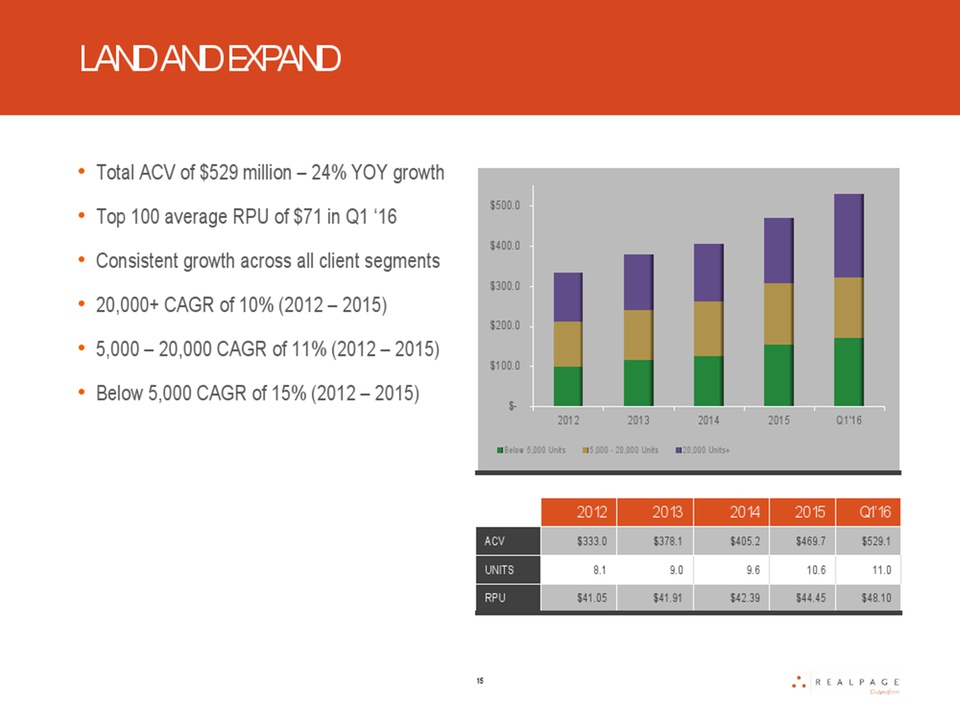
$- $100.0 $200.0 $300.0 $400.0 $500.0 2012 2013 2014 2015 Q1'16 Below 5,000 Units 5,000 - 20,000 Units 20,000 Units+ LAND AND EXPAND •Total ACV of $529 million – 24% YOY growth •Top 100 average RPU of $71 in Q1 ‘16 •Consistent growth across all client segments •20,000+ CAGR of 10% (2012 – 2015) •5,000 – 20,000 CAGR of 11% (2012 – 2015) •Below 5,000 CAGR of 15% (2012 – 2015) 15
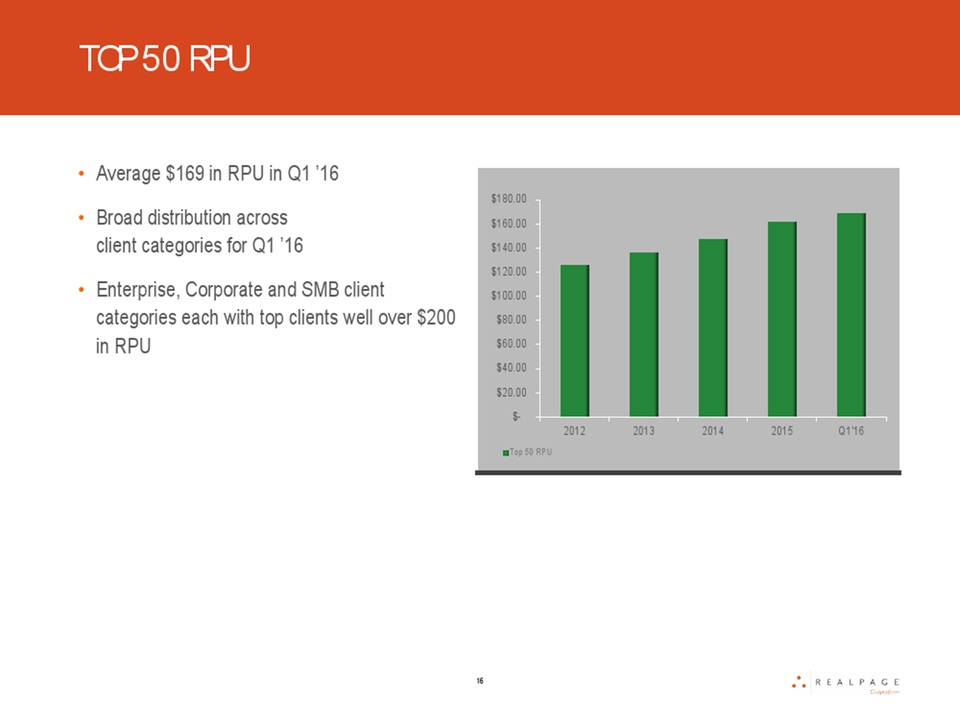
$- $20.00 $40.00 $60.00 $80.00 $100.00 $120.00 $140.00 $160.00 $180.00 2012 2013 2014 2015 Q1'16 Top 50 RPU TOP 50 RPU 16 •Average $169 in RPU in Q1 ’16 •Broad distribution across client categories for Q1 ’16 •Enterprise, Corporate and SMB client categories each with top clients well over $200 in RPU 16