Attached files
| file | filename |
|---|---|
| EXCEL - IDEA: XBRL DOCUMENT - RealPage, Inc. | Financial_Report.xls |
| EX-31.2 - EX-31.2 - RealPage, Inc. | exhibit312201410k.htm |
| EX-21.1 - EX-21.1 - RealPage, Inc. | exhibit211201410-k.htm |
| EX-32.1 - EX-32.1 - RealPage, Inc. | exhibit321201410k.htm |
| EX-31.1 - EX-31.1 - RealPage, Inc. | exhibit311201410k.htm |
| EX-23.1 - EX-23.1 - RealPage, Inc. | exhibit231consent.htm |
| EX-32.2 - EX-32.2 - RealPage, Inc. | exhibit322201410k.htm |
UNITED STATES
SECURITIES AND EXCHANGE COMMISSION
Washington, D.C. 20549
___________________________________________
FORM 10-K
___________________________________________
(Mark One)
x | ANNUAL REPORT PURSUANT TO SECTION 13 OR 15(d) OF THE SECURITIES AND EXCHANGE ACT OF 1934 |
For the fiscal year ended December 31, 2014
or
¨ | TRANSITION REPORT PURSUANT TO SECTION 13 OR 15(d) OF THE SECURITIES EXCHANGE ACT OF 1934 |
For the transition period from to
Commission File Number: 001-34846
___________________________________________
RealPage, Inc.
(Exact name of registrant as specified in its charter)
___________________________________________
Delaware | 75-2788861 | |
(State or other jurisdiction of incorporation or organization) | (I.R.S. Employer Identification No.) | |
4000 International Parkway Carrollton, Texas | 75007-1951 | |
(Address of principal executive offices) | (Zip Code) | |
(972) 820-3000
(Registrant’s telephone number, including area code)
Securities registered pursuant to Section 12(b) of the Act:
Common Stock, $0.001 par value | The NASDAQ Stock Market LLC | |
(Title of class) | (Name of each exchange on which registered) | |
Securities registered pursuant to Section 12(g) of the Act:
None
Indicate by check mark if the Registrant is a well-known seasoned issuer, as defined in Rule 405 of the Securities Act. Yes x No ¨
Indicate by check mark if the Registrant is not required to file reports pursuant to Section 13 or Section 15(d) of the Act. Yes ¨ No x
Indicate by check mark whether the Registrant (1) has filed all reports required to be filed by Section 13 or 15(d) of the Securities Exchange Act of 1934 during the preceding 12 months (or for such shorter period that the registrant was required to file such reports), and (2) has been subject to such filing requirements for the past 90 days. Yes x No ¨
Indicate by check mark whether the registrant has submitted electronically and posted on its corporate Web site, if any, every Interactive Data File required to be submitted and posted pursuant to Rule 405 of Regulation S-T (§232.405 of this chapter) during the preceding 12 months (or for such shorter period that the registrant was required to submit and post such files). Yes x No ¨
Indicate by check mark if disclosure of delinquent filers pursuant to Item 405 of Regulation S-K (§229.405 of this chapter) is not contained herein, and will not be contained, to the best of registrant’s knowledge, in definitive proxy or information statements incorporated by reference in Part III of this Form 10-K or any amendment to this Form 10-K. x
Indicate by check mark whether the registrant is a large accelerated filer, an accelerated filer, a non-accelerated filer, or a smaller reporting company. See the definitions of “large accelerated filer,” “accelerated filer” and “smaller reporting company” in Rule 12b-2 of the Exchange Act. (Check one):
Large accelerated filer | x | Accelerated filer | ¨ | |||
Non-accelerated filer | ¨ (Do not check if a smaller reporting company) | Smaller reporting company | ¨ | |||
Indicate by check mark whether the registrant is a shell company (as defined in Rule 12b-2 of the Exchange Act). Yes ¨ No x
Based on the closing price of the registrant’s common stock on the last business day of the registrant’s most recently completed second fiscal quarter, which was June 30, 2014, the aggregate market value of its shares held by non-affiliates on that date was approximately $1,184,042,012. For purposes of this calculation, the registrant assumed that all 5% holders, directors and executive officers of the registrant are affiliates. On February 13, 2015, 78,924,389 shares of the registrant’s Common Stock, $0.001 par value, were outstanding.
DOCUMENTS INCORPORATED BY REFERENCE
Portions of the Registrant’s definitive proxy statement for its 2015 Annual Meeting of Stockholders to be filed within 120 days of the Registrant’s fiscal year ended December 31, 2014 are incorporated by reference into Part III of this Annual Report on Form 10-K where indicated.
TABLE OF CONTENTS
Item 1. | ||
Item 1A. | ||
Item 1B. | ||
Item 2. | ||
Item 3. | ||
Item 4. | ||
Item 5. | Market for Registrant's Common Equity, Related Stockholder Matters and Issuer Purchases of Equity Securities | |
Item 6. | ||
Item 7. | Management's Discussion and Analysis of Financial Condition and Results of Operations | |
Item 7A. | ||
Item 8. | ||
Item 9. | ||
Item 9A. | ||
Item 9B. | ||
Item 10. | ||
Item 11. | ||
Item 12. | ||
Item 13. | ||
Item 14. | ||
Item 15. | ||
SIGNATURES AND EXHIBIT INDEX | ||
SPECIAL NOTE REGARDING FORWARD-LOOKING STATEMENTS
We have made forward-looking statements in this Annual Report on Form 10-K that are subject to risks and uncertainties. Forward-looking statements within the meaning of Section 27A of the Securities Act of 1933, as amended, and Section 21E of the Securities Exchange Act of 1934, as amended, are subject to the “safe harbor” created by those sections. The forward-looking statements in this Annual Report on Form 10-K are based on our management’s beliefs and assumptions and on information currently available to our management. In some cases, you can identify forward-looking statements by terms such as “anticipates,” “aspires,” “believes,” “can,” “continue,” “could,” “estimates,” “expects,” “intends,” “may,” “plans,” “projects,” “seeks,” “should,” “will” or “would” or the negative of these terms and similar expressions intended to identify forward-looking statements. These statements involve known and unknown risks, uncertainties and other factors, which may cause our actual results, performance, time frames or achievements to be materially different from any future results, performance, time frames or achievements expressed or implied by the forward-looking statements. We discuss many of these risks, uncertainties and other factors in this document in greater detail under the heading “Risk Factors.” We believe it is important to communicate our expectations to our investors. However, there may be events in the future that we are not able to predict accurately or over which we have no control. The risks described in “Risk Factors” included in this Annual Report on Form 10-K, as well as any other cautionary language in this Annual Report on Form 10-K, provide examples of risks, uncertainties and events that may cause our actual results to differ materially from the expectations we describe in our forward-looking statements. Before you invest in our common stock, you should be aware that the occurrence of the events described in “Risk Factors” and elsewhere in this Annual Report on Form 10-K could harm our business.
Given these risks, uncertainties and other factors, you should not place undue reliance on these forward-looking statements. Also, these forward-looking statements represent our estimates and assumptions only as of the date of this Annual Report on Form 10-K. You should read this document completely and with the understanding that our actual future results may be materially different from what we expect. We hereby qualify our forward-looking statements by these cautionary statements. Except as required by law, we assume no obligation to update these forward-looking statements publicly, or to update the reasons actual results could differ materially from those anticipated in these forward-looking statements, even if new information becomes available in the future.
1
PART I
Item 1. | Business |
Company Overview
RealPage, Inc., a Delaware corporation (together with its subsidiaries, the “Company” or “we” or “us”), is a leading provider of on demand software and software-enabled solutions for the rental housing industry. Our broad range of property management solutions enables owners and managers of single family and a wide variety of multifamily rental property types to manage their marketing, pricing, screening, leasing, accounting, purchasing and other property operations. Our on demand software solutions are delivered through an integrated software platform that provides a single point of access and a shared repository of prospect, renter and property data. By integrating and streamlining a wide range of complex processes and interactions among the rental housing and vacation rental ecosystem of owners, managers, prospects, renters and service providers, our platform helps optimize the property management process, improve the user experience, increase net operating income and increase revenue for professional property managers and property owners.
Our solutions enable property owners and managers to increase revenues and reduce operating costs through higher occupancy, improved pricing methodologies, new sources of revenue from complementary solutions and services, improved collections and more integrated and centralized processes. As of December 31, 2014, over 10,700 customers used one or more of our on demand software solutions to help manage the operations of approximately 9.6 million multifamily, single family or vacation rental units. Our customers include each of the ten largest multifamily property management companies in the United States, ranked as of January 1, 2014 by the National Multifamily Housing Council, based on the number of units managed.
We sell our solutions through our direct sales organization. Our total revenues were approximately $404.6 million, $377.0 million and $322.2 million for the years ended December 31, 2014, 2013 and 2012, respectively. In the same periods, we had operating (loss) income of approximately $(15.5) million, $21.6 million and $11.4 million, respectively, and net (loss) income of approximately $(10.3) million, $20.7 million and $5.2 million, respectively.
Our company was formed in 1998 to acquire Rent Roll, Inc., which marketed and sold on premise property management systems for the conventional and affordable multifamily rental housing markets. In June 2001, we released OneSite, our first on demand property management system. Since 2002, we have expanded our on demand software and software-enabled solutions to include property management, leasing and marketing, renter management and asset optimization capabilities. In addition to the multifamily markets, we now serve the single family, senior living, student living, military housing and vacation rental markets. In addition, since July 2002, we have completed 30 acquisitions of complementary technologies to supplement our internal product development and sales and marketing efforts and expand the scope of our solutions, the types of rental housing properties served by our solutions and our customer base. In connection with this expansion and acquisitions, we have allocated greater resources to the development and infrastructure needs of developing and increasing sales of our platform of on demand solutions.
Industry Overview
The rental housing rental market is large, growing and complex.
The rental housing market is large and characterized by challenging and location-specific operating requirements, diverse industry participants, significant mobility among renters and a variety of property types, including single family and a wide range of multifamily property types, including conventional, affordable, privatized military, student and senior housing. According to the U.S. Census Bureau American Housing Survey for the United States, there were 44.0 million rental housing units in the United States in 2013. Based on U.S. Census Bureau data and our own estimates, we believe that the overall size of the U.S. rental housing market, including rent, utilities and insurance, exceeds $435.0 billion annually. We estimate that the total addressable market for our current on demand software solutions is approximately $9.8 billion per year. This estimate assumes that each of the 44.0 million rental units in the United States has the potential to generate annually a range of approximately $140 in revenue per unit for single family units to approximately $370 in revenue per unit for conventional multifamily units. In addition, we estimate that the student and senior markets have the potential to generate annually approximately $690 in revenue per unit and affordable housing markets will generate annually approximately $160 in revenue per unit. We base this potential revenue assumption on our review of the purchasing patterns of our existing customers with respect to our on demand software solutions, the on demand software solutions currently utilized by our existing customers, the number of units our customers manage with these solutions and our current pricing for on demand software solutions.
The global vacation rental market is large and generally segmented by the type of property and seasonality. Over the last ten years, the global vacation rental market doubled in size and is expected to double again within the next three to five years. Based on our industry research, we estimate the total global vacation rental market to be approximately $45.0 billion annually. Professional vacation managers, representing roughly 2.0 million units, are responsible for approximately half of the total
2
vacation rental transactions in the market and the other half of the total transactions relate to properties that are individually managed by the property owners. We estimate that the total addressable market for our vacation rental solutions is approximately $1.6 billion per year. This estimate assumes that each of the 2.0 million units managed has the potential to generate annual revenue per unit of $800. We estimate the potential revenue assumptions based on our review of market industry research and realistic solution penetration rates, as well as related trends affecting the vacation rental market, including the analysis of vacancy rates and the average number of nights booked.
Rental property management spans both the renter life cycle and the operations of a property.
The renter life cycle can be separated into four key stages: prospect, applicant, residency or stay, and post-residency or post-stay. Each stage has unique requirements, and a property owner’s or manager’s ability to effectively address these requirements can significantly impact revenue and profitability.
In addition to managing the renter life cycle, property owners and managers must also manage the operations of their properties. Critical components of property operations include materials and service provider procurement, insurance and risk mitigation, utility and energy management, yield management, information technology and telecommunications management, accounting, expense tracking and management, document management, security, staff hiring and training, staff performance measurement and management and marketing.
Managing the renter life cycle and the operations of a property involves several different constituents, including property owners and managers, prospects, renters and service providers. Property owners can include single-property owners, multi-property owners, national residential apartment syndicates that may own thousands of units through a variety of investment funds and real estate investment trusts, or REITs. Property managers often are responsible for a large number of properties that can range from single family units to large apartment communities. Property owners and managers also need to manage a variety of service providers, including utilities, insurance providers, video, voice and data providers and maintenance and capital goods suppliers. Managing these diverse relationships, combined with renter turnover, property turnover as well as regulatory and compliance requirements, can make the operations of even a small portfolio of rental properties complex. Challenges are compounded for owners and managers responsible for a large portfolio of geographically dispersed properties, which require overseeing potentially hundreds of thousands of individual rental processes.
Legacy information technology solutions designed to manage the rental housing management process is inadequate.
During the 1970’s and 1980’s, the rental housing market was highly fragmented and regionally organized. During this period, the first property management systems and software solutions emerged to help property owners and managers with basic accounting and record keeping functions. These solutions provided limited functionality and scalability and often were not tailored to the specific needs of rental housing property owners and managers.
Beginning in the mid 1990’s, the rental housing market began to consolidate and large, nationally focused and publicly financed companies emerged, which aggregated significant numbers of units. The rise of national real estate portfolio managers, many of them accountable to public shareholders, created a need for more sophisticated and scalable property management systems that included a centralized database and were designed to optimize and automate multiple business processes within the renter life cycle and property operations. Despite increasing market demands, the available solutions continued to be insufficient to fully address the complex requirements of rental housing property owners and managers, which moved beyond basic accounting and record keeping functions to also include value-added services such as Internet marketing, applicant screening, billing solutions and analytics for pricing and yield optimization.
To address their complex and evolving requirements, many rental housing property owners and vacation property managers have historically implemented myriad single point solutions, general purpose applications such as Microsoft Excel and/or internally developed solutions to manage their properties. These solutions can be expensive to implement and maintain and often lack integrated functionality to help owners and managers increase rental revenue or reduce costs. In addition, many rental housing and vacation rental property owners and managers still rely on paper or spreadsheet-based approaches, which are typically time intensive and prone to human error or internal mismanagement.
In addition, owners and managers have relied upon print and Internet listing firms to attract leads required to fill available vacancies. We believe these historical solutions are inadequate because they:
• | require significant customization to implement, which frequently inhibits upgrading to new versions or platforms in a timely manner; |
• | require information technology, or IT, resources to support integration points between property management systems and disparate value-added services; |
• | require IT resources to implement and maintain data security, data integrity, performance and business continuity solutions; |
• | lack scalability and flexibility to account for the expansion or contraction of a property portfolio; |
3
• | lack material organic lease generation capability and do not track the cost of leads generated by each source; |
• | lack effective spend management capabilities for controlling property management costs; |
• | lack comprehensive analytics for pricing and yield optimization; |
• | lack workflow level integration; |
• | do not provide owners and managers with visibility into overall property performance; and |
• | cannot be easily updated to meet new regulations and compliance requirements. |
On demand software solutions are well suited to meet the rental housing and vacation rental markets' needs.
The ubiquitous nature of the Internet, widespread broadband adoption and improved network reliability and security has enabled the deployment and delivery of business-critical applications online. The on demand delivery model is substantially more economical than traditional on premise software solutions that generally have higher deployment and support costs and require the customer to purchase and maintain the associated servers, storage, networks, security and disaster recovery solutions.
The RealPage Solution
We provide a platform of on demand software solutions that integrates and streamlines rental property management business functions. Our solutions enable owners and managers of single family and a wide variety of multifamily rental property types, including conventional, affordable tax credit, privatized military, student and senior housing, as well as vacation rental properties, to manage their marketing, pricing, screening, leasing, accounting, purchasing and other property operations. These functions have traditionally been addressed by individual, disparate applications. Our solutions enable property owners and managers to increase revenues and reduce operating costs through higher occupancy, improved pricing methodologies, new sources of revenue from complementary solutions and services, improved collections and more integrated and centralized business processes. Our solutions contribute to a more efficient property management process and an improved experience for all of the constituents involved in the rental housing and vacation rental ecosystem, including owners, managers, prospects, renters and service providers.
Benefits to Our Customers
We believe the benefits of our solutions for our customers include the following:
Increased revenues. Our solutions enable our customers to increase their revenues by improving their sales and marketing effectiveness, optimizing their pricing and occupancy and improving collection of rental payments, utility expenses, late fees and other charges. Additionally, our solutions enable our customers to realize new sources of revenue from complementary solutions and services.
Reduced operating costs. Our solutions help our customers reduce costs by streamlining and automating many ongoing property management functions, centralizing and controlling purchasing by on-site personnel and transferring costs from the site to more efficient centrally managed operations. Our on demand delivery model also reduces owners’ and managers’ operating costs by eliminating their need to own and support the applications or associated hardware infrastructure. In addition, our integrated solutions consolidate the initial implementation and training costs and ongoing support associated with multiple applications. This is particularly important for property owners and managers who want to reduce enterprise-class IT infrastructure, support and staff training.
Improved quality of service for renters and prospects. Our solutions improve the level of service that property owners and managers provide to renters and prospects by enabling certain types of transactions to be completed online, expediting the processing of rental applications, maintenance service requests and payments and increasing the frequency and quality of communication with their renters and prospects. This provides higher renter satisfaction and increased differentiation from competing properties that do not use our solutions.
Streamlined and simplified property management business processes. Our on demand platform provides integrated solutions for managing a wide variety of property management processes that have traditionally been managed by separate manual or disaggregated applications. Our solutions utilize common authentication that enables data sharing and workflow automation of certain business processes, thereby eliminating redundant data entry and simplifying many recurring tasks. The efficiency of our solutions allows onsite and corporate personnel to utilize their time more effectively and to focus on the strategic priorities of the business. We also make extensive use of online training courseware and our solutions are designed to be usable by new employees almost immediately after their hiring, addressing an acute need of the multifamily industry in which employee turnover is high.
Ability to integrate third-party products and services. Our open architecture and application framework facilitate the integration of third-party applications and services into our solutions. This enables property managers to conduct these business
4
functions through the same system that they already use for many of their other tasks and to leverage the same repository of prospect, renter and property data that supports our solutions.
Increased visibility into property performance. Our integrated platform and common data repository enable owners and managers to gain a comprehensive view of the operational and financial performance of each of their properties. Our solutions provide a library of standard reports, dashboards, scorecards and alerts, and we also provide interfaces to several widely used report writers and business intelligence tools. We service approximately 10.0 million units of rental housing data, subsets of which can be utilized to factor rental payment history into applicant screening processes and to create more accurate supply/demand models and statistically based price elasticity models to improve price optimization.
Simple implementation and support. Our solutions include pre-configured extensions that meet the specific needs of a variety of property types and can be easily tailored by our customers to meet more specific requirements of their properties and business processes. We strive to minimize the need for professional consulting services to implement our solutions and train personnel.
Improved scalability. We host our solutions for our customers, thereby reducing or eliminating our customers’ costs associated with expanding or contracting IT infrastructure as their property portfolios evolve. We also bear the risk of technological obsolescence because we own and manage our data center infrastructure and are continually upgrading it to newer generations of technology without any incremental cost to our customers.
Competitive Strengths of our Solutions
The competitive strengths of our solutions are as follows:
Integrated on demand software platform based on a common data repository. Our solutions are delivered through an integrated on demand software platform that provides a single point of access via the Internet with a common repository of prospect, renter and property data, which permits our solutions to access requested data through offline data transfer or in real-time.
Large and growing ecosystem of property owners, managers, prospects, renters and service providers. Through December 31, 2014, we have established a customer base of over 10,700 customers who use one or more of our on demand software solutions to help manage the operations of approximately 9.6 million rental housing and vacation rental units. Our customers include each of the ten largest multifamily property management companies in the United States, ranked as of January 1, 2014 by the National Multifamily Housing Council, based on number of units managed. Our solutions automate and streamline many of the recurring transactions and interactions among this large and expanding ecosystem of property owners and managers, prospects, renters and service providers, including prospect inquiries, applications, monthly rent payments and service requests. As the number of constituents of our ecosystem increases, the volume of data in our common data repository and its value to the constituents of our ecosystem grows.
Comprehensive platform of on demand software solutions for property management. Our on demand property management solutions and integrated software-enabled value-added services provide a broad range of on demand capabilities for managing the renter life cycle and core operational processes for property management. Our software-enabled value-added services provide complementary sales and marketing, asset optimization, risk mitigation, billing and utility management, reporting, payment processing, document management, training and spend management capabilities that collectively enable our customers to manage all stages of the prospect, renter life cycles. These comprehensive solutions enable us to address the needs of a wide range of property owners and managers across a vast range of rental housing property types and vacation properties.
Deep rental housing industry expertise. We have been serving the rental housing industry exclusively for over 16 years and our senior management team members have extensive experience in the rental housing industry. We design our solutions based on our extensive rental housing industry expertise, insight into industry trends and developments and property management best practices that help our customers simplify the challenges of owning and managing rental properties.
Open cloud computing architecture. Our cloud computing architecture enables our solutions to interface with our customers’ existing systems and allows our customers to outsource the management of third-party business applications. This open architecture enables our customers to buy our solutions incrementally while continuing to use existing third-party solutions, allowing us to shorten sales cycles and increase adoption of our solutions within our target markets.
Our Strategy
We intend to leverage the breadth of our solutions and industry presence to solidify our position as a leading provider of on demand software and software-enabled solutions to the rental housing and vacation rental industries. The key elements of our strategy to accomplish this objective are as follows:
Acquire new customers. We intend to actively pursue new customer relationships with property owners and managers that do not currently use our solutions. In addition to marketing our property management solutions, we will also seek to sell our
5
software-enabled value-added services to customers of other third-party property management systems by utilizing our open architecture to facilitate integration of our solutions with those systems.
Increase the adoption of additional solutions within our existing customer base. Many of our customers rely on our property management solutions to manage their daily operations and track all of their critical prospect, renter and property information. Additionally, some of our customers utilize our software-enabled value-added services to complement third-party Enterprise Resource Planning, or ERP, systems. We have continually introduced new software-enabled value-added services to complement our property management solutions and marketed our on demand property management solutions to our customers who are utilizing third-party ERP systems. We believe that the penetration of our on demand software solutions to date has been modest and significant potential exists for additional on demand revenue from sales of these solutions to our customer base. We have significant opportunities to further leverage the critical role that our solutions play in our customers’ operations by increasing the adoption of our on demand property management solutions and software-enabled value-added services within our existing customer base, and we intend to actively focus on up-selling and cross-selling our solutions to our customers.
Add new solutions to our rental housing industry platform. We believe that we offer the most comprehensive platform of on demand software solutions for the rental housing industry. The breadth of our platform enables our customers to control many aspects of the residential rental property management process. We are able to add new capabilities that further enhance our platform, and we intend to continue developing and introducing new solutions to sell to both new and existing customers. These solutions may include localized solutions to support our customers as they grow their international operations. We also intend to develop new relationships with third-party application providers that can use our open architecture to offer additional product and service capabilities to their customers through the use of our platform.
Pursue acquisitions of complementary businesses, products and technologies. Since July 2002, we have completed 30 acquisitions that have enabled us to expand our platform, enter into new rental property markets and expand our customer base. We intend to continue to selectively evaluate opportunities to acquire businesses and technologies that may help us accomplish these and other strategic objectives.
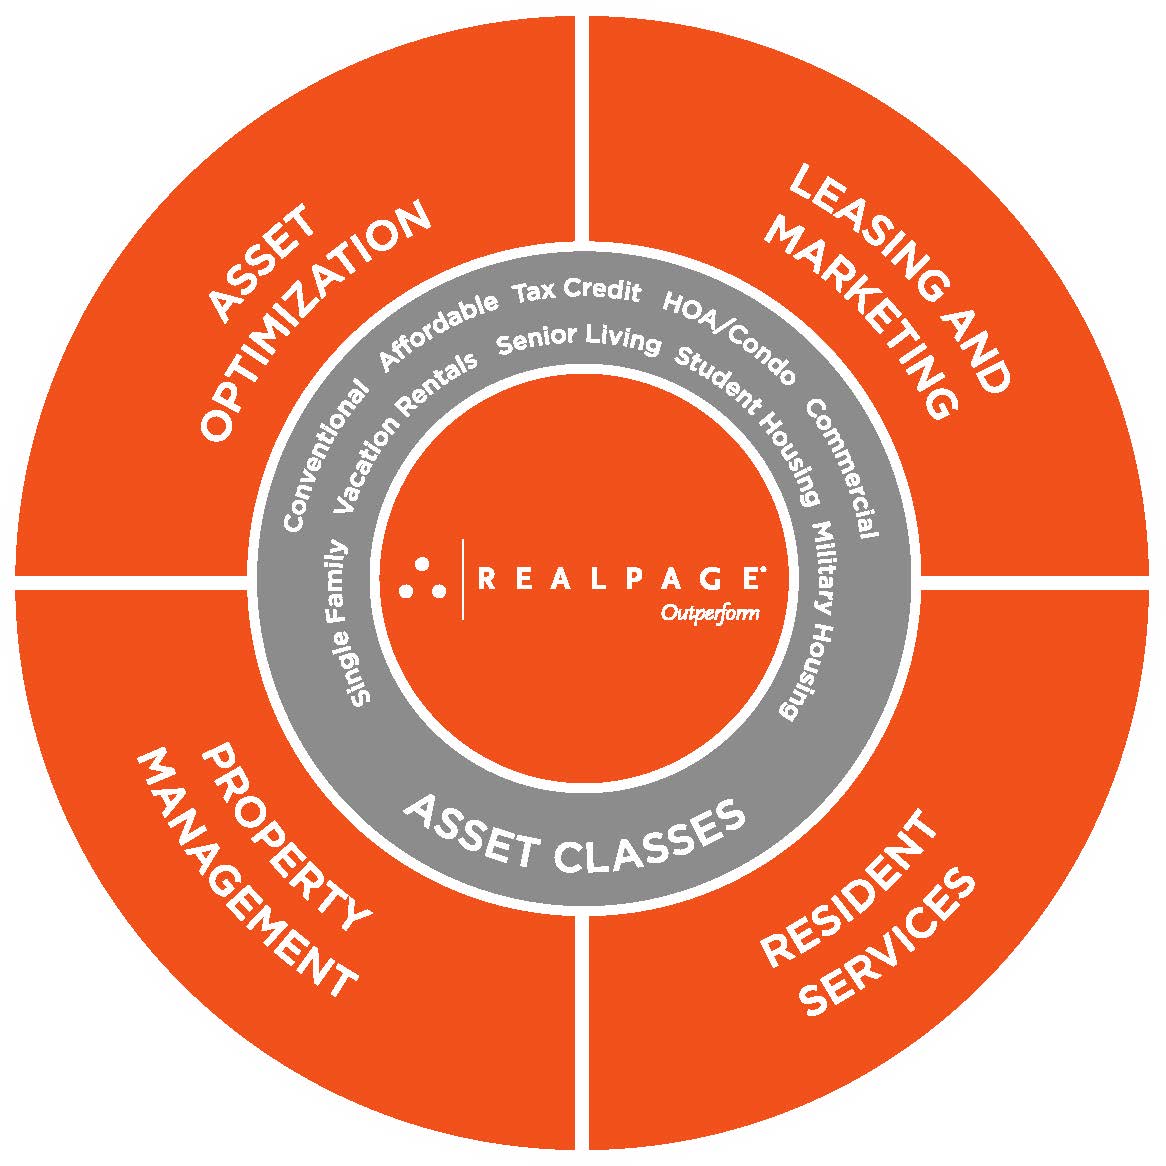
Solutions and Services
Our platform consists of four primary categories of solutions: Property Management, Leasing and Marketing, Resident Services, and Asset Optimization. These solutions provide complementary sales and marketing, asset optimization, risk mitigation, billing and utility management and spend management capabilities that collectively enable our customers to manage the stages of the renter life cycle. Each of our solutions categories includes multiple product centers that provide distinct capabilities and can be licensed separately or as a bundled package. Each product center is integrated with a central repository of prospect, renter and property data. In addition, our open architecture allows third-party applications to access our solutions using our RealPage Exchange platform.
Our platform is designed to serve as a single system of record for all of the constituents of the rental housing ecosystem, including owners, managers, prospects, renters and service providers, and to support the entire renter life cycle, from prospect to applicant to residency or guest to post-residency or post-stay. Common authentication, work flow and user experience across solution categories enables each of these constituents to access different applications as appropriate for their role.
We offer different versions of our platform for different types of properties. For example, our platform supports the specific and distinct requirements of:
• | conventional single family properties (four units or less); |
• | conventional multifamily properties (five or more units); |
• | affordable Housing and Urban Development, or HUD, properties; |
• | affordable tax credit properties; |
• | rural housing properties; |
• | privatized military housing; |
• | commercial; |
• | student housing; |
• | senior living; and |
• | vacation rentals. |
6
Property Management
Our property management solutions are typically referred to as ERP systems. These solutions manage core property management business processes, including leasing, accounting, budgeting, purchasing, facilities management, document management, and support and advisory services, and include a central database of prospect, applicant, renter and property information that is accessible in real time by our other solutions. Our property management solutions also interface with most popular general ledger accounting systems through our RealPage Exchange platform. This makes it possible for customers to deploy our solutions using our accounting system or a third-party accounting system. The property management solution category consists of five primary solutions: OneSite, Propertyware, Kigo, Spend Management Solutions and The RealPage Cloud.
OneSite
OneSite is our flagship on demand property management solution for multifamily properties. OneSite is also tailored to the specific needs of different property types (conventional multifamily, affordable properties, rural housing, privatized military housing, senior, student housing and commercial). OneSite offers functionality that generates lease documents, posts financial transactions to the renter ledger, records back-office accounting entries, manages service requests, measures acuity of senior residents, enables senior community management, manages procurement activities, enables property-specific budgeting and measures actual property performance to budget.
Propertyware
Propertyware is our on demand property management system for single family properties and small, centrally managed multifamily properties. Propertyware functionality includes accounting, maintenance and work order management, marketing spend management and portal services. In addition, we offer our screening, renter’s insurance and payment solutions through our Propertyware brand to single family and small centrally managed multifamily properties.
Kigo
Kigo is our on demand vacation rental property management system. Kigo offers solutions for vacation rental property management that include vacation rental calendars, scheduling, reservations, accounting, channel management, website design, payment processing and other tasks to aid the management of leads, revenue, resources and lodging calendars.
Spend Management Solutions
Our spend management solutions enable property owners and managers to better control costs. Spend management functionality includes purchase order automation, automated approval workflows including mobile approvals, eProcurement solutions and services leveraging our volume to negotiate vendor discounts, budget/spend limit controls, centralized expense reporting, invoice management, bid management for capital projects and automated vendor compliance tools.
The RealPage Cloud
The RealPage Cloud leverages our robust application infrastructure to allow property owners and managers to outsource portions of their IT operations. The platform offers functionality to property owners and managers that reduces IT complexity, lowers the total cost of ownership for technology, improves security, improves performance and increases scalability.
7
Leasing and Marketing
Leasing and marketing solutions are aimed at optimizing marketing spend and the leasing process. These solutions manage core leasing and marketing processes, including, websites, paid lead generation, organic lead generation, lead management, automated lead closure, lead analytics, real-time unit availability, automated online apartment leasing and applicant screening. The leasing and marketing solutions category consists of seven primary solutions: Online Leasing, Contact Center, LeaseStar Platform, LeaseStar Marketing Management, MyNewPlace, Senior Marketing Management and Resident Screening.
Online Leasing
Online leasing is our on demand leasing platform. Among other functions, the platform enables property owners and managers to utilize transaction widgets to allow renters to confirm unit availability, generate a price quote, apply for residency and fully execute a lease, all online.
Contact Center
Contact center is our on demand lead closure platform. Contact center functionality includes call/email/chat routing technology, call tracking, lead management and remote agent staffing on a permanent or overflow basis to follow up on prospective renter leads. In addition, during 2014, we entered into a partnership with the Zillow Rental Network, which includes Zillow.com, Yahoo! and HotPads, among others. As part of the partnership, Zillow will offer to all multifamily marketers that use their services the RealPage Live Agent Service, which leverages contact center functionality.
LeaseStar Platform
LeaseStar platform is an on demand organic lead generation platform. LeaseStar platform functionality includes syndication tools to ensure consistency across multiple marketing channels, classified directory campaign services, renter social referrals, reputation management, surveys, real-time reporting and enhanced lead management.
LeaseStar Marketing Management
LeaseStar marketing management is an on demand organic lead generation platform. LeaseStar marketing management functionality includes property web site design, search engine optimized content (high resolution photography, video tours, animated tours, 3D floor plans and interactive site maps), mobile applications, integration with online leasing and enhanced search engine optimization, or SEO services, to drive traffic and lead quality.
MyNewPlace
MyNewPlace is a paid lead generation platform and Internet Listing Service that helps renters find rental housing options utilizing functionality including enhanced photography, 3D floor plans, SEO enhanced descriptions and neighborhood information. As part of our partnership with the Zillow Rental Network, multifamily rental professionals who market their listings on Zillow will have the option to have their listing appear on MyNewPlace.
Senior Marketing Management
Senior marketing management is our on demand senior marketing platform. The platform utilizes functionality including paid lead generation, organic lead generation, lead management, contact center services and a placement network of care advisers powered by SeniorLiving.Net, OurParents.com, MyNewPlace.com and affiliated websites.
Renter Screening
Renter screening is part of our risk mitigation platform to reduce rental payment delinquency. Renter screening utilizes a large, proprietary database of on demand renter rental payment history to evaluate an applicant’s credit profile. Additional functionality includes criminal background checks and eviction history from accessing databases in real-time that are aggregated by third-party data providers. In addition, certain functionality enables owners and managers to optimize credit thresholds based on occupancy levels to adjust deposit and rent amounts based on the default risk of the renter in a yield neutral manner.
Resident Services
Resident services solutions provide a platform to optimize the management of current renters. These solutions manage core renter management business processes including, utility billing, renter payment processing, renter service requests, renter lease renewals, renter’s insurance, and consulting and advisory services. The resident services solutions category consists of five primary solutions: Utility Management, Payments, Resident Portal, Contact Center Maintenance and Renter’s Insurance.
Utility Management
8
Utility management is our on demand billing and utility management platform provided through our subsidiary Velocity Utility Solutions LLC. The platform offers functionality that includes automated convergent billing, utility invoice processing, utility cost management, automated energy recovery and infrastructure services (managing community energy, media, data and telecom).
Payments
Payments is our on demand payment processing platform. Payments includes functionality to enable electronic collection of rent and other payments. Provided through our RealPage Payments subsidiaries, the platform provides for processing of multiple payment types including check, money order, automated clearing house (ACH), debit cards and credit cards.
Resident Portal
Resident portal is our on demand platform for renter and community management. Resident portal functionality includes online community facilitation (between multifamily property managers, local vendors and other renters), services request status and renter lease renewals.
Contact Center Maintenance
Contact center maintenance is our on demand platform for service request management utilizing the contact center. Functionality from the platform includes service call/email/chat routing technology, service request tracking and remote agent staffing on a permanent or overflow basis to optimize the service request process.
Renter’s Insurance
Renter’s insurance is part of our risk mitigation platform to reduce liability and property damage risk. The platform offers liability and content protection renter’s insurance provided through our subsidiary Multifamily Internet Ventures, LLC. Liability policies protect property owners and managers against financial loss due to renter-caused damage, while content protection provides additional coverage for a renter’s personal belongings in the event of loss.
Asset Optimization
Asset optimization solutions are aimed at optimizing property financial and operational performance. These solutions manage core asset management and business intelligence processes, including real-time yield management, revenue growth forecasting, key variable sensitivity forecasting and operating metric benchmarking. The asset optimization solutions category consists of two primary solutions: Yield Management and Business Intelligence.
Yield Management
YieldStar is our on demand yield management platform. The platform includes real-time statistical models leveraging a repository of data to calculate optimal rent for each rental unit, pricing management advisory services and the MPF market research database.
Business Intelligence
Business intelligence is our on demand business intelligence platform designed to enable property owners and managers to outperform their peers. Business intelligence functionality includes easy-to-use customized internal reporting, at any aggregation and time horizon that can leverage operational, financial and marketing data simultaneously. In addition, the platform includes robust peer benchmarking leveraging a large repository of data, economic tools for revenue forecasting and key operating variable forecasting.
Other Solutions
Our other solutions consist of advisory services, consulting and training.
On Demand Delivery Infrastructure
Our IT infrastructure operates over four redundant 10 GBPS dedicated fiber links connecting data centers containing hundreds of servers and multiple storage area networks. This architecture makes it possible to expand the data center incrementally with little or no disruption as more users or additional applications are added. With more than 7,040 virtual servers, 466 physical servers and approximately 4.4 petabytes of data, we leverage this infrastructure and large repository of renter data to power our platform of solutions.
Our infrastructure is based on an open architecture that enables third-party applications to access OneSite and other hosted applications through our RealPage Exchange platform that provides access to more than 100 different public and private web services and XML gateways that are used to import and export data through third-party application program interfaces, or
9
APIs, and process hundreds of thousands of transactions per day. RealPage Exchange also interfaces with third-party property management systems as well as our platform solutions.
In addition, our system is designed to replicate data into a Universal Data Store, or UDS, each day. Access to UDS is enabled through an access layer called UDS Direct, which enables customers to build portfolio reports, dashboards and alerts using any Open Database Connectivity or Java Database Connectivity compliant report writer tool such as Microsoft Excel, Microsoft Access, Microsoft SQL Server Reporting Service or Crystal Reports. UDS is also transmitted to a number of our larger customers each night to feed portfolio reporting systems that they have built internally.
As of December 31, 2014, we employed approximately 110 professionals who are responsible for maintaining data security, integrity, availability, performance and business continuity in our cloud computing facilities. We annually obtain a SSAE 16 SOC 1 audit on a specified set of internal controls. Certain customers conduct separate business continuity audits of their own.
In addition to our production data centers, we manage a separate development and quality assurance testing facility used to control the pre-production testing required before each new release of our on demand software. We typically deploy new releases of the software underlying our on demand software solutions on a monthly or quarterly schedule depending on the solution.
Professional Services
We have developed repeatable, cost-effective consulting and implementation services to assist our customers in taking advantage of the capabilities enabled by our platform. Our consulting and implementation methodology leverages the nature of our on demand software architecture, the industry-specific expertise of our professional services employees and the design of our platform to simplify and expedite the implementation process. Our consulting and implementation services include project and application management procedures, business process evaluation, business model development and data conversion. Our consulting teams work closely with customers to facilitate the smooth transition and operation of our solutions.
We also offer a variety of training programs for training administrators and onsite property managers on the use of our solutions and on current issues in the property management industry. Training options include regularly hosted classroom and online instruction (through our online learning courseware) as well as online seminars, or webinars. We also enable our customers to integrate their own training content with our content to deliver an integrated and customized training program for their on-site property managers.
Product Support
We offer product support services that provide our customers with assistance from our product support professionals by phone or email in resolving issues with our solutions. We offer three product support options: Standard, Platinum, and Advanced User Line. The Standard option includes product support during business hours. The Platinum option includes the features of the Standard option plus emergency product support on Saturdays and a designated senior product support liaison. The Advanced User Line is available for direct access to a senior product subject matter expert for advanced user support. We also sponsor the RealPage User Group to facilitate communications between us and our community of users. The RealPage User Group is governed by a steering committee of our customers, which consists of two elected positions and subcommittee chairs, each representing a RealPage product center or group of product centers.
Product Development
We devote a substantial portion of our resources to developing new solutions and enhancing existing solutions, conducting product testing and quality assurance testing, improving core technology and strengthening our technological expertise in the rental housing industry. We typically deploy new releases of the software underlying our on demand software solutions on a monthly or quarterly schedule depending on the solution. As of December 31, 2014, our product development group consisted of 378 employees in the United States and 404 employees located in India, Canada, Spain and the Philippines. Product development expense totaled $64.4 million, $50.6 million and $48.2 million for 2014, 2013 and 2012, respectively.
Sales and Marketing
We sell our rental housing software and services through our direct sales organization. As of December 31, 2014, we employed approximately 300 sales representatives. We organize our sales force by geographic region, size of our prospective customers and property type. This focus provides a higher level of service and understanding of our customers’ unique needs. Our typical sales cycle with a prospective customer begins with the generation of a sales lead through Internet marketing, telemarketing efforts, trade shows or other means of referral. The sales lead is followed by an assessment of the prospective customer’s requirements, sales presentations and product demonstrations. Our sales cycle can vary substantially from customer to customer, but typically requires three to six months for larger customers and one to six weeks for smaller customers.
We sell our vacation rental software and services utilizing a high velocity sales model to drive recurring revenues. The concept of high velocity is centered on the specialization of sales roles. In our model, we have three specialized roles: lead
10
generators, appointment setters and account executives. The traditional sales model requires that sales representatives be proficient in each of these core competencies. By dividing the sales process into three distinct roles and specifically targeting resources toward each role, we optimize the movement of prospective customers into and through the sales funnel. This strategy is designed to drive teamwork and collaboration. Most importantly, it allows new hires to contribute quickly.
Our vacation sales team is an inside selling organization with offices in Dallas, Texas and Barcelona, Spain. Our Dallas team serves North America, Canada and portions of South America. Our Barcelona team serves Europe, Central America and the Asia Pacific, including Australia. Our vacation rental solution sales cycle can vary from customer to customer, but typically requires two to three months for larger customers and one to four weeks for smaller customers.
In addition to new customer sales, we sell additional solutions and consulting services to our existing customers to help them more efficiently and effectively manage their properties as the rental housing market evolves and competitive conditions change.
We generate qualified customer leads, accelerate sales opportunities and build brand awareness through our marketing programs. Our marketing programs target property management company executives, technology professionals and senior business leaders. Our marketing team focuses on the unique needs of customers within our target markets. Our marketing programs include the following activities:
• | field marketing events for customers and prospects; |
• | participation in, and sponsorship of, user conferences, trade shows and industry events; |
• | customer programs, including user meetings and our online customer community; |
• | online marketing activities, including online advertising and search engine optimization, email campaigns, web campaigns, white papers, free product trials and demos, webinars, case studies and the use of social media, including blogging, Facebook, LinkedIn and Twitter; |
• | public relations; and |
• | use of our website to provide product and company information, as well as learning opportunities for potential customers. |
We host our annual user conference where customers both participate in and deliver a variety of programs designed to help accelerate business performance through the use of our integrated platform of solutions. The conference features a variety of customer speakers, panelists and presentations focused on businesses of all sizes. The event also brings together our customers, technology vendors, service providers and other key participants in the rental housing industry to exchange ideas and best practices for improving business performance. Attendees gain insight into our product plans and participate in interactive sessions that give them the opportunity to provide input into new features and functionality.
Strategic Relationships
We maintain relationships with a variety of technology vendors and service providers to enhance the capabilities of our integrated platform of solutions. This approach allows us to expand our platform and customer base and to enter new markets. We have established the following types of strategic relationships:
Technology Vendors
We have relationships with a number of leading technology companies whose products we integrate into our platform or offer to complement our solutions. The cooperative relationships with our software and hardware technology partners allow us to build, optimize and deliver a broad range of solutions to our customers.
Service Providers
We have relationships with a number of service providers that offer complementary services that integrate into our platform and address key requirements of rental property owners and managers, including credit card and ACH services, transaction processing capabilities and insurance underwriting services.
Customers
We are committed to developing long-term customer relationships and working closely with our customers to configure our solutions to meet the evolving needs of the rental housing and vacation rental industries. Our customers include REITs, leading property management companies, fee managers, regionally based owner operators, vacation property owners and service providers. As of December 31, 2014, we had over 10,700 customers who used one or more of our on demand software solutions to help manage the operations of approximately 9.6 million rental housing and vacation rental units. Our customers include each of the ten largest multifamily property management companies in the United States, ranked as of January 1, 2014 by the National Multifamily Housing Council, based on number of units managed. For the years ended December 31, 2014,
11
2013 and 2012, no one customer accounted for more than 10% of our revenue. Revenues for our largest customer were 4.9%, 3.4% and 2.2% of total revenues for the years ended December 31, 2014, 2013 and 2012, respectively.
See Note 2 of the Notes to Consolidated Financial Statements under Item 8 of this Annual Report on Form 10-K for further information regarding measurement of our international revenue and location of our long-lived assets. For a discussion of the risks related to our foreign operations, see the risk factor entitled, “Our business is subject to the risks of international operations.” in Item 1A. “Risk Factors.”
Competition
We face competition primarily from point solution providers including traditional software vendors and other on demand software providers. To a lesser extent, we also compete with internally developed and maintained solutions. Our competitors vary depending on our solution. Our current principal competitors include:
• | in the ERP market, Yardi Systems, Inc. ("Yardi"), MRI Software LLC, Property Solutions International, Inc. (“Property Solutions”), AMSI Property Management (owned by Infor Global Solutions, Inc.), Intacct Corp, NetSuite Inc., Intuit Inc., Oracle Corporation, PeopleSoft and JD Edwards (each owned by Oracle Corporation), SAP AG, Microsoft Corporation, AppFolio Inc. and various smaller providers of accounting software; |
• | in the property management software market, Yardi and its Voyager products, AMSI Property Management (owned by Infor Global Solutions, Inc.), Boston Post (acquired by MRI Software LLC), Jenark (owned by CoreLogic), Entrata (a division of Property Solutions), ResMan and MRI Software LLC; |
• | in the single family market, Yardi, AppFolio Inc., Intuit Inc., DIY Real Estate Solutions (acquired by Yardi), Buildium, LLC, Rent Manager (owned by London Computer Systems, Inc.) and Property Boss Solutions, LLC; |
• | in the market for vertically-integrated cloud computing for multifamily real estate owners and property managers, our only substantial competition is from Yardi. We also compete with cloud computing service providers such as Amazon.com Inc., Rackspace Hosting Inc., International Business Machines Corp. and many others; |
• | in the applicant screening market, LexisNexis (a subsidiary of Reed Elsevier Group plc), Property Solutions, CoreLogic, Inc. (formerly First Advantage Corporation, an affiliate of The First American Corporation), TransUnion Rental Screening Solutions, Inc. (a subsidiary of TransUnion LLC), Resident Check Inc., Yardi, On-Site.com and many other smaller regional and local screening companies |
• | in the insurance market, our principal competitors are Assurant, Inc., Bader Company, CoreLogic, Inc., Property Solutions, Yardi and a number of national insurance underwriters (including GEICO Corporation, The Allstate Corporation, State Farm Fire and Casualty Company, Farmers Insurance Exchange, Nationwide Mutual Insurance Company and United Services Automobile Association) that market renter's insurance; |
• | in the customer relationship management (“CRM”) market, we compete with providers of contact center and call tracking services, including LeaseHawk LLC, Yardi, Property Solutions International, Inc., and numerous regional and local contact centers. In addition, we compete with lead tracking solution providers, including LeaseHawk LLC, Lead Tracking Solutions (acquired by Yardi) and Who’s Calling, Inc. In addition, we compete with content syndication providers VaultWare (owned by MRI Software LLC) and rentbits.com, Inc. Finally, we compete with companies providing web portal services, including Apartments24-7.com, Inc., Ellipse Communications, Inc., Property Solutions, G5 Search Marketing, Inc., Spherexx.com, and Yardi. Certain Internet listing services also offer websites for their customers, usually as a free value add to their listing service; |
• | in the marketing and web portal services market, we compete with G5 Search Marketing, Inc., Spherexx LLC, ReachLocal, Inc., On-Site.com, Property Solutions, Yodle, Inc., Yardi and many local or regional advertising agencies; |
• | in the Internet listing service market, we compete with ForRent (Dominium Enterprises), Apartment Guide (RentPath, Inc.), Rent.com (Primedia, Inc.), Apartments.com (CoStar Realty Information, Inc.), Apartment Finder (Network Communications, Inc.), Move, Inc., Property Solutions, Trulia, Inc., Rent Café (Yardi), Zillow and many other companies in regional areas; |
• | in the Senior Living market, we compete against A Place for Mom, Inc., Care.com, Inc., Caring, Inc., Eldermark, Care Patrol Franchise Systems, LLC, Yardi, Aging with Grace, LLC, SeniorHousingNet.com (owned by Move, Inc.), G5 Search Marketing Inc., SeniorHomes.com (owned by Moseo, Corp.), The Right Click LLC, ALMSA Corporation and many other regionally focused companies; |
• | in the utility billing and energy management market, we compete at a national level with American Utility Management, Inc., Conservice, LLC, Yardi (following its acquisitions of ista North America and Energy Billing Systems, Inc.), Property Solutions, Ocius LLC, NWP Services Corporation and Minol USA, L.P. Many other smaller utility billing companies compete for smaller rental properties or in regional areas; |
12
• | in the revenue management market, we compete with Property Solutions, The Rainmaker Group, Inc. and Yardi; |
• | in the market for multifamily housing market research, we compete with Reis, Inc., Axiometrics, Inc., Pierce-Eislen, Inc. (owned by Yardi), CoStar Group, Inc. and Portfolio Research, Inc.; |
• | in the spend management market, we compete with Yardi, AvidXchange, Inc., Nexus Systems, Inc., Ariba, Inc., Oracle Corporation, Buyers Access LLC, PAS Purchasing Solutions and ESS Technologies LLC; |
• | in the payment processing market, we compete with Chase Paymentech Solutions, LLC (a subsidiary of JPMorgan Chase & Co.), First Data Corporation, Fiserv, Inc., MoneyGram International, Inc., NWP Services Corporation, Property Solutions, On-Site.com, PayLease LLC, RentPayment.com (a subsidiary of Yapstone, Inc.), Yardi, a number of national banking institutions and those that take payments directly from tenants; |
• | in the Affordable housing compliance and audit services market, we compete with Zeffert and Associates, Inc., Preferred Compliance Solutions, Inc., Spectrum Enterprises, Inc. and many other smaller local and regional compliance and audit services. |
• | in the vacation rental market, we compete with LiveRez, Inc., HomeAway Software, Inc., and many other smaller local and regional companies. |
The principal competitive factors in our industry include total cost of ownership, level of integration with property management systems, ease of implementation, product functionality and scope, performance, security, scalability and reliability of service, brand and reputation, sales and marketing capabilities and financial resources of the provider. We believe that we compete favorably with our competitors on the basis of these factors. We also believe that none of our more significant competitors currently offer a more comprehensive or integrated on demand software solution. However, some of our existing competitors have greater name recognition, longer operating histories, larger installed customer bases, larger sales and marketing budgets, as well as greater financial, technical and other resources.
Intellectual Property
We rely on a combination of copyright, trademark and trade secret laws, as well as confidentiality procedures and contractual restrictions, to establish and protect our proprietary rights. These laws, procedures and restrictions provide only limited protection. We currently have no issued patents or pending patent applications. In the future, we may file patent applications, but patents may not be issued with respect to these patent applications, or if patents are issued, they may not provide us with any competitive advantages, may not be issued in a manner that gives us the protection that we seek and may be successfully challenged by third-parties.
We endeavor to enter into agreements with our employees and contractors and with parties with whom we do business in order to limit access to and disclosure of our proprietary information. We cannot be certain that the steps we have taken will prevent unauthorized use or reverse engineering of our technology. Moreover, others may independently develop technologies that are competitive with ours or that infringe on our intellectual property. The enforcement of our intellectual property rights also depends on any legal actions against these infringers being successful, but these actions may not be successful, even when our rights have been infringed.
Furthermore, effective patent, trademark, trade dress, copyright and trade secret protection may not be available in every country in which our solutions are available over the Internet. In addition, the legal standards relating to the validity, enforceability and scope of protection of intellectual property rights are uncertain and still evolving.
Employees
As of December 31, 2014, we had 3,875 employees. We consider our current relationship with our employees to be good. Our employees are not represented by a labor union and are not subject to a collective bargaining agreement.
Available Information
We maintain an Internet website under the name www.realpage.com. We make available, free of charge, on our website, our annual report on Form 10-K, quarterly reports on Form 10-Q, current reports on Form 8-K and amendments to those reports, as soon as reasonably practicable after providing such reports to the SEC.
We file annual reports on Form 10-K, quarterly reports on Form 10-Q, current reports on Form 8-K, proxy statements and other documents with the SEC under the Securities Exchange Act, as amended. The public may read and copy any materials that we file with the SEC at the SEC’s Public Reference Room at 100 F Street, N.E., Washington DC 20549. The public may obtain information on the operation of the Public Reference Room by calling the SEC at 1-800-SEC-0330. Also, the SEC maintains an Internet website that contains reports, proxy and information statements and other information regarding issuers, including RealPage, Inc., that file electronically with the SEC. The public can obtain any document we file with the SEC at www.sec.gov. Information contained on, or connected to, our website is not incorporated by reference into this Annual Report
13
on Form 10-K and should not be considered part of this Annual Report on Form 10-K or any other filing that we make with the SEC.
Item 1A. | Risk Factors |
Risks Related to Our Business
Our quarterly operating results have fluctuated in the past and may fluctuate in the future, which could cause our stock price to decline.
Our quarterly operating results may fluctuate as a result of a variety of factors, many of which are outside of our control. Fluctuations in our quarterly operating results may be due to a number of factors, including the risks and uncertainties discussed elsewhere in this filing. Some of the important factors that could cause our revenues and operating results to fluctuate from quarter to quarter include:
• | the extent to which on demand software solutions maintain current and achieve broader market acceptance; |
• | fluctuations in leasing activity by our customers; |
• | increase in the number or severity of insurance claims on policies sold by us; |
• | our ability to timely introduce enhancements to our existing solutions and new solutions; |
• | our ability to renew the use of our on demand products and services by units managed by our existing customers and to increase the use of our on demand products and services for the management of units by our existing and new customers; |
• | changes in our pricing policies or those of our competitors or new competitors; |
• | changes in local economic, political and regulatory environments of our international operations; |
• | the variable nature of our sales and implementation cycles; |
• | general economic, industry and market conditions in the rental housing industry that impact our current and potential customers; |
• | the amount and timing of our investment in research and development activities; |
• | technical difficulties, service interruptions, data or document losses or security breaches; |
• | Internet usage trends among consumers and the methodologies Internet search engines utilize to direct those consumers to websites such as our LeaseStar product family; |
• | our ability to hire and retain qualified key personnel, including the rate of expansion of our sales force and IT department; |
• | our ability to anticipate and adapt to external forces and emergence of new technologies and products; |
• | our ability to enter into new markets; |
• | changes in the legal, regulatory or compliance environment related to the rental housing industry or the markets in which we operate, including without limitation fair credit reporting, payment processing, data protection and privacy, social media, utility billing, insurance, the Internet and e-commerce, licensing, telemarketing, electronic communications, the Health Insurance Portability Act of 1996 (“HIPAA”) and the Health Information Technology Economic and Clinical Health Act (“HITECH”); |
• | the amount and timing of operating expenses and capital expenditures related to the expansion of our operations and infrastructure; |
• | the timing of revenue and expenses related to recent and potential acquisitions or dispositions of businesses or technologies; |
• | our ability to integrate acquisition operations in a cost-effective and timely manner; |
• | litigation and settlement costs, including unforeseen costs; |
• | public company reporting requirements; and |
• | new accounting pronouncements and changes in accounting standards or practices, particularly any affecting the recognition of subscription revenue or accounting for mergers and acquisitions. |
Fluctuations in our quarterly operating results or guidance that we provide may lead analysts to change their long-term model for valuing our common stock, cause us to face short-term liquidity issues, impact our ability to retain or attract key personnel or cause other unanticipated issues, all of which could cause our stock price to decline. As a result of the potential
14
variations in our quarterly revenue and operating results, we believe that quarter-to-quarter and year-to-date period comparisons of our revenues and operating results may not be meaningful and the results of any one quarter should not be relied upon as an indication of future performance.
We have a history of operating losses and may not maintain profitability in the future.
We have not been consistently profitable on a quarterly or annual basis and may not be able to continue our revenue growth or increase our profitability in the future. We expect to make significant future expenditures related to the development and expansion of our business. As a result of increased general and administrative expenses due to the additional operational and reporting costs associated with being a public company, we need to generate and sustain increased revenue to achieve future profitability expectations. We may incur significant losses in the future for a number of reasons, including the other risks and uncertainties described in this filing. Additionally, we may encounter unforeseen operating expenses, difficulties, complications, delays and other unknown factors that may result in losses in future periods. If these losses exceed our expectations or our growth expectations are not met in future periods, our financial performance will be affected adversely.
If we are unable to manage the growth of our diverse and complex operations, our financial performance may suffer.
The growth in the size, dispersed geographic locations, complexity and diversity of our business and the expansion of our product lines and customer base has placed, and our anticipated growth may continue to place, a significant strain on our managerial, administrative, operational, financial and other resources. We increased our number of employees from 922 as of December 31, 2008 to 3,875 as of December 31, 2014. We increased our number of on demand customers from 2,669 as of December 31, 2008 to approximately 10,700 as of December 31, 2014. In addition, we have grown and expect to continue to grow through acquisitions. Our ability to effectively manage our anticipated future growth will depend on, among other things, the following:
• | successfully supporting and maintaining a broad range of current and emerging solutions; |
• | maintaining continuity in our senior management and key personnel; |
• | attracting, retaining, training and motivating our employees, particularly technical, customer service and sales personnel; |
• | enhancing our financial and accounting systems and controls; |
• | enhancing our information technology infrastructure, processes and controls; |
• | successfully completing system upgrades and enhancements; and |
• | managing expanded operations in geographically dispersed locations. |
If we do not manage the size, complexity and diverse nature of our business effectively, we could experience product performance issues, delayed software releases and longer response times for assisting our customers with implementation of our solutions and could lack adequate resources to support our customers on an ongoing basis, any of which could adversely affect our reputation in the market and our ability to generate revenue from new or existing customers.
The nature of our platform is complex and highly integrated, and if we fail to successfully manage releases or integrate new solutions, it could harm our revenues, operating income and reputation.
We manage a complex platform of solutions that consists of our property management solutions, integrated software-enabled value-added services and web-based advertising and lease generation services. Many of our solutions include a large number of product centers that are highly integrated and require interoperability with other RealPage products, as well as products and services of third-party service providers. Additionally, we typically deploy new releases of the software underlying our on demand software solutions on a bi-weekly, monthly or quarterly schedule, depending on the solution. Due to this complexity and the condensed development cycles under which we operate, we may experience errors in our software, corruption or loss of our data or unexpected performance issues from time to time. For example, our solutions may face interoperability difficulties with software operating systems or programs being used by our customers, or new releases, upgrades, fixes or the integration of acquired technologies may have unanticipated consequences on the operation and performance of our other solutions. If we encounter integration challenges or discover errors in our solutions late in our development cycle, it may cause us to delay our launch dates. Any major integration or interoperability issues or launch delays could have a material adverse effect on our revenues, operating income and reputation.
Our business depends substantially on the renewal of our products and services for on demand units managed by our customers and the increase in the use of our on demand products and services for on demand units.
With the exception of some of our LeaseStar and Propertyware solutions, which are typically month-to-month, we generally license our solutions pursuant to customer agreements with a term of one year. The pricing of the agreements is typically based on a price per unit basis. Our customers have no obligation to renew these agreements after their term expires, or to renew these agreements at the same or higher annual contract value. In addition, under specific circumstances, our
15
customers have the right to cancel their customer agreements before they expire, for example, in the event of an uncured breach by us, or in some circumstances, by giving 30 days’ notice or paying a cancellation fee. In addition, customers often purchase a higher level of professional services in the initial term than they do in renewal terms to ensure successful activation. As a result, our ability to grow is dependent in part on customers purchasing additional solutions or professional services for their on demand units after the initial term of their customer agreement. Though we maintain and analyze historical data with respect to rates of customer renewals, upgrades and expansions, those rates may not accurately predict future trends in renewal of on demand units. Our customers’ on demand unit renewal rates may decline or fluctuate for a number of reasons, including, but not limited to, their level of satisfaction with our solutions, our pricing, our competitors’ pricing, reductions in our customers’ spending levels or reductions in the number of on demand units managed by our customers. If our customers cancel or amend their agreements with us during their term, do not renew their agreements, renew on less favorable terms or do not purchase additional solutions or professional services in renewal periods, our revenue may grow more slowly than expected or decline and our profitability may be harmed.
Additionally, we have experienced, and expect to continue to experience, some level of on demand unit attrition as properties are sold and the new owners and managers of properties previously owned or managed by our customers do not continue to use our solutions. We cannot predict the amount of on demand unit turnover we will experience in the future. However, we have experienced higher rates of on demand unit attrition with our Propertyware property management system, primarily because it serves smaller properties than our OneSite property management system, and we may experience higher levels of on demand unit attrition to the extent Propertyware grows as a percentage of our revenues. If we experience increased on demand unit turnover, our financial performance and operating results could be adversely affected.
On demand revenue that is derived from products that help owners and managers lease and market apartments, such as certain products in LeaseStar and LeasingDesk, may decrease as occupancy rates rise. We have also experienced, and expect to continue to experience, some number of consolidations of our customers with other parties. If one of our customers consolidates with a party who is not a customer, our customer may decide not to continue to use our solutions for its on demand units. In addition, if one of our customers is consolidated with another customer, the acquiring customer may have negotiated lower prices for our solutions or may use fewer of our solutions than the acquired customer. In each case, the consolidated entity may attempt to negotiate lower prices for using our solutions as a result of the entity’s increased size. These consolidations may cause us to lose on demand units or require us to reduce prices as a result of enhanced customer leverage, which could cause our financial performance and operating results to be adversely affected.
Historically, our on demand units managed by our customers have renewed at a rate of 95.3% based on an average of the last two years ending December 31, 2014.
Because we recognize subscription revenue over the term of the applicable customer agreement, a decline in subscription renewals or new service agreements may not be reflected immediately in our operating results.
We generally recognize revenue from customers ratably over the terms of their customer agreements which, with the exception of our month-to-month advertising, lease generation and Propertyware agreements, are typically one year. As a result, much of the revenue we report in each quarter is deferred revenue from customer agreements entered into during previous quarters. Consequently, a decline in new or renewed customer agreements in any one quarter will not be fully reflected in our revenue or our results of operations until future periods. Accordingly, this revenue recognition model also makes it difficult for us to rapidly increase our revenue through additional sales in any period, as revenue from new customers must be recognized over the applicable subscription term.
We may not be able to continue to add new customers and retain and increase sales to our existing customers, which could adversely affect our operating results.
Our revenue growth is dependent on our ability to continually attract new customers while retaining and expanding our service offerings to existing customers. Growth in the demand for our solutions may be inhibited and we may be unable to sustain growth in our sales for a number of reasons, including, but not limited to:
• | our failure to develop new or additional solutions; |
• | our inability to market our solutions in a cost-effective manner to new customers or in new vertical or geographic markets; |
• | our inability to expand our sales to existing customers; |
• | the inability of our LeaseStar product family to grow traffic to its websites, resulting in lower levels of lead and lease/move-in traffic to customers; |
• | our inability to build and promote our brand; and |
• | perceived or actual security, integrity, reliability, quality or compatibility problems with our solutions. |
16
A substantial amount of our past revenue growth was derived from purchases of upgrades and additional solutions by existing customers. Our costs associated with increasing revenue from existing customers are generally lower than costs associated with generating revenue from new customers. Therefore, a reduction in the rate of revenue increase from our existing customers, even if offset by an increase in revenue from new customers, could reduce our profitability and have a material adverse effect on our operating results.
If we are not able to integrate past or future acquisitions successfully, our operating results and prospects could be harmed.
We have acquired new technology and domain expertise through multiple acquisitions, including our most recent acquisitions of Seniors for Living, Inc. in February 2013; RentSentinel and RentSocial in March 2013; Windsor Compliance Services, Inc., MyBuilding Inc., and Active Building, LLC in October 2013; Bookt, LLC in January 2014; Virtual Maintenance Manager in March 2014; Notivus Multi-Family LLC in May 2014; and Kigo, Inc. in June 2014. We expect to continue making acquisitions. The success of our future acquisition strategy will depend on our ability to identify, negotiate, complete and integrate acquisitions. Acquisitions are inherently risky, and any acquisitions we complete may not be successful. Any acquisitions we pursue would involve numerous risks, including the following:
• | difficulties in integrating and managing the operations and technologies of the companies we acquire; |
• | diversion of our management’s attention from normal daily operations of our business; |
• | our inability to maintain the customers, the key employees, the key business relationships and the reputations of the businesses we acquire; |
• | our inability to generate sufficient revenue from acquisitions to offset our increased expenses associated with acquisitions; |
• | our responsibility for the liabilities of the businesses we acquire, including, without limitation, liabilities arising out of their failure to maintain effective data security, data integrity, disaster recovery and privacy controls prior to the acquisition, or their infringement or alleged infringement of third-party intellectual property, contract or data access rights prior to the acquisition; |
• | difficulties in complying with new markets or regulatory standards to which we were not previously subject; |
• | delays in our ability to implement internal standards, controls, procedures and policies in the businesses we acquire; and |
• | adverse effects of acquisition activity on the key performance indicators we use to monitor our performance as a business. |
Our current acquisition strategy includes the acquisition of companies that offer property management systems or other systems that may not inter-operate with our software-enabled value-added services. In order to integrate and fully realize the benefits of such acquisitions, we expect to build application interfaces that enable such customers to use a wide range of our solutions while they continue to use their legacy management systems. In addition, over time we expect to migrate each acquired company’s customers to our on demand property management solutions to retain them as customers and to be in a position to offer them our solutions on a cost-effective basis. These efforts may be unsuccessful or entail costs that result in losses or reduced profitability.
Unanticipated events and circumstances occurring in future periods may affect the realizability of our intangible assets recognized through acquisitions. The events and circumstances that we consider include significant under-performance relative to projected future operating results and significant changes in our overall business or product strategies. These events and circumstances may cause us to revise our estimates and assumptions used in analyzing the value of our other intangible assets with indefinite lives, and any such revision could result in a non-cash impairment charge that could have a material impact on our financial results.
We may be unable to secure the equity or debt funding necessary to finance future acquisitions on terms that are acceptable to us, or at all. If we finance acquisitions by issuing equity or convertible debt securities, our existing stockholders will likely experience ownership dilution, and if we finance future acquisitions with debt funding, we will incur interest expense and may have to comply with additional financing covenants or secure that debt obligation with our assets.
If we are unable to successfully develop or acquire and sell enhancements and new solutions, our revenue growth will be harmed and we may not be able to meet profitability expectations.
The industry in which we operate is characterized by rapidly changing customer requirements, technological developments and evolving industry standards. Our ability to attract new customers and increase revenue from existing customers will depend in large part on our ability to successfully develop, bring to market and sell enhancements to our existing solutions and new solutions that effectively respond to the rapid changes in our industry. Any enhancements or new solutions that we develop or acquire may not be introduced to the market in a timely or cost-effective manner and may not
17
achieve the broad market acceptance necessary to generate the revenue required to offset the operating expenses and capital expenditures related to development or acquisition. If we are unable to timely develop or acquire and sell enhancements and new solutions that keep pace with the rapid changes in our industry, our revenue will not grow as expected and we may not be able to maintain or meet profitability expectations.
We derive a substantial portion of our revenue from a limited number of our solutions and failure to maintain demand for these solutions or diversify our revenue base through increasing demand for our other solutions could negatively affect our operating results.
Historically, a majority of our revenue was derived from sales of our OneSite property management system and our LeasingDesk software-enabled value-added service. If we are unable to develop enhancements to these solutions to maintain demand for these solutions or to diversify our revenue base by increasing demand for our other solutions, our operating results could be negatively impacted. If there is inadequate demand for these new products, our operating results could be negatively impacted.
We use a small number of data centers to deliver our solutions. Any disruption of service at our data centers or other facilities could interrupt or delay our customers’ access to our solutions, which could harm our operating results.
The ability of our customers to access our service is critical to our business. We host our products and services, support our operations and service our customers primarily from our data centers in the Dallas, Texas area.
We may fail to provide such service as a result of numerous factors, many of which are beyond our control, including, without limitation: mechanical failure, power outage, human error, physical or electronic security breaches, war, terrorism and related conflicts or similar events worldwide, fire, earthquake, hurricane, flood and other natural disasters, sabotage and vandalism. We attempt to mitigate these risks at our Texas-based data centers or other facilities through various business continuity efforts, including: redundant infrastructure, 24 x 7 x 365 system activity monitoring, backup and recovery procedures, use of a secure off-site storage facility for backup media, separate test systems and rotation of management and system security measures, but our precautions may not protect against all potential problems. Disaster recovery procedures are in place to facilitate the recovery of our operations, products and services within the stated service level goals. Our secondary data center is equipped with physical space, power, storage and networking infrastructure and Internet connectivity to support the solutions we provide in the event of the interruption of services at our primary data center. Even with this secondary data center, however, our operations would be interrupted during the transition process should our primary data center experience a failure. Moreover, both our primary and secondary data centers are located in the greater metropolitan Dallas area. As a result, any regional disaster could affect both data centers and result in a material disruption of our services. Furthermore, these business continuity efforts do not support our data centers outside of Texas or any centers operated by third-party providers.
Problems at one or more of our data centers, whether or not within our control, could result in service disruptions or delays or loss or corruption of data or documents. This could damage our reputation, cause us to issue credits to customers, subject us to potential liability or costs related to defending against claims, cause customers to terminate or elect not to renew their agreements, any of which could negatively impact our revenues and harm our operating results.
Interruptions or delays in service from our third-party data center providers could impair our ability to deliver certain of our products to our customers, resulting in customer dissatisfaction, damage to our reputation, loss of customers, limited growth and reduction in revenue.
Some of our products and services derived from recent acquisitions are hosted and supported from data centers in other geographic locations within the continental United States and Europe, many of which are operated by third-party providers. Unless and until these acquired products and services are migrated to our Texas-based data centers, we will not have sole control over the operations of all data center facilities used in our business. Our operations depend, in part, on our third-party data center providers’ abilities to protect these facilities against damage or interruption from natural disasters, power or telecommunications failures, criminal acts and similar events. In the event that any of our third-party hosting or facilities arrangements is terminated, or if there is a lapse of service or damage to a facility, we could experience interruptions in the availability of our on-demand software as well as delays and additional expenses in arranging new facilities and services.
Despite precautions taken at our controlled and third-party data centers, the occurrence of spikes in usage volume, a natural disaster, an act of terrorism, adverse changes in United States or foreign laws and regulations, vandalism or sabotage, a decision to close a third-party facility without adequate notice, or other unanticipated problems at a facility could result in lengthy interruptions in the availability of our on-demand software. Even with current and planned disaster recovery arrangements, our business could be harmed. Also, in the event of damage or interruption, our insurance policies may not adequately compensate us for any losses that we may incur. These factors in turn could further reduce our revenue, subject us to liability and cause us to issue credits or cause customers to fail to renew their subscriptions, any of which could materially adversely affect our business.
18
We provide service level commitments to our customers, and our failure to meet the stated service levels could significantly harm our revenue and our reputation.
Our customer agreements provide that we maintain certain service level commitments to our customers relating primarily to product functionality, network uptime, critical infrastructure availability and hardware replacement. For example, our service level agreements generally require that our solutions are available 98% of the time during coverage hours (normally 6:00 a.m. though 10:00 p.m. Central time daily) 365 days per year (other than certain permitted exceptions such as maintenance). If we are unable to meet the stated service level commitments, we may be contractually obligated to provide customers with refunds or credits. Additionally, if we fail to meet our service level commitments a specified number of times within a given time frame or for a specified duration, our customers may terminate their agreements with us or extend the term of their agreements at no additional fee. As a result, a failure to deliver services for a relatively short duration could cause us to issue credits or refunds to a large number of affected customers or result in the loss of customers. In addition, we cannot assure you that our customers will accept these credits, refunds, termination or extension rights in lieu of other legal remedies that may be available to them. Our failure to meet our commitments could also result in substantial customer dissatisfaction or loss. Because of the loss of future revenues through the issuance of credits or the loss of customers or other potential liabilities, our revenue could be significantly impacted if we cannot meet our service level commitments to our customers.
We face intense competitive pressures and our failure to compete successfully could harm our operating results.
The market for many of our solutions is intensely competitive, fragmented and rapidly changing. Some of these markets have relatively low barriers to entry. With the introduction of new technologies and market entrants, we expect competition to intensify in the future. Increased competition generally could result in pricing pressures, reduced sales and reduced margins. Often we compete to sell our solutions against existing systems that our potential customers have already made significant expenditures to install.
Our competitors vary depending on our product and service. In the market for accounting software we compete with Yardi Systems, Inc. ("Yardi"), MRI Software LLC, Property Solutions International, Inc. (“Property Solutions”), AMSI Property Management (owned by Infor Global Solutions, Inc.), Intacct Corp, NetSuite Inc., Intuit Inc., Oracle Corporation, PeopleSoft and JD Edwards (each owned by Oracle Corporation), SAP AG, Microsoft Corporation, AppFolio Inc. and various smaller providers of accounting software. High costs are typically associated with switching an organization’s accounting software. In the market for property management software, we face competitive pressure from Yardi and its Voyager products, AMSI Property Management (owned by Infor Global Solutions, Inc.), Boston Post (acquired by MRI Software LLC), Jenark (owned by CoreLogic), Entrata (a division of Property Solutions), ResMan and MRI Software LLC. In the single family market, our accounting and property management systems primarily compete with Yardi, AppFolio Inc., Intuit Inc., DIY Real Estate Solutions (acquired by Yardi), Buildium, LLC, Rent Manager (owned by London Computer Systems, Inc.), and Property Boss Solutions, LLC.
In the market for vertically-integrated cloud computing for multifamily real estate owners and property managers, our only substantial competition is from Yardi. We also compete with cloud computing service providers such as Amazon.com Inc., Rackspace Hosting Inc., International Business Machines Corp. and many others.
We offer a number of software-enabled value-added services that compete with a disparate and large group of competitors. In the applicant screening market, our principal competitors are LexisNexis (a subsidiary of Reed Elsevier Group plc), CoreLogic, Inc. (formerly First Advantage Corporation, an affiliate of The First American Corporation), Property Solutions, TransUnion Rental Screening Solutions, Inc. (a subsidiary of TransUnion LLC), Resident Check, Inc., Yardi, On-Site.com and many other smaller regional and local screening companies.
In the insurance market, our principal competitors are Assurant, Inc., Bader Company, CoreLogic, Inc., Property Solutions, Yardi and a number of national insurance underwriters (including GEICO Corporation, The Allstate Corporation, State Farm Fire and Casualty Company, Farmers Insurance Exchange, Nationwide Mutual Insurance Company and United Services Automobile Association) that market renter's insurance. There are many smaller screening and insurance providers in the risk mitigation area that we encounter less frequently, but they nevertheless present a competitive presence in the market.
In the customer relationship management (“CRM”) market, we compete with providers of contact center and call tracking services, including LeaseHawk LLC, Yardi, Property Solutions International, Inc., and numerous regional and local contact centers. In addition, we compete with lead tracking solution providers, including LeaseHawk LLC, Lead Tracking Solutions (acquired by Yardi) and Who’s Calling, Inc. In addition, we compete with content syndication providers VaultWare (owned by MRI Software LLC) and rentbits.com, Inc. Finally, we compete with companies providing web portal services, including Apartments24-7.com, Inc., Ellipse Communications, Inc., Property Solutions, G5 Search Marketing, Inc., Spherexx.com and Yardi. Certain Internet listing services also offer websites for their customers, usually as a free value add to their listing service.
In the marketing and web portal services market, we compete with G5 Search Marketing, Inc., Spherexx LLC, ReachLocal, Inc., Property Solutions, On-Site.com, Yodle, Inc., Yardi and many local or regional advertising agencies.
19
In the Internet listing service market, we compete with ForRent (a division of Dominium Enterprises), Apartment Guide (a division of RentPath, Inc.), Rent.com (owned by RentPath, Inc.), RentPath, Inc., Apartments.com (a division of CoStar Group, Inc.), Apartment Finder (a division of Network Communications, Inc.), Move, Inc., Property Solutions, Rent Café (a division of Yardi), Zillow (and Trulia, Inc.) and many other companies in regional areas.
In the Senior Living market, we compete against A Place for Mom, Inc., Care.com, Inc., Caring, Inc., Eldermark, Care Patrol Franchise Systems, LLC, Yardi, Aging with Grace, LLC, SeniorHousingNet.com (owned by Move, Inc.), G5 Search Marketing Inc., SeniorHomes.com (owned by Moseo, Corp.), The Right Click LLC, ALMSA Corporation and many other regionally focused companies.
In the utility billing and energy management market, we compete at a national level with American Utility Management, Inc., Conservice, LLC, Yardi (following its acquisitions of ista North America and Energy Billing Systems, Inc.), Property Solutions, Ocius LLC, NWP Services Corporation and Minol USA, L.P. Many other smaller utility billing companies compete for smaller rental properties or in regional areas.
In the revenue management market, we compete with Property Solutions, The Rainmaker Group, Inc. and Yardi.
In the market for multifamily housing market research, we compete with Reis, Inc., Axiometrics, Inc., Pierce-Eislen, Inc. (owned by Yardi), CoStar Group, Inc. and Portfolio Research, Inc.
In the spend management market, we compete with Yardi, AvidXchange, Inc., Nexus Systems, Inc., Ariba, Inc., Oracle Corporation, Buyers Access LLC, PAS Purchasing Solutions and ESS Technologies LLC.
In the payment processing market, we compete with Chase Paymentech Solutions, LLC (a subsidiary of JPMorgan Chase & Co.), First Data Corporation, Fiserv, Inc., MoneyGram International, Inc., NWP Services Corporation, On-Site.com, Property Solutions, PayLease LLC, RentPayment.com (a subsidiary of Yapstone, Inc.), Yardi, a number of national banking institutions and those that take payments directly from tenants.
In the affordable housing compliance and audit services market, we compete with Zeffert and Associates, Inc., Preferred Compliance Solutions, Inc., Spectrum Enterprises, Inc. and many other smaller local and regional compliance and audit services.
In the vacation rental market, we compete with LiveRez, Inc., HomeAway Software, Inc., and many other smaller local and regional companies.
In addition, many of our existing or potential customers have developed or may develop their own solutions that may be competitive with our solutions. We also may face competition for potential acquisition targets from our competitors who are seeking to expand their offerings.
With respect to all of our competitors, we compete based on a number of factors, including: total cost of ownership, level of integration with property management systems, ease of implementation, product functionality and scope, performance, security, scalability and reliability of service, brand and reputation, sales and marketing capabilities and financial resources. Some of our existing competitors and new market entrants may enjoy substantial competitive advantages, such as greater name recognition, longer operating histories, larger installed customer bases and larger sales and marketing budgets, as well as greater financial, technical and other resources. In addition, any number of our existing competitors or new market entrants could combine or consolidate to become a more formidable competitor with greater resources. As a result of such competitive advantages, our existing and future competitors may be able to:
• | develop superior products or services, gain greater market acceptance and expand their offerings more efficiently or more rapidly; |
• | adapt to new or emerging technologies and changes in customer requirements more quickly; |
• | take advantage of acquisition and other opportunities more readily; |
• | adopt more aggressive pricing policies and devote greater resources to the promotion of their brand and marketing and sales of their products and services; and |
• | devote greater resources to the research and development of their products and services. |
If we are not able to compete effectively, our operating results will be harmed.
We integrate our software-enabled value-added services with competitive property management software for some of our customers. Our application infrastructure, marketed to our customers as the RealPage Cloud, is based on an open architecture that enables third-party applications to access and interface with applications hosted in the RealPage Cloud through our RealPage Exchange platform. Likewise, through this platform our RealPage Cloud services are able to access and interface with other third-party applications, including third-party property management systems. We also provide services to assist in the implementation, training, support and hosting with respect to the integration of some of our competitors’ applications with our solutions. We sometimes rely on the cooperation of our competitors to implement solutions for our customers. However,
20
frequently our reliance on the cooperation of our competitors can result in delays in integration. There is no assurance that our competitors, even if contractually obligated to do so, will continue to cooperate with us or will not prospectively alter their obligations to do so. We also occasionally develop interfaces between our software-enabled value-added services and competitor property management software without their cooperation or consent. There is no assurance that our competitors will not alter their applications in ways that inhibit or prevent integration or assert that their intellectual property rights restrict our ability to integrate our solutions with their applications. Moreover, regardless of merit, such interface-related activity may result in costly litigation.
We face competition to attract consumers to our LeaseStar product websites and mobile applications, which could impair our ability to continue to grow the number of users who use our websites and mobile applications, which would harm our business, results of operations and financial condition.
The success of our LeaseStar product family depends in part on our ability to continue to attract additional consumers to our websites and mobile applications. Our existing and potential competitors include companies that could devote greater technical and other resources than we have available, have a more accelerated time frame for deployment and leverage their existing user bases and proprietary technologies to provide products and services that consumers might view as superior to our offerings. Any of our future or existing competitors may introduce different solutions that attract consumers or provide solutions similar to our own but with better branding or marketing resources. If we are unable to continue to grow the number of consumers who use our website and mobile applications, our business, results of operations and financial condition would be harmed.
We operate in a business environment in which social media integration is playing a significantly increasing role. Social media is a new and rapidly changing industry wherein the rules and regulations related to use and disclosure of personal information is unclear and evolving.
The operation and marketing of multi-tenant real estate developments is likely to become more dependent upon the use of and integration with social media platforms as communities attempt to reach their current and target customers through social applications such as Facebook, Twitter, Instagram, LinkedIn, Pinterest, Tumblr, Google+ and other current and emerging social applications. The use of these applications necessarily involves the disclosure of personal information by individuals participating in social media, and the corresponding utilization of such personal information by our products and services via integration programs and data exchanges. The regulatory framework for social media privacy and security issues is currently in flux and is likely to remain so for the foreseeable future. Practices regarding the collection, use, storage, transmission and security of personal information by companies on social media platforms have recently come under increased public scrutiny as various government agencies and consumer groups have called for new regulation and changes in industry practices. We are also subject to each social media platform’s terms and conditions for use, application development and integration, which may be modified, restricted or otherwise changed, affecting and possibly curtailing our ability to offer products and services.
These factors, many of which are beyond our control, present a high degree of uncertainty for the future of social media integration. As such, there is no assurance that our participation in social media integration will be risk free, as contractual, statutory or other legal restrictions may be created that limit or otherwise impede our participation in or leverage of social media integration.
We may be unable to compete successfully against our existing or future competitors in attracting advertisers, which could harm our business, results of operations and financial condition.
In our LeaseStar product family, we compete to attract advertisers with media sites, including websites dedicated to providing real estate listings and other rental housing related services to real estate professionals and consumers, major Internet portals, general search engines and social media sites as well as other online companies. We also compete for a share of advertisers’ overall marketing budgets with traditional media such as television, magazines, newspapers and home/apartment guide publications, particularly with respect to advertising dollars spent at the local level by real estate professionals to advertise their qualifications and listings. Large companies with significant brand recognition have large numbers of direct sales personnel and substantial proprietary advertising inventory and web traffic, which may provide a competitive advantage. To compete successfully for advertisers against future and existing competitors, we must continue to invest resources in developing our advertising platform and proving the effectiveness and relevance of our advertising products and services. Pressure from competitors seeking to acquire a greater share of our advertisers’ overall marketing budget could adversely affect our pricing and margins, lower our revenue and increase our research and development and marketing expenses. If we are unable to compete successfully against our existing or future competitors, our business, financial condition or results of operations would be harmed.
Variability in our sales and activation cycles could result in fluctuations in our quarterly results of operations and cause our stock price to decline.
The sales and activation cycles for our solutions, from initial contact with a prospective customer to contract execution and activation, vary widely by customer and solution. We do not recognize revenue until the solution is activated. While most
21
of our activations follow a set of standard procedures, a customer’s priorities may delay activation and our ability to recognize revenue, which could result in fluctuations in our quarterly operating results. Additionally, certain of our products are offered in suites containing multiple solutions, resulting in additional fluctuation in activations depending on each customer’s priorities with respect to solutions included in the suite.
Many of our customers are price sensitive, and if market dynamics require us to change our pricing model or reduce prices, our operating results will be harmed.
Many of our existing and potential customers are price sensitive, and recent adverse global economic conditions, as well as decreased leasing velocity, have contributed to increased price sensitivity in the multifamily housing market and the other markets that we serve. As market dynamics change, or as new and existing competitors introduce more competitive pricing or pricing models, we may be unable to renew our agreements with existing customers or customers of the businesses we acquire or attract new customers at the same price or based on the same pricing model as previously used. As a result, it is possible that we may be required to change our pricing model, offer price incentives or reduce our prices, which could harm our revenue, profitability and operating results.
If we do not effectively expand and train our sales force, we may be unable to add new customers or increase sales to our existing customers and our business will be harmed.
We continue to be substantially dependent on our sales force to obtain new customers and to sell additional solutions to our existing customers. We believe that there is significant competition for sales personnel with the skills and technical knowledge that we require. Our ability to achieve significant revenue growth will depend, in large part, on our success in recruiting, training and retaining sufficient numbers of sales personnel to support our growth. New hires require significant training and, in most cases, take significant time before they achieve full productivity. Our recent hires and planned hires may not become as productive as we expect, and we may be unable to hire or retain sufficient numbers of qualified individuals in the markets where we do business or plan to do business. If we are unable to hire and train sufficient numbers of effective sales personnel, or the sales personnel are not successful in obtaining new customers or increasing sales to our existing customer base, our business will be harmed.
Material defects or errors in the software we use to deliver our solutions could harm our reputation, result in significant costs to us and impair our ability to sell our solutions.
The software applications underlying our solutions are inherently complex and may contain material defects or errors, particularly when first introduced or when new versions or enhancements are released. We have, from time to time, found defects in the software applications underlying our solutions, and new errors in our existing solutions may be detected in the future. Any errors or defects that cause performance problems or service interruptions could result in:
• | a reduction in new sales or subscription renewal rates; |
• | unexpected sales credits or refunds to our customers, loss of customers and other potential liabilities; |
• | delays in customer payments, increasing our collection reserve and collection cycle; |
• | diversion of development resources and associated costs; |
• | harm to our reputation and brand; and |
• | unanticipated litigation costs. |
Additionally, the costs incurred in correcting defects or errors could be substantial and could adversely affect our operating results.
Failure to effectively manage the development, sale and support of our solutions and data processing efforts outside the United States could harm our business.
Our success depends, in part, on our ability to process high volumes of customer data and enhance existing solutions and develop new solutions rapidly and cost effectively. We currently maintain offices in Hyderabad, India and Manila, Philippines where we employ development and data processing personnel. We believe that performing these activities in Hyderabad and Manila increases the efficiency and decreases the costs of our development and data processing efforts. We also maintain an office in Barcelona, Spain where certain of our vacation rental product development, sales and support operations are based. We believe our access to a multilingual European employee base enhances our ability to serve vacation rental property managers in non-English speaking countries. However, managing and staffing international operations requires management’s attention and financial resources. The level of cost savings achieved by our international operations may not exceed the amount of investment and additional resources required to manage and operate these international operations. Additionally, if we experience difficulties as a result of political, social, economic or environmental instability, change in applicable law, limitations of local infrastructure or problems with our workforce or facilities at our or third parties’ international operations, our business could be harmed due to delays in product release schedules or data processing services.
22
We rely on third-party technologies and services that may be difficult to replace or that could cause errors, failures or disruptions of our service, any of which could harm our business.
We rely on a number of third-party providers in connection with the delivery of our solutions. Such providers include, but are not limited to, computer hardware and software vendors, database and data providers, and cloud hosting providers. We currently utilize equipment, software and services from Akami, Inc.; Avaya, Inc.; Brocade Communications Systems, Inc.; Cisco Systems, Inc.; Dell Inc.; EMC Corporation; Microsoft Corporation; Oracle Corporation; salesforce.com, Inc.; Amazon Web Services, a division of Amazon.com, Inc., as well as many other smaller providers. Our OneSite Accounting service relies on a software-as-a-service, or SaaS, accounting system developed and maintained by a third-party service provider. We host this application in our data centers and provide supplemental development resources to extend this accounting system to meet the unique requirements of the rental housing industry. Our shared cloud portfolio reporting service utilizes software licensed from IBM. We expect to utilize additional service providers as we expand our platform. Although the third-party technologies and services that we currently require are commercially available, such technologies and services may not continue to be available on commercially reasonable terms, or at all. Any loss of the right to use any of these technologies or services could result in delays in the provisioning of our solutions until alternative technology is either developed by us, or, if available, is identified, obtained and integrated, and such delays could harm our business. It also may be time consuming and costly to enter into new relationships. Additionally, any errors or defects in the third-party technologies we utilize or delays or interruptions in the third-party services we rely on could result in errors, failures or disruptions of our services, which also could harm our business.
We depend upon third-party service providers for important payment processing functions. If these third-party service providers do not fulfill their contractual obligations or choose to discontinue their services, our business and operations could be disrupted and our operating results would be harmed.
We rely on several large payment processing organizations to enable us to provide payment processing services to our customers, including electronic funds transfers, or EFT, check services, bank card authorization, data capture, settlement and merchant accounting services and access to various reporting tools. These organizations include Bank of America Merchant Services, Bank of America, N.A., Paymentech, LLC, Fiserv, Inc., Financial Transmission Network, Inc., Jack Henry & Associates, Inc., JPMorgan Chase Bank, N.A. and Wells Fargo, N.A. We also rely on third-party hardware manufacturers to manufacture the check scanning hardware our customers utilize to process transactions. Some of these organizations and service providers are competitors who also directly or indirectly sell payment processing services to customers in competition with us. With respect to these organizations and service providers, we have significantly less control over the systems and processes than if we were to maintain and operate them ourselves. In some cases, functions necessary to our business are performed on proprietary third-party systems and software to which we have no access. We also generally do not have long-term contracts with these organizations and service providers. Accordingly, the failure of these organizations and service providers to renew their contracts with us or fulfill their contractual obligations and perform satisfactorily could result in significant disruptions to our operations and adversely affect operating results. In addition, businesses that we have acquired, or may acquire in the future, typically rely on other payment processing service providers. We may encounter difficulty converting payment processing services from these service providers to our payment processing platform. If we are required to find an alternative source for performing these functions, we may have to expend significant money, time and other resources to develop or obtain an alternative, and if developing or obtaining an alternative is not accomplished in a timely manner and without significant disruption to our business, we may be unable to fulfill our responsibilities to customers or meet their expectations, with the attendant potential for liability claims, damage to our reputation, loss of ability to attract or maintain customers and reduction of our revenue or profits.
We face a number of risks in our payment processing business that could result in a reduction in our revenues and profits.
In connection with our electronic payment processing services, we process renter payments and subsequently submit these renter payments to our customers after varying clearing times established by RealPage. These payments are settled through our sponsoring clearing banks, and in the case of EFT, our Originating Depository Financial Institutions, or ODFIs. Currently, we rely on Bank of America, N.A., Wells Fargo, N.A. and JPMorgan Chase Bank, N.A. as our sponsoring clearing banks. In the future, we expect to enter into similar sponsoring clearing bank relationships with one or more other national banking institutions. The renter payments that we process for our customers at our sponsoring clearing banks are identified in our consolidated balance sheets as restricted cash and the corresponding liability for these renter payments is identified as customer deposits. Our electronic payment processing business and related maintenance of custodial accounts subjects us to a number of risks, including, but not limited to:
• | liability for customer costs related to disputed or fraudulent transactions if those costs exceed the amount of the customer reserves we have during the clearing period or after renter payments have been settled to our customers; |
• | electronic processing limits on the amount of custodial balances that any single ODFI, or collectively all of our ODFIs, will underwrite; |
23
• | reliance on clearing bank sponsors, card payment processors and other service payment provider partners to process electronic transactions; |
• | failure by us or our bank sponsors to adhere to applicable laws and regulatory requirements or the standards of the electronic payments rules and regulations and other rules and regulations that may impact the provision of electronic payment services; |
• | continually evolving and developing laws and regulations governing payment processing and money transmission, the application or interpretation of which is not clear in some jurisdictions; |
• | incidences of fraud, a security breach or our failure to comply with required external audit standards; and |
• | our inability to increase our fees at times when electronic payment partners or associations increase their transaction processing fees. |
If any of these risks related to our electronic payment processing business were to materialize, our business or financial results could be negatively affected. Although we attempt to structure and adapt our payment processing operations to comply with these complex and evolving laws and regulations, our efforts may not guarantee compliance. In the event that we are found to be in violation of these legal requirements, we may be subject to monetary fines, cease and desist orders, mandatory product changes, or other penalties that could have an adverse effect on our results of operations. Additionally, with respect to the processing of EFTs, we are exposed to financial risk. EFTs between a renter and our customer may be returned for various reasons such as insufficient funds or stop payment orders. These returns are charged back to the customer by us. However, if we or our sponsoring clearing banks are unable to collect such amounts from the customer’s account or if the customer refuses or is unable to reimburse us for the chargeback, we bear the risk of loss for the amount of the transfer. While we have not experienced material losses resulting from chargebacks in the past, there can be no assurance that we will not experience significant losses from chargebacks in the future. Any increase in chargebacks not paid by our customers may adversely affect our financial condition and results of operations.
We entered into a Service Provider Agreement with Wells Fargo Merchant Services, LLC and Wells Fargo Bank, NA (“Wells Fargo”), effective January 1, 2014. Under the Service Provider Agreement, RealPage, Inc. is a registered independent sales organization, or ISO, of Wells Fargo. Wells Fargo will act as a merchant acquiring bank for processing RealPage client credit card and debit card payments (“Card Payments”), and RealPage will serve as an ISO. As an ISO, RealPage will assume the underwriting risk for processing Card Payments on behalf of its clients. If RealPage experiences excessive chargebacks, either RealPage or Wells Fargo has the authority to cease client card processing services, and such events could result in a material adverse effect on our revenues, operating income, and reputation.
Evolution and expansion of our payment processing business may subject us to additional regulatory requirements and other risks, for which failure to comply or adapt could harm our operating results.
The evolution and expansion of our payment processing business may subject us to additional risks and regulatory requirements, including laws covering money transmission and anti-money laundering. These requirements vary throughout the markets in which we operate, and several jurisdictions lack clarity in the application and interpretation of these rules. In order to maintain flexibility in the growth and expansion of our payments operations, we have obtained money transmitter licenses (or its equivalent) in several states and expect to continue the license application process in additional jurisdictions throughout the United States as needed to accommodate new product development. Our efforts to acquire and maintain this licensure could result in significant management time, effort, and cost, and may still not guarantee compliance given the constant state of change in these regulatory frameworks. While we maintain a compliance program focused on applicable laws and regulations throughout the payments industry, there is no guarantee that we will not be subject to fines, criminal and civil lawsuits or other regulatory enforcement actions in one or more jurisdictions, or be required to adjust business practices to accommodate future regulatory requirements.
If our security measures are breached and unauthorized access is obtained to our software platform and infrastructure, or our customers’ or their renters’ or prospects’ data, we may incur significant liabilities, third parties may misappropriate our intellectual property, our solutions may be perceived as not being secure and customers may curtail or stop using our solutions.
Maintaining the security of our software platform and service infrastructure is of paramount importance to us and our customers, and we devote significant resources to this effort. Breaches of the security measures we take to protect our software platform and service infrastructure and our and our customers’ confidential or proprietary information that is stored on and transmitted through those systems could disrupt and compromise the security of our internal systems and on demand applications, impair our ability to provide products and services to our customers and protect the privacy of their data, compromise our confidential or technical business information harming our competitive position, result in theft or misuse of our intellectual property or otherwise adversely affect our business.
24
The solutions we provide involve the collection, storage and transmission of confidential personal and proprietary information regarding our customers and our customers’ current and prospective renters and business partners. Specifically, we collect, store and transmit a variety of customer data such as demographic information and payment histories of our customers’ prospective and current renters and business partners. Additionally, we collect and transmit sensitive financial data such as credit card and bank account information. Treatment of certain types of data, such as personally identifiable information, protected health information and sensitive financial data may be subject to federal or state regulations requiring heightened privacy and security. If our data security or data integrity measures are breached or otherwise fail or prove to be inadequate for any reason, as a result of third-party actions or our employees’ or contractors’ errors or malfeasance or otherwise, and unauthorized persons obtain access to this information, or the data is otherwise compromised, we could incur significant liability to our customers and to their prospective or current renters or business partners, significant costs associated with internal regulatory investigations and litigation, or significant fines and sanctions by payment processing networks or governmental authorities. Any of these events or circumstances could result in damage to our reputation and material harm to our business.
We also rely upon our customers as users of our system to promote security of the system and the data within it, such as administration of customer-side access credentialing and control of customer-side display of data. On occasion, our customers have failed to perform these activities in such a manner as to prevent unauthorized access to data. To date, these breaches have not resulted in claims against us or in material harm to our business, but we cannot be certain that the failure of our customers in future periods to perform these activities will not result in claims against us, which could expose us to potential litigation, damage to our reputation and material harm to our business.
There can be no certainty that the measures we have taken to protect our software platform and service infrastructure, our confidential and proprietary information and the privacy and integrity of our customers’, their current or prospective renters’ and business partners’ data are adequate to prevent or remedy unauthorized access to our system. Because techniques used to obtain unauthorized access to, or to sabotage, systems change frequently and generally are not recognized until launched against a target, we may be unable to anticipate these techniques or to implement adequate preventive measures. Experienced computer programmers seeking to intrude or cause harm, or hackers, may attempt to penetrate our service infrastructure from time to time. Hackers may consist of sophisticated organizations, competitors, governments or individuals who launch targeted attacks to gain unauthorized access to our systems. A hacker who is able to penetrate our service infrastructure could misappropriate proprietary or confidential information or cause interruptions in our services. We might be required to expend significant capital and resources to protect against, or to remedy, problems caused by hackers, and we may not have a timely remedy against a hacker who is able to penetrate our service infrastructure. In addition to purposeful breaches, inadvertent actions or the transmission of computer viruses could expose us to security risks. If an actual or perceived breach of our security occurs or if our customers and potential customers perceive vulnerabilities, the market perception of the effectiveness of our security measures could be harmed, we could lose sales and customers and our business could be materially harmed.
If we are unable to cost-effectively scale or adapt our existing architecture to accommodate increased traffic, technological advances or changing customer requirements, our operating results could be harmed.
As we continue to increase our customer base and the number of products used by our customers to manage units, the number of users accessing our on demand software solutions over the Internet will continue to increase. Increased traffic could result in slow access speeds and response times. Since our customer agreements typically include service availability commitments, slow speeds or our failure to accommodate increased traffic could result in breaches of our customer agreements. In addition, the market for our solutions is characterized by rapid technological advances and changes in customer requirements. In order to accommodate increased traffic and respond to technological advances and evolving customer requirements, we expect that we will be required to make future investments in our network architecture. If we do not implement future upgrades to our network architecture cost-effectively, or if we experience prolonged delays or unforeseen difficulties in connection with upgrading our network architecture, our service quality may suffer and our operating results could be harmed.
Because certain solutions we provide depend on access to customer data, decreased access to this data or the failure to comply with the evolving laws and regulations governing privacy of data, cloud computing and cross-border data transfers, or the failure to address privacy concerns applicable to such data, could harm our business.
Certain of our solutions depend on our continued access to our customers’ data regarding their prospective and current renters, including data compiled by other third-party service providers who collect and store data on behalf of our customers. Federal, state and foreign governments have adopted and continue to adopt new laws and regulations addressing data privacy and the collection, processing, storage, use and disclosure of personal information. Such laws and regulations are subject to differing interpretations and may be inconsistent among jurisdictions. These and other requirements could reduce demand for our solutions or restrict our ability to store and process data or, in some cases, impact our ability to offer our services and solutions in certain locations.
25
In addition to government activity, privacy advocacy and other industry groups have established or may establish new self-regulatory standards that may place additional burdens on us. Our customers may expect us to meet voluntary certification or other standards established by third parties. If we are unable to maintain these certifications or meet these standards, it could adversely affect our ability to provide our solutions to certain customers and could harm our business.
Any restrictions on the use of or decrease in the availability of data from our customers, or other third parties that collect and store such data on behalf of our customers, and the costs of compliance with, and other burdens imposed by, applicable legislative and regulatory initiatives may limit our ability to collect, aggregate or use this data. Any limitations on our ability to collect, aggregate or use such data could reduce demand for certain of our solutions. Additionally, any inability to adequately address privacy concerns, even if unfounded, or comply with applicable privacy laws, regulations and policies, could result in liability to us or damage to our reputation and could inhibit sales and market acceptance of our solutions and harm our business.
The market for on demand software solutions in the rental housing industry continues to develop, and if it does not develop further or develops more slowly than we expect, our business will be harmed.
The market for on demand SaaS software solutions in the rental housing industry delivered via the Internet through a web browser is rapidly growing but still relatively immature compared to the market for traditional on premise software installed on a customer’s local personal computer or server. It is uncertain whether the on demand delivery model will achieve and sustain high levels of demand and market acceptance, making our business and future prospects difficult to evaluate and predict. While our existing customer base has widely accepted this new model, our future success will depend, to a large extent, on the willingness of our potential customers to choose on demand software solutions for business processes that they view as critical. Many of our potential customers have invested substantial effort and financial resources to integrate traditional enterprise software into their businesses and may be reluctant or unwilling to switch to on demand software solutions. Some businesses may be reluctant or unwilling to use on demand software solutions because they have concerns regarding the risks associated with security capabilities, reliability and availability, among other things, of the on demand delivery model. If potential customers do not consider on demand software solutions to be beneficial, then the market for these solutions may not further develop, or it may develop more slowly than we expect, either of which would adversely affect our operating results.
If use of the Internet and mobile technology, particularly with respect to online rental housing products and services, does not continue to increase as rapidly as we anticipate, our business could be harmed.
Our future success is substantially dependent on the continued use of the Internet and mobile technology as effective media of business and communication by our customers and consumers. Internet and mobile technology use may not continue to develop at historical rates, and consumers may not continue to use the Internet or mobile technology as media for information exchange or we may not keep up with the latest technology. Further, these media may not be accepted as viable long-term outlets for rental housing information for a number of reasons, including actual or perceived lack of security of information and possible disruptions of service or connectivity. If consumers begin to access rental housing information through other media and we fail to innovate, our business may be negatively impacted.
Economic trends that affect the rental housing market may have a negative effect on our business.
Our customers include a range of organizations whose success is intrinsically linked to the rental housing market. Economic trends that negatively or positively affect the rental housing market may adversely affect our business. The downturn in the global economy which began in 2008 has caused volatility in the real estate markets, generally, including the rental housing market, and increases in the rates of mortgage defaults and bankruptcy. Although these trends have reversed, a repeat of these factors would negatively impact our business. Instability or downturns affecting the rental housing market may have a material adverse effect on our business, prospects, financial condition and results of operations by:
• | decreasing demand for leasing and marketing solutions; |
• | reducing the number of occupied sites and units on which we earn revenue; |
• | preventing our customers from expanding their businesses and managing new properties; |
• | causing our customers to reduce spending on our solutions; |
• | subjecting us to increased pricing pressure in order to add new customers and retain existing customers; |
• | causing our customers to switch to lower-priced solutions provided by our competitors or internally developed solutions; |
• | delaying or preventing our collection of outstanding accounts receivable; and |
• | causing payment processing losses related to an increase in customer insolvency. |
26
In addition, economic trends that reduce the frequency of renter turnover or the quantity of new renters may reduce the number of rental transactions completed by our customers and may, as a result, reduce demand for our rental, leasing or marketing transaction specific services.
If customers and other advertisers reduce or end their advertising spending on our LeaseStar products and we are unable to attract new advertisers, our business would be harmed.
Some components of our LeaseStar product family depend on advertising generated through sales to real estate agents and brokerages, property owners and other advertisers relevant to rental housing. Our ability to attract and retain advertisers, and ultimately to generate advertising revenue, depends on a number of factors, including:
• | increasing the number of consumers of our LeaseStar products and services; |
• | competing effectively for advertising dollars with other online media companies; |
• | continuing to develop our advertising products and services; |
• | keeping pace with changes in technology and with our competitors; and |
• | offering an attractive return on investment to our advertiser customers for their advertising spending with us. |
Reductions in lead generation could have a negative effect on our operating results.
We could face reductions in leads generated for our clients if third-party originators of such leads were to elect to suspend sending leads to us or our sources for such leads were reduced. Reductions in leads generated could reduce the value of our lead generation services, make it difficult for us to add new lead generation services customers, retain existing lead generation services customers and maintain or increase sales levels to our existing lead generation services customers and could adversely affect our operating results.
We may require additional capital to support business growth, and this capital might not be available.
We intend to continue to make investments to support our business growth and may require additional funds to respond to business challenges or opportunities, including the need to develop new solutions or enhance our existing solutions, enhance our operating infrastructure or acquire businesses and technologies. Accordingly, we may need to engage in equity or debt financings to secure additional funds. If we raise additional funds through further issuances of equity or convertible debt securities, our existing stockholders could suffer significant dilution, and any new equity securities we issue could have rights, preferences and privileges superior to those of holders of our common stock. Debt financing secured by us in the future could involve additional restrictive covenants relating to our capital raising activities and other financial and operational matters, which may make it more difficult for us to obtain additional capital and to pursue business opportunities, including potential acquisitions. In addition, we may not be able to obtain additional financing on terms favorable to us, if at all. If we are unable to obtain adequate financing or financing on terms satisfactory to us when we require it, our ability to continue to support our business growth and to respond to business challenges or opportunities could be significantly limited.
Our debt obligations contain restrictions that impact our business and expose us to risks that could adversely affect our liquidity and financial condition.
On September 30, 2014, we entered into a new agreement for a secured revolving credit facility to refinance our outstanding revolving loans. The new credit facility provides an aggregate principal amount of up to $200.0 million, with sublimits of $10.0 million for the issuance of letters of credit and for $20.0 million of swingline loans. The credit facility also allows us, under certain conditions, to request additional term loans or revolving commitments in an aggregate principal amount of up to $150.0 million, plus an amount that would not cause our consolidated net leverage ratio to exceed 3.25 to 1.00. As of December 31, 2014, we had $20.0 million of debt outstanding under our revolving line of credit and $10.0 million was available for the issuance of letters of credit. Advances under the credit facility may be voluntarily prepaid and re-borrowed. All outstanding principal and accrued and unpaid interest is due upon the credit facility's maturity, September 30, 2019.
All of our obligations under the credit facility are secured by substantially all of our assets. All of our existing and future domestic subsidiaries are required to guaranty our obligations under the credit facility, other than certain immaterial subsidiaries, foreign subsidiary holding companies and our payment processing subsidiaries. Such guarantees by existing and future domestic subsidiaries are and will be secured by substantially all of the assets of such subsidiaries.
Our credit facility contains customary covenants, subject in each case to customary exceptions and qualifications, which limit our and certain of our subsidiaries’ ability to, among other things:
• | incur additional indebtedness or guarantee indebtedness of others; |
• | create liens on our assets; |
• | enter into mergers or consolidations; |
• | dispose of assets; |
27
• | prepay certain indebtedness; |
• | make changes to our governing documents and certain of our agreements; |
• | pay dividends and make other distributions on our capital stock, and redeem and repurchase our capital stock; |
• | make investments, including acquisitions; and |
• | enter into transactions with affiliates. |
Our credit facility also contains, subject in each case to customary exceptions and qualifications, customary affirmative covenants. We are also required to comply with a maximum consolidated net leverage ratio and a minimum consolidated interest coverage ratio. The interest coverage ratio, which is a ratio of our four previous consecutive fiscal quarters' consolidated EBITDA to our interest expense, is to be not less than 3.00 to 1.00 as of the last day of any fiscal quarter. The consolidated net leverage ratio, which is the ratio of funded indebtedness on the last day of each fiscal quarter to the four previous consecutive fiscal quarters' consolidated EBITDA, cannot exceed 3.50 to 1.00, provided that we can elect to increase the ratio to 3.75 to 1.00 for a specified period following a permitted acquisition. As of December 31, 2014, we were in compliance with the covenants under our credit facility.
The credit facility contains customary events of default, subject to customary cure periods for certain defaults, that include, among others, non-payment defaults, covenant defaults, material judgment defaults, bankruptcy and insolvency defaults, cross-defaults to certain other material indebtedness, ERISA defaults, inaccuracy of representations and warranties and a change in control default.
If we experience a decline in cash flow due to any of the factors described in this “Risk Factors” section or otherwise, we could have difficulty paying interest and principal amounts due on our indebtedness and meeting the financial covenants set forth in our credit facility. If we are unable to generate sufficient cash flow or otherwise obtain the funds necessary to make required payments under our credit facility, or if we fail to comply with the requirements of our indebtedness, we could default under our credit facility. Any default that is not cured or waived could result in the termination of the revolving commitments, the acceleration of the obligations under the credit facility, an increase in the applicable interest rate under the credit facility and a requirement that our subsidiaries that have guaranteed the credit facility pay the obligations in full, and would permit our lender to exercise remedies with respect to all of the collateral that is securing the credit facility, including substantially all of our and our subsidiary guarantors’ assets. Any such default could have a material adverse effect on our liquidity and financial condition.
Even if we comply with all of the applicable covenants, the restrictions on the conduct of our business could adversely affect our business by, among other things, limiting our ability to take advantage of financings, mergers, acquisitions and other corporate opportunities that may be beneficial to the business. Even if the credit facility was terminated, additional debt we could incur in the future may subject us to similar or additional covenants.
Assertions by a third party that we infringe its intellectual property, whether successful or not, could subject us to costly and time-consuming litigation or expensive licenses.
The software and technology industries are characterized by the existence of a large number of patents, copyrights, trademarks and trade secrets and by frequent litigation based on allegations of infringement, misappropriation, misuse and other violations of intellectual property rights. We have received in the past, and may receive in the future, communications from third parties claiming that we have infringed or otherwise misappropriated the intellectual property rights or terms of use of others. Our technologies may not be able to withstand any third-party claims against their use. Since we currently have no patents, we may not use patent infringement as a defensive strategy in such litigation. Additionally, although we have licensed from other parties proprietary technology covered by patents, we cannot be certain that any such patents will not be challenged, invalidated or circumvented. If such patents are invalidated or circumvented, this may allow existing and potential competitors to develop products and services that are competitive with, or superior to, our solutions.
Many of our customer agreements require us to indemnify our customers for certain third-party claims, such as intellectual property infringement claims, which could increase our costs of defending such claims and may require that we pay damages if there were an adverse ruling or settlement related to any such claims. These types of claims could harm our relationships with our customers, may deter future customers from purchasing our solutions or could expose us to litigation for these claims. Even if we are not a party to any litigation between a customer and a third party, an adverse outcome in any such litigation could make it more difficult for us to defend our intellectual property in any subsequent litigation in which we are a named party.
Litigation could force us to stop selling, incorporating or using our solutions that include the challenged intellectual property or redesign those solutions that use the technology. In addition, we may have to pay damages if we are found to be in violation of a third party’s rights. We may have to procure a license for the technology, which may not be available on reasonable terms, if at all, may significantly increase our operating expenses or may require us to restrict our business activities in one or more respects. As a result, we may also be required to develop alternative non-infringing technology, which could
28
require significant effort and expense. There is no assurance that we would be able to develop alternative solutions or, if alternative solutions were developed, that they would perform as required or be accepted in the relevant markets. In some instances, if we are unable to offer non-infringing technology, or obtain a license for such technology, we may be required to refund some or the entire license fee paid for the infringing technology by our customers.
Our exposure to risks associated with the use of intellectual property may be increased as a result of acquisitions, as we have a lower level of visibility into the development process with respect to acquired technology or the care taken to safeguard against infringement risks. Such risks include, without limitation, patent infringement risks, copyright infringement risks or the inclusion of open source software subject to onerous license provisions or violations of terms of use that could even require the disclosure of our proprietary source code. Third parties may make infringement and similar or related claims after we have acquired technology that had not been asserted prior to our acquisition.
Any failure to protect and successfully enforce our intellectual property rights could compromise our proprietary technology and impair our brands.
Our success depends significantly on our ability to protect our proprietary rights to the technologies we use in our solutions. If we are unable to protect our proprietary rights adequately, our competitors could use the intellectual property we have developed to enhance their own products and services, which could harm our business. We rely on a combination of copyright, service mark, trademark and trade secret laws, as well as confidentiality procedures and contractual restrictions, to establish and protect our proprietary rights, all of which provide only limited protection. We currently have no issued patents or pending patent applications and may be unable to obtain patent protection in the future. In addition, if any patents are issued in the future, they may not provide us with any competitive advantages, may not be issued in a manner that gives us the protection that we seek and may be successfully challenged by third parties. Unauthorized parties may attempt to copy or otherwise obtain and use the technologies underlying our solutions. Monitoring unauthorized use of our technologies is difficult, and we do not know whether the steps we have taken will prevent unauthorized use of our technology. If we are unable to protect our proprietary rights, we may find ourselves at a competitive disadvantage to others who have not incurred the substantial expense, time and effort required to create similar innovative products.
We cannot assure you that any future service mark or trademark registrations will be issued for pending or future applications or that any registered service marks or trademarks will be enforceable or provide adequate protection of our proprietary rights. If we are unable to secure new marks, maintain already existing marks and enforce the rights to use such marks against unauthorized third-party use, our ability to brand, identify and promote our solutions in the marketplace could be impaired, which could harm our business.
We customarily enter into agreements with our employees, contractors and certain parties with whom we do business to limit access to and disclosure of our proprietary information. The legal and technical steps we have taken, however, may not prevent unauthorized use or the reverse engineering of our technology. Moreover, we may be required to release the source code of our software to third parties under certain circumstances. For example, some of our customer agreements provide that if we cease to maintain or support a certain solution without replacing it with a successor solution, then we may be required to release the source code of the software underlying such solution. In addition, others may independently develop technologies that are competitive to ours or infringe our intellectual property. Moreover, it may be difficult or practically impossible to detect copyright infringement or theft of our software code. Enforcement of our intellectual property rights also depends on our legal actions being successful against these infringers, but these actions may not be successful, even when our rights have been infringed. Furthermore, the legal standards relating to the validity, enforceability and scope of protection of intellectual property rights in Internet-related industries are uncertain and still evolving.
Additionally, as we sell our solutions internationally, effective patent, trademark, service mark, copyright and trade secret protection may not be available or as robust in every country in which our solutions are available. As a result, we may not be able to effectively prevent competitors outside the United States from infringing or otherwise misappropriating our intellectual property rights, which could reduce our competitive advantage and ability to compete or otherwise harm our business.
We may be unable to halt the operations of websites that aggregate or misappropriate data from our LeaseStar websites.
From time to time, third parties have misappropriated data from our LeaseStar websites through website scraping, software robots or other means and aggregated this data on their websites with data from other companies. In addition, copycat websites have misappropriated data on our network and attempted to imitate our brand or the functionality of our website. When we have become aware of such websites, we have employed technological or legal measures in an attempt to halt their operations. However, we may be unable to detect all such websites in a timely manner and, even if we could, technological and legal measures may be insufficient to halt their operations. In some cases, particularly in the case of websites operating outside of the United States, our available remedies may not be adequate to protect us against the impact of the operation of such websites. Regardless of whether we can successfully enforce our rights against the operators of these websites, any measures that we may take could require us to expend significant financial or other resources, which could harm our business, results of
29
operations or financial condition. In addition, to the extent that such activity creates confusion among consumers or advertisers, our brand and business could be harmed.
Legal proceedings against us could be costly and time consuming to defend.
We are from time to time subject to legal proceedings and claims that arise in the ordinary course of business, including claims brought by our customers or vendors in connection with commercial disputes, claims brought by our customers’ current or prospective renters, including class action lawsuits based on asserted statutory or regulatory violations, employment-based claims made by our current or former employees, administrative agencies, government regulators, or insurers. In November 2014, the Company was named in a purported class action lawsuit in the Eastern District of Virginia, Jenkins v. RealPage, Inc., Case No. 3:14cv758. On January 12, 2015, the Company filed its answer. This case is at an early stage and although we intend to defend it vigorously, it is not possible to predict its outcome. Litigation, enforcement actions and other legal proceedings, regardless of their outcome, may result in substantial costs and may divert management’s attention and our resources, which may harm our business, overall financial condition and operating results. In addition, legal claims that have not yet been asserted against us may be asserted in the future. Although we maintain insurance, there is no guarantee that such insurance will be available or sufficient to cover any such legal proceedings or claims. For example, insurance may not cover such legal proceedings or claims or may withhold or dispute coverage of such legal proceedings or claims on various grounds, including by alleging such coverage is beyond the scope of such policies, that we are not in compliance with the terms of such insurance policies or that such policies are not in effect, even after proceeds under such insurance policies have been received by us. In addition, insurance may not be sufficient for one or more such legal proceedings or claims and may not continue to be available on terms acceptable to us, or at all. A legal proceeding or claim brought against us that is uninsured or under-insured could result in unanticipated costs, thereby harming our operating results.
We could be sued for contract, warranty or product liability claims, and such lawsuits may disrupt our business, divert management’s attention and our financial resources or have an adverse effect on our financial results.
We provide warranties to customers of certain of our solutions and services relating primarily to product functionality, network uptime, critical infrastructure availability and hardware replacement. General errors, defects, inaccuracies or other performance problems in the software applications underlying our solutions or inaccuracies in or loss of the data we provide to our customers could result in financial or other damages to our customers. Additionally, errors associated with any delivery of our services, including utility billing, could result in financial or other damages to our customers. There can be no assurance that any limitations of liability set forth in our contracts would be enforceable or would otherwise protect us from liability for damages. We maintain general liability insurance coverage, including coverage for errors and omissions, in amounts and under terms that we believe are appropriate. There can be no assurance that this coverage will continue to be available on terms acceptable to us, or at all, or in sufficient amounts to cover one or more large product liability claims, or that the insurer will not deny coverage for any future claim or dispute coverage of such legal proceedings or claims even after proceeds under such insurance policies have been received by us. The successful assertion of one or more large product liability claims against us that exceeds available insurance coverage, could have a material adverse effect on our business, prospects, financial condition and results of operations.
If we fail to develop our brands cost-effectively, our financial condition and operating results could be harmed.
We market our solutions under discrete brand names. We believe that developing and maintaining awareness of our brands is critical to achieving widespread acceptance of our existing and future solutions and is an important element in attracting new customers and retaining our existing customers. Additionally, we believe that developing these brands in a cost-effective manner is critical in meeting our expected margins. In the past, our efforts to build our brands have involved significant expenses and we intend to continue to make expenditures on brand promotion. Brand promotion activities may not yield increased revenue, and even if they do, any increased revenue may not offset the expenses we incurred in building our brands. If we fail to cost-effectively build and maintain our brands, we may fail to attract new customers or retain our existing customers, and our financial condition and results of operations could be harmed.
If we fail to maintain proper and effective internal controls, our ability to produce accurate and timely financial statements could be impaired, which could harm our operating results, our ability to operate our business and investors’ views of us.
Ensuring that we have adequate internal financial and accounting controls and procedures in place so that we can produce accurate financial statements on a timely basis is a costly and time-consuming effort that needs to be re-evaluated frequently. Our internal control over financial reporting is a process designed to provide reasonable assurance regarding the reliability of financial reporting and the preparation of financial statements in accordance with United States generally accepted accounting principles. We are required to comply with Section 404 of the Sarbanes-Oxley Act of 2002, or the Sarbanes-Oxley Act, which requires annual management assessment of the effectiveness of our internal control over financial reporting and a report by our independent auditors. If we fail to maintain proper and effective internal controls, our ability to produce accurate and timely financial statements could be impaired, which could harm our operating results, harm our ability to operate our business and reduce the trading price of our stock.
30
Changes in, or errors in our interpretations and applications of, financial accounting standards or practices may cause adverse, unexpected financial reporting fluctuations and affect our reported results of operations.
A change in accounting standards or practices can have a significant effect on our reported results and may even affect our reporting of transactions completed before the change is effective. New accounting pronouncements and varying interpretations of accounting pronouncements have occurred and may occur in the future. Changes to existing rules or the questioning of current practices or errors in our interpretations and applications of financial accounting standards or practices may adversely affect our reported financial results or the way in which we conduct our business.
We have incurred, and will incur, increased costs and demands upon management as a result of complying with the laws and regulations affecting public companies, which could harm our operating results.
As a public company, we have incurred, and will incur, significant legal, accounting, investor relations and other expenses that we did not incur as a private company, including costs associated with public company reporting requirements. We also have incurred and will incur costs associated with current corporate governance requirements, including requirements under Section 404 and other provisions of the Sarbanes-Oxley Act, as well as rules implemented by the Securities Exchange Commission and The NASDAQ Stock Market LLC. We expect these rules and regulations to continue to affect our legal and financial compliance costs and to make some activities more time-consuming and costly. As a public company, it is more expensive for us to obtain director and officer liability insurance and it may be more difficult for us to attract and retain qualified individuals to serve on our board of directors or as our executive officers.
The rental housing industry, electronic commerce and many of the products and services that we offer, including background screening services, utility billing, affordable housing compliance and audit services, insurance and payments, are subject to extensive and evolving governmental regulation. Changes in regulations or our failure to comply with regulations could harm our operating results.
The rental housing industry is subject to extensive and complex federal, state and local laws and regulations. Our services and solutions must work within the extensive and evolving legal and regulatory requirements applicable to our customers and third-party service providers, including, but not limited to, those under the Fair Credit Reporting Act, the Fair Housing Act, the Deceptive Trade Practices Act, the Drivers Privacy Protection Act, the Gramm-Leach-Bliley Act, the Fair and Accurate Credit Transactions Act, the United States Tax Reform Act of 1986 (TRA86), which is an IRS law governing tax credits, the Privacy Rules, Safeguards Rule and Consumer Report Information Disposal Rule promulgated by the Federal Trade Commission, or FTC, the FTC's Telemarketing Sales Rule, the Telephone Consumer Protection Act (TCPA), the CAN-SPAM Act, the Electronic Communications Privacy Act, the regulations of the United States Department of Housing and Urban Development, or HUD, HIPAA/HITECH, rules and regulations of the Consumer Financial Protection Bureau (CFPB) and complex and divergent state and local laws and regulations related to data privacy and security, credit and consumer reporting, deceptive trade practices, discrimination in housing, telemarketing, electronic communications, call recording, utility billing and energy and gas consumption. These regulations are complex, change frequently and may become more stringent over time. Although we attempt to structure and adapt our solutions and service offerings to comply with these complex and evolving laws and regulations, we may be found to be in violation. If we are found to be in violation of any applicable laws or regulations, we could be subject to administrative and other enforcement actions as well as class action lawsuits or demands for client reimbursement. Additionally, many applicable laws and regulations provide for penalties or assessments on a per occurrence basis. Due to the nature of our business, the type of services we provide and the large number of transactions processed by our solutions, our potential liability in an enforcement action or class action lawsuit could be significant. In addition, entities such as HUD, the FTC and the CFPB have the authority to promulgate rules and regulations that may impact our customers and our business. We believe increased regulation is likely in the area of data privacy and laws and regulations applying to the solicitation, collection, processing or use of personally identifiable information or consumer information could affect our customers’ ability to use and share data, potentially reducing demand for our on demand software solutions.
Some of our LeaseStar products operate under the real estate brokerage laws of numerous states and require maintaining licenses in many of these states. Brokerage laws in these states could change, affecting our ability to provide some LeaseStar, or if applicable, other products in these states.
We deliver our on demand software solutions over the Internet and sell and market certain of our solutions over the Internet. As Internet commerce continues to evolve, increasing regulation by federal, state or foreign agencies becomes more likely. Taxation of products or services provided over the Internet or other charges imposed by government agencies or by private organizations for accessing the Internet may also be imposed. Any regulation imposing greater fees for Internet use or restricting information exchange over the Internet could result in a decline in the use of the Internet and the viability of on demand software solutions, which could harm our business and operating results.
Our business is subject to the risks of international operations.
Compliance with complex foreign and U.S. laws and regulations that apply to our international operations increases our cost of doing business. These numerous and sometimes conflicting laws and regulations include internal control and disclosure
31
rules, data privacy and filtering requirements, anti-corruption laws, such as the Foreign Corrupt Practices Act, and other local laws prohibiting corrupt payments to governmental officials, and antitrust and competition regulations, among others.
Violations of these laws and regulations could result in fines and penalties, criminal sanctions against us, our officers, or our employees, prohibitions on the conduct of our business and on our ability to carry on operations in one or more countries, and could also materially affect our brand, our international expansion efforts, our ability to attract and retain employees, our business and our operating results. Although we have implemented policies and procedures designed to ensure compliance with these laws and regulations, there can be no assurance that our employees, contractors or agents will not violate our policies.
In addition, we are subject to a variety of risks inherent in doing business internationally, including:
• | political, social, economic or environmental instability, terrorist attacks and security concerns in general; |
• | limitations of local infrastructure; |
• | fluctuations in currency exchange rates; |
• | higher levels of credit risk and payment fraud; |
• | reduced protection for intellectual property rights in some countries; |
• | difficulties in staffing and managing global operations and the increased travel, infrastructure and legal compliance costs associated with multiple international locations; |
• | compliance with statutory equity requirements and management of tax consequences; and |
• | outbreaks of highly contagious diseases. |
If we are unable to manage the complexity of our international operations successfully, our financial results could be adversely affected.
Our LeasingDesk insurance business is subject to governmental regulation which could reduce our profitability or limit our growth.
Through our wholly owned subsidiary, Multifamily Internet Ventures LLC, we hold insurance agent licenses from a number of individual state departments of insurance and are subject to state governmental regulation and supervision in connection with the operation of our LeasingDesk insurance business. Furthermore, state insurance departments conduct periodic examinations, audits and investigations of the affairs of insurance agents. This state governmental supervision could reduce our profitability or limit the growth of our LeasingDesk insurance business by increasing the costs of regulatory compliance, limiting or restricting the solutions we provide or the methods by which we provide them or subjecting us to the possibility of regulatory actions or proceedings. Our continued ability to maintain these insurance agent licenses in the jurisdictions in which we are licensed depends on our compliance with the rules and regulations promulgated from time to time by the regulatory authorities in each of these jurisdictions.
In all jurisdictions, the applicable laws and regulations are subject to amendment or interpretation by regulatory authorities. Generally, such authorities are vested with relatively broad discretion to grant, renew and revoke licenses and approvals and to implement regulations, as well as regulate rates that may be charged for premiums on policies. Accordingly, we may be precluded or temporarily suspended from carrying on some or all of the activities of our LeasingDesk insurance business or fined or penalized in a given jurisdiction. No assurances can be given that our LeasingDesk insurance business can continue to be conducted in any given jurisdiction as it has been conducted in the past.
We generate commission revenue from the insurance policies we sell as a registered insurance agent and if insurance premiums decline or if the insureds experience greater than expected losses, our revenues could decline and our operating results could be harmed.
Through our wholly owned subsidiary, Multifamily Internet Ventures LLC, a managing general insurance agency, we generate commission revenue from offering liability and renter’s insurance. Through Multifamily Internet Ventures LLC we also sell additional insurance products, including auto and other personal lines insurance, to renters that buy renter's insurance from us. These policies are ultimately underwritten by various insurance carriers. Some of the property owners and managers that participate in our programs opt to require renters to purchase rental insurance policies and agree to grant to Multifamily Internet Ventures LLC exclusive marketing rights at their properties. If demand for residential rental housing declines, property owners and managers may be forced to reduce their rental rates and to stop requiring the purchase of rental insurance in order to reduce the overall cost of renting. If property owners or managers cease to require renter's insurance, elect to offer policies from competing providers or insurance premiums decline, our revenues from selling insurance policies will be adversely affected.
Additionally, one type of commission paid by insurance carriers to Multifamily Internet Ventures LLC is contingent commission, which is affected by claims experienced at the properties for which the renters purchase insurance. In the event that the severity or frequency of claims by the insureds increase unexpectedly, the contingent commission we typically earn
32
will be adversely affected. As a result, our quarterly, or annual, operating results could fall below the expectations of analysts or investors, in which event our stock price may decline.
Multifamily Internet Ventures LLC is required to maintain a 50-state general agency insurance license as well as individual insurance licenses for each sales agent involved in the solicitation of insurance products. Both the agency and individual licenses require compliance with state insurance regulations, payment of licensure fees and continuing education programs. In the event that regulatory compliance requirements are not met, Multifamily Internet Ventures LLC could be subject to license suspension or revocation, state Department of Insurance audits and regulatory fines. As a result, our ability to engage in the business of insurance could be restricted, and our operating revenue will be adversely affected.
Our ability to use net operating losses to offset future taxable income may be subject to certain limitations.
In general, under Section 382 of the Internal Revenue Code of 1986, as amended, or the Internal Revenue Code, a corporation that undergoes an “ownership change” is subject to limitations on its ability to utilize its pre-change net operating losses, or NOLs, to offset future taxable income. Our ability to utilize NOLs of companies that we may acquire in the future may be subject to limitations. Future changes in our stock ownership, some of which are outside of our control, could result in an ownership change under Section 382 of the Internal Revenue Code. For these reasons, we may not be able to utilize a material portion of the NOLs reflected on our balance sheet, even if we maintain profitability.
If we are required to collect sales and use taxes on the solutions we sell in additional taxing jurisdictions, we may be subject to liability for past sales and our future sales may decrease.
States and some local taxing jurisdictions have differing rules and regulations governing sales and use taxes, and these rules and regulations are subject to varying interpretations that may change over time. We review these rules and regulations periodically and currently collect and remit sales taxes in taxing jurisdictions where we believe we are required to do so. However, additional state and/or local taxing jurisdictions may seek to impose sales or other tax collection obligations on us, including for past sales. A successful assertion that we should be collecting additional sales or other taxes on our solutions could result in substantial tax liabilities for past sales, discourage customers from purchasing our solutions or may otherwise harm our business and operating results. This risk is greater with regard to solutions acquired through acquisitions.
We may also become subject to tax audits or similar procedures in jurisdictions where we already collect and remit sales taxes. A successful assertion that we have not collected and remitted taxes at the appropriate levels may also result in substantial tax liabilities for past sales. Liability for past taxes may also include very substantial interest and penalty charges. Our customer contracts provide that our customers must pay all applicable sales and similar taxes. Nevertheless, customers may be reluctant to pay back taxes and may refuse responsibility for interest or penalties associated with those taxes. If we are required to collect and pay back taxes and the associated interest and penalties, and if our customers fail or refuse to reimburse us for all or a portion of these amounts, we will incur unplanned expenses that may be substantial. Moreover, imposition of such taxes on our solutions going forward will effectively increase the cost of such solutions to our customers and may adversely affect our ability to continue to sell those solutions to existing customers or to gain new customers in the areas in which such taxes are imposed.
Changes in our effective tax rate could harm our future operating results.
We are subject to federal and state income taxes in the United States and various foreign jurisdictions, and our domestic and international tax liabilities are subject to the allocation of expenses in differing jurisdictions. Our tax rate is affected by changes in the mix of earnings and losses in jurisdictions with differing statutory tax rates, including jurisdictions in which we have completed or may complete acquisitions, certain non-deductible expenses arising from the requirement to expense stock options and the valuation of deferred tax assets and liabilities, including our ability to utilize our net operating losses. Increases in our effective tax rate could harm our operating results.
We rely on our management team and need additional personnel to grow our business, and the loss of one or more key employees or our inability to attract and retain qualified personnel could harm our business.
Our success and future growth depend on the skills, working relationships and continued services of our management team. The loss of our Chief Executive Officer or other senior executives could adversely affect our business. Our future success also will depend on our ability to attract, retain and motivate highly skilled software developers, marketing and sales personnel, technical support and product development personnel in the United States and internationally. All of our employees work for us on an at-will basis. Competition for these types of personnel is intense, particularly in the software industry. As a result, we may be unable to attract or retain qualified personnel. Our inability to attract and retain the necessary personnel could adversely affect our business.
Our corporate culture has contributed to our success, and if we cannot maintain this culture as we grow, we could lose the innovation, creativity and teamwork fostered by our culture, and our business may be harmed.
We believe that a strong corporate culture that nurtures core values and philosophies is essential to our long-term success. We call these values and philosophies the “RealPage Promise” and we seek to practice the RealPage Promise in our actions
33
every day. The RealPage Promise embodies our corporate values with respect to customer service, investor communications, employee respect and professional development and management decision-making and leadership. As our organization grows and we are required to implement more complex organizational structures, we may find it increasingly difficult to maintain the beneficial aspects of our corporate culture which could negatively impact our future success.
Risks Related to Ownership of our Common Stock
The concentration of our capital stock owned by insiders may limit your ability to influence corporate matters.
Our executive officers, directors and entities affiliated with them together beneficially owned approximately 34.0% of our common stock as of December 31, 2014. Further, Stephen T. Winn, our President, Chief Executive Officer and Chairman of the Board, and entities beneficially owned by Mr. Winn held an aggregate of approximately 32.7% of our common stock as of December 31, 2014. This significant concentration of ownership may adversely affect the trading price for our common stock because investors often perceive disadvantages in owning stock in companies with controlling stockholders. Mr. Winn and entities beneficially owned by Mr. Winn may control our management and affairs and matters requiring stockholder approval, including the election of directors and the approval of significant corporate transactions, such as mergers, consolidations or the sale of substantially all of our assets. Consequently, this concentration of ownership may have the effect of delaying or preventing a change of control, including a merger, consolidation or other business combination involving us, or discouraging a potential acquirer from making a tender offer or otherwise attempting to obtain control, even if that change of control would benefit our other stockholders.
The trading price of our common stock price may be volatile.
The trading price of our common stock could be subject to wide fluctuations in response to various factors, including, but not limited to, those described in this “Risk Factors” section, some of which are beyond our control. Factors affecting the trading price of our common stock include:
• | variations in our operating results or in expectations regarding our operating results; |
• | variations in operating results of similar companies; |
• | announcements of technological innovations, new solutions or enhancements, strategic alliances or agreements by us or by our competitors; |
• | announcements by competitors regarding their entry into new markets, and new product, service and pricing strategies; |
• | marketing, advertising or other initiatives by us or our competitors; |
• | increases or decreases in our sales of products and services for use in the management of units by customers and increases or decreases in the number of units managed by our customers; |
• | threatened or actual litigation; |
• | major changes in our board of directors or management; |
• | recruitment or departure of key personnel; |
• | changes in the estimates of our operating results or changes in recommendations by any research analysts that elect to follow our common stock; |
• | market conditions in our industry and the economy as a whole; |
• | the overall performance of the equity markets; |
• | sales of our shares of common stock by existing stockholders; |
• | volatility in our stock price, which may lead to higher stock-based compensation expense under applicable accounting standards; and |
• | adoption or modification of regulations, policies, procedures or programs applicable to our business. |
In addition, the stock market in general, and the market for technology and specifically Internet-related companies, has experienced extreme price and volume fluctuations that have often been unrelated or disproportionate to the operating performance of those companies. Broad market and industry factors may harm the market price of our common stock regardless of our actual operating performance. In addition, in the past, following periods of volatility in the overall market and the market price of a particular company’s securities, securities class action litigation has often been instituted against these companies. This litigation, if instituted against us, could result in substantial costs and a diversion of our management’s attention and our resources, whether or not we are successful in such litigation.
Our stock price could decline due to the large number of outstanding shares of our common stock eligible for future sale.
34
Sales of substantial amounts of our common stock in the public market, or the perception that these sales could occur, could cause the market price of our common stock to decline. These sales could also make it more difficult for us to sell equity or equity-related securities in the future at a time and price that we deem appropriate.
As of December 31, 2014, we had 79,037,351 shares of common stock outstanding. Of these shares, 76,892,832 were immediately tradable without restriction or further registration under the Securities Act, unless these shares are held by “affiliates,” as that term is defined in Rule 144 under the Securities Act.
As of December 31, 2014, holders of 25,440,626 shares, or approximately 32.2%, of our outstanding common stock were entitled to rights with respect to the registration of these shares under the Securities Act. If we register their shares of common stock, these stockholders could sell those shares in the public market without being subject to the volume and other restrictions of Rule 144 and Rule 701.
In 2012, we registered a total of 4,694,073 shares of our outstanding common stock held by affiliates pursuant to a registration statement on Form S-3, which shares are now freely tradable in the public market.
In addition, we have registered approximately 22,134,259 shares of common stock that have been issued or reserved for future issuance under our stock incentive plans. Of these shares, 2,455,134 shares were eligible for sale upon the exercise of vested options as of December 31, 2014.
Our charter documents and Delaware law could prevent a takeover that stockholders consider favorable and could also reduce the market price of our stock.
Our amended and restated certificate of incorporation and our amended and restated bylaws contain provisions that could delay or prevent a change in control of our company. These provisions could also make it more difficult for stockholders to elect directors and take other corporate actions. These provisions include:
• | a classified board of directors whose members serve staggered three-year terms; |
• | not providing for cumulative voting in the election of directors; |
• | authorizing our board of directors to issue, without stockholder approval, preferred stock with rights senior to those of our common stock; |
• | prohibiting stockholder action by written consent; and |
• | requiring advance notification of stockholder nominations and proposals. |
These and other provisions of our amended and restated certificate of incorporation and our amended and restated bylaws and under Delaware law could discourage potential takeover attempts, reduce the price that investors might be willing to pay in the future for shares of our common stock and result in the market price of our common stock being lower than it would be without these provisions.
If securities analysts do not continue to publish research or reports about our business or if they publish negative evaluations of our stock, the price of our stock could decline.
We expect that the trading price for our common stock may be affected by research or reports that industry or financial analysts publish about us or our business. If one or more of the analysts who cover us downgrade their evaluations of our stock, the price of our stock could decline. If one or more of these analysts cease coverage of our company, we could lose visibility in the market for our stock, which in turn could cause our stock price to decline.
We do not anticipate paying any cash dividends on our common stock.
We do not anticipate paying any cash dividends on our common stock in the foreseeable future. If we do not pay cash dividends, you would receive a return on your investment in our common stock only if the market price of our common stock has increased when you sell your shares. In addition, the terms of our credit facilities currently restrict our ability to pay dividends. See additional discussion under the Dividend Policy heading of Part II, Item 5 of this Annual Report on Form 10-K.
Item 1B. | Unresolved Staff Comments |
None.
Item 2. | Properties |
As of December 31, 2014, we lease approximately 262,000 square feet of space for our corporate headquarters and data center in Carrollton, Texas under lease agreements that expire in August 2016. We have offices in Fort Smith, Arkansas; Irvine, California; San Francisco, California; Westlake Village, California; Centennial, Colorado; Hollywood, Florida; Alpharetta
35
Georgia; Chicago, Illinois; Tipton, Iowa; Reno, Nevada; New York, New York; Charlotte, North Carolina; Mason, Ohio; Greer, South Carolina; Plano, Texas; Wilston, Vermont; Vienna, Virginia; Seattle, Washington; Hyderabad, India; Manila, Philippines; Barcelona, Spain; and Dubai, UAE. We believe our current and planned data centers and office facilities will be adequate for the foreseeable future.
We also license data center space and collocation services at a facility in Dallas, Texas for our secondary data center pursuant to a master services agreement with DataBank Holdings Ltd., or DataBank. Our agreement with DataBank has automatic renewals for successive one-year terms unless we elect to terminate the agreement by giving notice 30 days' prior to the end of a current term, in which case the agreement terminates at the end of such term. We may also terminate the master services agreement for convenience upon 30 days' notice and payment of specified fees, in certain instances where Databank fails to meet certain warranty commitments or Service Level Agreements, or experiences any Chronic Outage, and either party may terminate the agreement for cause without penalty, where the defaulting party has not cured such default within 30 days after having received written notice of such default. Following termination of the master services agreement for any reason, DataBank is obligated to continue to provide such services related to the termination as we may reasonably request, but only for a period of 15 days. Any unplanned termination of our master services agreement with DataBank or DataBank’s failure to perform its obligations under the agreement would require us to move our secondary data center to another provider and could cause disruptions in the continuous availability of our secondary data center or some of our services, and could constitute or cause a breach under certain of our customer agreements.
Item 3. | Legal Proceedings |
We are subject to legal proceedings and claims arising in the ordinary course of business. We are involved in litigation and other legal proceedings and claims that have not been fully resolved, but we believe that any reasonably possible adverse outcome of these matters would not be material either individually or in the aggregate at this time. Our view of those matters may change in the future as litigation and events related thereto unfold. See the risk factors “Assertions by a third party that we infringe its intellectual property, whether successful or not, could subject us to costly and time-consuming litigation or expensive licenses” and “Current and future legal proceedings against us could be costly and time consuming to defend” in Part I, Item 1A of this Form 10-K under the heading “Risk Factors.”
On January 24, 2011, Yardi Systems, Inc. filed a lawsuit in the U.S. District Court for the Central District of California against RealPage, Inc. and DC Consulting, Inc. (the “Yardi Lawsuit”). We answered and filed counterclaims against Yardi, and on July 1, 2012, the Company and Yardi entered into a settlement agreement (the “Settlement Agreement”) resolving all outstanding litigation between the parties. The Settlement Agreement also includes a license of certain Yardi intellectual property to the Company and a license of certain of our intellectual property to Yardi.
Item 4. | Mine Safety Disclosures |
Not applicable.
PART II
Item 5. | Market for Registrant's Common Equity, Related Stockholder Matters and Issuer Purchases of Equity Securities |
Market Information and Holders
Our common stock is traded on the NASDAQ Global Select Market under the symbol “RP.” The following table sets forth for the periods indicated the high and low sale prices per share of our common stock as reported on the NASDAQ Global Select Market for the periods indicated:
Year Ending December 31, 2013 | Low | High | ||||||
First Quarter | $ | 19.39 | $ | 23.96 | ||||
Second Quarter | $ | 17.06 | $ | 20.45 | ||||
Third Quarter | $ | 18.51 | $ | 23.81 | ||||
Fourth Quarter | $ | 21.22 | $ | 25.89 | ||||
36
Year Ending December 31, 2014 | Low | High | ||||||
First Quarter | $ | 16.03 | $ | 22.48 | ||||
Second Quarter | $ | 17.14 | $ | 22.48 | ||||
Third Quarter | $ | 15.00 | $ | 22.82 | ||||
Fourth Quarter | $ | 15.51 | $ | 22.92 | ||||
On February 13, 2015, the closing price of our common stock on the NASDAQ Global Select Market was $19.30 per share and there were approximately 1,200 holders of record of our common stock. Because many of our shares of common stock are held by brokers and other institutions on behalf of stockholders, this number is not indicative of the total number of stockholders represented by these stockholders of record.
Dividend Policy
We have neither declared nor paid any cash dividends on our common stock in our two most recent fiscal years. We do not expect to pay cash dividends on our common stock for the foreseeable future. Instead, we anticipate that all of our earnings will be used for the operation and growth of the business. Any future determination to declare cash dividends would be subject to the discretion of our board of directors and would depend upon various factors, including our results of operations, financial condition and liquidity requirements, restrictions that may be imposed by applicable law and our contracts and other factors deemed relevant by our board of directors. Additionally, our credit facility contains customary covenants, subject in each case to customary exceptions and qualifications. Included in these covenants is a restriction which prevents us from paying dividends and making other distributions on our capital stock.
Equity Compensation Plan Information
For information regarding securities authorized for issuance under equity compensation plans, see Part III, Item 12 of this Form 10-K.
Performance Graph
The following graph compares the relative performance of our common stock, the NASDAQ Global Market Index, NASDAQ Composite and the NASDAQ Computer and Data Processing Index. This graph covers the annual periods from August 12, 2010 (the first trading date immediately following our initial public offering), through December 31, 2014. In each case, this graph assumes a $100 investment on August 12, 2010 at our closing price of $14.52 per share and reinvestment of all dividends, if any.
.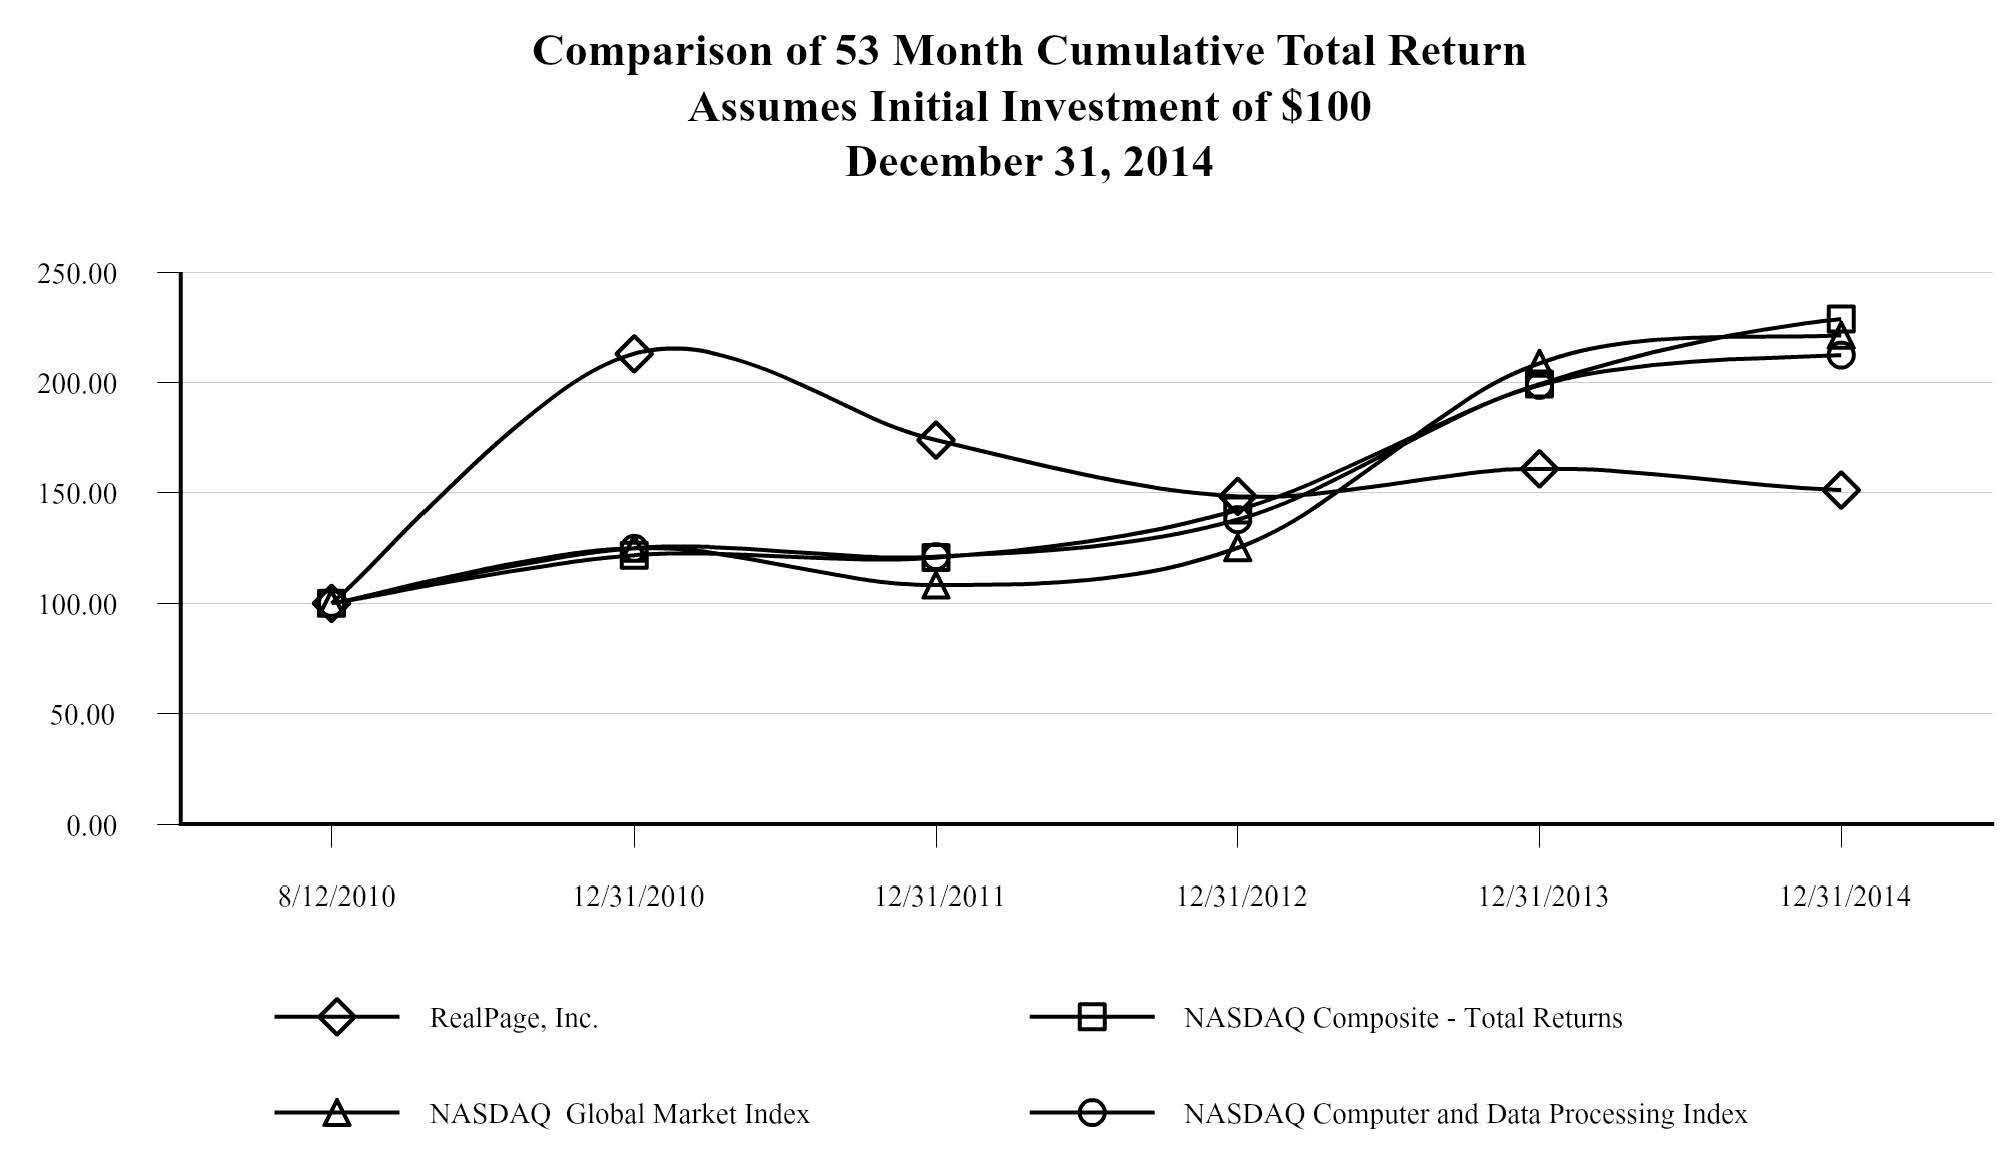
37
August 12, 2010 | December 31, 2010 | December 31, 2011 | December 31, 2012 | December 31, 2013 | December 31, 2014 | ||||||||||||||||||
RealPage, Inc. | $ | 100.00 | $ | 213.02 | $ | 174.04 | $ | 148.55 | $ | 161.02 | $ | 151.24 | |||||||||||
NASDAQ Composite—Total Returns | 100.00 | 121.72 | 120.76 | 142.17 | 199.29 | 228.68 | |||||||||||||||||
NASDAQ Global Market Index | 100.00 | 124.92 | 108.29 | 125.10 | 208.73 | 221.28 | |||||||||||||||||
NASDAQ Computer and Data Processing Index | 100.00 | 124.92 | 121.08 | 137.94 | 198.62 | 212.38 | |||||||||||||||||
Issuer Purchases of Equity Securities
The following table provides information with respect to repurchases of our common stock made during the fourth quarter by RealPage, Inc. or any "affiliated purchaser" of RealPage, Inc. as defined in Rule 10b-18(a)(3) under the Exchange Act:
Period | Total Number of Shares Purchased | Average Price Paid per Share (including fees) | Total Number of Shares Purchased as Part of Publicly Announced Plans or Programs (1) | Approximate Dollar Value of Shares that May Yet Be Purchased Under the Plans or Programs (1) | ||||||||||
October 1, 2014 through October 31, 2014 | — | $ | — | $ | — | $ | 34,454,871 | |||||||
November 1, 2014 through November 30, 2014 | — | — | — | 34,454,871 | ||||||||||
December 1, 2014 through December 31, 2014 | — | — | — | 34,454,871 | ||||||||||
Total | — | $ | — | — | $ | 34,454,871 | ||||||||
(1) | On May 6, 2014, the Board of Directors approved a stock repurchase program authorizing repurchase of up to $50.0 million of our common stock. The stock repurchase program continues for a period of up to one year beginning May 8, 2014. During the periods covered by the table, no determination was made by us to terminate or suspend the stock repurchase program. |
During 2014, we repurchased 966,595 shares at a weighted average cost of $16.06 per share and a total cost of $15.5 million.
38
Item 6. | Selected Financial Data |
We have derived the consolidated statements of operations and balance sheet data for the years ended December 31, 2014, 2013, 2012, 2011 and 2010 from our audited consolidated financial statements. Over the last five fiscal years, we have acquired a number of companies as disclosed in Note 3, "Acquisitions," of the Notes to Consolidated Financial Statements under Item 8 of this Annual Report on Form 10-K. The results of our acquired companies have been included in our consolidated financial statements since their respective dates of acquisition and have contributed to our growth in our results of operations. You should read this information in conjunction with our audited consolidated financial statements, the related notes to these financial statements and the information in Item 7, “Management’s Discussion and Analysis of Financial Condition and Results of Operations,” and included elsewhere in this Annual Report on Form 10-K. Our historical results are not necessarily indicative of our future results.
Year Ended December 31, | ||||||||||||||||||||
2014 | 2013 | 2012 | 2011 | 2010 | ||||||||||||||||
(in thousands, except per share data) | ||||||||||||||||||||
Revenue: | ||||||||||||||||||||
On demand | $ | 390,622 | $ | 362,312 | $ | 306,400 | $ | 239,436 | $ | 169,678 | ||||||||||
On premise | 3,094 | 3,691 | 5,216 | 6,581 | 8,545 | |||||||||||||||
Professional and other | 10,835 | 11,019 | 10,556 | 11,962 | 10,051 | |||||||||||||||
Total revenue | 404,551 | 377,022 | 322,172 | 257,979 | 188,274 | |||||||||||||||
Cost of revenue | 174,871 | 148,321 | 128,562 | 108,155 | 79,044 | |||||||||||||||
Gross profit | 229,680 | 228,701 | 193,610 | 149,824 | 109,230 | |||||||||||||||
Operating expenses: | ||||||||||||||||||||
Product development | 64,418 | 50,638 | 48,177 | 43,441 | 36,922 | |||||||||||||||
Sales and marketing | 111,563 | 95,894 | 76,992 | 63,775 | 37,693 | |||||||||||||||
General and administrative | 69,202 | 60,610 | 56,993 | 40,798 | 28,328 | |||||||||||||||
Total operating expense | 245,183 | 207,142 | 182,162 | 148,014 | 102,943 | |||||||||||||||
Operating (loss) income | (15,503 | ) | 21,559 | 11,448 | 1,810 | 6,287 | ||||||||||||||
Interest expense and other, net | (1,104 | ) | (1,077 | ) | (2,046 | ) | (3,251 | ) | (5,501 | ) | ||||||||||
Net (loss) income before taxes | (16,607 | ) | 20,482 | 9,402 | (1,441 | ) | 786 | |||||||||||||
Income tax (benefit) expense | (6,333 | ) | (210 | ) | 4,219 | (210 | ) | 719 | ||||||||||||
Net (loss) income | $ | (10,274 | ) | $ | 20,692 | $ | 5,183 | $ | (1,231 | ) | $ | 67 | ||||||||
Net (loss) income attributable to common stockholders: | ||||||||||||||||||||
Basic | (10,274 | ) | 20,692 | 5,183 | (1,231 | ) | (2,877 | ) | ||||||||||||
Diluted | (10,274 | ) | 20,692 | 5,183 | (1,231 | ) | (2,877 | ) | ||||||||||||
Net (loss) income per share attributable to common stockholders: | ||||||||||||||||||||
Basic | $ | (0.13 | ) | $ | 0.28 | $ | 0.07 | $ | (0.02 | ) | $ | (0.07 | ) | |||||||
Diluted | $ | (0.13 | ) | $ | 0.27 | $ | 0.07 | $ | (0.02 | ) | $ | (0.07 | ) | |||||||
Weighted average shares used in computing net (loss) income per share attributable to common stockholders: | ||||||||||||||||||||
Basic | 76,991 | 74,962 | 71,838 | 68,480 | 39,737 | |||||||||||||||
Diluted | 76,991 | 76,187 | 74,002 | 68,480 | 39,737 | |||||||||||||||
39
Year Ended December 31, | ||||||||||||||||||||
2014 | 2013 | 2012 | 2011 | 2010 | ||||||||||||||||
(in thousands, except per share data) | ||||||||||||||||||||
Consolidated Balance Sheet Data: | ||||||||||||||||||||
Cash and cash equivalents(1) | $ | 26,936 | $ | 34,502 | $ | 33,804 | $ | 51,273 | $ | 118,010 | ||||||||||
Total current assets | 197,815 | 183,815 | 127,484 | 124,758 | 170,522 | |||||||||||||||
Total assets | 571,490 | 503,213 | 402,197 | 400,065 | 342,792 | |||||||||||||||
Total current liabilities | 196,709 | 173,095 | 124,857 | 114,376 | 93,974 | |||||||||||||||
Total deferred revenue | 80,388 | 71,756 | 70,079 | 66,018 | 55,664 | |||||||||||||||
Current and long-term debt(2) | 20,882 | 1,428 | 10,000 | 50,377 | 66,629 | |||||||||||||||
Total liabilities | 242,710 | 188,709 | 147,126 | 177,184 | 170,208 | |||||||||||||||
Total stockholders’ equity | 328,780 | 314,504 | 255,071 | 222,881 | 172,584 | |||||||||||||||
Other Financial Data: | ||||||||||||||||||||
Adjusted EBITDA(3) | $ | 70,589 | $ | 90,312 | $ | 73,349 | $ | 56,459 | $ | 35,303 | ||||||||||
Operating cash flow | 69,972 | 69,209 | 58,412 | 49,226 | 27,690 | |||||||||||||||
Capital expenditures | 37,062 | 32,952 | 18,774 | 16,147 | 12,178 | |||||||||||||||
Selected Operating Data: | ||||||||||||||||||||
Number of on demand customers at period end | 10,744 | 8,725 | 8,466 | 7,790 | 6,922 | |||||||||||||||
Number of on demand units at period end | 9,560 | 9,022 | 8,113 | 7,302 | 6,066 | |||||||||||||||
Total number of employees at period end | 3,875 | 3,337 | 2,893 | 2,273 | 1,759 | |||||||||||||||
(1) | Excludes restricted cash. |
(2) | Includes capital lease obligations. |
(3) | We define this metric as net (loss) income plus acquisition-related and other deferred revenue adjustments, depreciation and asset impairment, loss on sale of assets, amortization of intangible assets, net interest expense, income tax (benefit) expense; stock-based compensation expense, any impact related to Yardi litigation (including related insurance litigation and settlement costs) and acquisition-related expense. |
We believe that the use of Adjusted EBITDA is useful to investors and other users of our financial statements in evaluating our operating performance because it provides them with an additional tool to compare business performance across companies and across periods. We believe that:
• | Adjusted EBITDA provides investors and other users of our financial information consistency and comparability with our past financial performance, facilitates period-to-period comparisons of operations and facilitates comparisons with our peer companies, many of which use similar non-GAAP financial measures to supplement their GAAP results; |
• | it is useful to exclude certain non-cash charges, such as depreciation and asset impairment, amortization of intangible assets and stock-based compensation and non-core operational charges, such as acquisition-related expenses and any impact related to the Yardi litigation (including related insurance litigation and settlement costs), from Adjusted EBITDA because the amount of such expenses in any specific period may not directly correlate to the underlying performance of our business operations and these expenses can vary significantly between periods as a result of new acquisitions, full amortization of previously acquired tangible and intangible assets or the timing of new stock-based awards, as the case may be; and |
• | it is useful to include deferred revenue written down for GAAP purposes under purchase accounting rules and revenue deferred due to a lack of historical experience in determining the settlement of the contractual obligation in order to appropriately measure the underlying performance of our business operations in the period of activity and associated expense. |
We use Adjusted EBITDA in conjunction with traditional GAAP operating performance measures as part of our overall assessment of our performance, for planning purposes, including the preparation of our annual operating budget, to evaluate the effectiveness of our business strategies and to communicate with our board of directors concerning our financial performance.
40
We do not place undue reliance on Adjusted EBITDA as our only measure of operating performance. Adjusted EBITDA should not be considered as a substitute for other measures of liquidity or financial performance reported in accordance with GAAP. There are limitations to using non-GAAP financial measures, including that other companies may calculate these measures differently than we do, that they do not reflect our capital expenditures or future requirements for capital expenditures and that they do not reflect changes in, or cash requirements for, our working capital. We compensate for the inherent limitations associated with using Adjusted EBITDA measures through disclosure of these limitations, presentation of our financial statements in accordance with GAAP and reconciliation of Adjusted EBITDA to the most directly comparable GAAP measure, net (loss) income.
The following table presents a reconciliation of net (loss) income to Adjusted EBITDA:
Year Ended December 31, | ||||||||||||||||||||
2014 | 2013 | 2012 | 2011 | 2010 | ||||||||||||||||
(in thousands) | ||||||||||||||||||||
Net (loss) income | $ | (10,274 | ) | $ | 20,692 | $ | 5,183 | $ | (1,231 | ) | $ | 67 | ||||||||
Acquisition-related and other deferred revenue | 435 | 2,717 | 89 | 706 | — | |||||||||||||||
Depreciation, loss on disposal and impairment of assets | 19,288 | 14,411 | 13,539 | 11,539 | 10,371 | |||||||||||||||
Amortization of intangible assets | 22,404 | 17,648 | 19,498 | 18,006 | 10,675 | |||||||||||||||
Interest expense, net | 1,117 | 1,427 | 2,160 | 2,868 | 5,510 | |||||||||||||||
Income tax (benefit) expense | (6,333 | ) | (210 | ) | 4,219 | (210 | ) | 719 | ||||||||||||
Litigation-related expense | 4,915 | 661 | 10,158 | 1,298 | — | |||||||||||||||
Stock-based compensation expense | 37,050 | 29,697 | 18,178 | 22,618 | 7,340 | |||||||||||||||
Acquisition-related expense (income) | 1,987 | 3,269 | (350 | ) | 865 | 621 | ||||||||||||||
Stock registration costs | — | — | 675 | — | — | |||||||||||||||
Adjusted EBITDA | $ | 70,589 | $ | 90,312 | $ | 73,349 | $ | 56,459 | $ | 35,303 | ||||||||||
41
Item 7. | Management's Discussion and Analysis of Financial Condition and Results of Operations |
The following discussion and analysis of our financial condition and results of operations should be read together with “Selected Financial Data” and our audited consolidated financial statements and accompanying notes included elsewhere in this filing. This discussion contains forward-looking statements, based on current expectations and related to our plans, estimates, beliefs and anticipated future financial performance. These statements involve risks and uncertainties and our actual results may differ materially from those anticipated in these forward-looking statements as a result of many factors, including those set forth under “Risk Factors,” “Special Note Regarding Forward-Looking Statements” and elsewhere in this filing.
Overview
We are a leading provider of on demand software and software-enabled services for the rental housing and vacation rental industries. Our broad range of property management solutions enables owners and managers of a wide variety of single and multifamily rental property types to enhance the visibility, control and profitability of each portion of the renter life cycle and operation of a property. By integrating and streamlining a wide range of complex processes and interactions among the rental housing and vacation rental ecosystem of owners, managers, prospects, renters and service providers, our platform helps optimize the property management process, improve the user experience, increase revenue and reduce costs for professional property managers.
We derive a substantial majority of our revenue from sales of our on demand software solutions. We also derive revenue from our professional and other services. A small percentage of our revenue is derived from sales of our on premise software solutions to our existing on premise customers. Our on demand software solutions are sold pursuant to subscription license agreements and our on premise software solutions are sold pursuant to term or perpetual license agreements and associated maintenance agreements. Typically, we price our solutions based primarily on the number of units the customer manages with our solutions. For our insurance-based solutions, we earn revenue based on a fixed commission rate of earned premiums and a contingent commission calculated in accordance with the applicable agreement. For our transaction-based solutions, we price based on a fixed rate per transaction. We sell our solutions through our direct sales organization and derive substantially all of our revenue from sales in the United States. Our revenue has increased from $377.0 million in 2013 to $404.6 million in 2014. The increase in revenue has primarily been driven by increased sales of our on demand software solutions, a substantial amount of which has been derived from purchases of additional on demand software solutions by our existing customers. In 2014, our on demand revenue represented 96.6% of our total revenue.
While the adoption of on demand software solutions in the rental housing industry is growing rapidly, it remains at a relatively early stage of development. Additionally, there is a low level of penetration of our on demand software solutions in our existing customer base. We believe these factors present us with significant opportunities to generate revenue through sales of additional on demand software solutions. Our existing and potential customers base their decisions to invest in our solutions on a number of factors, including general economic conditions.
Our company was formed in 1998 to acquire Rent Roll, Inc., which marketed and sold on premise property management systems for the conventional and affordable multifamily rental housing markets. In June 2001, we released OneSite, our first on demand property management system. Since 2002, we have expanded our on demand software and software-enabled services to include property management, leasing and marketing, renter management and asset optimization capabilities. In addition to the multifamily markets, we now serve the single family, senior living, student living, military housing and vacation rental markets. In addition, since July 2002, we have completed 30 acquisitions of complementary technologies to supplement our internal product development and sales and marketing efforts and expand the scope of our solutions, the types of rental housing and vacation rental properties served by our solutions and our customer base. In connection with this expansion and these acquisitions, we have committed greater resources to developing and increasing sales of our platform of on demand solutions. As of December 31, 2014, we had 3,875 employees.
Recent Acquisitions
In January 2014, we acquired certain assets from Bookt LLC, including the InstaManager product (“InstaManager”), for a purchase price of $9.2 million, consisting of a cash payment of $6.0 million at closing, a deferred cash payment of up to $1.0 million payable over two years after the acquisition date, and additional cash payments totaling up to $7.0 million if certain revenue targets are met for the years ended March 31, 2015 and March 31, 2016. InstaManager is a software-as-a-service vacation rental booking system used by professional managers of vacation rental properties. InstaManager offers marketing websites, online pricing and availability, online booking, automated reservations, payment processing and insurance sales.
In March 2014, we acquired certain assets from Virtual Maintenance Manager LLC, including the Virtual Maintenance Manager product (“VMM”), for a purchase price of $1.2 million, consisting of a cash payment of $1.0 million at closing, a deferred cash payment of up to $0.2 million payable over two years after the acquisition date, and additional cash payments of up to $2.0 million if certain revenue targets are met for the years ended June 30, 2015 and June 30, 2016. VMM is a software-as-a-service application that facilitates the management of the end-to-end maintenance life cycle for single family and
42
multifamily rental properties and provides property managers visibility into their maintenance costs, manages resources, and provides business control for property managers.
In May 2014, we acquired substantially all of the operating assets of Notivus Multi-Family, LLC ("Notivus") for a purchase price of $4.4 million, which consisted of a cash payment of $3.6 million at closing and a deferred cash payment of up to $0.8 million payable over two years after the acquisition date. The acquisition of Notivus expands our ability to provide vendor risk management and compliance software solutions for the rental housing industry.
In June 2014, we acquired all of the issued and outstanding stock of Kigo, Inc. ("Kigo"). Kigo is a software-as-a-service vacation rental booking system headquartered in the United States with operations in Spain. Kigo offers services for vacation rental property management that include vacation rental calendars, scheduling, reservations, accounting, channel management, website design, payment processing and other tasks to aid the management of leads, revenue, resources and lodging calendars. We plan to integrate Kigo with our existing vacation rental products and further extend our vacation rental booking system internationally. We acquired Kigo for a purchase price of $36.2 million, consisting of a cash payment of $30.7 million and a deferred cash payment of up to $5.5 million, to be payable over two and a half years after the acquisition date.
Key Business Metrics
In addition to traditional financial measures, we monitor our operating performance using a number of financially and non-financially derived metrics that are not included in our consolidated financial statements. We monitor the key performance indicators reflected in the following table:
Year Ended December 31, | ||||||||||||
2014 | 2013 | 2012 | ||||||||||
(in thousands, except dollar per unit data) | ||||||||||||
Revenue: | ||||||||||||
Total revenue | $ | 404,551 | $ | 377,022 | $ | 322,172 | ||||||
On demand revenue | $ | 390,622 | $ | 362,312 | $ | 306,400 | ||||||
On demand revenue as a percentage of total revenue | 96.6 | % | 96.1 | % | 95.1 | % | ||||||
Ending on demand units | 9,560 | 9,022 | 8,113 | |||||||||
Average on demand units | 9,361 | 8,615 | 7,625 | |||||||||
Non-GAAP on demand revenue | $ | 391,057 | $ | 365,029 | $ | 306,489 | ||||||
Non-GAAP on demand revenue per average on demand unit | $ | 41.78 | $ | 42.37 | $ | 40.20 | ||||||
Adjusted EBITDA | $ | 70,589 | $ | 90,312 | $ | 73,349 | ||||||
Adjusted EBITDA as a percentage of total revenue | 17.4 | % | 24.0 | % | 22.8 | % | ||||||
On demand revenue. This metric represents the license and subscription fees relating to our on demand software solutions, typically licensed for one year terms, commission income from sales of renter’s insurance policies and transaction fees for certain of our on demand software solutions. We consider on demand revenue to be a key business metric because we believe the market for our on demand software solutions represents the largest growth opportunity for our business.
On demand revenue as a percentage of total revenue. This metric represents on demand revenue for the period presented divided by total revenue for the same period. We use on demand revenue as a percentage of total revenue to measure our success in executing our strategy to increase the penetration of our on demand software solutions and expand our recurring revenue streams attributable to these solutions. We expect our on demand revenue to remain a significant percentage of our total revenue although the actual percentage may vary from period to period due to a number of factors, including the timing of acquisitions, professional and other revenue and on premise perpetual license sales and maintenance fees.
Ending on demand units. This metric represents the number of rental housing units managed by our customers with one or more of our on demand software solutions at the end of the period. We use ending on demand units to measure the success of our strategy of increasing the number of rental housing units managed with our on demand software solutions. Property unit counts are provided to us by our customers as new sales orders are processed. Property unit counts may be adjusted periodically as information related to our customers’ properties is updated or supplemented, which could result in adjustments to the number of units previously reported.
Non-GAAP on demand revenue. This metric represents on demand revenue plus acquisition-related and other deferred revenue adjustments. We use this metric to evaluate our on demand revenue as we believe its inclusion provides a more accurate depiction of on demand revenue arising from our strategic acquisitions.
The following provides a reconciliation of non-GAAP on demand revenue to on demand revenue, our most directly comparable GAAP financial measure:
43
Year Ended December 31, | ||||||||||||
2014 | 2013 | 2012 | ||||||||||
(in thousands) | ||||||||||||
On demand revenue | $ | 390,622 | $ | 362,312 | $ | 306,400 | ||||||
Acquisition-related and other deferred revenue | 435 | 2,717 | 89 | |||||||||
Non-GAAP on demand revenue | $ | 391,057 | $ | 365,029 | $ | 306,489 | ||||||
Non-GAAP on demand revenue per average on demand unit. This metric represents non-GAAP on demand revenue for the period presented divided by average on demand units for the same period. For interim periods, the calculation is performed on an annualized basis. We calculate average on demand units as the average of the beginning and ending on demand units for each quarter in the period presented. We monitor this metric to measure our success in increasing the number of on demand software solutions utilized by our customers to manage their rental housing units, our overall revenue and profitability.
Adjusted EBITDA. We define this metric as net (loss) income plus acquisition-related and other deferred revenue adjustments, depreciation and asset impairment, loss on sale of assets, amortization of intangible assets, net interest expense, income tax (benefit) expense, stock-based compensation expense, any impact related to Yardi litigation (including related insurance litigation and settlement costs) and acquisition-related expense. We believe that the use of Adjusted EBITDA is useful to investors and other users of our financial statements in evaluating our operating performance across companies and across periods. We believe that:
• | Adjusted EBITDA provides investors and other users of our financial information consistency and comparability with our past financial performance, facilitates period-to-period comparisons of operations and facilitates comparisons with our peer companies, many of which use similar non-GAAP financial measures to supplement their GAAP results; |
• | it is useful to exclude certain non-cash charges, such as depreciation and asset impairment, amortization of intangible assets and stock-based compensation and non-core operational charges, such as acquisition-related expenses and any impact related to the Yardi litigation (including related insurance litigation and settlement costs), from Adjusted EBITDA because the amount of such expenses in any specific period may not directly correlate to the underlying performance of our business operations and these expenses can vary significantly between periods as a result of new acquisitions, full amortization of previously acquired tangible and intangible assets or the timing of new stock-based awards, as the case may be; and |
• | it is useful to include deferred revenue written down for GAAP purposes under purchase accounting rules and revenue deferred due to a lack of historical experience in determining the settlement of the contractual obligation in order to appropriately measure the underlying performance of our business operations in the period of activity and associated expense. |
We use Adjusted EBITDA in conjunction with traditional GAAP operating performance measures as part of our overall assessment of our performance, for planning purposes, including the preparation of our annual operating budget, to evaluate the effectiveness of our business strategies and to communicate with our board of directors concerning our financial performance.
We do not place undue reliance on Adjusted EBITDA as our only measure of operating performance. Adjusted EBITDA should not be considered as a substitute for other measures of liquidity or financial performance reported in accordance with GAAP. There are limitations to using non-GAAP financial measures, including that other companies may calculate these measures differently than we do, that they do not reflect our capital expenditures or future requirements for capital expenditures and that they do not reflect changes in, or cash requirements for, our working capital. We compensate for the inherent limitations associated with using Adjusted EBITDA measures through disclosure of these limitations, presentation of our financial statements in accordance with GAAP and reconciliation of Adjusted EBITDA to the most directly comparable GAAP measure, net (loss) income. Our Adjusted EBITDA decreased from approximately $90.3 million in 2013 to approximately $70.6 million in 2014 as a result of our net loss in 2014.
The following provides a reconciliation of net (loss) income to Adjusted EBITDA.
44
Year Ended December 31, | ||||||||||||
2014 | 2013 | 2012 | ||||||||||
(in thousands) | ||||||||||||
Net (loss) income | $ | (10,274 | ) | $ | 20,692 | $ | 5,183 | |||||
Acquisition-related and other deferred revenue | 435 | 2,717 | 89 | |||||||||
Depreciation, loss on disposal and impairment of assets | 19,288 | 14,411 | 13,539 | |||||||||
Amortization of intangible assets | 22,404 | 17,648 | 19,498 | |||||||||
Interest expense, net | 1,117 | 1,427 | 2,160 | |||||||||
Income tax (benefit) expense | (6,333 | ) | (210 | ) | 4,219 | |||||||
Litigation-related expense | 4,915 | 661 | 10,158 | |||||||||
Stock-based compensation expense | 37,050 | 29,697 | 18,178 | |||||||||
Acquisition-related expense (income) | 1,987 | 3,269 | (350 | ) | ||||||||
Stock registration costs | — | — | 675 | |||||||||
Adjusted EBITDA | $ | 70,589 | $ | 90,312 | $ | 73,349 | ||||||
Key Components of our Results of Operations
Revenue
We derive our revenue from three primary sources: our on demand software solutions; our on premise software solutions; and our professional and other services. In 2014, 2013 and 2012, we generated revenue of $404.6 million, $377.0 million and $322.2 million, respectively.
On Demand Revenue
Revenue from our on demand software solutions is comprised of license and subscription fees relating to our on demand software solutions, typically licensed for one year terms, commission income from sales of renter’s insurance policies, and transaction fees for certain on demand software solutions, such as payment processing, spend management and billing services. Typically, we price our on demand software solutions based primarily on the number of units or beds the customer manages with our solutions. For our insurance based solutions, our agreement provides for a fixed commission on earned premiums related to the policies sold by us. The agreement also provides for a contingent commission to be paid to us in accordance with the agreement. This agreement provides for a calculation that considers, on the policies sold by us, earned premiums less i) earned agent commissions; ii) a percent of premium retained by our underwriting partner; iii) incurred losses; and iv) profit retained by our underwriting partner during the time period. Our estimate of our contingent commission revenue considers historical loss experience on the policies sold by us. For our transaction-based solutions, we price based on a fixed rate per transaction.
In 2014, 2013 and 2012, revenue from our on demand software solutions was approximately $390.6 million, $362.3 million and $306.4 million, respectively, representing approximately 96.6%, 96.1% and 95.1% of our total revenue for the same periods. Revenue from our on demand software solutions has continued to increase in absolute dollars and as a percentage of our total revenue as we have ceased actively marketing our legacy on premise software solutions to new customers and many of our existing on premise customers have transitioned to our on demand software solutions. We expect our on demand revenue to continue to increase in absolute dollars and as a percentage of revenue in 2015, although the actual percentage of revenue may vary from period to period due to a number of factors, including the timing of acquisitions, professional and other revenue and on premise perpetual license sales and maintenance fees.
On Premise Revenue
Our on premise software solutions are distributed to our customers and maintained locally on the customers’ hardware. Revenue from our on premise software solutions is comprised of license fees under term and perpetual license agreements. Typically, we have licensed our on premise software solutions pursuant to term license agreements with an initial term of one year that include maintenance and support. Customers can renew their term license agreement for additional one-year terms at renewal price levels.
We no longer actively market our legacy on premise software solutions to new customers, and only license our on premise software solutions to a small portion of our existing on premise customers as they expand their portfolio of rental housing properties. While we intend to support our acquired on premise software solutions, we expect that many of the customers who license these solutions will transition to our on demand software solutions over time.
In 2014, 2013 and 2012, revenue from our on premise software solutions was approximately $3.1 million, $3.7 million and $5.2 million, respectively, representing approximately 0.8%, 1.0% and 1.6% of our total revenue for the same periods,
45
respectively. Revenue from our on premise software solutions has continued to decrease in absolute dollars as we have ceased actively marketing our legacy on premise software solutions to new customers and as many of our existing on premise customers have transitioned to our on demand software solutions. We expect our legacy on premise revenue to continue to decrease over time in absolute dollars and as a percentage of our total revenue although the actual percentage of revenue may vary from period to period due to a number of factors, including the impact of our past and potential future acquisition of on premise software solutions.
Professional and Other Revenue
Revenue from professional and other services consists of consulting and implementation services, training and other ancillary services. We complement our solutions with professional and other services for our customers willing to invest in enhancing the value or decreasing the implementation time of our solutions. Our professional and other services are typically priced as time and material engagements. In 2014, 2013 and 2012, revenue from professional and other services was approximately $10.8 million, $11.0 million and $10.6 million, respectively, representing approximately 2.6%, 2.9% and 3.3% of our total revenue for the same periods, respectively. We expect professional and other services will represent 5.0% or less of our total revenue in 2015 and 2016, consistent with our performance for the previous three years.
Cost of Revenue
Cost of revenue consists primarily of personnel costs related to our operations, support services, training and implementation services, expenses related to the operation of our data center and fees paid to third-party service providers. Personnel costs include salaries, bonuses, stock-based compensation and employee benefits. Cost of revenue also includes an allocation of facilities costs, overhead costs and depreciation, as well as amortization of acquired technology related to strategic acquisitions and amortization of capitalized development costs. We allocate facilities, overhead costs and depreciation based on headcount. We expect our cost of revenue in 2015 and 2016 to increase in absolute dollars.
Operating Expenses
We classify our operating expenses into three categories: product development, sales and marketing, and general and administrative. Our operating expenses primarily consist of personnel costs, costs for third-party contracted development, marketing, legal, accounting and consulting services and other professional service fees. Personnel costs for each category of operating expenses include salaries, bonuses, stock-based compensation and employee benefits for employees in that category. In addition, our operating expenses include an allocation of our facilities costs, overhead costs and depreciation based on headcount for that category, as well as amortization of purchased intangible assets resulting from our acquisitions.
Our operating expenses increased in absolute dollars in each of 2014 and 2013 as we built infrastructure and added employees across all categories in order to accelerate and support our growth and to expand our markets. We expect our operating expenses in 2015 and 2016 to continue to increase in absolute dollars as compared to 2014 but decrease as a percentage of revenue, as the capacity we have added in prior years is more fully utilized and we continue to create operating leverage.
Product development. Product development expense consists primarily of personnel costs for our product development employees and executives and fees to contract development vendors. Our product development efforts are focused primarily on increasing the functionality and enhancing the ease of use of our on demand software solutions and expanding our suite of on demand software solutions. In 2008 and 2011, we established a product development and service center in Hyderabad, India and Manila, Philippines, respectively, to take advantage of strong technical talent at lower personnel costs compared to the United States. We expect our product development expenses in 2015 and 2016 to increase in absolute dollars as compared to 2014 but decrease as a percentage of revenue, as the capacity we have added in prior years is more fully utilized and we continue to create operating leverage.
Sales and marketing. Sales and marketing expense consists primarily of personnel costs for our sales, marketing and business development employees and executives, travel and entertainment and marketing programs. Marketing programs consist of amounts paid for SEO and search engine marketing (“SEM”), renter’s insurance and other advertising, trade shows, user conferences, public relations, industry sponsorships and affiliations and product marketing. In addition, sales and marketing expense includes amortization of certain purchased intangible assets, including customer relationships and key vendor and supplier relationships obtained in connection with our acquisitions. We expect our sales and marketing expense in 2015 and 2016 to increase in absolute dollars as compared to 2014.
General and administrative. General and administrative expense consists of personnel costs for our executive, finance and accounting, human resources, management information systems and legal personnel, as well as legal, accounting and other professional service fees and other corporate expenses. We expect our general and administrative expense in 2015 and 2016 to increase in absolute dollars as compared to 2014 but decrease as a percentage of revenue, as we continue to add operating leverage.
Interest Expense, Net
46
Interest expense, net, consists primarily of interest income and interest expense. Interest income represents earnings from our cash and cash equivalents. Interest expense is associated with our revolver, capital lease obligations and certain acquisition-related liabilities. Total amounts outstanding under our interest-bearing obligations at December 31, 2014, 2013 and 2012 include:
As of December 31, | ||||||||||||
2014 | 2013 | 2012 | ||||||||||
(in thousands) | ||||||||||||
Revolver | $ | 20,000 | $ | — | $ | 10,000 | ||||||
Capital lease obligations | 867 | 1,428 | — | |||||||||
Interest bearing acquisition-related liabilities | 5,372 | 834 | 864 | |||||||||
Based on our current operations, we expect our interest expense in 2015 to decrease marginally from our 2014 expense.
Income Taxes
As of December 31, 2014, we had net operating loss carryforwards for federal and state income tax purposes of approximately $191.1 million. If not utilized, our federal net operating loss carryforwards will begin to expire in 2020 and the state operating losses will begin to expire in 2015. Net operating losses generated by us are not currently subject to the carryforward limitation in Section 382 of the Internal Revenue Code (“Section 382 limitation”); however, $23.9 million of net operating losses generated by subsidiaries prior to their acquisition by us are subject to the Section 382 limitation. The limitation on these pre-acquisition net operating loss carryforwards will fully expire in 2031. A cumulative change in ownership among material shareholders, as defined in Section 382 of the Internal Revenue Code, during a three-year period may limit utilization of the federal net operating loss carryforwards.
Critical Accounting Policies
Our consolidated financial statements are prepared in accordance with GAAP. In many cases, the accounting treatment of a particular transaction is specifically dictated by GAAP and does not require management’s judgment in its application, while in other cases, management’s judgment is required in selecting among available alternative accounting standards that allow different accounting treatment for similar transactions. The preparation of our consolidated financial statements and related disclosures require us to make estimates, assumptions and judgments that affect the reported amount of assets, liabilities, revenue, costs and expenses, and related disclosures. We base our estimates and assumptions on historical experience and other factors that we believe to be reasonable under the circumstances. In some instances, we could reasonably use different accounting estimates, and in some instances results could differ significantly from our estimates. We evaluate our estimates and assumptions on an ongoing basis. To the extent that there are differences between our estimates and actual results, our future financial statement presentation, financial condition, results of operations and cash flows will be affected.
We believe that the assumptions and estimates associated with revenue recognition, fair value measurements, accounts receivable, business combinations, goodwill and other intangible assets with indefinite lives, impairment of long-lived assets, intangible assets, stock-based compensation, income taxes and capitalized product development costs have the greatest potential impact on our consolidated financial statements. Therefore, we believe the accounting policies discussed below are critical to understanding our historical and future performance, as these policies relate to the more significant areas involving our management’s judgments, assumptions and estimates.
Revenue Recognition
We derive our revenue from three primary sources: our on demand software solutions; our on premise software solutions; and professional and other services. We commence revenue recognition when all of the following conditions are met:
• | there is persuasive evidence of an arrangement; |
• | the solution and/or service has been provided to the customer; |
• | the collection of the fees is probable; and |
• | the amount of fees to be paid by the customer is fixed or determinable. |
For multi-element arrangements that include multiple software solutions and/or services, we allocate arrangement consideration to all deliverables that have stand-alone value based on their relative selling prices. In such circumstances, we utilize the following hierarchy to determine the selling price to be used for allocating revenue to deliverables as follows:
• | Vendor specific objective evidence (VSOE), if available. The price at which we sell the element in a separate stand-alone transaction; |
• | Third-party evidence of selling price (TPE), if VSOE of selling price is not available. Evidence from us or other companies of the value of a largely interchangeable element in a transaction; and |
47
• | Estimated selling price (ESP), if neither VSOE nor TPE of selling price is available. Our best estimate of the stand-alone selling price of an element in a transaction. |
Our process for determining ESP for deliverables without VSOE or TPE considers multiple factors that may vary depending upon the unique facts and circumstances related to each deliverable. Key factors primarily considered in developing ESP include prices charged by us for similar offerings when sold separately, pricing policies and approvals from standard pricing and other business objectives.
From time to time, we sell on demand software solutions with professional services. In such cases, as each element has stand-alone value, we allocate arrangement consideration based on our ESP of the on demand software solution and VSOE of the selling price of the professional services.
Taxes collected from customers and remitted to governmental authorities are presented on a net basis.
On Demand Revenue
Our on demand revenue consists of license and subscription fees, transaction fees related to certain of our software-enabled value-added services and commissions derived from us selling certain risk mitigation services.
License and subscription fees are comprised of a charge billed at the initial order date and monthly or annual subscription fees for accessing our on demand software solutions. The license fee billed at the initial order date is recognized as revenue on a straight-line basis over the longer of the contractual term or the period in which the customer is expected to benefit, which we consider to be three years. Recognition starts once the product has been activated. Revenue from monthly and annual subscription fees is recognized on a straight-line basis over the access period.
We recognize revenue from transaction fees derived from certain of our software-enabled value-added services as the related services are performed.
As part of our risk mitigation services to the rental housing industry, we act as an insurance agent and derive commission revenue from the sale of insurance products to individuals. The commissions are based upon a percentage of the premium that the insurance company charges to the policyholder and are subject to forfeiture in instances where a policyholder cancels prior to the end of the policy. If the policy is cancelled, our commissions are forfeited as a percent of the unearned premium. As a result, we recognize the commissions related to these services ratably over the policy term as the associated premiums are earned. Our contract with our underwriting partner provides for contingent commissions to be paid to us in accordance with the agreement. This agreement provides for a calculation that considers, on the policies sold by us, earned premiums less i) earned agent commissions; ii) a percent of premium retained by our underwriting partner; iii) incurred losses; and iv) profit retained by our underwriting partner during the time period. Our estimate of contingent commission revenue considers historical loss experience on the policies sold by us.
On Premise Revenue
Revenue from our on premise software solutions is comprised of an annual term license, which includes maintenance and support. Customers can renew their annual term licenses for additional one-year terms at renewal price levels. We recognize revenue from each annual term license on a straight-line basis over the contract term.
In addition, we have arrangements that include perpetual licenses with maintenance and other services to be provided over a fixed term. We allocate and defer revenue equivalent to the VSOE of fair value for the undelivered elements and recognize the difference between the total arrangement fee and the amount deferred for the undelivered elements as revenue. We have determined that we do not have VSOE of fair value for our customer support and professional services in these specific arrangements. As a result, the elements within our multiple-element sales agreements do not qualify for treatment as separate units of accounting. Accordingly, we account for fees received under multiple-element arrangements with customer support or other professional services as a single unit of accounting and recognize the entire arrangement ratably over the longer of the customer support period or the period during which professional services are rendered.
Professional and Other Revenue
Professional and other revenue is recognized as the services are rendered for time and material contracts. Training revenues are recognized in the period in which services are performed.
Accounts Receivable
For several of our solutions, we invoice our customers prior to the period in which service is provided. Accounts receivable represent trade receivables from customers when we have invoiced for software solutions and/or services and we have not yet received payment. We present accounts receivable net of an allowance for doubtful accounts. We maintain an allowance for doubtful accounts for estimated losses resulting from the inability of customers to make required payments, or the customer canceling prior to the service being rendered. In doing so, we consider the current financial condition of the customer, the specific details of the customer account, the age of the outstanding balance, the current economic environment
48
and historical credit trends. As a result, a portion of our allowance is for services not yet rendered and, therefore, is classified as an offset to deferred revenue, which does not have an effect on the statement of operations. Any change in the assumptions used in analyzing a specific account receivable might result in an additional allowance for doubtful accounts being recognized in the period in which the change occurs. For certain transactions, we have met the requirements to recognize income in advance of physically invoicing the customer. In these instances, we record unbilled receivables for the amount that will be due from the customer upon invoicing.
Business Combinations
When we acquire businesses, we allocate the total consideration to the fair value of tangible assets and liabilities and identifiable intangible assets acquired. Any residual purchase price is recorded as goodwill. The allocation of the purchase price requires management to make significant estimates in determining the fair values of assets acquired and liabilities assumed, especially with respect to intangible assets. These estimates are based on the application of valuation models using historical experience and information obtained from the management of the acquired companies. These estimates can include, but are not limited to, the cash flows that an asset is expected to generate in the future, the appropriate weighted average cost of capital and the cost savings expected to be derived from acquiring an asset. These estimates are inherently uncertain and unpredictable. In addition, unanticipated events and circumstances may occur in future periods which may affect the realizability of these estimated asset values. Additionally, we at times provide for the payment of additional cash consideration to the extent certain targets are achieved in the future. The fair value of this contingent consideration is based on significant estimates and is initially recorded as purchase price. To the extent the fair value changes prior to distribution, these changes are reflected in the Statement of Operations.
Goodwill and Other Intangible Assets with Indefinite Lives
We recorded goodwill and other intangible assets with indefinite lives in conjunction with all our business acquisitions completed since the beginning of 2008. We test goodwill for impairment based on a single reporting unit. We believe we operate in a single reporting unit because our chief operating decision maker does not regularly review our operating results other than at a consolidated level for purposes of decision making regarding resource allocation and operating performance.
We test goodwill and other intangible assets with indefinite lives for impairment separately on an annual basis in the fourth quarter of each year. Additionally, we will test goodwill and other intangible assets with indefinite lives in the interim if events and circumstances indicate that goodwill and other intangible assets with indefinite lives may be impaired. The events and circumstances that we consider include significant under-performance relative to projected future operating results and significant changes in our overall business and/or product strategies.
If an event occurs that would cause us to revise our estimates and assumptions used in analyzing the value of our goodwill and other intangible assets with indefinite lives, the revision could result in a non-cash impairment charge that could have a material impact on our financial results. We evaluate impairment of goodwill by first performing a qualitative assessment to determine whether it is more likely than not that the fair value of a reporting unit is less than its carrying value. If it is concluded that this is the case, it is necessary to perform the two-step goodwill impairment test. The first step involves a comparison of the fair value of a reporting unit with its carrying amount. If the carrying amount of the reporting unit exceeds its fair value, the second step involves a comparison of the implied fair value and carrying amount of the goodwill of that reporting unit to determine the impairment charge, if any.
We quantitatively evaluate other intangible assets with indefinite lives by estimating the fair value of those assets based on estimated future earnings derived from the assets using the income approach model. For those intangible assets with indefinite lives that have been determined to be inseparable due to their interchangeable use, we have grouped these assets into single units of accounting for purposes of testing for impairment. If the carrying amount of the other intangible assets with indefinite lives exceeds the fair value, we would recognize an impairment loss equal to the excess of carrying value over fair value.
Impairment of Long-lived Assets
We perform an impairment review of long-lived assets held and used whenever events or changes in circumstances indicate that the carrying value may not be recoverable. Factors we consider important that could trigger an impairment review include, but are not limited to, significant under-performance relative to projected future operating results, significant changes in the manner of our use of the acquired assets or our overall business and/or product strategies and significant industry or economic trends. When we determine that the carrying value of a long-lived asset may not be recoverable based upon the existence of one or more of these indicators, we determine the recoverability by comparing the carrying amount of the asset to net future undiscounted cash flows that the asset is expected to generate. We would then recognize an impairment charge equal to the amount by which the carrying amount exceeds the fair market value of the asset.
49
Intangible Assets
Intangible assets consist of acquired developed product technologies, acquired customer relationships, vendor relationships, non-competition agreements and trade names. We record intangible assets at fair value and amortize those with finite lives over the shorter of the contractual life or the estimated useful life. We estimate the useful lives of acquired developed product technologies and customer relationships based on factors that include the planned use of each developed product technology and the expected pattern of future cash flows to be derived from each developed product technology and existing customer relationships. We include amortization of acquired developed product technologies in cost of revenue, amortization of acquired customer relationships in sales and marketing expenses and amortization of vendor relationships and non-competition agreements in general and administrative expenses in our consolidated statements of operations. Management evaluates the useful lives of these assets on an annual basis and tests for impairment whenever events or changes in circumstances occur that could impact the recoverability of these assets.
Stock-Based Compensation
We record stock-based compensation expense for options granted to employees based on the estimated fair value for the awards. We estimate the fair value of time-based vesting awards using the Black-Scholes option pricing model on the date of grant and the associated expense is recognized over the requisite service period, which is generally the vesting period, on a straight-line basis.
The fair value of market-based vesting awards is estimated using a discrete model based on multiple stock price-paths developed through the use of Monte Carlo simulation. Expense associated with market-based awards is recognized over the requisite service period on a straight-line basis. We estimate the requisite service period based on the median of the distribution of share price-paths on which the market condition is satisfied.
At each stock option grant date, we utilize peer group data to calculate our expected volatility. Expected volatility is based on historical volatility rates of publicly traded peers combined with our historical volatility rates. Expected life is computed using the mid-point between the vesting period and contractual life of the options granted. The risk-free rate is based on the treasury yield rate with a maturity corresponding to the expected option life assumed at the grant date. Forfeiture rates are estimated using historical and expected future trends.
Changes to the assumptions underlying the above models may have a significant impact on the underlying value of the stock options, which could have a material impact on our consolidated financial statements.
We have granted stock options at exercise prices believed to be equal to the fair market value of our common stock, as of the grant date. The fair value of our time-based restricted stock awards is based on the closing price of our common stock on the NASDAQ Global Select Market on the date of grant.
Income Taxes
Income taxes are provided based on the liability method, which results in income tax assets and liabilities arising from temporary differences. Temporary differences are differences between the tax basis of assets and liabilities and their reported amounts in the financial statements that will result in taxable or deductible amounts in future years. The liability method requires the effect of tax rate changes on current and accumulated deferred income taxes to be reflected in the period in which the rate change was enacted. The liability method also requires that the deferred tax assets be reduced by a valuation allowance unless it is more likely than not that the assets will be realized.
We record net deferred tax assets to the extent we believe these assets will more likely than not be realized. We consider whether a valuation allowance is needed on our deferred tax assets by evaluating all positive and negative evidence relative to our ability to recover deferred tax assets, including scheduled reversals of deferred tax liabilities, projected future taxable income, tax planning strategies and recent financial operations. In projecting future taxable income, we begin with historical results, if any, and incorporate assumptions including the amount of future state, federal and foreign pretax operating income, the reversal of temporary differences, and the implementation of feasible and prudent tax planning strategies, if any. These assumptions require significant judgment about the forecasts of future taxable income and are consistent with the plans and estimates we are using to manage the underlying businesses.
We may recognize the tax benefit from uncertain tax positions only if it is at least more likely than not that the tax position will be sustained on examination by the taxing authorities, based on the technical merits of the position. The tax benefits recognized in the financial statements from such a position should be measured based on the largest benefit that has a greater than fifty percent likelihood of being realized upon settlement with the taxing authorities. We currently have recorded no liability for uncertain tax positions due to the fact that there were no material identified tax benefits that were considered uncertain positions.
Capitalized Product Development Costs
50
We capitalize specific product development costs, including costs to develop software products or the software components of our solutions to be marketed to our customers, as well as software programs to be used solely to meet our internal needs. The costs incurred in the preliminary stages of development related to research, project planning, training, maintenance and general and administrative activities, and overhead costs are expensed as incurred. The costs of relatively minor upgrades and enhancements to the software are also expensed as incurred. Once an application has reached the development stage, internal and external costs incurred in the performance of application development stage activities, including materials, services and payroll-related costs for employees are capitalized, if direct and incremental, until the software is substantially complete and ready for its intended use. Capitalization ceases upon completion of all substantial testing. We also capitalize costs related to specific upgrades and enhancements when it is probable the expenditures will result in additional functionality. Capitalized costs are recorded as part of property and equipment. Internal use software is amortized on a straight-line basis over its estimated useful life, generally three years. Management evaluates the useful lives of these assets on an annual basis and tests for impairment whenever events or changes in circumstances occur that could impact the recoverability of these assets. There were no impairments to internal use software during the years ended December 31, 2014, 2013 or 2012.
Results of Operations
The following tables set forth our results of operations for the specified periods. The period-to-period comparison of financial results is not necessarily indicative of future results.
Consolidated Statements of Operations Data
Year Ended December 31, | ||||||||||||
2014 | 2013 | 2012 | ||||||||||
(in thousands) | ||||||||||||
Revenue: | ||||||||||||
On demand | $ | 390,622 | $ | 362,312 | $ | 306,400 | ||||||
On premise | 3,094 | 3,691 | 5,216 | |||||||||
Professional and other | 10,835 | 11,019 | 10,556 | |||||||||
Total revenue | 404,551 | 377,022 | 322,172 | |||||||||
Cost of revenue (1) | 174,871 | 148,321 | 128,562 | |||||||||
Gross profit | 229,680 | 228,701 | 193,610 | |||||||||
Operating expense: | ||||||||||||
Product development (1) | 64,418 | 50,638 | 48,177 | |||||||||
Sales and marketing (1) | 111,563 | 95,894 | 76,992 | |||||||||
General and administrative (1) | 69,202 | 60,610 | 56,993 | |||||||||
Total operating expense | 245,183 | 207,142 | 182,162 | |||||||||
Operating (loss) income | (15,503 | ) | 21,559 | 11,448 | ||||||||
Interest expense and other, net | (1,104 | ) | (1,077 | ) | (2,046 | ) | ||||||
Net (loss) income before taxes | (16,607 | ) | 20,482 | 9,402 | ||||||||
Income tax (benefit) expense | (6,333 | ) | (210 | ) | 4,219 | |||||||
Net (loss) income | $ | (10,274 | ) | $ | 20,692 | $ | 5,183 | |||||
(1) Includes stock-based compensation expense as follows:
Year Ended December 31, | ||||||||||||
2014 | 2013 | 2012 | ||||||||||
(in thousands) | ||||||||||||
Cost of revenue | $ | 3,826 | $ | 3,111 | $ | 2,806 | ||||||
Product development | 8,637 | 4,788 | 4,391 | |||||||||
Sales and marketing | 12,966 | 10,993 | 4,790 | |||||||||
General and administrative | 11,621 | 10,805 | 6,191 | |||||||||
The following table sets forth our results of operations for the specified periods as a percentage of our revenue for those periods. The period-to-period comparison of financial results is not necessarily indicative of future results.
51
Year Ended December 31, | |||||||||
2014 | 2013 | 2012 | |||||||
(as a percentage of total revenue) | |||||||||
Revenue: | |||||||||
On demand | 96.6 | % | 96.1 | % | 95.1 | % | |||
On premise | 0.8 | 1.0 | 1.6 | ||||||
Professional and other | 2.6 | 2.9 | 3.3 | ||||||
Total revenue | 100.0 | 100.0 | 100.0 | ||||||
Cost of revenue | 43.2 | 39.3 | 39.9 | ||||||
Gross profit | 56.8 | 60.7 | 60.1 | ||||||
Operating expense: | |||||||||
Product development | 15.9 | 13.4 | 14.9 | ||||||
Sales and marketing | 27.6 | 25.5 | 23.9 | ||||||
General and administrative | 17.1 | 16.1 | 17.7 | ||||||
Total operating expenses | 60.6 | 55.0 | 56.5 | ||||||
Operating (loss) income | (3.8 | ) | 5.7 | 3.6 | |||||
Interest expense and other, net | (0.3 | ) | (0.3 | ) | (0.7 | ) | |||
Net (loss) income before taxes | (4.1 | ) | 5.4 | 2.9 | |||||
Income tax (benefit) expense | (1.6 | ) | (0.1 | ) | 1.3 | ||||
Net (loss) income | (2.5 | )% | 5.5 | % | 1.6 | % | |||
Year Ended December 31, 2014 and 2013
Revenue
Year Ended December 31, | |||||||||||||||
2014 | 2013 | Change | % Change | ||||||||||||
(in thousands, except dollar per unit data) | |||||||||||||||
Revenue: | |||||||||||||||
On demand | $ | 390,622 | $ | 362,312 | $ | 28,310 | 7.8 | % | |||||||
On premise | 3,094 | 3,691 | (597 | ) | (16.2 | ) | |||||||||
Professional and other | 10,835 | 11,019 | (184 | ) | (1.7 | ) | |||||||||
Total revenue | $ | 404,551 | $ | 377,022 | $ | 27,529 | 7.3 | ||||||||
On demand unit metrics: | |||||||||||||||
Ending on demand units | 9,560 | 9,022 | 538 | 6.0 | |||||||||||
Average on demand units | 9,361 | 8,615 | 746 | 8.7 | |||||||||||
Non-GAAP on demand revenue | $ | 391,057 | $ | 365,029 | $ | 26,028 | 7.1 | ||||||||
Non-GAAP on demand revenue per average on demand unit | $ | 41.78 | $ | 42.37 | $ | (0.59 | ) | (1.4 | ) | ||||||
On demand revenue. Our on demand revenue increased in 2014 compared to 2013 due to an increase in rental property units managed with our on demand solutions and an increase in the number of our on demand solutions utilized by our existing customer base, combined with revenue contributed from our strategic acquisitions. This increase was offset in part due to a decrease in revenue per unit, or RPU, to $41.78 from $42.37. Lower RPU was primarily driven by reduced spending by our customers on marketing and advertising solutions resulting from their renter turnover rates declining and occupancy rates increasing.
On premise revenue. On premise revenue decreased in 2014 compared to 2013. We no longer actively market our legacy on premise software solutions to new customers and only market and support our acquired on premise software solutions. We expect on premise revenue to continue to decline over time as we transition acquired on premise customers to our on demand property management solutions.
Professional and other revenue. Professional and other services revenue decreased in 2014 compared to 2013, primarily due to a decrease in sub-meter installation revenues related to our utility management services.
52
On demand unit metrics. As of December 31, 2014, one or more of our on demand solutions was utilized in the management of approximately 9.6 million rental property units, representing an increase compared to 2013. The increase in the number of rental property units managed by one or more of our on demand solutions was due to new customer sales, marketing efforts to existing customers, and our 2014 acquisitions, which contributed 1.0% to total ending on demand units.
As of December 31, 2014, annualized non-GAAP on demand revenue per average on demand unit decreased compared to 2013. This decrease is primarily due to reduced spending by our customers on marketing and advertising solutions resulting from their renter turnover rates declining and occupancy rates increasing.
Cost of Revenue
Year Ended December 31, | |||||||||||||||
2014 | 2013 | Change | % Change | ||||||||||||
(in thousands) | |||||||||||||||
Cost of revenue | $ | 151,821 | $ | 130,930 | $ | 20,891 | 16.0 | % | |||||||
Stock-based compensation | 3,826 | 3,111 | 715 | 23.0 | |||||||||||
Depreciation and amortization | 19,224 | 14,280 | 4,944 | 34.6 | |||||||||||
Total cost of revenue | $ | 174,871 | $ | 148,321 | $ | 26,550 | 17.9 | ||||||||
Cost of revenue. Total cost of revenue increased in 2014 compared to 2013 primarily due to an $8.7 million increase in costs related to the increased sales of our solutions; an increase in personnel related expenses in the amount of $8.6 million primarily related to costs to support our growth initiatives and, to a lesser degree, increases in headcount added as a result of our 2014 and 2013 acquisitions; an increase in information technology expense of $3.1 million and an increase in consulting fees of $0.6 million.
Operating Expenses
Year Ended December 31, | |||||||||||||||
2014 | 2013 | Change | % Change | ||||||||||||
(in thousands) | |||||||||||||||
Product development | $ | 50,871 | $ | 42,806 | $ | 8,065 | 18.8 | % | |||||||
Stock-based compensation | 8,637 | 4,788 | 3,849 | 80.4 | |||||||||||
Depreciation and amortization | 4,910 | 3,044 | 1,866 | 61.3 | |||||||||||
Total product development expense | $ | 64,418 | $ | 50,638 | $ | 13,780 | 27.2 | ||||||||
Product development. Total product development expense increased in 2014 compared to 2013 primarily due to increased compensation costs for new product and integration initiatives of $5.9 million, an increase in consulting fees of $0.7 million, an increase in information technology expense of $0.7 million, an increase in facilities expense of $0.6 million and an increase in travel expense of $0.4 million. These increases were partially offset by a decrease in maintenance costs of $0.2 million.
Year Ended December 31, | |||||||||||||||
2014 | 2013 | Change | % Change | ||||||||||||
(in thousands) | |||||||||||||||
Sales and marketing | $ | 85,178 | $ | 73,817 | $ | 11,361 | 15.4 | % | |||||||
Stock-based compensation | 12,966 | 10,993 | 1,973 | 17.9 | |||||||||||
Depreciation and amortization | 13,419 | 11,084 | 2,335 | 21.1 | |||||||||||
Total sales and marketing expense | $ | 111,563 | $ | 95,894 | $ | 15,669 | 16.3 | ||||||||
Sales and marketing. Total sales and marketing expense increased in 2014 compared to 2013 primarily due to increased compensation costs for new and existing sales representatives of $8.1 million, an increase in marketing program expense of $3.7 million, an increase in information technology expense of $1.5 million and an increase in travel related expenditures of $0.8 million. These increases were partially offset by a decrease in SEO and SEM activity of $2.1 million, consistent with our strategy to optimize certain business models, and a decrease in bad debt expense of $0.6 million.
53
Year Ended December 31, | |||||||||||||||
2014 | 2013 | Change | % Change | ||||||||||||
(in thousands) | |||||||||||||||
General and administrative | $ | 53,828 | $ | 46,468 | $ | 7,360 | 15.8 | % | |||||||
Stock-based compensation | 11,621 | 10,805 | 816 | 7.6 | |||||||||||
Depreciation and amortization | 3,753 | 3,337 | 416 | 12.5 | |||||||||||
Total general and administrative expense | $ | 69,202 | $ | 60,610 | $ | 8,592 | 14.2 | ||||||||
General and administrative. Total general and administrative expense increased in 2014 compared to 2013 primarily due to an increase of $1.8 million in personnel expense to support the growth in our business, including increased investment in our offshore operations that support those functions; a $5.5 million increase in litigation expense primarily due to legal fees and the settlement of a lawsuit in 2014; an increase in fees for professional services of $0.9 million; an increase in travel related expenditures of $0.2 million and an increase in business insurance costs of $0.2 million. These increases were partially offset by a decrease of the expense related to changes in the fair value of contingent consideration obligations related to our acquisition activity of $1.2 million.
Interest Expense and Other, Net
The increase in interest expense and other, net in 2014 as compared to 2013 was primarily due to an increase in expense related to the amortization of our debt origination costs and the increase on our revolving facility to $20.0 million at December 31, 2014.
Provision for Income Taxes
As of December 31, 2014, we incurred tax benefit of $6.3 million with an effective tax rate of 38.1%. The 2014 domestic income taxes are a net benefit of $6.6 million with an effective tax rate of 40.0% resulting from the statutory federal tax rate and state income tax rates, offset by state tax liabilities in jurisdictions where tax is considered an income tax for financial reporting purposes but is assessed on adjusted gross revenue rather than adjusted net income. The 2014 foreign income taxes are a net expense of $0.3 million with an effective rate of (1.9)%. The Company's foreign effective tax rate decreased in 2014 from 2013 as a result of the tax holiday of our PEZA-registered project in the Philippines.
Year Ended December 31, 2013 and 2012
Revenue
Year Ended December 31, | |||||||||||||||
2013 | 2012 | Change | % Change | ||||||||||||
(in thousands, except dollar per unit data) | |||||||||||||||
Revenue: | |||||||||||||||
On demand | $ | 362,312 | $ | 306,400 | $ | 55,912 | 18.2 | % | |||||||
On premise | 3,691 | 5,216 | (1,525 | ) | (29.2 | ) | |||||||||
Professional and other | 11,019 | 10,556 | 463 | 4.4 | |||||||||||
Total revenue | $ | 377,022 | $ | 322,172 | $ | 54,850 | 17.0 | ||||||||
On demand unit metrics: | |||||||||||||||
Ending on demand units | 9,022 | 8,113 | 909 | 11.2 | |||||||||||
Average on demand units | 8,615 | 7,625 | 990 | 13.0 | |||||||||||
Non-GAAP on demand revenue | $ | 365,029 | $ | 306,489 | $ | 58,540 | 19.1 | ||||||||
Non-GAAP on demand revenue per average on demand unit | $ | 42.37 | $ | 40.20 | $ | 2.17 | 5.4 | ||||||||
On demand revenue. Our on demand revenue increased in 2013 compared to 2012 due to an increase in rental property units managed with our on demand solutions and an increase in the number of our on demand solutions utilized by our existing customer base, combined with revenue contributed from our strategic acquisitions.
On premise revenue. On premise revenue decreased in 2013 compared to 2012. We no longer actively market our legacy on premise software solutions to new customers and only market and support our acquired on premise software solutions. We expect on premise revenue to continue to decline over time as we transition acquired on premise customers to our on demand property management solutions.
Professional and other revenue. Professional and other services revenue increased in 2013 compared to 2012, primarily due to an increase in revenue from consulting services.
54
On demand unit metrics. As of December 31, 2013, one or more of our on demand solutions was utilized in the management of 9.0 million rental property units, representing an increase compared to 2012. The increase in the number of rental property units managed by one or more of our on demand solutions was due to new customer sales, marketing efforts to existing customers, and our 2012 and 2013 acquisitions, which contributed 2.5% to total ending on demand units.
As of December 31, 2013, non-GAAP on demand revenue per average on demand unit increased compared to 2012, primarily due to improved penetration of our on demand solutions into our customer base.
Cost of Revenue
Year Ended December 31, | |||||||||||||||
2013 | 2012 | Change | % Change | ||||||||||||
(in thousands) | |||||||||||||||
Cost of revenue | $ | 130,930 | $ | 109,681 | $ | 21,249 | 19.4 | % | |||||||
Stock-based compensation | 3,111 | 2,806 | 305 | 10.9 | |||||||||||
Depreciation and amortization | 14,280 | 16,075 | (1,795 | ) | (11.2 | ) | |||||||||
Total cost of revenue | $ | 148,321 | $ | 128,562 | $ | 19,759 | 15.4 | ||||||||
Cost of revenue. Total cost of revenue increased in 2013 compared to 2012 primarily due to: a $2.1 million increase in costs related to the increased sales of our solutions, which includes investments in infrastructure and other support services; a $17.6 million increase in personnel expense related to increased headcount to support our growth initiatives and headcount added as a result of our 2013 and 2012 acquisitions; a $0.8 million increase in information technology expense and a $0.7 million increase in facilities expenses.
Operating Expenses
Year Ended December 31, | |||||||||||||||
2013 | 2012 | Change | % Change | ||||||||||||
(in thousands) | |||||||||||||||
Product development | $ | 42,806 | $ | 41,151 | $ | 1,655 | 4.0 | % | |||||||
Stock-based compensation | 4,788 | 4,391 | 397 | 9.0 | |||||||||||
Depreciation and amortization | 3,044 | 2,635 | 409 | 15.5 | |||||||||||
Total product development expense | $ | 50,638 | $ | 48,177 | $ | 2,461 | 5.1 | ||||||||
Product development. Total product development expense increased in 2013 compared to 2012 primarily due to: a $0.6 million increase in personnel expense related to product development groups added as a result of our 2012 and 2013 acquisitions combined with the associated costs to support our growth initiatives; a $0.6 million increase in consulting costs; a $0.6 million increase in facilities expenses and offset by a decrease of $0.1 million in other product development costs.
Year Ended December 31, | |||||||||||||||
2013 | 2012 | Change | % Change | ||||||||||||
(in thousands) | |||||||||||||||
Sales and marketing | $ | 73,817 | $ | 61,074 | $ | 12,743 | 20.9 | % | |||||||
Stock-based compensation | 10,993 | 4,790 | 6,203 | 129.5 | |||||||||||
Depreciation and amortization | 11,084 | 11,128 | (44 | ) | (0.4 | ) | |||||||||
Total sales and marketing expense | $ | 95,894 | $ | 76,992 | $ | 18,902 | 24.6 | ||||||||
Sales and marketing. Total sales and marketing expense increased in 2013 compared to 2012 primarily due to: a $8.0 million increase in sales and marketing personnel expense related to our increased investment in sales personnel and personnel acquired as a result of our 2013 and 2012 acquisitions; a $1.9 million increase in marketing program expense, primarily related to an increase in SEO and SEM activity; a $0.8 million increase in information technology expense; a $0.9 million increase in travel related expenses; a $1.3 million increase in bad debt expense and a $0.3 million increase in other general sales and marketing expense; partially offset by a $0.5 million decrease in consulting fees.
55
Year Ended December 31, | |||||||||||||||
2013 | 2012 | Change | % Change | ||||||||||||
(in thousands) | |||||||||||||||
General and administrative | $ | 46,468 | $ | 48,171 | $ | (1,703 | ) | (3.5 | )% | ||||||
Stock-based compensation | 10,805 | 6,191 | 4,614 | 74.5 | |||||||||||
Depreciation and amortization | 3,337 | 2,631 | 706 | 26.8 | |||||||||||
Total general and administrative expense | $ | 60,610 | $ | 56,993 | $ | 3,617 | 6.3 | ||||||||
General and administrative. Total general and administrative expense decreased in 2013 compared to 2012 primarily due to: a $4.3 million increase in personnel expense related to accounting, management information systems, legal and human resources staff to support the growth in our business; a $0.6 million increase in information technology costs; a $0.4 million increase in consulting expenses and a $2.1 million increase from the fair value adjustment of acquisition-related liabilities; partially offset by a $0.5 million decrease in other general and administrative costs and an $8.6 million decrease in litigation expense related to fees and the accrual of the settlement of the Yardi Lawsuit in 2012. Refer to Part II, Item 6, "Selected Financial Data" for further information regarding the litigation settlement.
Interest Expense and Other, Net
The decrease in interest expense and other, net in 2013 as compared to 2012 was primarily due to a decrease in interest expense as a result of lower debt balances, partially offset by an increase in interest expense related to amounts due certain municipalities.
Provision for Income Taxes
As of December 31, 2013, we incurred tax benefit of $0.2 million with an effective tax rate of (1.0)%. The 2013 domestic income taxes are a net benefit of $0.6 million with an effective tax rate of (2.8)% resulting from the release of a valuation allowance, state tax liabilities in jurisdictions where tax is considered an income tax for financial reporting purposes but is assessed on adjusted gross revenue rather than adjusted net income and where we have current year taxable income for financial reporting purposes that cannot be offset by net operating loss carryforwards until those carryforwards reduce our cash tax liability. The 2013 foreign income taxes are a net expense of $0.4 million with an effective rate of 1.7%. The Company’s foreign effective tax rate decreased in 2013 from 2012 as a result of the tax holiday of our PEZA-registered project in the Philippines.
Quarterly Results of Operations
The following table presents our unaudited consolidated quarterly results of operations for the eight fiscal quarters ended December 31, 2014. This information is derived from our unaudited consolidated financial statements, and includes all adjustments that we consider necessary for fair statement of our financial position and operating results for the quarters presented. Operating results for these periods are not necessarily indicative of the operating results for a full year. Historical results are not necessarily indicative of the results to be expected in future periods. You should read this data together with our consolidated financial statements and the related notes to these financial statements included elsewhere in this filing.
56
Three Months Ended, | |||||||||||||||||||||||||||||||
December 31, 2014 | September 30, 2014 | June 30, 2014 | March 31, 2014 | December 31, 2013 | September 30, 2013 | June 30, 2013 | March 31, 2013 | ||||||||||||||||||||||||
(in thousands) | |||||||||||||||||||||||||||||||
Revenue: | |||||||||||||||||||||||||||||||
On demand | $ | 101,261 | $ | 100,747 | $ | 91,606 | $ | 97,008 | $ | 92,081 | $ | 94,084 | $ | 90,825 | $ | 85,322 | |||||||||||||||
On premise | 648 | 755 | 826 | 865 | 892 | 838 | 1,011 | 950 | |||||||||||||||||||||||
Professional and other | 2,555 | 3,034 | 2,556 | 2,690 | 2,546 | 3,149 | 2,615 | 2,709 | |||||||||||||||||||||||
Total revenue | 104,464 | 104,536 | 94,988 | 100,563 | 95,519 | 98,071 | 94,451 | 88,981 | |||||||||||||||||||||||
Cost of revenue | 46,518 | 46,311 | 42,115 | 39,927 | 37,506 | 38,111 | 37,340 | 35,364 | |||||||||||||||||||||||
Gross profit | 57,946 | 58,225 | 52,873 | 60,636 | 58,013 | 59,960 | 57,111 | 53,617 | |||||||||||||||||||||||
Operating expense: | |||||||||||||||||||||||||||||||
Product development | 16,108 | 17,528 | 15,941 | 14,841 | 13,641 | 13,232 | 11,727 | 12,038 | |||||||||||||||||||||||
Sales and marketing | 27,593 | 29,949 | 28,030 | 25,991 | 23,902 | 25,166 | 23,924 | 22,902 | |||||||||||||||||||||||
General and administrative | 16,011 | 15,443 | 16,819 | 20,929 | 15,730 | 15,554 | 12,819 | 16,507 | |||||||||||||||||||||||
Total operating expense | 59,712 | 62,920 | 60,790 | 61,761 | 53,273 | 53,952 | 48,470 | 51,447 | |||||||||||||||||||||||
Operating (loss) income | (1,766 | ) | (4,695 | ) | (7,917 | ) | (1,125 | ) | 4,740 | 6,008 | 8,641 | 2,170 | |||||||||||||||||||
Interest expense and other, net | (333 | ) | (345 | ) | (204 | ) | (222 | ) | (156 | ) | (236 | ) | (596 | ) | (89 | ) | |||||||||||||||
Net (loss) income before income taxes | (2,099 | ) | (5,040 | ) | (8,121 | ) | (1,347 | ) | 4,584 | 5,772 | 8,045 | 2,081 | |||||||||||||||||||
Income tax (benefit) expense | (2,209 | ) | (1,783 | ) | (1,830 | ) | (511 | ) | 2,406 | (7,114 | ) | 3,435 | 1,063 | ||||||||||||||||||
Net income (loss) | $ | 110 | $ | (3,257 | ) | $ | (6,291 | ) | $ | (836 | ) | $ | 2,178 | $ | 12,886 | $ | 4,610 | $ | 1,018 | ||||||||||||
Net income (loss) per share: | |||||||||||||||||||||||||||||||
Basic | $ | 0.00 | $ | (0.04 | ) | $ | (0.08 | ) | $ | (0.01 | ) | $ | 0.03 | $ | 0.17 | $ | 0.06 | $ | 0.01 | ||||||||||||
Diluted | $ | 0.00 | $ | (0.04 | ) | $ | (0.08 | ) | $ | (0.01 | ) | $ | 0.03 | $ | 0.17 | $ | 0.06 | $ | 0.01 | ||||||||||||
The following table sets forth our results of operations for the specified periods as a percentage of our revenue for those periods. The period-to-period comparison of financial results is not necessarily indicative of future results.
57
Three Months Ended, | |||||||||||||||||||||||
December 31, 2014 | September 30, 2014 | June 30, 2014 | March 31, 2014 | December 31, 2013 | September 30, 2013 | June 30, 2013 | March 31, 2013 | ||||||||||||||||
(as a percentage of total revenue) | |||||||||||||||||||||||
Revenue: | |||||||||||||||||||||||
On demand | 97.0 | % | 96.4 | % | 96.4 | % | 96.5 | % | 96.4 | % | 95.9 | % | 96.1 | % | 95.9 | % | |||||||
On premise | 0.6 | 0.7 | 0.9 | 0.9 | 0.9 | 0.9 | 1.1 | 1.1 | |||||||||||||||
Professional and other | 2.4 | 2.9 | 2.7 | 2.6 | 2.7 | 3.2 | 2.8 | 3.0 | |||||||||||||||
Total revenue | 100.0 | 100.0 | 100.0 | 100.0 | 100.0 | 100.0 | 100.0 | 100.0 | |||||||||||||||
Cost of revenue: | |||||||||||||||||||||||
Software and services | 44.5 | 44.3 | 44.3 | 39.7 | 39.3 | 38.9 | 39.5 | 39.7 | |||||||||||||||
Gross profit | 55.5 | 55.7 | 55.7 | 60.3 | 60.7 | 61.1 | 60.5 | 60.3 | |||||||||||||||
Operating expense: | |||||||||||||||||||||||
Product development | 15.4 | 16.8 | 16.8 | 14.8 | 14.3 | 13.5 | 12.4 | 13.5 | |||||||||||||||
Sales and marketing | 26.4 | 28.6 | 29.5 | 25.8 | 25.0 | 25.7 | 25.4 | 25.7 | |||||||||||||||
General and administrative | 15.4 | 14.8 | 17.7 | 20.8 | 16.4 | 15.9 | 13.6 | 18.7 | |||||||||||||||
Total operating expenses | 57.2 | 60.2 | 64.0 | 61.4 | 55.7 | 55.1 | 51.4 | 57.9 | |||||||||||||||
Operating (loss) income | (1.7 | ) | (4.5 | ) | (8.3 | ) | (1.1 | ) | 5.0 | 6.0 | 9.1 | 2.4 | |||||||||||
Interest expense and other, net | (0.3 | ) | (0.3 | ) | (0.2 | ) | (0.2 | ) | (0.1 | ) | (0.2 | ) | (0.6 | ) | (0.1 | ) | |||||||
Net (loss) income before taxes | (2.0 | ) | (4.8 | ) | (8.5 | ) | (1.3 | ) | 4.9 | 5.8 | 8.5 | 2.3 | |||||||||||
Income tax (benefit) expense | (2.1 | ) | (1.7 | ) | (1.9 | ) | (0.5 | ) | 2.5 | (7.3 | ) | 3.6 | 1.2 | ||||||||||
Net income (loss) | 0.1 | % | (3.1 | )% | (6.6 | )% | (0.8 | )% | 2.4 | % | 13.1 | % | 4.9 | % | 1.1 | % | |||||||
Reconciliation of Quarterly Non-GAAP Financial Measures
Our investor and analyst presentations include Adjusted EBITDA. We define this metric as net (loss) income plus acquisition-related and other deferred revenue adjustments, depreciation and asset impairment, loss on sale of assets, amortization of intangible assets, net interest expense; income tax (benefit) expense, stock-based compensation expense, any impact related to Yardi litigation (including related insurance litigation and settlement costs) and acquisition-related expense. We believe that the use of Adjusted EBITDA is useful to investors and other users of our financial statements in evaluating our operating performance because it provides them with an additional tool to compare business performance across companies and across periods. We believe that:
• | Adjusted EBITDA provides investors and other users of our financial information consistency and comparability with our past financial performance, facilitates period-to-period comparisons of operations and facilitates comparisons with our peer companies, many of which use similar non-GAAP financial measures to supplement their GAAP results; |
• | it is useful to exclude certain non-cash charges, such as depreciation and asset impairment, amortization of intangible assets and stock-based compensation and non-core operational charges, such as acquisition-related expenses and any impact related to the Yardi litigation (including related insurance litigation and settlement costs), from Adjusted EBITDA because the amount of such expenses in any specific period may not directly correlate to the underlying performance of our business operations and these expenses can vary significantly between periods as a result of new acquisitions, full amortization of previously acquired tangible and intangible assets or the timing of new stock-based awards, as the case may be; and |
• | it is useful to include deferred revenue written down for GAAP purposes under purchase accounting rules and revenue deferred due to a lack of historical experience in determining the settlement of the contractual obligation in order to appropriately measure the underlying performance of our business operations in the period of activity and associated expense. |
We use Adjusted EBITDA in conjunction with traditional GAAP operating performance measures as part of our overall assessment of our performance, for planning purposes, including the preparation of our annual operating budget, to evaluate the effectiveness of our business strategies and to communicate with our board of directors concerning our financial performance.
We do not place undue reliance on Adjusted EBITDA as our only measure of operating performance. Adjusted EBITDA should not be considered as a substitute for other measures of liquidity or financial performance reported in accordance with GAAP. There are limitations to using non-GAAP financial measures, including that other companies may calculate these measures differently than we do, that they do not reflect our capital expenditures or future requirements for capital expenditures and that they do not reflect changes in, or cash requirements for, our working capital. We compensate for the inherent
58
limitations associated with using the Adjusted EBITDA measures through disclosure of these limitations, presentation of our financial statements in accordance with GAAP and reconciliation of Adjusted EBITDA to the most directly comparable GAAP measure, (loss) net income.
The following table presents a reconciliation of net (loss) income to Adjusted EBITDA for the eight fiscal quarters ended December 31, 2014:
Three Months Ended, | |||||||||||||||||||||||||||||||
December 31, 2014 | September 30, 2014 | June 30, 2014 | March 31, 2014 | December 31, 2013 | September 30, 2013 | June 30, 2013 | March 31, 2013 | ||||||||||||||||||||||||
(in thousands) | |||||||||||||||||||||||||||||||
Net income (loss) | $ | 110 | $ | (3,257 | ) | $ | (6,291 | ) | $ | (836 | ) | $ | 2,178 | $ | 12,886 | $ | 4,610 | $ | 1,018 | ||||||||||||
Acquisition-related and other deferred revenue | (290 | ) | (392 | ) | (207 | ) | 1,324 | 922 | 1,793 | — | 2 | ||||||||||||||||||||
Depreciation, loss on disposal and impairment of assets | 5,377 | 5,121 | 4,581 | 4,209 | 3,925 | 3,400 | 3,398 | 3,688 | |||||||||||||||||||||||
Amortization of intangible assets | 5,746 | 5,857 | 5,486 | 5,315 | 5,001 | 4,242 | 4,292 | 4,113 | |||||||||||||||||||||||
Interest expense, net | 337 | 349 | 207 | 224 | 228 | 236 | 606 | 357 | |||||||||||||||||||||||
Income tax (benefit) expense | (2,209 | ) | (1,783 | ) | (1,830 | ) | (511 | ) | 2,406 | (7,114 | ) | 3,435 | 1,063 | ||||||||||||||||||
Litigation related expense | 31 | 39 | 168 | 4,677 | 330 | 278 | (353 | ) | 406 | ||||||||||||||||||||||
Stock-based compensation expense | 8,256 | 9,536 | 10,033 | 9,225 | 8,655 | 7,736 | 6,061 | 7,245 | |||||||||||||||||||||||
Acquisition-related expense | (111 | ) | 860 | 357 | 881 | 1,156 | 288 | (949 | ) | 2,774 | |||||||||||||||||||||
Adjusted EBITDA | $ | 17,247 | $ | 16,330 | $ | 12,504 | $ | 24,508 | $ | 24,801 | $ | 23,745 | $ | 21,100 | $ | 20,666 | |||||||||||||||
Liquidity and Capital Resources
Our primary sources of liquidity as of December 31, 2014 consisted of $26.9 million of cash and cash equivalents, a remaining $180.0 million available under our revolving line of credit and $47.7 million of current assets less current liabilities (excluding $26.9 million of cash and cash equivalents and $73.5 million of deferred revenue).
Our principal uses of liquidity have been to fund our operations, working capital requirements, capital expenditures and acquisitions and to service our debt obligations. We expect that working capital requirements, capital expenditures and acquisitions will continue to be our principal needs for liquidity over the near term. In addition, we have made several acquisitions in which a portion of the cash purchase price is payable at various times through 2016. We expect to fund these obligations from cash provided by operating activities or, in some cases, the issuance of shares of our common stock at our election.
We believe that our existing cash and cash equivalents, working capital (excluding deferred revenue and cash and cash equivalents) and our cash flow from operations will be sufficient to fund our operations and planned capital expenditures and service our debt obligations for at least the next 12 months. Our future capital requirements will depend on many factors, including our rate of revenue growth, the timing and size of acquisitions, the expansion of our sales and marketing activities, the timing and extent of spending to support product development efforts, the timing of introductions of new solutions and enhancements to existing solutions and the continuing market acceptance of our solutions. We may enter into acquisitions of complementary businesses, applications or technologies in the future, which could require us to seek additional equity or debt financing. Additional funds may not be available on terms favorable to us, or at all. As of December 31, 2014, we have federal and state net operating loss carryforwards of $183.8 million and $7.3 million, respectively. These carryforwards may be available to offset potential payments of future federal and state income tax liabilities and, if unused, expire at various dates through 2033 for both federal and state income tax purposes.
59
The following table sets forth cash flow data for the periods indicated therein:
Year Ended December 31, | ||||||||||||
2014 | 2013 | 2012 | ||||||||||
Net cash provided by operating activities | $ | 69,972 | $ | 69,209 | $ | 58,412 | ||||||
Net cash used in investing activities | (79,269 | ) | (62,108 | ) | (32,776 | ) | ||||||
Net cash provided by (used in) financing activities | 1,778 | (6,349 | ) | (43,054 | ) | |||||||
Net Cash Provided by Operating Activities
In 2014, we generated $70.0 million of net cash from operating activities representing an increase compared to 2013. Our net cash from operating activities consisted of our net loss of $10.3 million, net non-cash charges of $68.8 million and an increase in cash flows from working capital of $11.5 million. The increase in cash flows from working capital is due to an increase in deferred revenue of $8.4 million, an increase in accounts payable and accrued liabilities of $3.8 million, a decrease in accounts receivable of $1.9 million and an increase in other liabilities of $0.3 million. These changes were partially offset by an increase in other assets of $2.9 million.
In 2013, we generated $69.2 million of net cash from operating activities representing an increase compared to 2012. Our net cash from operating activities consisted of our net income of $20.7 million, net non-cash charges of $63.0 million, partially offset by a deferred tax benefit of $2.5 million resulting from the reversal of our valuation allowance and a $12.0 million decrease in cash flows from working capital. Use of operating cash flows from working capital activities related to changes in accounts receivable and accrued compensation offset by lower accounts payable.
In 2012, we generated $58.4 million of net cash from operating activities representing an increase compared to 2011. Our net cash from operating activities consisted of our net income of $5.2 million, net non-cash charges of $50.6 million and $0.1 million from changes in cash flows from working capital. Net non-cash charges to income primarily consisted of depreciation, amortization and stock-based compensation expense. The $0.1 million provided by cash flows from working capital was primarily due to a decrease in other assets and increases in deferred revenue and accrued compensation and benefits, offset by increases in accounts receivable and decreases in accounts payable.
Net Cash Used in Investing Activities
In 2014, our investing activities used $79.3 million. Cash used in investing activities included $42.2 million related to our 2014 acquisition activity and $37.1 million for capital expenditures related primarily to investments in technology infrastructure to support growth initiatives. Cash used in investing activities increased as compared to 2013 due to an increase in consideration paid in connection with our acquisition activity in the amount of $13.1 million and an increase in capital expenditures in the amount of $4.1 million.
In 2013, our investing activities used $62.1 million. Cash used in investing activities consisted of acquisition consideration of $28.2 million for our 2013 acquisitions and $33.8 million of capital expenditures related to investments in technology infrastructure to support our growth initiatives. The increase in cash used in investing activities from 2012 relates to the consideration paid, net of cash acquired, for our 2013 acquisitions combined with an increase in capital spending.
In 2012, cash used in investing activities consisted of acquisition consideration of $10.6 million, net of cash acquired, for our 2012 acquisitions and $22.2 million of capital expenditures and intangible asset purchases. The decrease in cash used in investing activities for 2012 relates to lower acquisition related payments in 2012 compared to 2011.
Capital expenditures as of December 31, 2014, 2013 and 2012 were primarily related to investments in technology infrastructure to support our growth initiatives.
Net Cash Used in Financing Activities
Our financing activities resulted in a net $1.8 million increase in cash in 2014. Cash provided by financing activities during 2014 primarily consisted of borrowings, net of payments, on our revolving line of credit of $20.0 million and $5.5 million in net proceeds related to issuances of common stock under our stock-based compensation plans. These proceeds were partially offset by expenditures of $15.5 million related to the re-acquisition of common stock under the stock repurchase program, $6.4 million in payments of acquisition-related contingent consideration, expenditures related to the origination of our 2014 revolving line of credit in the amount of $1.2 million and capital lease payments of $0.6 million.
Our financing activities used $6.3 million in 2013. Cash used by financing activities during 2013 was primarily related to payments of $10.0 million on our revolving line of credit, capital lease payments of $0.5 million and $1.5 million in payments of acquisition-related contingent consideration. These changes were partially offset by $5.7 million in net proceeds from issuances of common stock under our stock-based compensation plans.
60
Our financing activities used $43.1 million in 2012, representing an increase of $34.9 million, as compared to 2011. Cash used by financing activities during 2012 was primarily related to payments on our revolving credit facility of $40.3 million, payments of $11.6 million for acquisition-related consideration and capital lease payments of $0.1 million. These increases were offset by $8.9 million in proceeds from the issuance of common stock.
Contractual Obligations, Commitments and Contingencies
The following table summarizes, as of December 31, 2014, our minimum payments for long-term debt and other obligations for the next five years and thereafter:
Payments Due by Period | ||||||||||||||||||||
Total | Less Than 1 year | 1-3 years | 3-5 years | More Than 5 years | ||||||||||||||||
(in thousands) | ||||||||||||||||||||
Secured revolving credit facility (1) | $ | 20,000 | $ | — | $ | — | $ | — | $ | 20,000 | ||||||||||
Capital (finance) leases | 882 | 588 | 294 | — | — | |||||||||||||||
Operating lease obligations(2) | 34,658 | 11,838 | 18,127 | 4,693 | — | |||||||||||||||
Acquisition-related liabilities(3) | 13,952 | 4,114 | 9,838 | — | — | |||||||||||||||
$ | 69,492 | $ | 16,540 | $ | 28,259 | $ | 4,693 | $ | 20,000 | |||||||||||
(1) | Amounts borrowed on the secured revolving credit facility are due at maturity, September 30, 2019. |
(2) | Net of sublease income |
(3) | We have made several acquisitions in which a portion of the cash purchase price is payable at various times through 2016. |
Long-Term Debt Obligations
On September 30, 2014, we entered into a new agreement for a secured revolving credit facility to refinance our outstanding revolving loans. The new credit facility provides an aggregate principal amount of up to $200.0 million, with sublimits of $10.0 million for the issuance of letters of credit and for $20.0 million of swingline loans. The credit facility also allows us, subject to certain conditions, to request additional term loans or revolving commitments in an aggregate principal amount of up to $150.0 million, plus an amount that would not cause our consolidated net leverage ratio to exceed 3.25 to 1.00. Advances under the credit facility may be voluntarily prepaid and re-borrowed. At our option, the revolving loans accrue interest at a per annum rate equal to either LIBOR, plus a margin ranging from 1.25% to 1.75%, or the Base Rate, plus a margin ranging from 0.25% to 0.75%. The Base Rate is defined as the greater of Wells Fargo's prime rate, the Federal Funds Rate plus 0.50% or one month LIBOR plus 1.00%. In each case, the applicable margin is determined based upon our consolidated net leverage ratio. The interest is due and payable quarterly, in arrears, for loans bearing interest at the Base Rate and at the end of the applicable interest period in the case of loans bearing interest at the adjusted LIBOR rate. All outstanding principal and accrued and unpaid interest is due upon the credit facility's maturity, September 30, 2019. The credit facility is secured by substantially all of the Company’s assets and certain of our existing and future material domestic subsidiaries are required to guaranty our obligations under the credit facility.
Our previous secured revolving credit facility had an aggregate principal amount of up to $150.0 million, subject to a borrowing formula, with a sublimit of $10.0 million for the issuance of letters of credit on our behalf. At our option, the borrowings accrued interest at a per annum rate equal to either LIBOR or Wells Fargo’s prime rate (or, if greater, the Federal Funds Rate plus 0.50% or three month LIBOR plus 1.00%), in each case plus a margin ranging from 2.00% to 2.50%, in the case of LIBOR loans, and 0.0% to 0.25% in the case of prime rate loans, in each case based upon our senior leverage ratio. The interest was due and payable monthly, in arrears, for loans bearing interest at the prime rate and at the end of the applicable 1-, 2-, or 3-month interest period in the case of loans bearing interest at the adjusted LIBOR rate.
The previous credit facility was amended in May and June 2014 to permit us to repurchase $75.0 million of our common stock, subject to certain conditions; modify certain of the financial covenants we were subject to under the agreement and permit the acquisition of Kigo as a "Permitted Acquisition", as defined in the credit facility.
All of our obligations under the credit facility are secured by substantially all of our assets. All of our existing and future domestic subsidiaries are required to guaranty our obligations under the credit facility, other than certain immaterial subsidiaries, foreign subsidiary holding companies, and our payment processing subsidiaries. Such guarantees by existing and future domestic subsidiaries are and will be secured by substantially all of the assets of such subsidiaries.
Our credit facility contains customary covenants, subject in each case to customary exceptions and qualifications, which limit our and certain of our subsidiaries’ ability to, among other things, incur additional indebtedness or guarantee indebtedness of others; create liens on our assets; enter into mergers or consolidations; dispose of assets; prepay certain indebtedness or make changes to our governing documents and certain of our agreements; pay dividends and make other distributions on our capital stock, and redeem and repurchase our capital stock; make investments, including acquisitions; and enter into transactions with
61
affiliates. Our credit facility additionally contains customary affirmative covenants. We are also required to comply with a maximum consolidated net leverage ratio and a minimum interest coverage ratio. The interest coverage ratio, which is a ratio of our four previous fiscal consecutive quarters' consolidated EBITDA to our interest expense, is to be not less than 3.00 to 1.00 as of the last day of any fiscal quarter. The consolidated net leverage ratio, which is the ratio of funded indebtedness on the last day of each fiscal quarter to the four previous consecutive fiscal quarters' consolidated EBITDA, is not to be greater than 3.50 to 1.00, provided that we can elect to increase the ratio to 3.75 to 1.00 for a specified period following a permitted acquisition. As of December 31, 2014, we were in compliance with the covenants under our credit facility.
The credit facility contains customary events of default, subject to customary cure periods for certain defaults, that include, among others, non-payment defaults, covenant defaults, material judgment defaults, bankruptcy and insolvency defaults, cross-defaults to certain other material indebtedness, ERISA defaults, inaccuracy of representations and warranties, and a change in control default.
In the event of a default on our credit facility, the obligations under the credit facility could be accelerated, the applicable interest rate under the credit facility could be increased, the loan commitments could be terminated, our subsidiaries that have guaranteed the credit facility could be required to pay the obligations in full, and our lenders would be permitted to exercise remedies with respect to all of the collateral that is securing the credit facility, including substantially all of our and our subsidiary guarantors’ assets. Any such default that is not cured or waived could have a material adverse effect on our liquidity and financial condition.
Share Repurchase Program
Our Board of Directors approved a $50.0 million initial share repurchase program during the second quarter of 2014 and continuing for a period of up to one year. During 2014, we repurchased 966,595 shares of our common stock at a weighted average cost of $16.06 per share and a total cost of approximately $15.5 million.
Off-Balance Sheet Arrangements
We do not have any off-balance sheet financing arrangements and we do not have any relationships with unconsolidated entities or financial partnerships, such as entities often referred to as structured finance or special purpose entities, which have been established for the purpose of facilitating off-balance sheet arrangements or other contractually narrow or limited purposes.
Item 7A. | Quantitative and Qualitative Disclosures about Market Risk |
Market risk represents the risk of loss that may impact our financial position due to adverse changes in financial market prices and rates. Our market risk exposure is primarily a result of fluctuations in interest rates. We do not hold or issue financial instruments for trading purposes.
We had cash and cash equivalents of $26.9 million and $34.5 million at December 31, 2014 and 2013, respectively.
We hold cash and cash equivalents for working capital purposes. We do not have material exposure to market risk with respect to investments, as our investments consist primarily of highly liquid investments purchased with original maturities of three months or less. We do not use derivative financial instruments for speculative or trading purposes; however, we may adopt specific hedging strategies in the future. Any declines in interest rates, however, will reduce future interest income.
We had amounts outstanding under the revolving credit facility of $20.0 million at December 31, 2014. We had no amounts outstanding under the revolving credit facility at December 31, 2013.
62
Item 8. | Financial Statements and Supplementary Data |
INDEX TO CONSOLIDATED FINANCIAL STATEMENTS
Page | |
Reports of Ernst & Young LLP, Independent Registered Public Accounting Firm | |
Consolidated Balance Sheets | |
Consolidated Statements of Operations | |
Consolidated Statements of Comprehensive (Loss) Income | |
Consolidated Statements of Stockholders’ Equity | |
Consolidated Statements of Cash Flows | |
Notes to Consolidated Financial Statements | |
63
Report of Independent Registered Public Accounting Firm
The Board of Directors and Shareholders
RealPage, Inc.
We have audited the accompanying consolidated balance sheets of RealPage, Inc. (the “Company”) as of December 31, 2014 and 2013, and the related consolidated statements of operations, comprehensive (loss) income, stockholders’ equity and cash flows for each of the three years in the period ended December 31, 2014. Our audits also included the financial statement schedule listed in the index under Item 15(c). These financial statements and schedule are the responsibility of the Company’s management. Our responsibility is to express an opinion on these financial statements and schedule based on our audits.
We conducted our audits in accordance with the standards of the Public Company Accounting Oversight Board (United States). Those standards require that we plan and perform the audit to obtain reasonable assurance about whether the financial statements and schedule are free of material misstatement. An audit also includes examining, on a test basis, evidence supporting the amounts and disclosures in the financial statements. An audit also includes assessing the accounting principles used and significant estimates made by management, as well as evaluating the overall financial statement presentation. We believe that our audits provide a reasonable basis for our opinion.
In our opinion, the financial statements referred to above present fairly, in all material respects, the consolidated financial position of RealPage, Inc. at December 31, 2014 and 2013 and the consolidated results of its operations and its cash flows for each of the three years in the period ended December 31, 2014 in conformity with U.S. generally accepted accounting principles. Also, in our opinion, the related financial statement schedule, when considered in relation to the basic financial statements taken as a whole, presents fairly in all material respects, the information set forth therein.
We also have audited, in accordance with the standards of the Public Company Accounting Oversight Board (United States), the Company’s internal control over financial reporting as of December 31, 2014, based on criteria established in Internal Control-Integrated Framework issued by the Committee of Sponsoring Organizations of the Treadway Commission (1992 framework) and our report dated March 2, 2015 expressed an unqualified opinion thereon.
/s/ Ernst & Young LLP
Dallas, Texas
March 2, 2015
64
Report of Independent Registered Public Accounting Firm
The Board of Directors and Shareholders
RealPage, Inc.
We have audited RealPage, Inc.’s (the Company) internal control over financial reporting as of December 31, 2014, based on criteria established in Internal Control—Integrated Framework issued by the Committee of Sponsoring Organizations of the Treadway Commission (1992 framework)(the COSO criteria). The Company’s management is responsible for maintaining effective internal control over financial reporting and for its assessment of the effectiveness of internal control over financial reporting included in the accompanying “Management’s Report on Internal Control over Financial Reporting.” Our responsibility is to express an opinion on the Company’s internal control over financial reporting based on our audit.
We conducted our audit in accordance with the standards of the Public Company Accounting Oversight Board (United States). Those standards require that we plan and perform the audit to obtain reasonable assurance about whether effective internal control over financial reporting was maintained in all material respects. Our audit included obtaining an understanding of internal control over financial reporting, assessing the risk that a material weakness exists, testing and evaluating the design and operating effectiveness of internal control based upon the assessed risk, and performing such other procedures as we considered necessary in the circumstances. We believe that our audit provides a reasonable basis for our opinion.
A company’s internal control over financial reporting is a process designed to provide reasonable assurance regarding the reliability of financial reporting and the preparation of financial statements for external purposes in accordance with generally accepted accounting principles. A company’s internal control over financial reporting includes those policies and procedures that (1) pertain to the maintenance of records that, in reasonable detail, accurately and fairly reflect the transactions and dispositions of the assets of the company; (2) provide reasonable assurance that transactions are recorded as necessary to permit preparation of financial statements in accordance with generally accepted accounting principles, and that receipts and expenditures of the company are being made only in accordance with authorizations of management and directors of the company; and (3) provide reasonable assurance regarding prevention or timely detection of unauthorized acquisition, use, or disposition of the company’s assets that could have a material effect on the financial statements.
Because of its inherent limitations, internal control over financial reporting may not prevent or detect misstatements. Also, projections of any evaluation of effectiveness to future periods are subject to the risk that controls may become inadequate because of changes in conditions, or that the degree of compliance with the policies or procedures may deteriorate.
In our opinion, RealPage, Inc. maintained, in all material respects, effective internal control over financial reporting as of December 31, 2014, based on the COSO criteria.
We also have audited, in accordance with the standards of the Public Company Accounting Oversight Board (United States), the consolidated balance sheets of the Company as of December 31, 2014 and 2013, the related consolidated statements of operations, comprehensive (loss) income, and stockholders’ equity and cash flows for each of the three years in the period ended December 31, 2014 of the Company and our report dated March 2, 2015 expressed an unqualified opinion thereon.
/s/ Ernst & Young LLP
Dallas, Texas
March 2, 2015
65
RealPage, Inc.
Consolidated Balance Sheets
(in thousands, except share amounts)
December 31, | ||||||||
2014 | 2013 | |||||||
Assets | ||||||||
Current assets: | ||||||||
Cash and cash equivalents | $ | 26,936 | $ | 34,502 | ||||
Restricted cash | 85,543 | 71,941 | ||||||
Accounts receivable, less allowance for doubtful accounts of $2,363 and $914 at December 31, 2014 and 2013, respectively | 64,845 | 66,635 | ||||||
Deferred tax asset, net | 10,996 | 3,284 | ||||||
Other current assets | 9,495 | 7,453 | ||||||
Total current assets | 197,815 | 183,815 | ||||||
Property, equipment and software, net | 72,616 | 54,775 | ||||||
Goodwill | 193,378 | 152,422 | ||||||
Identified intangible assets, net | 100,085 | 108,815 | ||||||
Deferred tax asset, net | 2,537 | — | ||||||
Other assets | 5,059 | 3,386 | ||||||
Total assets | $ | 571,490 | $ | 503,213 | ||||
Liabilities and stockholders’ equity | ||||||||
Current liabilities: | ||||||||
Accounts payable | $ | 14,830 | $ | 11,978 | ||||
Accrued expenses and other current liabilities | 22,905 | 23,122 | ||||||
Current portion of deferred revenue | 73,485 | 66,085 | ||||||
Customer deposits held in restricted accounts | 85,489 | 71,910 | ||||||
Total current liabilities | 196,709 | 173,095 | ||||||
Deferred revenue | 6,903 | 5,671 | ||||||
Deferred tax liability, net | 5,196 | 1,379 | ||||||
Revolving credit facility | 20,000 | — | ||||||
Other long-term liabilities | 13,902 | 8,564 | ||||||
Total liabilities | 242,710 | 188,709 | ||||||
Commitments and contingencies (Note 8) | ||||||||
Stockholders’ equity: | ||||||||
Preferred stock, $0.001 par value: 10,000,000 shares authorized and zero shares issued and outstanding at December 31, 2014 and 2013, respectively | — | — | ||||||
Common stock, $0.001 par value: 125,000,000 shares authorized, 83,211,650 and 80,511,791 shares issued and 79,037,351 and 78,433,626 shares outstanding at December 31, 2014 and 2013, respectively | 83 | 81 | ||||||
Additional paid-in capital | 437,664 | 390,854 | ||||||
Treasury stock, at cost: 4,174,299 and 2,078,165 shares at December 31, 2014 and 2013, respectively | (33,398 | ) | (11,183 | ) | ||||
Accumulated deficit | (75,360 | ) | (65,086 | ) | ||||
Accumulated other comprehensive loss | (209 | ) | (162 | ) | ||||
Total stockholders’ equity | 328,780 | 314,504 | ||||||
Total liabilities and stockholders’ equity | $ | 571,490 | $ | 503,213 | ||||
See accompanying notes
66
RealPage, Inc.
Consolidated Statements of Operations
(in thousands, except per share amounts)
Year Ended December 31, | ||||||||||||
2014 | 2013 | 2012 | ||||||||||
Revenue: | ||||||||||||
On demand | $ | 390,622 | $ | 362,312 | $ | 306,400 | ||||||
On premise | 3,094 | 3,691 | 5,216 | |||||||||
Professional and other | 10,835 | 11,019 | 10,556 | |||||||||
Total revenue | 404,551 | 377,022 | 322,172 | |||||||||
Cost of revenue | 174,871 | 148,321 | 128,562 | |||||||||
Gross profit | 229,680 | 228,701 | 193,610 | |||||||||
Operating expense: | ||||||||||||
Product development | 64,418 | 50,638 | 48,177 | |||||||||
Sales and marketing | 111,563 | 95,894 | 76,992 | |||||||||
General and administrative | 69,202 | 60,610 | 56,993 | |||||||||
Total operating expense | 245,183 | 207,142 | 182,162 | |||||||||
Operating (loss) income | (15,503 | ) | 21,559 | 11,448 | ||||||||
Interest expense and other, net | (1,104 | ) | (1,077 | ) | (2,046 | ) | ||||||
(Loss) income before income taxes | (16,607 | ) | 20,482 | 9,402 | ||||||||
Income tax (benefit) expense | (6,333 | ) | (210 | ) | 4,219 | |||||||
Net (loss) income | $ | (10,274 | ) | $ | 20,692 | $ | 5,183 | |||||
Net (loss) income per share attributable to common stockholders | ||||||||||||
Basic | $ | (0.13 | ) | $ | 0.28 | $ | 0.07 | |||||
Diluted | $ | (0.13 | ) | $ | 0.27 | $ | 0.07 | |||||
Weighted average shares used in computing net (loss) income per share attributable to common stockholders | ||||||||||||
Basic | 76,991 | 74,962 | 71,838 | |||||||||
Diluted | 76,991 | 76,187 | 74,002 | |||||||||
See accompanying notes
67
RealPage, Inc.
Consolidated Statements of Comprehensive (Loss) Income
(in thousands)
Year Ended December 31, | ||||||||||||
2014 | 2013 | 2012 | ||||||||||
Net (loss) income | $ | (10,274 | ) | $ | 20,692 | $ | 5,183 | |||||
Other comprehensive loss – foreign currency translation adjustment | (47 | ) | (54 | ) | (51 | ) | ||||||
Comprehensive (loss) income | $ | (10,321 | ) | $ | 20,638 | $ | 5,132 | |||||
68
RealPage, Inc.
Consolidated Statements of Stockholders’ Equity
(in thousands)
Accumulated | ||||||||||||||||||||||||||||||
Common Stock | Additional Paid-in | Other Comprehensive | Accumulated | Treasury Stock | Total Stockholders’ | |||||||||||||||||||||||||
Shares | Amount | Capital | Loss | Deficit | Shares | Amount | Equity | |||||||||||||||||||||||
Balance as of January 1, 2012 | 73,116 | $ | 73 | $ | 316,964 | $ | (57 | ) | $ | (90,961 | ) | (414 | ) | $ | (3,138 | ) | $ | 222,881 | ||||||||||||
Exercise of stock options | 2,389 | 4 | 12,061 | — | — | — | — | 12,065 | ||||||||||||||||||||||
Issuance of restricted stock | 1,508 | — | — | — | — | (772 | ) | (3,185 | ) | (3,185 | ) | |||||||||||||||||||
Stock-based compensation | — | 18,178 | — | — | — | — | 18,178 | |||||||||||||||||||||||
Foreign currency translation | — | — | — | (51 | ) | — | — | — | (51 | ) | ||||||||||||||||||||
Net income | — | — | — | — | 5,183 | — | — | 5,183 | ||||||||||||||||||||||
Balance as of December 31, 2012 | 77,013 | 77 | 347,203 | (108 | ) | (85,778 | ) | (1,186 | ) | (6,323 | ) | 255,071 | ||||||||||||||||||
Exercise of stock options | 1,557 | — | 10,604 | — | — | — | — | 10,604 | ||||||||||||||||||||||
Issuance of restricted stock | 1,847 | 4 | — | — | — | (892 | ) | (4,860 | ) | (4,856 | ) | |||||||||||||||||||
Issuance of common stock | 95 | — | 3,350 | — | — | — | — | 3,350 | ||||||||||||||||||||||
Stock-based compensation | — | — | 29,697 | — | — | — | — | 29,697 | ||||||||||||||||||||||
Foreign currency translation | — | — | — | (54 | ) | — | — | — | (54 | ) | ||||||||||||||||||||
Net income | — | — | — | — | 20,692 | — | — | 20,692 | ||||||||||||||||||||||
Balance as of December 31, 2013 | 80,512 | 81 | 390,854 | (162 | ) | (65,086 | ) | (2,078 | ) | (11,183 | ) | 314,504 | ||||||||||||||||||
Exercise of stock options | 908 | — | 9,912 | — | — | — | — | 9,912 | ||||||||||||||||||||||
Issuance of restricted stock | 1,758 | 2 | — | — | — | (1,130 | ) | (6,694 | ) | (6,692 | ) | |||||||||||||||||||
Issuance of common stock | 34 | — | — | — | — | — | — | — | ||||||||||||||||||||||
Treasury stock purchased, at cost | — | — | — | — | — | (966 | ) | (15,521 | ) | (15,521 | ) | |||||||||||||||||||
Stock-based compensation | — | — | 37,050 | — | — | — | — | 37,050 | ||||||||||||||||||||||
Excess tax benefit from stock options | — | — | 2,248 | — | — | — | — | 2,248 | ||||||||||||||||||||||
Acquisition-related contingent consideration | — | — | (2,400 | ) | — | — | — | — | (2,400 | ) | ||||||||||||||||||||
Foreign currency translation | — | — | — | (47 | ) | — | — | — | (47 | ) | ||||||||||||||||||||
Net loss | — | — | — | — | (10,274 | ) | — | — | (10,274 | ) | ||||||||||||||||||||
Balance as of December 31, 2014 | 83,212 | $ | 83 | $ | 437,664 | $ | (209 | ) | $ | (75,360 | ) | (4,174 | ) | $ | (33,398 | ) | $ | 328,780 | ||||||||||||
See accompanying notes.
69
RealPage, Inc.
Consolidated Statements of Cash Flows
(in thousands)
Year Ended December 31, | ||||||||||||
2014 | 2013 | 2012 | ||||||||||
Cash flows from operating activities: | ||||||||||||
Net (loss) income | $ | (10,274 | ) | $ | 20,692 | $ | 5,183 | |||||
Adjustments to reconcile net (loss) income to net cash provided by operating activities: | ||||||||||||
Depreciation and amortization | 41,306 | 31,745 | 32,469 | |||||||||
Deferred tax (benefit) expense | (7,891 | ) | (2,503 | ) | 2,624 | |||||||
Stock-based compensation | 37,050 | 29,697 | 18,178 | |||||||||
Excess tax benefit from stock options | (2,248 | ) | — | — | ||||||||
Loss on disposal and impairment of assets | 386 | 314 | 568 | |||||||||
Acquisition-related contingent consideration | 173 | 1,284 | (722 | ) | ||||||||
Changes in assets and liabilities, net of assets acquired and liabilities assumed in business combinations: | ||||||||||||
Accounts receivable | 1,929 | (13,669 | ) | (7,681 | ) | |||||||
Customer deposits | (23 | ) | — | 50 | ||||||||
Other current assets | (2,340 | ) | (341 | ) | 3,775 | |||||||
Other assets | (592 | ) | (330 | ) | (359 | ) | ||||||
Accounts payable | 1,821 | 1,765 | (2,763 | ) | ||||||||
Accrued compensation, taxes and benefits | 1,964 | (1,259 | ) | 2,505 | ||||||||
Deferred revenue | 8,443 | 969 | 3,977 | |||||||||
Other current and long-term liabilities | 268 | 845 | 608 | |||||||||
Net cash provided by operating activities | 69,972 | 69,209 | 58,412 | |||||||||
Cash flows from investing activities: | ||||||||||||
Purchases of property, equipment and software | (37,062 | ) | (32,952 | ) | (18,774 | ) | ||||||
Acquisition of businesses, net of cash acquired | (41,947 | ) | (28,229 | ) | (10,627 | ) | ||||||
Intangible asset additions | (260 | ) | (927 | ) | (3,375 | ) | ||||||
Net cash used in investing activities | (79,269 | ) | (62,108 | ) | (32,776 | ) | ||||||
Cash flows from financing activities: | ||||||||||||
Proceeds from revolving credit facility | 68,572 | — | — | |||||||||
Payments on revolving credit facility | (48,572 | ) | (10,000 | ) | (40,312 | ) | ||||||
Deferred financing costs | (1,188 | ) | — | — | ||||||||
Payments on capital lease obligations | (562 | ) | (548 | ) | (65 | ) | ||||||
Payments of deferred acquisition-related consideration | (6,419 | ) | (1,549 | ) | (11,557 | ) | ||||||
Issuance of common stock | 9,914 | 10,608 | 12,065 | |||||||||
Excess tax benefit from stock options | 2,248 | — | — | |||||||||
Purchase of treasury stock | (22,215 | ) | (4,860 | ) | (3,185 | ) | ||||||
Net cash provided by (used in) financing activities | 1,778 | (6,349 | ) | (43,054 | ) | |||||||
Net (decrease) increase in cash and cash equivalents | (7,519 | ) | 752 | (17,418 | ) | |||||||
Effect of exchange rate on cash | (47 | ) | (54 | ) | (51 | ) | ||||||
Cash and cash equivalents: | ||||||||||||
Beginning of period | 34,502 | 33,804 | 51,273 | |||||||||
End of period | $ | 26,936 | $ | 34,502 | $ | 33,804 | ||||||
70
Supplemental cash flow information: | ||||||||||||
Cash paid for interest | $ | 814 | $ | 974 | $ | 1,584 | ||||||
Cash paid for income taxes, net of refunds | $ | 512 | $ | 525 | $ | 510 | ||||||
Non-cash investing activities: | ||||||||||||
Accrued fixed assets | $ | 607 | $ | 779 | $ | 272 | ||||||
Non-cash financing activities: | ||||||||||||
Fixed assets acquired under capital lease | $ | — | $ | 1,976 | $ | — | ||||||
See accompanying notes.
71
RealPage, Inc.
Notes to Consolidated Financial Statements
1. The Company
RealPage, Inc., a Delaware corporation, and its subsidiaries, (the “Company” or “we” or “us”) is a provider of property management solutions that enable owners and managers of single family and a wide variety of multifamily rental property types to manage their marketing, pricing, screening, leasing, accounting, purchasing and other property operations. Our on demand software solutions are delivered through an integrated software platform that provides a single point of access and a shared repository of prospect, renter and property data. By integrating and streamlining a wide range of complex processes and interactions among the rental housing ecosystem of owners, managers, prospects, renters and service providers, our platform optimizes the property management process and improves the experience for all of these constituents. Our solutions enable property owners and managers to optimize revenues and reduce operating costs through higher occupancy, improved pricing methodologies, new sources of revenue from ancillary services, improved collections and more integrated and centralized processes.
2. Summary of Significant Accounting Policies
Basis of Presentation
The accompanying consolidated balance sheets as of December 31, 2014 and 2013 and the accompanying consolidated statements of operations, comprehensive (loss) income and cash flows for each of the three years ended December 31, 2014, 2013, and 2012 represent our financial position, results of operations and cash flows as of and for the periods then ended. The consolidated financial statements include the accounts of RealPage, Inc. and our wholly-owned subsidiaries. All material intercompany accounts and transactions have been eliminated in consolidation.
Segment and Geographic Information
Our chief operating decision maker is our Chief Executive Officer, who reviews financial information presented on a company-wide basis. As a result, we determined that the Company has a single reporting segment and operating unit structure.
Principally, all of our revenue for the years ended December 31, 2014, 2013, and 2012 was earned in the United States.
Net long-lived assets held were $66.5 million and $51.5 million in the United States, and $6.1 million and $3.3 million in our international subsidiaries at December 31, 2014 and 2013, respectively.
Use of Estimates
The preparation of financial statements in conformity with accounting principles generally accepted in the United States (“GAAP”) requires our management to make certain estimates and assumptions that affect the reported amounts of assets and liabilities and the disclosure of contingent assets and liabilities at the date of the financial statements, and the reported amounts of revenues and expenses during the reporting periods. Significant estimates include the allowance for doubtful accounts; the useful lives of intangible assets and the recoverability or impairment of tangible and intangible asset values; fair value measurements; purchase accounting allocations and contingent consideration; revenue and deferred revenue and related reserves; stock-based compensation and our effective income tax rate and the recoverability of deferred tax assets, which are based upon our expectations of future taxable income and allowable deductions. Actual results could differ from these estimates.
In the second quarter of 2013, we revised our estimated useful lives of our data processing equipment and internally developed software to more accurately reflect our use of these assets. The result of the change for the year ended December 31, 2013 was a $3.5 million increase in operating income, a $1.9 million increase in net income and an increase in basic and diluted earnings per share of $0.03. During the third quarter of 2013, we revised the length of our expected customer benefit of our license fees billed at the initial order date. The result of the change for the year ended December 31, 2013 was a $2.8 million increase in operating income, a $1.5 million increase in net income and an increase in basic and diluted earnings per share of $0.02.
Cash Equivalents
We consider all highly liquid investments with a maturity date, when purchased, of three months or less to be cash equivalents.
Concentrations of Credit Risk
Our cash accounts are maintained at various financial institutions and may, from time to time, exceed federally insured limits. The Company has not experienced any losses in such accounts.
72
Concentrations of credit risk with respect to accounts receivable result from substantially all of our customers being in the multifamily rental housing market. Our customers, however, are dispersed across different geographic areas. We do not require collateral from customers. We maintain an allowance for losses based upon the expected collectability of accounts receivable. Accounts receivable are written off upon determination of non-collectability following established Company policies based on the aging from the accounts receivable invoice date.
No single customer accounted for 10% or more of our revenue or accounts receivable for the years ended December 31, 2014, 2013 or 2012. Revenues for our largest customer were 4.9%, 3.4% and 2.2% of total revenues for the years ended December 31, 2014, 2013 and 2012, respectively.
Fair Value of Financial Instruments
Financial assets and liabilities with carrying amounts approximating fair value include cash and cash equivalents, restricted cash, accounts receivable, accounts payable and accrued expenses and other current liabilities. The carrying amount of these financial assets and liabilities approximates fair value because of their short maturities. The carrying amount of our other long-term liabilities approximates their fair value.
Fair Value Measurements
We measure certain financial assets and liabilities at fair value pursuant to a fair value hierarchy based on inputs to valuation techniques that are used to measure fair value that are either observable or unobservable. Observable inputs reflect assumptions market participants would use in pricing an asset or liability based on market data obtained from independent sources while unobservable inputs reflect a reporting entity’s pricing based upon its own market assumptions. See additional discussion of our fair value measurements at Footnote 14.
Accounts Receivable
For several of our solutions, we invoice customers prior to the period in which service is provided. Accounts receivable represent trade receivables from customers when we have invoiced for software solutions and/or services and we have not yet received payment. We present accounts receivable net of an allowance for doubtful accounts. We maintain an allowance for doubtful accounts for estimated losses resulting from the inability of customers to make required payments, or the customer canceling prior to the service being rendered. As a result, a portion of our allowance is for services not yet rendered and, therefore, is classified as an offset to deferred revenue, which does not have an effect on the statement of operations. In evaluating the sufficiency of the allowance for doubtful accounts we consider the current financial condition of the customer, the specific details of the customer account, the age of the outstanding balance, the current economic environment and historical credit trends. Any change in the assumptions used in analyzing a specific account receivable might result in an additional allowance for doubtful accounts being recognized in the period in which the change occurs. For certain transactions, we have met the requirements to recognize income in advance of physically invoicing the customer. In these instances, we record unbilled receivables for the amount that will be due from the customer upon invoicing. Receivable balances are charged off when all collection efforts have failed and management determines the balance is uncollectable. In the case of balances relating to services not yet rendered, the balance is charged off when the customer cancels the service or when we determine that the invoiced service will no longer be provided, whichever occurs first. During the years ended December 31, 2014, 2013 and 2012, we incurred bad debt expense of $1.5 million, $2.1 million and $0.8 million, respectively.
Property, Equipment and Software
Property, equipment and software are recorded at cost less accumulated depreciation and amortization, which are computed using the straight-line method over the following estimated useful lives:
Leasehold improvements | 1-10 years |
Data processing and communications equipment | 1-10 years |
Furniture, fixtures and other equipment | 1- 5 years |
Software | 1- 5 years |
Software includes purchased software and internally developed software. Leasehold improvements are depreciated over the shorter of the lease term or the estimated useful lives of the assets. Gains and losses from asset disposals are classified as general and administrative expenses in our statement of operations.
Business Combinations
When we acquire businesses, we allocate the total consideration paid to the fair value of the tangible assets, liabilities and identifiable intangible assets acquired. Any residual purchase consideration is recorded as goodwill. The allocation of the purchase price requires our management to make significant estimates in determining the fair values of assets acquired and liabilities assumed, in particular with respect to identified intangible assets. These estimates are based on the application of valuation models using historical experience and information obtained from the management of the acquired companies. These
73
estimates can include, but are not limited to, the cash flows that an asset is expected to generate in the future, the appropriate weighted-average cost of capital and the cost savings expected to be derived from acquiring an asset. These estimates are inherently uncertain and unpredictable. In addition, unanticipated events and circumstances may occur which may affect the accuracy or validity of these estimates. We include the fair value of contingent consideration to be paid within the total consideration allocated to the fair value of the assets acquired and liabilities assumed. This requires us to make estimates regarding the fair value of the amounts to be paid. Additionally, we, at times, provide for the payment of additional cash consideration to the extent certain targets are achieved in the future. The fair value of this contingent consideration is based on significant estimates and is initially recorded as purchase price. To the extent the fair value changes prior to distribution, these changes are reflected in the Consolidated Statement of Operations. We expense acquisition-related costs as incurred rather than including as a component of purchase price.
Impairment of Long-Lived Assets
We perform an impairment review of long-lived assets held and used whenever events or changes in circumstances indicate that the carrying value may not be recoverable. Factors we consider important that could trigger an impairment review include, but are not limited to, significant under-performance relative to projected future operating results, significant changes in the manner of our use of the acquired assets or our overall business and/or product strategies. When we determine that the carrying value of a long-lived asset may not be recoverable based upon the existence of one or more of these indicators, we determine the recoverability by comparing the carrying amount of the asset or asset group to net future undiscounted cash flows that the asset or assets are expected to generate. We would then recognize an impairment charge equal to the amount by which the carrying amount exceeds the fair market value of the asset or assets.
Goodwill and Other Intangible Assets with Indefinite Lives
We test goodwill and other intangible assets with indefinite lives for impairment separately on an annual basis in the fourth quarter of each year. Additionally, we will test goodwill and other intangible assets with indefinite lives in the interim if events and circumstances indicate that goodwill and other intangible assets with indefinite lives may be impaired. The events and circumstances that we consider include, but are not limited to, significant under-performance relative to projected future operating results and significant changes in our overall business and/or product strategies.
If an event or circumstance occurs that would cause us to revise our estimates and assumptions used in analyzing the value of our goodwill and other intangible assets with indefinite lives, the revision could result in a non-cash impairment charge that could have a material impact on our financial results. We evaluate impairment of goodwill by first performing a qualitative assessment to determine whether it is more likely than not that the fair value of a reporting unit is less than its carrying value. If it is concluded that this is the case, it is necessary to perform the two-step goodwill impairment test. The first step involves a comparison of the fair value of a reporting unit with its carrying amount. If the carrying amount of the reporting unit exceeds its fair value, the second step involves a comparison of the implied fair value and carrying amount of the goodwill of that reporting unit to determine the impairment charge, if any.
We quantitatively evaluate other intangible assets with indefinite lives by estimating the fair value of those assets based on estimated future earnings derived from the assets using the income approach model. For those intangible assets with indefinite lives that have been determined to be inseparable due to their interchangeable use, we have grouped these assets into single units of accounting for purposes of testing for impairment. If the carrying amount of the other intangible assets with indefinite lives exceeds the fair value, we would recognize an impairment loss equal to the excess of carrying value over fair value.
There was no impairment of goodwill indicated in 2014, 2013 or 2012. During 2014, we recognized an impairment of the MyNewPlace trade name in the amount of $0.3 million. Other than this trade name, no impairment of other intangible assets was indicated in 2014. No impairment of other intangible assets was indicated in 2013 or 2012.
Intangible Assets
Intangible assets consist of acquired developed product technologies, acquired customer relationships, vendor relationships and trade names. We record intangible assets at fair value and amortize those with finite lives over the shorter of the contractual life or the estimated useful life. We estimate the useful lives of acquired developed product technologies and customer relationships based on factors that include the planned use of each developed product technology and the expected pattern of future cash flows to be derived from each developed product technology and existing customer relationships. Estimated useful lives for finite-lived intangible assets consist of the following:
Developed technologies | 3 years |
Customer relationships | 1-10 years |
Vendor relationships | 7 years |
74
We include amortization of acquired developed product technologies in cost of revenue, amortization of acquired customer relationships in sales and marketing expenses and amortization of vendor relationships and non-competition agreements in general and administrative expenses in our consolidated statements of operations.
Income Taxes
Income taxes are provided based on the liability method, which results in income tax assets and liabilities arising from temporary differences. Temporary differences are differences between the tax basis of assets and liabilities and their reported amounts in the financial statements that will result in taxable or deductible amounts in future years. The liability method requires the effect of tax rate changes on current and accumulated deferred income taxes to be reflected in the period in which the rate change was enacted. The liability method also requires that deferred tax assets be reduced by a valuation allowance unless it is more likely than not that the assets will be realized.
We may recognize a tax benefit from uncertain tax positions only if it is at least more likely than not that the tax position will be sustained upon examination by the taxing authorities, based on the technical merits of the position. The tax benefits recognized in the financial statements from such a position are measured based on the largest benefit that has a greater than fifty percent likelihood of being realized upon settlement with the taxing authorities. There were no identified tax benefits that were considered uncertain positions at December 31, 2014 and 2013.
We establish valuation allowances when necessary to reduce deferred tax assets to the amounts expected to be realized. We evaluate the need for, and the adequacy of, valuation allowances based on the expected realization of our deferred tax assets. The factors used to assess the likelihood of realization include historical earnings, our latest forecast of taxable income and available tax planning strategies that could be implemented to realize the net deferred tax assets.
Revenue Recognition
We derive our revenue from three primary sources: our on demand software solutions, our on premise software solutions and professional and other services. We commence revenue recognition when all of the following conditions are met:
• | there is persuasive evidence of an arrangement; |
• | the solution and/or service has been provided to the customer; |
• | the collection of the fees is probable; and |
• | the amount of fees to be paid by the customer is fixed or determinable. |
If the fees are not fixed or determinable, we recognize revenues when these criteria are met, which could be as payments become due from customers, or when amounts owed are collected. Accordingly, this may materially affect the timing of our revenue recognition and results of operations.
For multi-element arrangements that include multiple software solutions and/or services, we allocate arrangement consideration to all deliverables that have stand-alone value based on their relative selling prices. In such circumstances, we utilize the following hierarchy to determine the selling price to be used for allocating revenue to deliverables as follows:
• | Vendor specific objective evidence ("VSOE"), if available. The price at which we sell the element in a separate stand-alone transaction; |
• | Third-party evidence of selling price ("TPE"), if VSOE of selling price is not available. Evidence from us or other companies of the value of a largely interchangeable element in a transaction; and |
• | Estimated selling price ("ESP"), if neither VSOE nor TPE of selling price is available. Our best estimate of the stand-alone selling price of an element in a transaction. |
Our process for determining ESP for deliverables without VSOE or TPE considers multiple factors that may vary depending upon the unique facts and circumstances related to each deliverable. Key factors primarily considered in developing ESP include prices charged by us for similar offerings when sold separately, pricing policies and approvals from standard pricing and other business objectives.
From time to time, we sell on demand software solutions with professional services. In such cases, as each element has stand-alone value, we allocate arrangement consideration based on our ESP of the on demand software solution and VSOE of the selling price of the professional services.
Taxes collected from customers and remitted to governmental authorities are presented on a net basis.
On Demand Revenue
Our on demand revenue consists of license and subscription fees, transaction fees related to certain of our software-enabled value-added services and commissions derived from us selling certain risk mitigation services.
75
License and subscription fees are comprised of a charge billed at the initial order date and monthly or annual subscription fees for accessing our on demand software solutions. The license fee billed at the initial order date is recognized as revenue on a straight-line basis over the longer of the contractual term or the period in which the customer is expected to benefit, which we consider to be three years. Recognition starts once the product has been activated. Revenue from monthly and annual subscription fees is recognized on a straight-line basis over the access period.
We recognize revenue from transaction fees derived from certain of our software-enabled value-added services as the related services are performed.
As part of our risk mitigation services to the rental housing industry, we act as an insurance agent and derive commission revenue from the sale of insurance products to individuals. The commissions are based upon a percentage of the premium that the insurance company charges to the policyholder and are subject to forfeiture in instances where a policyholder cancels prior to the end of the policy. If the policy is cancelled, our commissions are forfeited as a percent of the unearned premium. As a result, we recognize the commissions related to these services ratably over the policy term as the associated premiums are earned. Our contract with our underwriting partner provides for contingent commissions to be paid to us in accordance with the agreement. This agreement provides for a calculation that considers, on the policies sold by us, earned premiums less i) earned agent commissions; ii) a percent of premium retained by our underwriting partner; iii) incurred losses and iv) profit retained by our underwriting partner during the time period. Our estimate of contingent commission revenue considers historical loss experience on the policies sold by us.
On Premise Revenue
Revenue from our on premise software solutions is comprised of an annual term license, which includes maintenance and support. Customers can renew their annual term license for additional one-year terms at renewal price levels. We recognize the annual term license on a straight-line basis over the contract term.
In addition, we have arrangements that include perpetual licenses with maintenance and other services to be provided over a fixed term. We allocate and defer revenue equivalent to the VSOE of fair value for the undelivered elements and recognize the difference between the total arrangement fee and the amount deferred for the undelivered elements as revenue. We have determined that we do not have VSOE of fair value for our customer support and professional services in these specific arrangements. As a result, the elements within our multiple-element sales agreements do not qualify for treatment as separate units of accounting. Accordingly, we account for fees received under multiple-element arrangements with customer support or other professional services as a single unit of accounting and recognize the entire arrangement ratably over the longer of the customer support period or the period during which professional services are rendered.
Professional and Other Revenue
Professional and other revenue is recognized as the services are rendered for time and material contracts. Training revenues are recognized after the services are performed.
Deferred Revenue
Deferred revenue primarily consists of billings or payments received in advance of revenue recognition from our subscription service described above and is recognized as the revenue recognition criteria are met. For several of our solutions, we invoice our customers in annual, monthly or quarterly installments in advance of the commencement of the service period. Accordingly, the deferred revenue balance does not represent the total contract value of annual subscription agreements.
Cost of Revenue
Cost of revenue consists primarily of salaries and related personnel expenses of our operations and support personnel, including training and implementation services, expenses related to the operation of our data center, fees paid to third-party providers, allocations of facilities overhead costs and depreciation, amortization of acquired technologies and amortization of capitalized software.
Customer Acquisition Costs
The costs of obtaining new customers are expensed as incurred.
Stock-Based Compensation
We record stock-based compensation expense for options granted to employees based on the estimated fair value for the awards. We estimate the fair value of time-based vesting awards using the Black-Scholes option pricing model on the date of grant and the associated expense is recognized over the requisite service period, which is generally the vesting period, on a straight-line basis.
The fair value of market-based vesting awards is estimated using a discrete model based on multiple stock price-paths developed through the use of Monte Carlo simulation. Expense associated with market-based awards is recognized over the
76
requisite service period on a straight-line basis. We estimate the requisite service period based on the median of the distribution of share price-paths on which the market condition is satisfied.
At each stock option grant date, we utilize peer group data to calculate our expected volatility. Expected volatility is based on historical volatility rates of publicly traded peers combined with our historical volatility rates. Expected life is computed using the mid-point between the vesting period and contractual life of the options granted. The risk-free rate is based on the treasury yield rate with a maturity corresponding to the expected option life assumed at the grant date. Forfeiture rates are estimated using historical and expected future trends.
Changes to the assumptions underlying the above models may have a significant impact on the underlying value of the stock options, which could have a material impact on our consolidated financial statements.
We have granted stock options at exercise prices believed to be equal to the fair market value of our common stock, as of the grant date. The fair value of our time-based restricted stock awards is based on the closing price on the date of grant.
Capitalized Product Development Costs
We capitalize specific product development costs, including costs to develop software products or the software components of our solutions to be marketed to external users, as well as software programs to be used solely to meet our internal needs. The costs incurred in the preliminary stages of development related to research, project planning, training, maintenance and general and administrative activities, and overhead costs are expensed as incurred. The costs of relatively minor upgrades and enhancements to the software are also expensed as incurred. Once an application has reached the development stage, internal and external costs incurred in the performance of application development stage activities, including costs of materials, services and payroll and payroll-related costs for employees, are capitalized, if direct and incremental, until the software is substantially complete and ready for its intended use. Capitalization ceases upon completion of all substantial testing. We also capitalize costs related to specific upgrades and enhancements when it is probable the expenditures will result in additional functionality. Capitalized costs are recorded as part of property and equipment. Internal use software is amortized on a straight-line basis over its estimated useful life, generally three to five years. Our management evaluates the useful lives of these assets on an annual basis and tests for impairment whenever events or changes in circumstances occur that could impact the recoverability of these assets. There were no impairments to internal use software during the years ended December 31, 2014, 2013 or 2012.
Advertising Expenses
Advertising costs are expensed as incurred and totaled $15.1 million, $11.4 million and $10.2 million for the years ended December 31, 2014, 2013 and 2012, respectively.
Accrued Expenses and Other Current Liabilities
Accrued expenses and other current liabilities consisted of the following:
December 31, | ||||||||
2014 | 2013 | |||||||
(in thousands) | ||||||||
Accrued compensation, payroll taxes and benefits | $ | 10,317 | $ | 8,145 | ||||
Current portion of liabilities related to acquisitions | 3,905 | 4,216 | ||||||
Other current liabilities | 8,683 | 10,761 | ||||||
Total accrued expenses and other current liabilities | $ | 22,905 | $ | 23,122 | ||||
Recently Issued Accounting Standards
In May 2014, the Financial Accounting Standards Board ("FASB") issued ASU 2014-09, Revenue from Contracts with Customers. This new standard will replace all current GAAP guidance on this topic and eliminate all industry-specific guidance. The new revenue recognition standard provides a unified model to determine when and how revenue is recognized. The core principle is that a company should recognize revenue to depict the transfer of promised goods or services to customers in an amount that reflects the consideration for which the entity expects to be entitled in exchange for those goods or services. This guidance will be effective for us beginning January 1, 2017 and at that time, can be applied either retrospectively to each period presented or as a cumulative-effect adjustment as of the date of adoption. We have not yet selected a transition method nor have we determined the effect of the standard on our ongoing financial reporting.
3. Acquisitions
2014 Acquisitions
In January 2014, we acquired certain assets from Bookt LLC, including the InstaManager product (“InstaManager”). InstaManager is a software-as-a-service vacation rental booking engine used by professional managers of vacation rental
77
properties. InstaManager offers marketing websites, online pricing and availability, online booking, automated reservations, payment processing and insurance sales. The acquisition of InstaManager expanded our product offerings to include property management software for the vacation rental market. We acquired InstaManager for a purchase price of $9.2 million, consisting of a cash payment of $6.0 million at closing, a deferred cash payment of up to $1.0 million payable over two years after the acquisition date, and additional cash payments totaling up to $7.0 million contingent upon meeting certain revenue targets for the years ended March 31, 2015 and March 31, 2016. The initial fair value of the deferred and contingent cash payments was $0.8 million and $2.4 million, respectively. The fair value of the deferred cash payments was estimated based on the present value, as of the date of acquisition, of anticipated future payments. The fair value of the contingent cash payments was based on management’s estimate of the fair value of the cash payment using a probability weighted discount model on the achievement of certain revenue targets and is evaluated quarterly. This acquisition was financed from cash flows provided by operations. Acquired intangibles were recorded at their estimated fair value based on assumptions made by us. The acquired developed product technologies have a useful life of three years amortized on a straight-line basis. The trade name acquired has an indefinite useful life as we do not plan to cease using the trade name in the marketplace. Direct acquisition costs were less than $0.1 million and expensed as incurred. We included the results of operations of this acquisition in our consolidated financial statements from the effective date of the acquisition. Goodwill and identified intangibles associated with this acquisition are deductible for tax purposes. Goodwill arising from the acquisition consists largely of the economies of scale expected from integrating InstaManager into our existing operating structure. The aggregate fair value of the contingent cash payments was $2.3 million at December 31, 2014. During the year ended December 31, 2014 we recognized a net gain of less than $0.1 million due to the changes in the estimated fair value of the contingent cash payments.
In March 2014, we acquired certain assets from Virtual Maintenance Manager LLC, including the Virtual Maintenance Manager product (“VMM”). VMM is a software-as-a-service application that facilitates the management of the end-to-end maintenance life cycle for single family and multifamily rental properties and provides property managers visibility into their maintenance costs, manages resources and provides business control for property managers. We integrated VMM into our existing Propertyware products. We acquired the VMM assets for a purchase price of $1.2 million, consisting of a cash payment of $1.0 million at closing, a deferred cash payment of up to $0.2 million payable over two years after the acquisition date, and additional cash payments of up to $2.0 million if certain revenue targets are met for the twelve months ended June 30, 2015 and June 30, 2016. The initial fair value of the deferred and contingent cash payments was $0.2 million and less than $0.1 million, respectively. The fair value of the deferred cash payments was estimated based on the present value, as of the date of acquisition, of anticipated future payments. The fair value of the contingent cash payments was based on management’s estimate of the fair value of the cash payments using a probability weighted discount model on the achievement of certain revenue targets and will be evaluated quarterly. This acquisition was financed from cash flows provided by operations. Acquired intangibles were recorded at their estimated fair value based on assumptions made by us. The acquired developed product technologies have a useful life of three years to be amortized on a straight-line basis. Acquired customer relationships have a useful life of five years which will be amortized proportionately to the expected discounted cash flows derived from the asset. Direct acquisition costs were less than $0.1 million and expensed as incurred. We included the results of operations of this acquisition in our consolidated financial statements from the effective date of the acquisition. Goodwill and identified intangibles associated with this acquisition are deductible for tax purposes. Goodwill arising from the acquisition consists largely of the economies of scale expected from integrating VMM into our existing operating structure and from anticipated synergies with our existing products. The aggregate fair value of the contingent cash payments was less than $0.1 million at December 31, 2014. During the year ended December 31, 2014 we recognized a gain of less than $0.1 million due to the changes in the estimated fair value of the contingent cash payments.
In May 2014, we acquired certain assets from Notivus Multi-Family LLC ("Notivus"). Notivus is a software-as-a-service application that provides an outsourced vendor credentialing solution to assist multifamily owners and managers in the credentialing and ongoing monitoring of its current and prospective vendors, suppliers and independent contractors. We are integrating Notivus into our existing Compliance Depot products. We acquired the Notivus assets for a purchase price of $4.4 million, consisting of a cash payment of $3.6 million at closing and a deferred cash payment of up to $0.8 million payable over two years after the acquisition date. The initial fair value of the deferred cash payment was approximately $0.8 million. The fair value of the deferred cash payments was estimated based on the present value, as of the date of acquisition, of anticipated future payments. This acquisition was financed from cash flows provided by operations. Acquired intangibles were recorded at their estimated fair value based on assumptions made by us. The acquired developed product technologies have a useful life of three years to be amortized on a straight-line basis. Direct acquisition costs were less than $0.1 million and expensed as incurred. We included the results of operations of this acquisition in our consolidated financial statements from the effective date of the acquisition. Goodwill and identified intangibles associated with this acquisition are deductible for tax purposes. Goodwill arising from the acquisition consists largely of the economies of scale expected from integrating Notivus into our existing operating structure and from anticipated synergies with our existing products.
In June 2014, we acquired all of the issued and outstanding stock of Kigo, Inc. ("Kigo"). Kigo is a software-as-a-service vacation rental booking system based in the United States with operations in Spain. Kigo offers services for vacation rental
78
property management that include vacation rental calendars, scheduling, reservations, accounting, channel management, website design, payment processing and other tasks to aid the management of leads, revenue, resources and lodging calendars. We plan to integrate Kigo with our existing vacation rental products. We acquired Kigo for a purchase price of $36.2 million, consisting of a cash payment of $30.7 million and a deferred cash payment of up to $5.5 million, to be payable over two and a half years after the acquisition date. This acquisition was financed from our revolving line of credit and cash flows provided by operations. Direct acquisition costs were $0.5 million and expensed as incurred. The acquired developed product technologies have a useful life of three years to be amortized on a straight-line basis. Acquired customer relationships have a useful life of ten years, which will be amortized proportionately to the expected discounted cash flows derived from the asset. The trade name acquired has an indefinite useful life as we do not plan to cease using the trade name in the marketplace. Goodwill and identified intangibles associated with this acquisition are not deductible for tax purposes. Goodwill arising from the acquisition consists largely of the economies of scale expected from integrating Kigo into our existing operating structure and from anticipated synergies with our existing products. We included the results of operations of this acquisition in our consolidated financial statements from the effective date of this acquisition.
We preliminarily allocated the purchase price for InstaManager, VMM, Notivus and Kigo as follows:
InstaManager | VMM | Notivus | Kigo | |||||||||||||
(in thousands) | ||||||||||||||||
Intangible assets: | ||||||||||||||||
Developed product technologies | $ | 4,490 | $ | 671 | $ | 1,840 | $ | 2,570 | ||||||||
Customer relationships | — | 200 | — | 1,120 | ||||||||||||
Trade names | 527 | — | — | 602 | ||||||||||||
Goodwill | 4,135 | 358 | 2,852 | 32,996 | ||||||||||||
Deferred revenue | (33 | ) | — | (156 | ) | — | ||||||||||
Net deferred taxes | — | — | — | (495 | ) | |||||||||||
Net other assets (liabilities) | 55 | — | (141 | ) | (547 | ) | ||||||||||
Total purchase price | $ | 9,174 | $ | 1,229 | $ | 4,395 | $ | 36,246 | ||||||||
2013 Acquisitions
In February 2013, we acquired certain assets of Seniors for Living, Inc. (“SFL”). SFL is a leading performance-based marketing company that provides senior housing communities and home care companies with industry-leading referral and marketing services to help them achieve their occupancy goals. We have integrated SFL with our existing senior living software solutions. We acquired SFL for a purchase price of $2.7 million, which consisted of a cash payment of $2.3 million and additional cash payments of $0.2 million each due 6 months and 12 months after the acquisition date. These cash payments were paid in October 2013 and August 2014. This acquisition was financed from cash flows provided by operations. Acquired intangibles were recorded at fair value based on assumptions made by us. The acquired developed product technologies have a useful life of three years and are amortized on a straight-line basis. Acquired customer relationships have a useful life of five years and are amortized proportionately to the expected discounted cash flows derived from the asset. Direct acquisition costs were less than $0.1 million and expensed as incurred. We included the results of operations of this acquisition in our consolidated financial statements from the effective date of the acquisition. Goodwill and identified intangibles associated with this acquisition are deductible for tax purposes. Goodwill arising from the acquisition consists largely of the economies of scale expected from integrating SFL into our existing operating structure and from anticipated synergies with our existing products.
In March 2013, we acquired certain assets from Yield Technologies, Inc., including RentSentinel and RentSocial (together, “RentSentinel”). The RentSentinel software-as-a-service platform is a fully featured apartment marketing management solution for the multifamily industry. RentSocial is an apartment search service that simplifies and incorporates the social marketing platform into the process of finding an apartment. We have integrated RentSentinel with our existing LeaseStar product family. We acquired RentSentinel for a purchase price of $10.5 million, which consisted of a cash payment of $7.6 million, an issuance of 72,500 shares of our common stock and two tranches of 36,250 shares of our common stock which are issuable 12 months and 24 months after the acquisition date, respectively. The initial fair value of the shares of common stock issued at acquisition and the contingent shares of common stock were $1.5 million and $1.4 million, respectively. As of December 31, 2014, 33,868 shares had been issued. This acquisition was financed from cash flows provided by operations and our common stock. Acquired intangibles were recorded at fair value based on assumptions made by us. The acquired developed product technologies have a useful life of three years and are amortized on a straight-line basis. Acquired customer relationships have a useful life of nine years and are amortized proportionately to the expected discounted cash flows derived from the asset. Direct acquisition costs were $0.1 million and expensed as incurred. We included the results of operations of this acquisition in our consolidated financial statements from the
79
effective date of the acquisition. Goodwill and identified intangibles associated with this acquisition are not deductible for tax purposes. Goodwill arising from the acquisition consists largely of the economies of scale expected from integrating RentSentinel into our existing operating structure and from anticipated synergies with our existing products.
In October 2013, we acquired substantially all of the operating assets of Windsor Compliance Services, Inc. (“Windsor Compliance”) for a purchase price of $2.7 million, which included a cash payment of $1.3 million at closing and additional cash payments of $1.0 million and $0.5 million due 12 months and 24 months after the acquisition date, respectively, which are contingent on Windsor Compliance providing services to a specified number of units on or before those dates. The first payment of $1.0 million was paid in October 2014. The initial fair value of the cash payments was $1.4 million. The fair value was based on management’s estimate of the fair value of the cash payment using a probability weighted discount model on the achievement of the servicing targets discussed above. Windsor Compliance is a firm specializing in compliance with tax credits and regulations for the affordable housing industry. We plan to integrate Windsor Compliance with our other affordable HUD products. This acquisition was financed from cash flows provided by operations. Acquired intangibles were recorded at fair value based on assumptions made by us. Acquired customer relationships have a useful life of ten years and are amortized proportionately to the expected discounted cash flows derived from the asset. Direct acquisition costs were $0.1 million and expensed as incurred. We included the results of operations of this acquisition in our consolidated financial statements from the effective date of the acquisition. Goodwill and identified intangibles associated with this acquisition are deductible for tax purposes. Goodwill arising from the acquisition consists largely of the economies of scale expected from integrating Windsor Compliance into our existing operating structure and from anticipated synergies with our existing products.
In October 2013, we acquired all of the issued and outstanding capital stock of MyBuilding Inc. ("MyBuilding") for a purchase price of $6.9 million, consisting of a cash payment of $5.2 million at closing, a deferred cash payment of up to $1.5 million payable over two years after the acquisition date and additional cash payments totaling up to $1.1 million if certain revenue targets are met for the years ended December 31, 2014 and December 31, 2015. The initial fair value of the deferred and contingent cash payments were $1.4 million and $0.3 million, respectively. During 2014 a cash payment of $0.7 million was made against the deferred cash payment obligation. The fair value of the deferred cash payments was estimated based on the present value, as of the date of acquisition, of anticipated future payments. The fair value of the contingent cash payments was based on management’s estimate of the fair value of the cash payment using a probability weighted discount model on the achievement of certain revenue targets. MyBuilding provides software-as-a-service solutions that facilitate the creation of online communities that connect renters to multifamily property managers, local vendors and other renters. We have integrated Active Building with our Resident Portal software solutions. This acquisition was financed from cash flows provided by operations. Acquired intangibles were recorded at fair value based on assumptions made by us. The acquired developed product technologies have a useful life of three years and are amortized on a straight-line basis. Acquired customer relationships have a useful life of ten years and are amortized proportionately to the expected discounted cash flows derived from the asset. The trade name acquired has an indefinite useful life as we do not plan to cease using the trade names in the marketplace. Direct acquisition costs were $0.1 million and expensed as incurred. We included the results of operations of this acquisition in our consolidated financial statements from the effective date of the acquisition. Goodwill and identified intangibles associated with this acquisition are not deductible for tax purposes. Goodwill arising from the acquisition consists largely of the economies of scale expected from integrating MyBuilding into our existing operating structure and from anticipated synergies with our existing products. The aggregate fair value of the contingent cash payments was $0.2 million and $0.3 million at December 31, 2014 and 2013, respectively. During the year ended December 31, 2014, we recognized a gain of $0.1 million due to the changes in the estimated fair value of the contingent cash payments. No gain or loss was recognized due to changes in the estimated fair value of the contingent cash payments during the year ended December 31, 2013.
In October 2013, we acquired all of the membership interests of Active Building, LLC ("Active Building") for a purchase price of $14.4 million, consisting of a cash payment of $11.3 million at closing, a deferred cash payment of up to $2.0 million payable over three years after the acquisition date and additional cash payments totaling up to $6.5 million if certain revenue targets are met for the years ended December 31, 2014 and December 31, 2015. The initial fair value of the deferred and contingent cash payments was $1.7 million and $1.4 million, respectively. A deferred cash payment in the amount of $0.7 million was made in November 2014. The fair value of the deferred cash payments was estimated based on the present value, as of the date of acquisition, of anticipated future payments. The fair value of the contingent cash payments was based on management’s estimate of the fair value of the cash payment using a probability weighted discount model on the achievement of certain revenue targets. Active Building provides software-as-a-service solutions that facilitate the creation of online communities that connect renters to multifamily property managers, local vendors and other renters. We have integrated Active Building with our Resident Portal software solutions. This acquisition was financed from cash flows provided by operations. Acquired intangibles were recorded at fair value based on assumptions made by us. The acquired developed product technologies have a useful life of three years and are amortized on a straight-line basis. Acquired customer relationships have a useful life of ten years and are amortized proportionately to the expected discounted cash flows derived from the asset. The trade name acquired has an indefinite useful life as we do not plan to cease using the trade names in the marketplace. Direct acquisition costs were $0.1 million and expensed as incurred. We included the results of operations of this acquisition in our
80
consolidated financial statements from the effective date of the acquisition. Goodwill and identified intangibles associated with this acquisition are deductible for tax purposes. Goodwill arising from the acquisition consists largely of the economies of scale expected from integrating Active Building into our existing operating structure and from anticipated synergies with our existing products. The aggregate fair value of the contingent cash payments was $1.6 million and $1.4 million at December 31, 2014 and 2013, respectively. During the year ended December 31, 2014, we recognized a gain of $0.2 million due to the changes in the estimated fair value of the contingent cash payments. No gain or loss was recognized due to changes in the estimated fair value of the contingent cash payments during the year ended December 31, 2013.
We preliminarily allocated the purchase price for SFL, RentSentinel, Windsor Compliance, MyBuilding and Active Building as follows:
SFL | RentSentinel | Windsor Compliance | MyBuilding | Active Building | ||||||||||||||||
(in thousands) | ||||||||||||||||||||
Intangible assets: | ||||||||||||||||||||
Developed product technologies | $ | 1,406 | $ | 4,238 | $ | — | $ | 1,450 | $ | 3,850 | ||||||||||
Customer relationships | 161 | 2,390 | 1,230 | 1,000 | 2,650 | |||||||||||||||
Trade names | — | — | — | 328 | 597 | |||||||||||||||
Goodwill | 1,035 | 3,633 | 1,302 | 5,043 | 7,198 | |||||||||||||||
Deferred revenue | — | (304 | ) | (107 | ) | (258 | ) | — | ||||||||||||
Net deferred taxes | — | 226 | — | (813 | ) | — | ||||||||||||||
Net other assets | 88 | 313 | 226 | 111 | 76 | |||||||||||||||
Total purchase price, net of cash acquired | $ | 2,690 | $ | 10,496 | $ | 2,651 | $ | 6,861 | $ | 14,371 | ||||||||||
2012 Acquisitions
In January 2012, we acquired substantially all of the operating assets of Vigilan, Incorporated (“Vigilan”). A provider of assisted living software-as-a-service solutions, Vigilan products allow assisted living communities to monitor and schedule detailed care, manage labor costs, provide accurate billing and maintain regulatory compliance through its comprehensive compliance module. This asset acquisition allowed us to integrate Vigilan with existing senior living software solutions to further expand the RealPage Senior Living product solutions. We acquired Vigilan for a purchase price of $5.0 million consisting of a cash payment of $4.0 million and two additional cash payments of up to $0.5 million each due 12 months and 24 months after the acquisition date. The $1.0 million withheld from the purchase consideration was subject to a downward adjustment if certain revenue targets were not met for the six months ended June 30, 2012. Revenue targets were met and the amount was not adjusted. The two additional cash payments were made in 2013 and 2014. This acquisition was financed from cash flows from operations. Acquired intangibles were recorded at fair value based on assumptions made by us. The acquired developed product technologies have a useful life of three years and are amortized on a straight-line basis. Acquired customer relationships have a useful life of ten years and are amortized proportionately to the expected discounted cash flows derived from the asset. All direct acquisition costs were $0.1 million and expensed as incurred. We included the results of operations of this acquisition in our consolidated financial statements from the effective date of the acquisition. Goodwill and identified intangibles associated with this acquisition are deductible for tax purposes. Goodwill arising from the acquisition consists largely of the economies of scale expected from integrating Vigilan into our existing operating structure and from anticipated synergies with our existing products.
In July 2012, we acquired all of the issued and outstanding shares of Rent Mine Online, Inc. (“RMO”). The acquisition of RMO expanded our renter referral capabilities into the multifamily residential rental housing market. We acquired RMO for a purchase price consisting of a cash payment of $5.5 million at closing, a deferred cash payment of up to $3.5 million and a contingent deferred earn out payment of up to 300,000 shares of our common stock, payable based on the achievement of certain revenue targets on or before December 31, 2014. In addition, the purchase agreement included a conversion option on the contingent common shares under which the seller can elect to receive, in lieu of common shares, an amount per share equal to the lesser of the average market price or an established threshold, up to one half of the common shares earned. The $3.5 million withheld from the purchase price is subject to a downward adjustment if certain revenue targets were not met as of March 31, 2013. The initial fair value for the future cash payment and the common shares and conversion option were $0.2 million and $0.3 million, respectively. These fair values were based on management’s estimate of the fair value of the cash, common shares and conversion option using a probability weighted discount model on the achievement of certain revenue targets. As of December 31, 2013, 22,000 shares had been issued and a cash payment of $0.7 million had been made. This acquisition was financed using cash flows from operations. Acquired intangibles were recorded at fair value based on assumptions determined by us. The acquired developed product technologies have a useful life of three years amortized on a
81
straight-line basis. Acquired customer relationships have a useful life of ten years which will be amortized proportionately to the expected discounted cash flows derived from the asset. Direct acquisition costs were $0.1 million and expensed as incurred. We included the results of operations of this acquisition in our consolidated financial statements from the effective date of the acquisition. Goodwill and identified intangible assets are not deductible for tax purposes. Goodwill arising from the acquisition consists largely of the economies of scale expected from integrating RMO into our existing operating structure and from anticipated synergies with our existing products. As of December 31, 2013, we recognized a loss of $1.3 million due to changes in the estimated fair value of the cash acquisition-related contingent consideration. As of December 31, 2013, we recognized no income or expense and expense of $0.3 million due to changes in the common shares and the conversion option, respectively. In 2014, the remaining obligations relating to the deferred cash and earn out payments were settled through a cash payment of $0.6 million.
We allocated the purchase price for RMO and Vigilan as follows:
RMO | Vigilan | |||||||
(in thousands) | ||||||||
Intangible assets: | ||||||||
Developed product technologies | $ | 2,460 | $ | 1,430 | ||||
Customer relationships | 1,770 | 1,150 | ||||||
Goodwill | 3,439 | 2,454 | ||||||
Net deferred taxes | (1,502 | ) | — | |||||
Net other assets | (410 | ) | (34 | ) | ||||
Total purchase price, net of cash acquired | $ | 5,757 | $ | 5,000 | ||||
Pro Forma Results of Acquisitions
The following table presents unaudited pro forma results of operations for 2014 and 2013 as if the aforementioned acquisitions had occurred at the beginning of each period presented. The pro forma financial information as of December 31, 2014 and 2013, respectively, includes the business combination accounting effects resulting from these acquisitions including $0.8 million and $6.2 million of amortization charges from acquired intangible assets. We prepared the pro forma financial information for the combined entities for comparative purposes only, and it is not indicative of what actual results would have been if the acquisitions had taken place at the beginning of the periods presented, or of future results.
Year Ended December 31, | ||||||||
2014 Pro Forma | 2013 Pro Forma | |||||||
(in thousands, except per share amounts) | ||||||||
(unaudited) | (unaudited) | |||||||
Revenue: | ||||||||
On demand | $ | 391,949 | $ | 369,362 | ||||
On premise | 3,094 | 3,691 | ||||||
Professional and other | 10,835 | 11,019 | ||||||
Total revenue | 405,878 | 384,072 | ||||||
Net (loss) income | $ | (10,746 | ) | $ | 15,980 | |||
Net (loss) income per share: | ||||||||
Basic | $ | (0.14 | ) | $ | 0.21 | |||
Diluted | $ | (0.14 | ) | $ | 0.21 | |||
4. Property, Equipment and Software
Property, equipment and software consist of the following:
82
December 31, | ||||||||
2014 | 2013 | |||||||
(in thousands) | ||||||||
Leasehold improvements | $ | 22,943 | $ | 18,756 | ||||
Data processing and communications equipment | 59,390 | 47,719 | ||||||
Furniture, fixtures and other equipment | 16,254 | 11,266 | ||||||
Software | 51,915 | 36,750 | ||||||
150,502 | 114,491 | |||||||
Less: Accumulated depreciation and amortization | (77,886 | ) | (59,716 | ) | ||||
Property, equipment and software, net | $ | 72,616 | $ | 54,775 | ||||
Depreciation and amortization expense for property, equipment and purchased software was $18.9 million, $14.1 million and $13.0 million for the years ended December 31, 2014, 2013 and 2012, respectively. This includes depreciation for assets acquired through capital leases.
The carrying amount of capitalized development costs was $32.5 million and $21.6 million and had accumulated amortization of $10.7 million and $9.0 million at December 31, 2014 and 2013, respectively. The weighted average amortization period for capitalized software development costs was 4.3 years at December 31, 2014. During the years ended December 31, 2014 and 2013 we capitalized $10.9 million and $7.6 million of software development costs. Amortization expense related to capitalized software development costs totaled $1.7 million, $1.0 million and $1.2 million during the years ended December 31, 2014, 2013 and 2012, respectively.
5. Goodwill and Other Intangible Assets
The change in the carrying amount of goodwill is as follows:
(in thousands) | ||||
Balance at January 1, 2013 | $ | 134,025 | ||
Goodwill acquired | 18,211 | |||
Other | 186 | |||
Balance at December 31, 2013 | 152,422 | |||
Goodwill acquired | 40,341 | |||
Other | 615 | |||
Balance at December 31, 2014 | $ | 193,378 | ||
There was no impairment of goodwill indicated in 2014, 2013 or 2012.
Other intangible assets consisted of the following at December 31, 2014 and 2013:
December 31, 2014 | December 31, 2013 | ||||||||||||||||||||||||
Weighted Average Amortization Period | Carrying Amount | Accumulated Amortization | Net | Carrying Amount | Accumulated Amortization | Net | |||||||||||||||||||
(in thousands) | |||||||||||||||||||||||||
Finite-lived intangible assets: | |||||||||||||||||||||||||
Developed technologies | 3.2 years | $ | 55,212 | $ | (39,343 | ) | $ | 15,869 | $ | 45,014 | $ | (29,952 | ) | $ | 15,062 | ||||||||||
Customer relationships | 9.0 years | 86,753 | (44,264 | ) | 42,489 | 85,823 | (33,503 | ) | 52,320 | ||||||||||||||||
Vendor relationships | 4.2 years | 5,650 | (5,273 | ) | 377 | 5,650 | (4,709 | ) | 941 | ||||||||||||||||
Total finite-lived intangible assets | 6.7 years | 147,615 | (88,880 | ) | 58,735 | 136,487 | (68,164 | ) | 68,323 | ||||||||||||||||
Indefinite-lived intangible assets: | |||||||||||||||||||||||||
Trade names | 41,350 | — | 41,350 | 40,492 | — | 40,492 | |||||||||||||||||||
Total intangible assets | $ | 188,965 | $ | (88,880 | ) | $ | 100,085 | $ | 176,979 | $ | (68,164 | ) | $ | 108,815 | |||||||||||
During 2014, we recognized an impairment of the MyNewPlace trade name in the amount of $0.3 million. Other than this trade name, no impairment of other intangible assets was indicated in 2014. No impairment of other intangible assets was indicated in 2013 or 2012. We paid $1.1 million and $0.9 million to acquire domain names and other intangible assets.
83
Amortization of finite-lived intangible assets was $20.7 million, $16.6 million and $18.3 million for the years ended December 31, 2014, 2013 and 2012, respectively.
As of December 31, 2014, the following table sets forth the estimated amortization of intangible assets for the years ending December 31:
(in thousands) | |||
2015 | $ | 18,296 | |
2016 | 13,961 | ||
2017 | 8,236 | ||
2018 | 5,981 | ||
2019 | 5,095 | ||
6. Debt
Credit Facility Opened September 2014
On September 30, 2014, we entered into a new agreement for a secured revolving credit facility to refinance our outstanding revolving loans. The new credit facility provides an aggregate principal amount of up to $200.0 million, with sublimits of $10.0 million for the issuance of letters of credit and for $20.0 million of swingline loans. The credit facility also allows us, subject to certain conditions, to request additional term loans or revolving commitments in an aggregate principal amount of up to $150.0 million, plus an amount that would not cause our consolidated net leverage ratio, which is a ratio of the Company’s consolidated funded indebtedness to its consolidated EBIDTA, to exceed 3.25 to 1.00. Advances under the credit facility may be voluntarily prepaid and re-borrowed. At our option, the revolving loans accrue interest at a per annum rate equal to either LIBOR, plus a margin ranging from 1.25% to 1.75%, or the Base Rate, plus a margin ranging from 0.25% to 0.75%. The Base Rate is defined as the greater of Wells Fargo's prime rate, the Federal Funds Rate plus 0.50% or one month LIBOR plus 1.00%. In each case, the applicable margin is determined based upon our consolidated net leverage ratio. The interest is due and payable quarterly, in arrears, for loans bearing interest at the Base Rate and at the end of the applicable interest period in the case of loans bearing interest at the adjusted LIBOR rate. The credit facility is secured by substantially all of the Company’s assets and certain of our existing and future material domestic subsidiaries are required to guaranty our obligations under the credit facility. All outstanding principal and accrued and unpaid interest is due upon the credit facility's maturity, September 30, 2019.
Our credit facility contains customary covenants, subject in each case to customary exceptions and qualifications, which limit our and certain of our subsidiaries’ ability to, among other things, incur additional indebtedness or guarantee indebtedness of others; create liens on our assets; enter into mergers or consolidations; dispose of assets; prepay certain indebtedness or make changes to our governing documents and certain of our agreements; pay dividends and make other distributions on our capital stock, and redeem and repurchase our capital stock; make investments, including acquisitions; and enter into transactions with affiliates. Our credit facility additionally contains customary affirmative covenants. We are also required to comply with a maximum consolidated net leverage ratio and a minimum interest coverage ratio. The interest coverage ratio, which is a ratio of our four previous fiscal consecutive quarters' consolidated EBITDA to our interest expense, is to be not less than 3.00 to 1.00 as of the last day of any fiscal quarter. The consolidated net leverage ratio, which is the ratio of funded indebtedness on the last day of each fiscal quarter to the four previous consecutive fiscal quarters' consolidated EBITDA, is not to be greater than 3.50 to 1.00, provided that we can elect to increase the ratio to 3.75 to 1.00 for a specified period following a permitted acquisition. As of December 31, 2014, we were in compliance with the covenants under our credit facility.
The credit facility contains customary events of default, subject to customary cure periods for certain defaults, that include, among others, non-payment defaults, covenant defaults, material judgment defaults, bankruptcy and insolvency defaults, cross-defaults to certain other material indebtedness, ERISA defaults, inaccuracy of representations and warranties, and a change in control default.
In the event of a default on our credit facility, the obligations under the credit facility could be accelerated, the applicable interest rate under the credit facility could be increased, the loan commitments could be terminated, our subsidiaries that have guaranteed the credit facility could be required to pay the obligations in full, and our lenders would be permitted to exercise remedies with respect to all of the collateral that is securing the credit facility, including substantially all of our and our subsidiary guarantors’ assets. Any such default that is not cured or waived could have a material adverse effect on our liquidity and financial condition.
As of December 31, 2014 and 2013, we had $20.0 million and $0.0 million, respectively, outstanding under our revolving line of credit. As of December 31, 2014, $180.0 million was available under our revolving line of credit of which $10.0 million was available for the issuance of letters of credit. We had unamortized debt issuance costs of $1.3 million and $0.3 million at December 31, 2014 and 2013, respectively.
84
Previous Credit Facility
Our previous secured revolving credit facility had an aggregate principal amount of up to $150.0 million, subject to a borrowing formula, with a sub-limit of $10.0 million for the issuance of letters of credit on our behalf. At our option, the borrowings accrued interest at a per annum rate equal to either LIBOR or Wells Fargo’s prime rate (or, if greater, the Federal Funds Rate plus 0.50% or three month LIBOR plus 1.00%), in each case plus a margin ranging from 2.00% to 2.50%, in the case of LIBOR loans, and 0.00% to 0.25% in the case of prime rate loans, in each case based upon our senior leverage ratio. The interest was due and payable monthly, in arrears, for loans bearing interest at the prime rate and at the end of the applicable 1-, 2-, or 3-month interest period in the case of loans bearing interest at the adjusted LIBOR rate.
In May 2014, we entered into an amendment to the previous credit facility. Under the terms of the amendment, the restrictive covenants were amended to permit us to repurchase up to $75.0 million of our common stock, subject to certain conditions. Additionally, the fixed charge coverage ratio was replaced with a new minimum interest expense coverage ratio and the capital expenditures limitations were increased.
In June 2014, we entered into an amendment to the previous credit facility. Under the terms of the amendment, the parties to the credit facility consented to the acquisition of Kigo and agreed that the acquisition of Kigo would be a "Permitted Acquisition," as defined in the credit facility and would be excluded from the calculation of the Permitted Acquisition limit. Additionally, the amendment increased the value of our equipment that could be in the hands of our employees, consultants, or customers in the ordinary course of business to $2.5 million and amended the definition of "Aggregate Permitted Acquisition Limit" to $150.0 million, plus an additional $100.0 million if certain conditions are met. In June 2014, we borrowed a total of $25.0 million from our revolving line of credit in order to partially finance our acquisition of Kigo.
7. Stock-based Compensation
Our Amended and Restated 1998 Stock Incentive Plan (“Stock Incentive Plan”) provided for awards which could be granted in the form of incentive stock options, non-qualified stock options, restricted stock, stock appreciation rights and performance restricted stock. In August 2010 we discontinued issuance of new awards under the Stock Incentive Plan and concurrently adopted the 2010 Equity Incentive Plan ("Equity Incentive Plan"). The Equity Incentive Plan provides for awards which can be may be granted in the form of stock options, restricted stock, restricted stock units, stock appreciation rights, performance units and performance shares under substantially the same terms as the Stock Incentive Plan.
We also grant awards to our directors, generally in the form of stock options, in accordance with the Board of Directors Policy (“Board Plan”). The options generally vest immediately and have a four-year term. Should a director leave the board, we have the right to repurchase shares as if the options vested on a pro rata basis.
In connection with our acquisition of Multifamily Technology Solutions, Inc. ("MTS"), on August 24, 2011, we assumed 349,693 non-qualified and incentive stock options granted from MTS’s 2005 Equity Incentive Plan (“MTS Plan”) for 96 employees. Assumed options were converted to equivalent stock-based awards of RealPage based on the ratio of our fair market value of stock to the fair market value of MTS’s stock on the acquisition date. The number of shares and ratio of exercise price to market price were equitably adjusted to preserve the intrinsic value of the award as of immediately prior to the acquisition. The conversion was accounted for as a modification which did not result in an incremental increase in the fair value of the assumed option awards. The majority of assumed options vest over a four-year period at a rate of 25% or 20% after one year and then monthly on a straight-line basis thereafter while others vest ratably over a four-year period. Options granted generally are exercisable up to 10 years. No further options will be granted under the MTS Plan.
Our board of directors periodically approves increases to the number of shares of common stock reserved for issuance under the Equity Incentive Plan. At both December 31, 2014 and 2013, 22,134,259 shares of the Company's common stock were reserved for awards under the Equity Incentive Plan. The exercise of stock options and restricted stock units are fulfilled through the issuance of previously authorized but unissued common stock shares.
Total compensation expense related to our stock-based compensation plans was $37.1 million, $29.7 million and $18.2 million, for the years ended December 31, 2014, 2013, and 2012, respectively. During the years ended December 31, 2014, 2013, and 2012 we recognized a tax benefit of $14.0 million, $11.2 million and $6.8 million, respectively. Total unrecognized compensation expense related to our stock-based compensation plans was $57.1 million at December 31, 2014, and is expected to be recognized over a period of 2.0 years. Cash proceeds related to stock-based compensation transactions totaled $9.9 million, $10.6 million and $12.1 million during the years ended December 31, 2014, 2013, and 2012, respectively.
Stock Option Plan
Stock options granted prior to February 2014 under the generally vest over a period of 16 quarters with 75% vesting ratably over 15 quarters and the remaining 25% vesting in the 16th quarter. Beginning in February 2014, stock options granted generally vest ratably over a period of twelve quarters. Awards under the plan generally expire ten years from the date of the grant. All outstanding options were granted at exercise prices equal to or exceeding our estimate of the fair market value of our common stock at the date of grant.
85
The following table summarizes stock option transactions under our Stock Incentive Plan, Equity Incentive Plan, Board Plan and MTS Plan:
Number of Shares | Range of Exercise Prices | Weighted Average Exercise Price | |||||||||||||
Balance, January 1, 2012 | 7,292,031 | $ | 0.91 | – | $ | 29.50 | $ | 9.95 | |||||||
Granted | 1,641,470 | 17.67 | – | 24.64 | 20.09 | ||||||||||
Exercised | (2,389,704 | ) | 0.91 | – | 27.18 | 5.05 | |||||||||
Forfeited/cancelled | (684,154 | ) | 0.94 | – | 29.50 | 17.04 | |||||||||
Expired | (1,030 | ) | 0.94 | – | 27.18 | 2.73 | |||||||||
Balance, December 31, 2012 | 5,858,613 | 0.91 | – | 29.50 | 13.97 | ||||||||||
Granted | 2,421,124 | 19.78 | – | 25.70 | 22.20 | ||||||||||
Exercised | (1,556,865 | ) | 0.91 | – | 25.24 | 6.81 | |||||||||
Forfeited/cancelled | (800,470 | ) | 4.28 | – | 29.50 | 18.71 | |||||||||
Expired | (7,600 | ) | 24.03 | – | 24.64 | 24.35 | |||||||||
Balance, December 31, 2013 | 5,914,802 | 0.91 | – | 29.50 | 18.56 | ||||||||||
Granted | 1,934,031 | 15.19 | – | 21.54 | 17.68 | ||||||||||
Exercised | (907,765 | ) | 0.91 | – | 21.60 | 10.92 | |||||||||
Forfeited/cancelled | (1,336,894 | ) | 4.28 | – | 29.50 | 20.93 | |||||||||
Expired | (37,286 | ) | 19.78 | – | 24.64 | 24.02 | |||||||||
Balance, December 31, 2014 | 5,566,888 | 0.91 | – | 29.50 | 18.89 | ||||||||||
The below table provides information regarding stock options fully vested and expected to vest outstanding and exercisable at December 31:
2014 | 2013 | |||||||||||||||
Options Fully Vested and Expected to Vest | Options Exercisable | Options Fully Vested and Expected to Vest | Options Exercisable | |||||||||||||
Number of options | 5,545,427 | 2,455,134 | 5,864,340 | 1,984,472 | ||||||||||||
Weighted-average remaining contractual term (in years) | 7.7 | 6.6 | 7.9 | 6.6 | ||||||||||||
Weighted-average exercise price | $ | 18.88 | $ | 17.04 | $ | 18.53 | $ | 14.42 | ||||||||
Aggregate intrinsic value | $ | 22,012 | $ | 14,704 | $ | 32,023 | $ | 18,784 | ||||||||
The aggregate intrinsic value of options exercised during the years ended December 31, 2014, 2013 and 2012 was $8.5 million, $23.3 million and $42.7 million, respectively.
The fair value of each stock option grant was estimated on the date of grant using the Black Scholes option-pricing model with the following weighted-average assumptions and resulting weighted-average fair value per share:
2014 | 2013 | 2012 | |
Risk-free interest rates | 1.3% | 1.3% | 1.0% |
Expected option life (in years) | 4.4 | 6.0 | 6.0 |
Forfeiture rate | —% | 0.9% | 0.8% |
Dividend yield | —% | —% | —% |
Expected volatility | 42.8% | 48.5% | 51.4% |
Weighted-average grant date fair value | $6.44 | $10.37 | $9.78 |
Risk-free interest rate. This is the average U.S. Treasury rate (having a term that most closely approximates the expected life of the option) for the period in which the option was granted.
Expected life of the options. This is the period of time that the options granted are expected to remain outstanding.
Forfeiture rate. This is the projected annual rate at which we expect awards to be forfeited in the future.
86
Dividend yield. We have never declared or paid dividends on our common stock and do not anticipate paying dividends in the foreseeable future.
Expected volatility. Volatility is a measure of the amount by which a financial variable such as a share price has fluctuated (historical volatility) or is expected to fluctuate (expected volatility) during a period. We arrived at a volatility rate after considering our expected and historical volatility rates and the volatility rates of publicly traded peers.
Restricted Stock Awards
Restricted stock is an award that entitles the holder to receive shares of our common stock as the award vests. The fair value of each non-market-based restricted stock award is based on the closing common stock price on the date of grant.
Time-based restricted stock awards:
Time-based restricted stock awards granted prior to February 2014 generally vest ratably over 16 quarters following the date of grant. Beginning in February 2014, restricted stock awards granted generally vest over a period of 12 quarters following the grant date. Compensation expense for time-based restricted stock awards is recognized over the vesting period on a straight-line basis.
A summary of time-based restricted stock awards’ activity is presented in the table below.
Number of Shares | Weighted Average Grant-Date Fair Value | ||||||
Non-vested shares at January 1, 2012 | 998,958 | $ | 24.54 | ||||
Granted | 1,022,609 | 19.93 | |||||
Vested | (426,675 | ) | 23.08 | ||||
Forfeited/cancelled | (233,945 | ) | 23.34 | ||||
Non-vested shares at December 31, 2012 | 1,360,947 | 21.58 | |||||
Granted | 1,747,501 | 22.09 | |||||
Vested | (712,434 | ) | 21.30 | ||||
Forfeited/cancelled | (305,211 | ) | 21.58 | ||||
Non-vested shares at December 31, 2013 | 2,090,803 | 22.10 | |||||
Granted | 1,238,226 | 17.69 | |||||
Vested | (1,101,143 | ) | 21.18 | ||||
Forfeited/cancelled | (603,367 | ) | 20.36 | ||||
Non-vested shares at December 31, 2014 | 1,624,519 | 20.01 | |||||
Performance-based restricted stock awards:
We have also granted certain employees performance-based restricted stock awards. These shares vest dependent upon attainment of various levels of performance that equal or exceed targeted levels and generally vest in their entirety one to two years from the date of grant. Compensation expense for performance-based restricted stock awards is recognized based on the probability of achievement of the performance condition.
87
A summary of performance-based restricted stock awards’ activity is presented in the table below.
Number of Shares | Weighted Average Grant-Date Fair Value | ||||||
Non-vested shares at January 1, 2012 | 533,587 | $ | 23.39 | ||||
Granted | 270,000 | 22.93 | |||||
Vested | (132,791 | ) | 12.87 | ||||
Forfeited/cancelled | (395,539 | ) | 27.26 | ||||
Non-vested shares at December 31, 2012 | 275,257 | 22.46 | |||||
Granted | 100,000 | 21.60 | |||||
Vested | (31,902 | ) | 17.99 | ||||
Forfeited/cancelled | (273,355 | ) | 23.40 | ||||
Non-vested shares at December 31, 2013 | 70,000 | 18.10 | |||||
Granted | — | — | |||||
Vested | — | — | |||||
Forfeited/cancelled | (70,000 | ) | 18.10 | ||||
Non-vested shares at December 31, 2014 | — | — | |||||
Market-based restricted stock awards:
During 2014 we granted certain employees market-based restricted stock awards. The shares were issued in two tranches that become eligible for vesting if the average closing price per share of our common stock equals or exceeds an established threshold for each tranche for twenty consecutive days prior to July 1, 2017. The shares vest quarterly over one year following the date they became eligible for vesting and, if then eligible, shall be fully vested on July 1, 2017.
A summary of performance-based restricted stock awards’ activity is presented in the table below.
Number of Shares | Weighted Average Grant-Date Fair Value | ||||||
Balance at December 31, 2013 | — | $ | — | ||||
Granted | 520,000 | 11.26 | |||||
Vested | — | — | |||||
Forfeited/cancelled | — | — | |||||
Balance at December 31, 2014 | 520,000 | 11.26 | |||||
We estimate the fair value of market-based restricted stock awards using a discrete model to analyze the fair value of the subject shares. The discrete model utilizes multiple stock price-paths, through the use of Monte Carlo simulation, which are then analyzed to determine the fair value of the subject shares. The awards granted during 2014 were valued using the following assumptions:
Risk-free interest rates | 1.1% |
Expected volatility | 43.6% |
Risk-free interest rate. We estimated the risk free rate from the 3-year U.S. Treasury strip note yield curve at the valuation date.
Expected volatility. Volatility is a measure of the amount by which a financial variable such as a share price has fluctuated (historical volatility) or is expected to fluctuate (expected volatility) during a period. We arrived at a volatility rate after considering our expected and historical volatility rates and the volatility rates of publicly traded peers.
Compensation expense related to market-based restricted stock awards is recognized over the requisite service period on a straight-line basis. The requisite service period is a measure of the expected time to reach the respective vesting threshold. We estimated this period by utilizing a Monte Carlo simulation, considering only those stock price-paths in which the threshold was exceeded. The estimated requisite service period for the market-based restricted stock shares issued in 2014 ranges between twelve and seventeen months.
8. Commitments and Contingencies
Lease Commitments
88
In the first quarter of 2013, we entered into a capital lease agreement for software that expires in 2016. We recognize lease expense on a straight-line basis over the lease term. The assets under capital lease are as follows:
December 31, | ||||||||
2014 | 2013 | |||||||
(in thousands) | ||||||||
Software | $ | 1,977 | $ | 1,977 | ||||
Less: Accumulated amortization | (1,110 | ) | (565 | ) | ||||
Assets under capital lease, net | $ | 867 | $ | 1,412 | ||||
Amortization expense relating to capital leases is included in depreciation expense in the accompanying financial statements. The future minimum lease payments required under the capital leases and the present value of the net minimum lease payments as of December 31, 2014 are as follows:
(in thousands) | |||
2015 | $ | 588 | |
2016 | 294 | ||
Thereafter | — | ||
Total minimum lease payments | 882 | ||
Less amount representing average interest of 2.2% | (15 | ) | |
867 | |||
Less current portion | (575 | ) | |
Long-term portion | $ | 292 | |
The Company leases office facilities and equipment for various terms under long-term, non-cancellable operating lease agreements. The leases expire at various dates through 2020 and provide for renewal options. In the normal course of business, it is expected that these leases will be renewed or replaced by leases on other properties or equipment. The agreements generally require the Company to pay for executory costs such as real estate taxes, insurance and repairs.
During 2014, the Company entered into sublease agreements for certain of its leased office facilities. These sublease agreements expire through 2017.
Minimum annual rental commitments under non-cancellable operating leases and total minimum rentals to be received under non-cancellable subleases as were as follows at December 31, 2014:
Minimum Lease Commitments | Sublease Income | Net Lease Commitments | |||||||||
(in thousands) | |||||||||||
2015 | $ | 11,838 | $ | 201 | $ | 11,637 | |||||
2016 | 9,495 | 99 | 9,396 | ||||||||
2017 | 4,618 | 74 | 4,544 | ||||||||
2018 | 4,014 | — | 4,014 | ||||||||
2019 | 3,460 | — | 3,460 | ||||||||
Thereafter | 1,233 | — | 1,233 | ||||||||
$ | 34,658 | $ | 374 | $ | 34,284 | ||||||
Certain of the lease agreements contain provisions for future rent increases, rent free periods or periods in which rent payments are reduced (abated). The total amount of rental payments due over the lease term is charged to rent expense on the straight-line method over the term of the lease. The difference between rent expense recorded and the amount paid is credited or charged to Deferred Rent Obligation, which is included in accrued expenses and other current liabilities and other long-term liabilities in the accompanying Balance Sheet based on when the expense the deferred rent is expected to be recognize. Rent expense was $11.1 million, $9.7 million and $8.4 million for the years ended December 31, 2014, 2013 and 2012, respectively. Income from subleases was $0.1 million for each of the years ended December 31, 2014 and 2013. We had no sublease activity during 2012.
Guarantor Arrangements
We have agreements whereby we indemnify our officers and directors for certain events or occurrences while the officer or director is or was serving at our request in such capacity. The term of the indemnification period is for the officer or director’s lifetime. The maximum potential amount of future payments we could be required to make under these
89
indemnification agreements is unlimited; however, we have a director and officer insurance policy that limits our exposure and enables us to recover a portion of any future amounts paid. As a result of our insurance policy coverage, we believe the estimated fair value of these indemnification agreements is minimal. Accordingly, we had no liabilities recorded for these agreements as of December 31, 2014 or 2013.
In the ordinary course of our business, we enter into standard indemnification provisions in our agreements with our customers. Pursuant to these provisions, we indemnify our customers for losses suffered or incurred in connection with third-party claims that our products infringed upon any U.S. patent, copyright, trademark or other intellectual property right. Where applicable, we generally limit such infringement indemnities to those claims directed solely to our products and not in combination with other software or products. With respect to our products, we also generally reserve the right to resolve such claims by designing a non-infringing alternative, by obtaining a license on reasonable terms, or by terminating our relationship with the customer and refunding the customer’s fees.
The potential amount of future payments to defend lawsuits or settle indemnified claims under these indemnification provisions is unlimited in certain agreements; however, we believe the estimated fair value of these indemnity provisions is minimal, and, accordingly, we had no liabilities recorded for these agreements as of December 31, 2014 or 2013.
Litigation
From time to time, in the normal course of our business, we are a party to litigation matters and claims. Litigation can be expensive and disruptive to normal business operations. Moreover, the results of complex legal proceedings are difficult to predict and our view of these matters may change in the future as the litigation and events related thereto unfold. We expense legal fees as incurred. Insurance recoveries associated with legal costs incurred are recorded when they are deemed probable of recovery.
We review the status of each matter and record a provision for a liability when we consider both that it is probable that a liability has been incurred and that the amount of the loss can be reasonably estimated. These provisions are reviewed quarterly and adjusted as additional information becomes available. If either or both of the criteria are not met, we assess whether there is at least a reasonable possibility that a loss, or additional losses beyond those already accrued, may be incurred. If there is a reasonable possibility that a material loss (or additional material loss in excess of any existing accrual) may be incurred, we disclose an estimate of the amount of loss or range of losses, either individually or in the aggregate, as appropriate, if such an estimate can be made, or disclose that an estimate of loss cannot be made. An unfavorable outcome in any legal matter, if material, could have an adverse effect on our operations, financial position, liquidity and results of operations.
On January 24, 2011, Yardi Systems, Inc. filed a lawsuit in the U.S. District Court for the Central District of California against RealPage, Inc. and DC Consulting, Inc. (the “Yardi Lawsuit”). We answered and filed counterclaims against Yardi, and on July 1, 2012, the Company and Yardi entered into a settlement agreement (the “Settlement Agreement”) resolving all outstanding litigation between the parties. The Settlement Agreement also includes a license of certain Yardi intellectual property to the Company and a license of certain of our intellectual property to Yardi.
In connection with the Yardi Lawsuit, the Company made claims for reimbursement against each of its primary and excess layer general liability and errors and omissions liability insurance carriers. Each of our primary and excess layer errors and omissions liability insurance carriers other than Homeland Insurance of New York (“Homeland”) reimbursed the Company up to each of its policy limits. On July 19, 2012, we became aware of assertions by one of our primary layer errors and omissions insurance carriers, Ace European Group, Ltd. d/b/a Ace European Group, Barbican Syndicate 1995 at Lloyds (“Ace”), that Ace no longer considered the previously reimbursed $5.0 million payment covered under such policy, and that Ace demanded reimbursement of the $5.0 million payment that it had previously reimbursed to us. On August 12, 2012, our first excess layer errors and omissions insurance carrier, Axis Surplus Insurance Company (“Axis”), informed us that if Ace’s policy is deemed void, then Axis’ first excess layer policy was void on the same basis which would result in the Company’s obligation to reimburse to Axis $5.0 million in payments that Axis had previously reimbursed to us. The Company disputed these assertions by these carriers. Accordingly, on August 14, 2012, the Company filed a lawsuit in the U.S. District Court for the Eastern District of Texas against Ace and Axis (the “Ace Lawsuit”) seeking a declaration by the court that Ace and Axis have no right to, and no lawful reason to demand reimbursement of, the amounts paid to the Company’s counsel in connection with the Yardi Lawsuit. On February 25, 2014, RealPage and Axis entered into a confidential settlement and mutual release of claims, as a result of which Axis was dismissed from the Ace Lawsuit. On March 11, 2014, Ace filed its answer, affirmative defenses and counterclaims. On April 1, 2014, RealPage and Ace entered into a confidential settlement agreement and mutual release of claims and on April 7, 2014, the court entered an order granting the joint motion to dismiss all claims and demands asserted in the lawsuit. We expensed $4.7 million, inclusive of the settlements and other related costs in the first quarter of 2014.
We are involved in other litigation matters not listed above but we believe that any reasonably possible adverse outcome of these matters would not be material either individually or in the aggregate at this time. Our view of the matters not listed may change in the future as the litigation and events related thereto unfold.
90
9. Stockholders' Equity
The Company's Board of Directors approved a $50.0 million initial share repurchase program during the second quarter of 2014 and continuing for a period of up to one year. During 2014, we repurchased 966,595 shares of our common stock at a weighted average cost of $16.06 per share and a total cost of approximately $15.5 million.
10. Funds Held for Others
In connection with our payment processing services, we collect tenant funds and subsequently remit these tenant funds to our customers after varying holding periods. These funds are settled through our Originating Depository Financial Institution (“ODFI”) custodial accounts at major banks. The ODFI custodial account balances were $83.7 million and $70.1 million at December 31, 2014 and 2013, respectively. The ODFI custodial account balances are included in our consolidated balance sheets as restricted cash. The corresponding liability for these custodial balances is reflected as customer deposits. In connection with the timing of our payment processing services, we are exposed to credit risk in the event of nonperformance by other parties, such as returned checks. We utilize credit analysis and other controls to manage the credit risk exposure. We have not experienced any credit losses to date. Any expected losses are included in our accounts receivable allowances on our consolidated balance sheet.
The ODFI custodial accounts are in the name of, RealPage Payment Processing Services, Inc. (“RPPS”), a bankruptcy-remote, special-purpose entity, that is a wholly owned subsidiary of the Company. We provide processing and administrative services to RPPS through a services agreement.
The obligations of RPPS under the ODFI custodial account agreement are guaranteed by us.
In connection with our renter insurance products, we collect premiums from policy holders and subsequently remit the premium, net of our commission, to the underwriter. We maintain separate accounts for these transactions. We had $1.7 million and $1.5 million in restricted cash for the periods ended December 31, 2014 and 2013, respectively, and $1.7 million and $1.5 million in customer deposits related to these insurance products for periods ended December 31, 2014 and 2013, respectively. We had $0.1 million and $0.4 million in restricted cash and 0.1 million and $0.4 million in customer deposits relating to our utility management solution at December 31, 2014 and 2013.
11. Net (Loss) Income Per Share
Basic net (loss) income per share was computed by dividing the net (loss) income by the weighted average number of common shares outstanding during the period. Diluted net (loss) income per share was computed by using the weighted average number of common shares outstanding, including potential dilutive shares of common stock assuming the dilutive effect of outstanding stock options and restricted stock using the treasury stock method. Weighted average shares from common share equivalents in the amount of 1,273,889, 1,058,334 and 644,299 shares were excluded from the dilutive shares outstanding because their effect was anti-dilutive for the years ended December 31, 2014, 2013, and 2012, respectively.
The following table presents the calculation of basic and diluted net (loss) income per share attributable to common stockholders:
91
Year Ended December 31, | ||||||||||||
2014 | 2013 | 2012 | ||||||||||
(in thousands, except per share amounts) | ||||||||||||
Numerator: | ||||||||||||
Net (loss) income | $ | (10,274 | ) | $ | 20,692 | $ | 5,183 | |||||
Denominator: | ||||||||||||
Basic: | ||||||||||||
Weighted average common shares used in computing basic net (loss) income per share | 76,991 | 74,962 | 71,838 | |||||||||
Diluted: | ||||||||||||
Weighted average common shares used in computing basic net (loss) income per share | 76,991 | 74,962 | 71,838 | |||||||||
Add weighted average effect of dilutive securities: | ||||||||||||
Stock options and restricted stock | — | 1,225 | 2,164 | |||||||||
Weighted average common shares used in computing diluted net (loss) income per share | 76,991 | 76,187 | 74,002 | |||||||||
Net (loss) income per common share: | ||||||||||||
Basic | $ | (0.13 | ) | $ | 0.28 | $ | 0.07 | |||||
Diluted | $ | (0.13 | ) | $ | 0.27 | $ | 0.07 | |||||
12. Income Taxes
The domestic and foreign components of (loss) income before provision for income taxes were as follows:
Year Ended December 31, | ||||||||||||
2014 | 2013 | 2012 | ||||||||||
(in thousands) | ||||||||||||
Domestic | $ | (18,768 | ) | $ | 19,230 | $ | 9,151 | |||||
Foreign | 2,161 | 1,252 | 251 | |||||||||
Total | $ | (16,607 | ) | $ | 20,482 | $ | 9,402 | |||||
Our (benefit) provision for income taxes consisted of the following components:
Year Ended December 31, | ||||||||||||
2014 | 2013 | 2012 | ||||||||||
(in thousands) | ||||||||||||
Current: | ||||||||||||
Federal | $ | — | $ | — | $ | — | ||||||
State | 437 | 1,886 | 1,568 | |||||||||
Foreign | 550 | 421 | 27 | |||||||||
Total current taxes | 987 | 2,307 | 1,595 | |||||||||
Deferred: | ||||||||||||
Federal | (6,611 | ) | (1,832 | ) | 3,192 | |||||||
State | (460 | ) | (619 | ) | (574 | ) | ||||||
Foreign | (249 | ) | (66 | ) | 6 | |||||||
Total deferred taxes | (7,320 | ) | (2,517 | ) | 2,624 | |||||||
Total income tax (benefit) provision | $ | (6,333 | ) | $ | (210 | ) | $ | 4,219 | ||||
The reconciliation of our income tax (benefit) expense computed at the U.S. federal statutory tax rate to the actual income tax (benefit) expense is as follows:
92
Year Ended December 31, | ||||||||||||
2014 | 2013 | 2012 | ||||||||||
(in thousands) | ||||||||||||
Expense derived by applying the Federal income tax rate to (loss) income before taxes | $ | (5,813 | ) | $ | 7,169 | $ | 3,291 | |||||
State income tax, net of federal benefit | (177 | ) | 607 | 445 | ||||||||
Foreign income tax | (477 | ) | (170 | ) | (55 | ) | ||||||
Change in valuation allowance | — | (9,087 | ) | — | ||||||||
Benefit of assets not previously recognized | (516 | ) | — | — | ||||||||
Nondeductible expenses | 454 | 644 | 612 | |||||||||
Fair value adjustment on stock acquisition | (28 | ) | 487 | (251 | ) | |||||||
Stock-based compensation | 223 | 139 | 171 | |||||||||
Other | 1 | 1 | 6 | |||||||||
$ | (6,333 | ) | $ | (210 | ) | $ | 4,219 | |||||
Deferred income taxes reflect the net tax effect of temporary differences between the carrying amounts of the assets and liabilities for financial reporting purposes and the amounts used for income tax purposes. Significant components of our deferred tax assets and liabilities are as follows:
December 31, | ||||||||
2014 | 2013 | |||||||
(in thousands) | ||||||||
Deferred tax assets: | ||||||||
Reserves, deferred revenue and accrued liabilities | $ | 6,392 | $ | 6,303 | ||||
Stock-based compensation | 12,238 | 10,873 | ||||||
Net operating loss carryforwards | 22,348 | 16,106 | ||||||
Total gross deferred tax assets | 40,978 | 33,282 | ||||||
Deferred tax asset valuation allowance | — | (43 | ) | |||||
Total deferred tax assets | 40,978 | 33,239 | ||||||
Deferred tax liabilities: | ||||||||
Property, equipment and software | (8,217 | ) | (5,408 | ) | ||||
Other | (2,459 | ) | (2,055 | ) | ||||
Intangible assets | (21,965 | ) | (23,871 | ) | ||||
Total deferred tax liabilities | (32,641 | ) | (31,334 | ) | ||||
Net deferred tax assets | $ | 8,337 | $ | 1,905 | ||||
Our management periodically evaluates the realizability of the deferred tax assets and, if it is determined that it is more likely than not that the deferred tax assets are realizable, adjusts the valuation allowance accordingly. During 2013, we were able to conclude that given our performance, the realization of our deferred tax assets was more likely than not and accordingly reversed valuation allowances of approximately $9.2 million and recorded the reduction in valuation allowances as a tax benefit for the period. The determination of the level of valuation allowance at December 31, 2014 is based on an estimated forecast of future taxable income which includes many judgments and assumptions. Accordingly, it is at least reasonably possible that future changes in one or more assumptions may lead to a change in judgment regarding the level of valuation allowance required in future periods
The acquisition of the stock of Kigo, Inc. resulted in an additional net deferred tax liability of $0.5 million. This net liability includes a deferred tax liability of $1.4 million related to intangibles that are not subject to amortization for tax purposes and a deferred tax asset of $1.0 million related to net operating loss carryforwards.
The acquisition of the stock of RentSentinel resulted in an additional net deferred tax asset of $0.2 million. This net asset includes a deferred tax liability of $1.8 million related to intangibles that are not subject to amortization for tax purposes, a deferred tax asset of $2.1 million related to net operating loss carryforwards and other miscellaneous deferred tax liabilities of $0.1 million.
93
The acquisition of the stock of My Building resulted in an additional net deferred tax liability of $0.8 million. This net liability includes a deferred tax liability of $1.2 million related to intangibles that are not subject to amortization for tax purposes, a deferred tax asset of $0.3 million related to net operating loss carryforwards and other miscellaneous deferred tax assets of $0.1 million.
We have not recognized deferred tax assets of $129.0 million for excess tax benefits that arose directly from tax deductions related to equity compensation greater than amounts recognized for financial reporting. These excess stock compensation benefits will be credited to additional paid-in capital if realized. We use the "with-and-without" method, as described in ASC 740, for purposes of determining when excess tax benefits have been realized. In 2014, we recognized excess stock compensation benefits of $2.2 million and was recorded as additional paid-in capital and offset a portion our current tax liability.
Our largest deferred tax assets are our federal and state net operating loss carryforwards of $183.8 million and $7.3 million respectively. The federal net operating losses will begin to expire in 2020 and the state net operating losses will begin to expire in 2015. Of the total net operating loss carryforwards, approximately $129.2 million is attributable to deductions originating from the exercise of non-qualified employee stock options, the benefit of which will be credited to paid-in capital and the related deferred tax asset when realized.
Net operating losses generated by us are not currently subject to the carryforward limitation in Section 382 of the Internal Revenue Code (“Section 382 limitation”); however, $23.9 million of net operating losses generated by subsidiaries prior to their acquisition by us are subject to the Section 382 limitation. The limitation on these pre-acquisition net operating loss carryforwards will fully expire in 2031. A cumulative change in ownership among material shareholders, as defined in Section 382 of the Internal Revenue Code, during a three-year period may limit utilization of the federal net operating loss carryforwards.
Our subsidiary in Hyderabad, India benefited from a tax holiday granted under the Software Technology Parks of India program upon commencement of business operations in 2008 through March 31, 2011. During this holiday period we were required to pay a minimum alternative tax which was available to reduce our post-holiday tax liability. Effective July 8, 2013, this subsidiary benefits from a tax holiday under the Special Economic Zone program. This benefit applies to a portion of our operations in this location. The expiration of this tax holiday will increase our effective income tax rate.
Our subsidiary in Manila, Philippines currently benefits from income tax holiday incentives in the Philippines pursuant to the registrations with the Philippine Economic Zone Authority, or PEZA. Under such PEZA registrations, the income tax holiday of our PEZA-registered project in the Philippines expires in 2015. The expiration of this tax holiday will increase our effective income tax rate.
No provision has been made for U.S federal and state income taxes on the undistributed earnings of approximately $3.5 million relating to our foreign subsidiaries as such earnings are expected to be reinvested and are considered permanent in duration. If these earnings were ultimately distributed to the U.S. in the form of dividends or otherwise, or if the shares of the subsidiaries were sold or transferred, we would likely be subject to additional U.S. income taxes, net of the impact of any available foreign tax credits. It is not practicable to estimate the additional income taxes related to permanently reinvested earnings in the subsidiaries.
Uncertain Tax Positions
At December 31, 2014 and 2013, we had no unrecognized tax benefits. Our policy is to include interest and penalties related to unrecognized tax benefits in income tax expense, and as of December 31, 2014 and 2013, there were no accrued interest and penalties.
We file consolidated and separate tax returns in the U.S. federal jurisdiction and five foreign jurisdictions. We are no longer subject to U.S. federal income tax examinations for years before 2011 and are no longer subject to state and local income tax examinations by tax authorities for years before 2010. However, net operating losses from all years continue to be subject to examinations and adjustments for at least three years following the year in which the attributes are used. We are not currently under audit for federal, state or any foreign jurisdictions.
The Company plans to file amended 2013 and 2012 tax returns for selected states to correct certain items that were improperly deducted as detected by the Company subsequent to the initial filings. The primary effect of the amended returns will not result in a current tax liability and will reduce the Company’s NOL deferred tax asset by approximately $1.0 million. The Company’s deferred tax balances presented above have been adjusted for the effects of the planned amended returns.
13. Employee Benefit Plans
In 1998, our board of directors approved a defined contribution plan that provides retirement benefits under the provisions of Section 401(k) of the Internal Revenue Code. Our 401(k) Plan (“Plan”) covers substantially all employees who meet a minimum service requirement. Under the Plan, we can elect to make voluntary contributions. Contributions of $1.3 million, $0.9 million and $0.9 million were made by us for the years ended December 31, 2014, 2013 and 2012, respectively.
94
14. Fair Value Measurements
The Company records certain financial liabilities at fair value on a recurring basis. The Company determines fair values based on the price it would receive to sell an asset or pay to transfer a liability in an orderly transaction between market participants at the measurement date and in the principal or most advantageous market for that asset or liability.
The prescribed fair value hierarchy and related valuation methodologies are as follows:
Level 1 | — | Inputs are quoted prices in active markets for identical assets or liabilities. |
Level 2 | — | Inputs are quoted prices for similar assets or liabilities in active markets, quoted prices for identical or similar assets or liabilities in markets that are not active, inputs other than quoted prices that are observable and market-corroborated inputs which are derived principally from or corroborated by observable market data. |
Level 3 | — | Inputs are derived from valuation techniques in which one or more significant inputs or value drivers are unobservable. |
The categorization of an asset or liability within the fair value hierarchy is based on the inputs described above and does not necessarily correspond to the Company’s perceived risk of that asset or liability. Moreover, the methods used by the Company may produce a fair value calculation that may not be indicative of net realizable value or reflective of future fair values. Furthermore, although the Company believes its valuation methods are appropriate and consistent with other market participants, the use of different methodologies or assumptions to determine the fair value of certain financial instruments and non-financial assets and liabilities could result in a different fair value measurement at the reporting date.
Assets and liabilities measured at fair value on a recurring basis:
Contingent consideration obligations: The fair value of contingent consideration obligations is estimated using a probability weighted discount model on the achievement of the conditions upon which the contingent obligation is dependent. The probability of achieving the specified conditions is assessed by applying a Monte Carlo weighted-average model. Inputs into the valuation model include a discount rate specific to the acquired entity, a measure of the estimated volatility and the risk free rate of return. There were no changes in our valuation methodology during the years ended December 31, 2014 and 2013.
Significant unobservable inputs used in the contingent consideration fair value measurements included the following at December 31:
2014 | 2013 | |||
Discount rates | 22.5 - 64.0% | 23.3 - 27.2% | ||
Volatility rates | 45.0 - 48.0% | 58.0% | ||
Risk free rate of return | 0.1% - 0.2% | 0.1% | ||
In addition to the inputs described above, the fair value estimates consider the projected future operating and financial results for the factor upon which the respective contingent obligation is dependent. The fair value estimates are generally sensitive to changes in these projections. We develop the projected future operating and financial results based on analysis of historical results, market conditions and the expected impact of anticipated changes in our overall business and/or product strategies.
The following table discloses the liabilities measured at fair value on a recurring basis as of December 31, 2014 and 2013:
Fair value at December 31, 2014 | |||||||||||||||
Total | Level 1 | Level 2 | Level 3 | ||||||||||||
Contingent consideration related to the acquisition of: | |||||||||||||||
Active Building | $ | 1,566 | $ | — | $ | — | $ | 1,566 | |||||||
MyBuilding | 248 | — | — | 248 | |||||||||||
InstaManager | 2,335 | — | — | 2,335 | |||||||||||
VMM | 1 | — | — | 1 | |||||||||||
$ | 4,150 | $ | — | $ | — | $ | 4,150 | ||||||||
95
Fair value at December 31, 2013 | |||||||||||||||
Total | Level 1 | Level 2 | Level 3 | ||||||||||||
Contingent consideration related to the acquisition of: | |||||||||||||||
Senior Living | $ | 113 | $ | — | $ | — | $ | 113 | |||||||
Active Building | 1,366 | — | — | 1,366 | |||||||||||
MyBuilding | 348 | — | — | 348 | |||||||||||
$ | 1,827 | $ | — | $ | — | $ | 1,827 | ||||||||
There were no assets measured at fair value on a recurring basis at December 31, 2014 and 2013. There were no transfers between Level 1 and Level 2, or between Level 2 and Level 3 measurements during the years ended December 31, 2014 and 2013.
The changes in the fair value of Level 3 measurements for the reporting periods are as follows:
(in thousands) | |||
Balance, January 1, 2012 | $ | 364 | |
Initial contingent consideration | 1,614 | ||
Net gain on change in fair value | (151 | ) | |
Balance, December 31, 2013 | 1,827 | ||
Initial contingent consideration | 2,939 | ||
Settlements through cash payments | (229 | ) | |
Net gain on change in fair value | (387 | ) | |
Balance, December 31, 2014 | $ | 4,150 | |
Net gains or losses on the change in the fair value of the contingent consideration obligations are included in the general and administrative line in the accompanying Consolidated Statements of Operations.
There were no assets or liabilities measured at fair value on a non-recurring basis at December 31, 2014 or 2013.
15. Related Party
Beginning in 2012, Scott S. Ingraham began serving on our board of directors. He is an investor in Zuma Capital Greenville LLC ("ZCG"), which is a minority member of the parent entity from which we acquired certain assets relating to the LevelOne business in November 2010. Pursuant to the LevelOne acquisition agreement, we held back a portion of the purchase price for a period of time in order to ensure payment for any claims that arose post-acquisition, which amount, net of claims and adjustments, was paid in May 2012. ZCG's interest in this pay-out was approximately $0.2 million. Mr. Ingraham also serves on the Board of Trust Managers of Camden Property Trust, one of our larger customers.
16. Selected Quarterly Financial Data (unaudited)
Three Months Ended, | |||||||||||||||||||||||||||||||
December 31, 2014 | September 30, 2014 | June 30, 2014 | March 31, 2014 | December 31, 2013 | September 30, 2013 | June 30, 2013 | March 31, 2013 | ||||||||||||||||||||||||
(in thousands) | |||||||||||||||||||||||||||||||
Revenue: | |||||||||||||||||||||||||||||||
On demand | $ | 101,261 | $ | 100,747 | $ | 91,606 | $ | 97,008 | $ | 92,081 | $ | 94,084 | $ | 90,825 | $ | 85,322 | |||||||||||||||
On premise | 648 | 755 | 826 | 865 | 892 | 838 | 1,011 | 950 | |||||||||||||||||||||||
Professional and other | 2,555 | 3,034 | 2,556 | 2,690 | 2,546 | 3,149 | 2,615 | 2,709 | |||||||||||||||||||||||
Total revenue | 104,464 | 104,536 | 94,988 | 100,563 | 95,519 | 98,071 | 94,451 | 88,981 | |||||||||||||||||||||||
Gross profit | 57,946 | 58,225 | 52,873 | 60,636 | 58,013 | 59,960 | 57,111 | 53,617 | |||||||||||||||||||||||
Net (loss) income | 110 | (3,257 | ) | (6,291 | ) | (836 | ) | 2,178 | 12,886 | 4,610 | 1,018 | ||||||||||||||||||||
Net (loss) income per share: | |||||||||||||||||||||||||||||||
Basic and Diluted | $ | 0.00 | $ | (0.04 | ) | $ | (0.08 | ) | $ | (0.01 | ) | $ | 0.03 | $ | 0.17 | $ | 0.06 | $ | 0.01 | ||||||||||||
96
Item 9. | Changes in and Disagreements With Accountants on Accounting and Financial Disclosure |
None.
Item 9A. | Controls and Procedures |
Evaluation of Disclosure Controls and Procedures
Pursuant to Rule 13a-15(b) and Rule 15d-15(b) under the Securities Exchange Act of 1934, as amended (the “Exchange Act”), we carried out an evaluation, with the participation of our management, and under the supervision of our Chief Executive Officer and Chief Financial Officer, of the effectiveness of our disclosure controls and procedures (as defined under Rule 13a-15(e) and 15d-15(e) under the Exchange Act) as of the end of the period covered by this Annual Report on Form 10-K. Based upon that evaluation, our Chief Executive Officer and Chief Financial Officer concluded that our disclosure controls and procedures are effective in ensuring that information required to be disclosed in the reports that we file or submit under the Exchange Act, is recorded, processed, summarized and reported, within the time periods specified in the SEC’s rules and forms, and that such information is accumulated and communicated to management, including our Chief Executive Officer and Chief Financial Officer, as appropriate, to allow timely decisions regarding required disclosure. Management’s assessment of the effectiveness of our disclosure controls and procedures is expressed at the level of reasonable assurance because management recognizes that any controls and procedures, no matter how well designed and operated, can provide only reasonable assurance of achieving their objectives.
Management’s Report on Internal Control over Financial Reporting and Attestation Report of the Independent Registered Public Accounting Firm
Our internal controls over financial reporting are designed to provide reasonable assurance regarding the reliability of financial reporting and the preparation of financial statements for external purposes in accordance with generally accepted accounting principles in the United States. Management is responsible for establishing and maintaining adequate internal control over financial reporting. Because of its inherent limitations, internal control over financial reporting may not prevent or detect misstatements. Also, projections of any evaluation of effectiveness to future periods are subject to the risk that controls may become inadequate because of changes in conditions or that the degree or compliance with the policies or procedures may deteriorate.
Under supervision and with participation of management, including the Chief Executive Officer and Chief Financial Officer, we conducted an evaluation of the effectiveness of internal control over financial reporting as of December 31, 2014. In conducting this evaluation, management used the criteria set forth by the Committee of Sponsoring Organizations of the Treadway Commission (“COSO”) in Internal Control — Integrated Framework (1992 framework). Based on our evaluation using criteria set by COSO, management concluded internal control over financial reporting was effective as of December 31, 2014.
The effectiveness of internal control over financial reporting as of December 31, 2014 has been audited by Ernst & Young LLP, our independent registered public accounting firm, which is stated in their report included in Part II Item 8 of this Annual Report on Form 10-K.
Changes in Internal Controls
There were no significant changes in our internal control over financial reporting during the three months ended December 31, 2014 that have materially affected, or are reasonably likely to materially affect, our internal control over financial reporting.
Inherent Limitations of Internal Controls
Our management, including our Chief Executive Officer and Chief Financial Officer, does not expect that our disclosure controls and procedures or our internal controls will prevent all error and all fraud. A control system, no matter how well conceived and operated, can provide only reasonable, not absolute, assurance that the objectives of the control system are met. Because of the inherent limitations in all control systems, no evaluation of controls can provide absolute assurance that all control issues and instances of fraud, if any, within the company have been detected. These inherent limitations include the realities that judgments in decision-making can be faulty, and that breakdowns can occur because of a simple error or mistake. Additionally, controls can be circumvented by the individual acts of some persons, by collusion of two or more people, or by management override of the control. The design of any system of controls also is based in part upon certain assumptions about the likelihood of future events, and there can be no assurance that any design will succeed in achieving its stated goals under all
97
potential future conditions. Over time, controls may become inadequate because of changes in conditions, or the degree of compliance with the policies or procedures may deteriorate. Because of the inherent limitations in a cost-effective control system, misstatements due to error or fraud may occur and not be detected.
Item 9B. | Other Information |
None.
PART III
Item 10. | Directors, Executive Officers and Corporate Governance |
The information required by this item is incorporated by reference to RealPage’s Proxy Statement for its 2015 Annual Meeting of Stockholders to be filed with the SEC within 120 days after the end of the fiscal year ended December 31, 2014.
Item 11. | Executive Compensation |
The information required by this item is incorporated by reference to RealPage’s Proxy Statement for its 2015 Annual Meeting of Stockholders to be filed with the SEC within 120 days after the end of the fiscal year ended December 31, 2014.
Item 12. | Security Ownership of Certain Beneficial Owners and Management and Related Stockholder Matters |
The information required by this item is incorporated by reference to RealPage’s Proxy Statement for its 2015 Annual Meeting of Stockholders to be filed with the SEC within 120 days after the end of the fiscal year ended December 31, 2014.
Item 13. | Certain Relationships, and Related Transactions, and Director Independence |
The information required by this item is incorporated by reference to RealPage’s Proxy Statement for its 2015 Annual Meeting of Stockholders to be filed with the SEC within 120 days after the end of the fiscal year ended December 31, 2014.
Item 14. | Principal Accounting Fees and Services |
The information required by this item is incorporated by reference to RealPage’s Proxy Statement for its 2015 Annual Meeting of Stockholders to be filed with the SEC within 120 days after the end of the fiscal year ended December 31, 2014.
98
PART IV
Item 15. | Exhibits and Financial Statement Schedules |
(a) Financial Statements
(1) The financial statements filed as part of this Annual Report on Form 10-K are listed on the index to financial statements.
(2) Any financial statement schedules required to be filed as part of this Annual Report on Form 10-K are set forth in section (c) below.
(b) Exhibits
See Exhibit Index at the end of this Annual Report on Form 10-K, which is incorporated by reference.
(c) Financial Statement Schedules
The following schedule is filed as part of this Annual Report on Form 10-K:
All other schedules have been omitted because the information required to be presented in them is not applicable or is shown in the financial statements or related notes.
SCHEDULE II — VALUATION AND QUALIFYING ACCOUNTS
REALPAGE, INC.
December 31, 2014
(in thousands)
Allowance for Doubtful Accounts
Description | Balance at Beginning of Year | Additions Charged to Costs and Expenses | Deduction(1) | Balance at End of Year | ||||||||||||
Year ended December 31: | ||||||||||||||||
2012 | $ | 979 | $ | 1,794 | $ | (1,686 | ) | $ | 1,087 | |||||||
2013 | 1,087 | 3,661 | (3,834 | ) | 914 | |||||||||||
2014 | 914 | 3,676 | (2,227 | ) | 2,363 | |||||||||||
(1) | Uncollectable accounts written off, net of recoveries. |
99
SIGNATURES
Pursuant to the requirements of Section 13 or 15(d) of the Securities Exchange Act of 1934, the registrant has duly caused this Annual Report on Form 10-K to be signed on its behalf by the undersigned, thereunto duly authorized, in the City of Carrollton, State of Texas, on this 2nd day of March, 2015.
REALPAGE, INC. | ||
By: | /s/ Stephen T. Winn | |
Stephen T. Winn | ||
Chairman of the Board, Chief Executive Officer | ||
President and Director | ||
Pursuant to the requirements of the Securities Exchange Act of 1934, this Annual Report on Form 10-K has been signed by the following persons on behalf of the registrant and in the capacities and on the dates indicated:
Signature | Title | Date | ||
/s/ Stephen T. Winn Stephen T. Winn | Chairman of the Board, Chief Executive Officer, President and Director (Principal Executive Officer) | 3/2/2015 | ||
/s/ W. Bryan Hill W. Bryan Hill | Chief Financial Officer and Treasurer (Principal Financial and Accounting Officer) | 3/2/2015 | ||
/s/ Alfred R. Berkeley Alfred R. Berkeley | Director | 3/2/2015 | ||
/s/ Peter Gyenes Peter Gyenes | Director | 3/2/2015 | ||
/s/ Jeffrey T. Leeds Jeffrey T. Leeds | Director | 3/2/2015 | ||
/s/ Jason A. Wright Jason A. Wright | Director | 3/2/2015 | ||
/s/ Scott S. Ingraham Scott S. Ingraham | Director | 3/2/2015 | ||
/s/ Charles F. Kane Charles F. Kane | Director | 3/2/2015 | ||
100
EXHIBIT INDEX
Incorporated by Reference | ||||||||||
Exhibit Number | Exhibit Description | Form | Date | Number | Filed Herewith | |||||
2.1 | Agreement and Plan of Merger among the Registrant, multifamily Technology Solutions, Inc., RP Newco IV, Inc. and Shareholder Representative Services LLC as Representative, dated August 22, 2011 | 8-K | 8/23/2011 | 2.1 | ||||||
3.1 | Amended and Restated Certificate of Incorporation of the Registrant | S-1 | 7/26/2010 | 3.2 | ||||||
3.2 | Amended and Restated Bylaws of the Registrant | S-1 | 7/26/2010 | 3.4 | ||||||
4.1 | Form of Common Stock certificate of the Registrant | S-1 | 7/26/2010 | 4.1 | ||||||
4.2 | Shareholders’ Agreement among the Registrant and certain stockholders, dated December 1, 1998, as amended July 16, 1999 and November 3, 2000 | S-1 | 4/29/2010 | 4.2 | ||||||
4.3 | Second Amended and Restated Registration Rights Agreement among the Registrant and certain stockholders, dated February 22, 2008 | S-1 | 4/29/2010 | 4.3 | ||||||
4.4 | Registration Rights Agreement among the Registrant and certain stockholders, dated July 29, 2012 | S-3 | 9/13/2012 | 4.4 | ||||||
10.1 | Form of Indemnification Agreement entered into between the Registrant and each of its directors and officers | S-1 | 4/29/2010 | 10.1 | ||||||
10.2 | Amended and Restated 1998 Stock Incentive Plan+ | S-1 | 4/29/2010 | 10.2 | ||||||
10.3 | Amended and Restated 1998 Stock Incentive Plan (June 2010) + | S-1 | 6/7/2010 | 10.2G | ||||||
10.4 | Forms of Stock Option Agreements and Restricted Share Agreements approved for use under the 1998 Stock Incentive Plan+ | S-1 | 4/29/2010 | 10.2A, 10.2B, 10.2C, 10.2D | ||||||
10.5 | Forms of Stock Option Agreements and Restricted Share Agreements approved for use under the 1998 Stock Incentive Plan+ | S-1 | 6/7/2010 | 10.2E, 10.2F, 10.2H | ||||||
10.6 | Form of Director's Nonqualified Stock Option Agreement+ | S-1 | 4/29/2010 | 10.3 | ||||||
10.7 | Form of Notice of Grant of Restricted Shares (Outside Directors) + | S-1 | 6/7/2010 | 10.49 | ||||||
10.8 | 2010 Equity Incentive Plan+ | S-1 | 7/26/2010 | 10.4 | ||||||
10.9 | Amendment No. 1 to 2010 Equity Incentive Plan+ | 8-K | 2/24/2011 | 10.3 | ||||||
10.10 | Amendment No. 2 to 2010 Equity Incentive Plan+ | 8-K | 2/21/2013 | 10.2 | ||||||
10.11 | 2010 Equity Incentive Plan, as Amended and Restated June 4, 2014+ | DEF-14A | 4/17/2014 | Appendix A | ||||||
10.12 | Forms of Stock Option Award Agreements and Restricted Stock Award Agreements approved for use under the 2010 Equity Incentive Plan+ | S-8 | 8/17/2010 | 4.6, 4.7, 4.8, 4.9 | ||||||
10.13 | Stand-Alone Stock Option Agreement between the Registrant and Peter Gyenes, dated February 25, 2010+ | S-1 | 4/29/2010 | 10.7 | ||||||
10.14 | Non-Qualified Stock Option Agreement (Second Series) under the Amended and Restated 1998 Stock Incentive Plan between the Registrant and Timothy J. Barker dated October 27, 2005+ | S-1 | 4/29/2010 | 10.8 | ||||||
10.15 | Non-Qualified Stock Option Agreement (Second Series) under the Amended and Restated 1998 Stock Incentive Plan between the Registrant and Timothy J. Barker dated February 26, 2009+ | S-1 | 4/29/2010 | 10.9 | ||||||
10.16 | Notice of Stock Option Grant under the Amended and Restated 1998 Stock Incentive Plan between the Registrant and Timothy J. Barker dated February 25, 2010+ | S-1 | 4/29/2010 | 10.10 | ||||||
10.17 | Notice of Stock Option Grant under the Amended and Restated 1998 Stock Incentive Plan between the Registrant and Margot Lebenberg, dated May 12, 2010+ | S-1 | 6/7/2010 | 10.52 | ||||||
10.18 | Form of 2013 Management Incentive Plan+ | 8-K | 2/21/2013 | 10.1 | ||||||
101
Incorporated by Reference | ||||||||||
Exhibit Number | Exhibit Description | Form | Date | Number | Filed Herewith | |||||
10.19 | Form of 2014 Management Incentive Plan+ | 8-K | 2/24/2014 | 10.1 | ||||||
10.20 | Form of 2015 Management Incentive Plan+ | 8-K | 2/23/2015 | 10.1 | ||||||
10.21 | RealPage, Inc. Management Incentive Plan+ | DEF-14A | 4/17/2014 | Appendix B | ||||||
10.22 | Employment Agreement between the Registrant and Stephen T. Winn, dated December 30, 2003+ | S-1 | 4/29/2010 | 10.11 | ||||||
10.23 | Employment Agreement between the Registrant and Timothy J. Barker, dated October 31, 2005+ | S-1 | 4/29/2010 | 10.12 | ||||||
10.24 | Amendment to Employment Agreement between the Registrant and Timothy J. Barker, dated January 1, 2010+ | S-1 | 4/29/2010 | 10.13 | ||||||
10.25 | Employment Agreement between the Registrant and Ashley Chaffin Glover, dated March 3, 2005+ | S-1 | 4/29/2010 | 10.16 | ||||||
10.26 | Employment Agreement between multifamily Internet Ventures, LLC and Dirk D. Wakeham, dated April 12, 2007 and amended April 12, 2007+ | S-1 | 4/29/2010 | 10.17 | ||||||
10.27 | Employment Agreement between the Registrant and Jason Lindwall, dated January 8, 2008+ | S-1 | 6/7/2010 | 10.50 | ||||||
10.28 | Employment Agreement between the Registrant and Margot Lebenberg, dated May 12, 2010+ | S-1 | 6/7/2010 | 10.51 | ||||||
10.29 | Employment Agreement between the Registrant and Kurt Twining, dated July 5, 2011+ | 10-Q | 11/8/2011 | 10.2 | ||||||
10.30 | Employment Agreement 409A Addendum between the Registrant and Stephen T. Winn, dated November 5, 2010+ | 10-Q | 11/5/2010 | 10.5 | ||||||
10.31 | Employment Agreement 409A Addendum between the Registrant and Timothy J. Barker, dated November 5, 2010+ | 10-Q | 11/5/2010 | 10.6 | ||||||
10.32 | Employment Agreement 409A Addendum between the Registrant and Ashley Chaffin Glover, dated November 5, 2010+ | 10-Q | 11/5/2010 | 10.7 | ||||||
10.33 | Employment Agreement 409A Addendum between the Registrant and Dirk Wakeham, dated November 5, 2010+ | 10-Q | 11/5/2010 | 10.8 | ||||||
10.34 | Employment Agreement 409A Addendum between the Registrant and Margot Lebenberg, dated November 5, 2010+ | 10-Q | 11/5/2010 | 10.9 | ||||||
10.35 | Employment Agreement 409A Addendum between the Registrant and Jason Lindwall, dated November 5, 2010+ | 10-Q | 11/5/2010 | 10.10 | ||||||
10.36 | Amended and Restated Employment Agreement between the Registrant and Janine Steiner Jovanovic, dated August 1, 2012+ | S-3 | 9/13/2012 | 99.1 | ||||||
10.37 | Amended and Restated Employment Agreement between the Registrant and William P. Chaney, dated August 1, 2012+ | S-3 | 9/13/2012 | 99.2 | ||||||
10.38 | Employment Agreement between the Registrant and Alex Chang, dated September 7, 2012+ | S-3 | 9/13/2012 | 99.3 | ||||||
10.39 | Form of Stock Bonus Agreement between the Registrant and Stephen T. Winn, dated as of February 24, 2014+ | 8-K | 2/24/2014 | 10.2 | ||||||
10.40 | Employment Agreement, Severance Benefits Upon Change in Control Addendum, between the Registrant and Stephen T. Winn, dated January 1, 2014+ | 10-K | 3/3/2014 | 10.40 | ||||||
10.41 | Employment Agreement, Severance Benefits Upon Change in Control Addendum, between the Registrant and Timothy J. Barker, dated January 1, 2014+ | 10-K | 3/3/2014 | 10.41 | ||||||
10.42 | Employment Agreement, Severance Benefits Upon Change in Control Addendum, between the Registrant and Margot Carter, dated January 1, 2014+ | 10-K | 3/3/2014 | 10.42 | ||||||
10.43 | Employment Agreement, Severance Benefits Upon Change in Control Addendum, between the Registrant and Janine Steiner Jovanovic, dated January 1, 2014+ | 10-K | 3/3/2014 | 10.43 | ||||||
102
Incorporated by Reference | ||||||||||
Exhibit Number | Exhibit Description | Form | Date | Number | Filed Herewith | |||||
10.44 | Employment Agreement, Severance Benefits Upon Change in Control Addendum, between the Registrant and William Chaney, dated January 1, 2014+ | 10-K | 3/3/2014 | 10.44 | ||||||
10.45 | Employment Agreement between the Registrant and W. Bryan Hill, dated March 24, 2014+ | 8-K | 3/24/2014 | 10.1 | ||||||
10.46 | Amendment No. 1 to Stock Bonus Agreement between the Registrant and Stephen T. Winn, dated as of July 31, 2014+ | 8-K | 8/4/2014 | 10.1 | ||||||
10.47 | Form of Stock Bonus Agreement between the Registrant and each of Margot Carter, W. Bryan Hill, William Chaney and Janine Steiner Jovanovic, dated as of July 31, 2014+ | 8-K | 8/4/2014 | 10.2 | ||||||
10.48 | First Amendment to the Amended and Restated 2010 Equity Incentive Plan+ | 8-K | 1/21/2015 | 10.1 | ||||||
10.49 | Lease Agreement between the Registrant and CB Parkway Business Center V, Ltd., dated July 23, 1999 | S-1 | 4/29/2010 | 10.39 | ||||||
10.50 | First Amendment to Lease Agreement between the Registrant and CB Parkway Business Center V, Ltd., dated November 29, 1999 | S-1 | 4/29/2010 | 10.40 | ||||||
10.51 | Second Amendment to Lease Agreement between the Registrant and CB Parkway Business Center V, Ltd., dated January 30, 2006 | S-1 | 4/29/2010 | 10.41 | ||||||
10.52 | Third Amendment to Lease Agreement between the Registrant and CB Parkway Business Center V, Ltd., dated August 28, 2006 | S-1 | 4/29/2010 | 10.42 | ||||||
10.53 | Fourth Amendment to Lease Agreement between the Registrant and ARI-Commercial Properties, Inc., dated November 2007 | S-1 | 4/29/2010 | 10.43 | ||||||
10.54 | Fifth Amendment to Lease Agreement between the Registrant and ARI-Commercial Properties, Inc., dated February 4, 2009 | S-1 | 4/29/2010 | 10.44 | ||||||
10.55 | Sixth Amendment to Lease Agreement between the Registrant and ARI-Commercial Properties, Inc., dated March 30, 2009 | S-1 | 4/29/2010 | 10.45 | ||||||
10.56 | Lease Agreement between the Registrant and Savoy IBP 8, Ltd., dated August 28, 2006 | S-1 | 4/29/2010 | 10.46 | ||||||
10.57 | First Amendment to Lease Agreement among the Registrant, ARI-International Business Park, LLC, ARI—IBP 1, LLC, ARI—IBP 2, LLC, ARI—IBP 3, LLC, ARI—IBP 4, LLC, ARI—IBP 5, LLC, ARI—IBP 6, LLC, ARI—IBP 7, LLC, ARI—IBP 8, LLC, ARI—IBP 9, LLC, ARI—IBP 11, LLC and ARI—IBP 12, LLC, dated December 28, 2009 | S-1 | 4/29/2010 | 10.47 | ||||||
10.58 | Master Services Agreement between the Registrant and DataBank Holdings Ltd., dated May 31, 2007† | S-1 | 7/2/2010 | 10.48 | ||||||
10.59 | Credit Agreement by and among the Registrant, the lenders from time to time party thereto and Wells Fargo Bank, National Association, as administrative agent, dated September 30, 2014 | 10-Q | 11/10/2014 | 10.1 | ||||||
10.60 | Collateral Agreement by and among the Registrant, certain of its subsidiaries from time to time party thereto, and Wells Fargo Bank, National Association, as administrative agent, dated as of September 30, 2014 | 10-Q | 11/10/2014 | 10.2 | ||||||
10.61 | Guaranty Agreement made by certain domestic subsidiaries of Registrant in favor of Wells Fargo Bank, National Association, as administrative agent, dated as of September 30, 2014 | 10-Q | 11/10/2014 | 10.3 | ||||||
21.1 | Subsidiaries of the Registrant | X | ||||||||
23.1 | Consent of Ernst & Young LLP, Independent Registered Public Accounting Firm | X | ||||||||
31.1 | Certification of Chief Executive Officer pursuant to Exchange Act Rules 13a-14(a) or 15d-14(a), as adopted pursuant to Section 302 of the Sarbanes-Oxley Act of 2002 | X | ||||||||
31.2 | Certification of Chief Financial Officer pursuant to Exchange Act Rules 13a-14(a) or 15d-14(a), as adopted pursuant to Section 302 of the Sarbanes-Oxley Act of 2002 | X | ||||||||
103
Incorporated by Reference | ||||||||||
Exhibit Number | Exhibit Description | Form | Date | Number | Filed Herewith | |||||
32.1 | Certification of Chief Executive Officer pursuant to 18 U.S.C. Section 1350, as adopted pursuant to Section 906 of the Sarbanes-Oxley Act of 2002* | X | ||||||||
32.2 | Certification of Chief Financial Officer pursuant to 18 U.S.C. Section 1350, as adopted pursuant to Section 906 of the Sarbanes-Oxley Act of 2002* | X | ||||||||
101.INS | Instance | X | ||||||||
101.SCH | Taxonomy Extension Schema | X | ||||||||
101.CAL | Taxonomy Extension Calculation | X | ||||||||
101.LAB | Taxonomy Extension Labels | X | ||||||||
101.PRE | Taxonomy Extension Presentation | X | ||||||||
101.DEF | Taxonomy Extension Definition | X | ||||||||
+ | Indicates management contract or compensatory plan or arrangement. |
* | Furnished herewith |
† | Confidential treatment was granted by the Securities and Exchange Commission for portions of this exhibit. These portions have been omitted from the report and submitted separately to the Securities and Exchange Commission. |
104