Attached files
| file | filename |
|---|---|
| 8-K - 8-K - MATERION Corp | mtrn_20160226x8kinvestorpr.htm |

Investor Presentation May 2016 Exhibit 99.1

These slides contain (and the accompanying oral discussion will contain, where applicable) “forward- looking statements” within the meaning of the Private Securities Litigation Reform Act of 1995. These statements involve known and unknown risks, uncertainties and other factors that could cause the actual results of the Company to differ materially from the results expressed or implied by these statements, including health issues, litigation and regulation relating to our business, our ability to achieve and/or maintain profitability, significant cyclical fluctuations in our customers’ businesses, competitive substitutes for our products, risks associated with our international operations, including foreign currency rate fluctuations, energy costs and the availability and prices of raw materials, and other factors disclosed in periodic reports filed with the Securities and Exchange Commission. Consequently, these forward-looking statements should be regarded as the Company’s current plans, estimates and beliefs. The Company does not undertake and specifically declines any obligation to publicly release the results of any revisions to these forward-looking statements that may be made to reflect any future events or circumstances after the date of such statements or to reflect the occurrence of anticipated or unanticipated events. These slides include certain non-GAAP financial measures as defined by the rules and regulations of the Securities and Exchange Commission. A reconciliation of those measures to the most directly comparable GAAP equivalent is provided in the Appendix to this presentation as well as a glossary of non-GAAP definitions. Forward-looking Statements 2

Materion: Our Purpose Making advanced materials that improve the world 3

Materion at a Glance 4 Adjusted EPS(1) $1.60 Market cap @ 12/31/15 $560M Debt-to-capitalization 3% Operating cash flow $90M Dividend yield ~1% Revenues $1.03B Value-added sales $617.2M 2015 6.9 EV @ 12/31/15 / Adjusted EBITDA(1) (1) Non-GAAP, excludes special items

Performance Alloys & Composites 54% Advanced Materials 29% Precision Coatings 17% Consumer Electronics 26% Industrial Components 15% Medical 13% Defense 10% Automotive Electronics 9% Telecom Infrastructure 6% Energy 6% W H A T W E D O Materion: Mission Critical Advanced Materials 5 A Balanced Portfolio 2016

Entering a Phase of Renewed Long-term Profitable Growth Consolidation and product rationalization Sharpened execution, renewed long-term profitable growth 2002 2012 / 2014 Today Transformation: Growth in new markets and technologies 6

Materion: The Transformation GDP growth Multiples of GDP Limited markets Broader market opportunities Low margin Higher margin High infrastructure Efficient infrastructure High fixed and working capital Lower capital intensity Slow cash to cash cycle Faster cash cycle Faster growth – Higher margins – Stronger balance sheet 7

$1.67 2013 2014 2015 Performing Well Despite Headwinds Guidance Operating Margins (Adjusted EPS*) (Adjusted Op. Profit %* of Value-added Sales) 5.3% 7.7% 7.4% 2013 2014 2015 8 * Adjusted EPS and operating profit percent of value-added sales are non-GAAP results which exclude non-recurring costs in 2013 of $0.15 per share, non-recurring gains of $0.35 per share in 2014 and non-recurring gains of $0.02 per share in 2015. $1.12 $1.60

Why Invest in Materion? G O A L N E X T 3 Y E A R S : Sustained growth Double-digit EPS CAGR Strategy for sustained, profitable growth • Pathway for additional cost and working capital improvements Strong positions in growing markets • High barriers to entry 1 Promising new product launches 2 9 Strategy for sustained, profitable growth 4 3 Solid cash flow organic growth, acquisitions, dividends, share buybacks
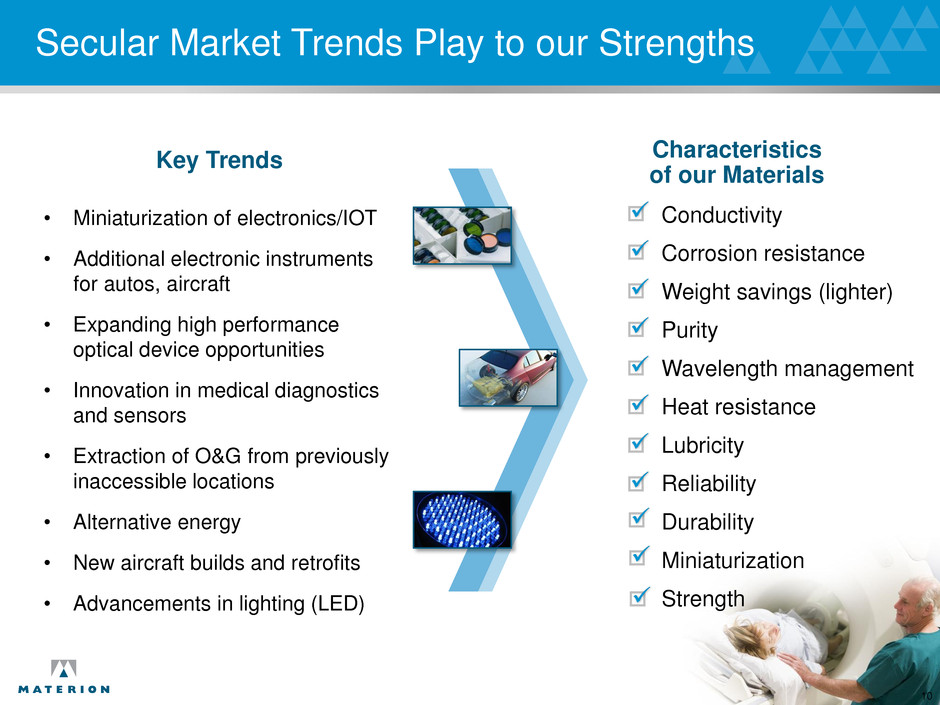
Secular Market Trends Play to our Strengths Key Trends • Miniaturization of electronics/IOT • Additional electronic instruments for autos, aircraft • Expanding high performance optical device opportunities • Innovation in medical diagnostics and sensors • Extraction of O&G from previously inaccessible locations • Alternative energy • New aircraft builds and retrofits • Advancements in lighting (LED) Characteristics of our Materials Conductivity Corrosion resistance Weight savings (lighter) Purity Wavelength management Heat resistance Lubricity Reliability Durability Miniaturization Strength 10
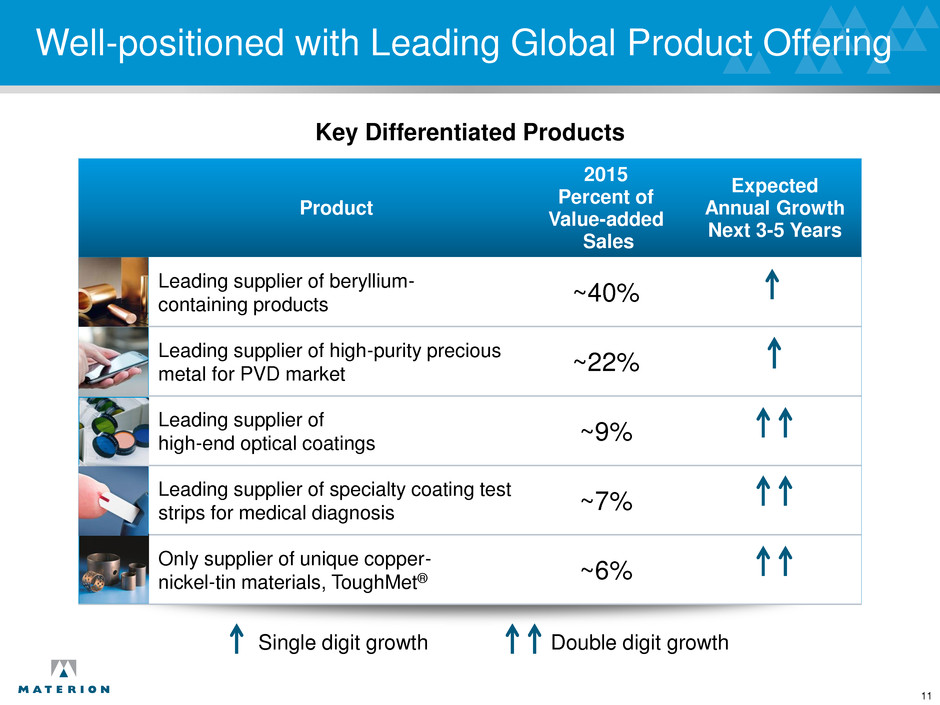
Well-positioned with Leading Global Product Offering Product 2015 Percent of Value-added Sales Expected Annual Growth Next 3-5 Years Leading supplier of beryllium- containing products ~40% Leading supplier of high-purity precious metal for PVD market ~22% Leading supplier of high-end optical coatings ~9% Leading supplier of specialty coating test strips for medical diagnosis ~7% Only supplier of unique copper- nickel-tin materials, ToughMet® ~6% Double digit growth Single digit growth Key Differentiated Products 11

Evolving Potential from Beryllium Supply Shortage Materion – leading position in beryllium market • Only global integrated producer – approximately 70 years of proven reserves in Utah mine – supplies over 70% of world’s mined beryllium • 40% of company sales include beryllium in some form Signs of shortage ahead • Global stockpiled sources depleting • No other commercially active bertrandite ore mine • Materion positioned to support world demand • Significant incremental profit potential 12

Why Invest in Materion? G O A L N E X T 3 Y E A R S : Sustained growth Double-digit EPS CAGR Strategy for sustained, profitable growth • Pathway for additional cost and working capital improvements Strong positions in growing markets • High barriers to entry 1 Promising new product launches 2 13 Strategy for sustained, profitable growth 4 3 Solid cash flow organic growth, acquisitions, dividends, share buybacks

Wide Range of Strategic Investments… New Wafer Coating Facility ISO Class 5 for Semiconductor Cleanroom Increased Capacity LED Phosphor ToughMet® Capacity Expansion Expanded Beryllium Hydroxide Capacity Singapore Expansion 14

… Driving Record Number of New Product Launches Examples of New Products Sales Growth Sales from new products were 12% of total value-added sales for 2015 New products Existing products Gesture Controls Dovetail Clad ToughMet® Oil & Gas Bulk Metallic Glass (Liquidmetal) 50% 50% Wafer Level Processing Dovetail Connectors 15

Why Invest in Materion? G O A L N E X T 3 Y E A R S : Sustained growth Double-digit EPS CAGR Strategy for sustained, profitable growth • Pathway for additional cost and working capital improvements Strong positions in growing markets • High barriers to entry 1 Promising new product launches 2 16 Strategy for sustained, profitable growth 4 3 Solid cash flow organic growth, acquisitions, dividends, share buybacks

Cash Flow and Working Capital Efficiency Focus Lean Sigma • Cycle time reduction • Yield improvement • On-time shipments 17 Improve Working Capital Efficiency Working capital % of net sales 2015 2018 (F) 25% 27% $0 $10 $20 $30 $40 $50 $60 $70 $80 $90 $100 2012 2013 2014 2015 Cash Flow from Operations ($ in millions)

Disciplined Capital Deployment Going Forward Return Cash to Shareholders • Share repurchase - $50M authorization ($20M remaining) • Dividends – increased 6% in 2015 Capex Below Depreciation • Invest in facilities • Invest in new products Growth • Organic • Selective bolt-on acquisitions 18 35% Debt & Shareholder 65% Growth

Why Invest in Materion? G O A L N E X T 3 Y E A R S : Sustained growth Double-digit EPS CAGR Strategy for sustained, profitable growth • Pathway for additional cost and working capital improvements Strong positions in growing markets • High barriers to entry 1 Promising new product launches 2 19 Strategy for sustained, profitable growth 4 3 Solid cash flow organic growth, acquisitions, dividends, share buybacks

Continuing to Execute Three Point Strategy Grow and Diversify Revenue Expand Margins Improve Capital Utilization • New products • Asia expansion • Strategic acquisitions • Higher margin products • Cost reductions • Disciplined pricing • Lean sigma • Improve working capital efficiency 1 2 3 Creating Shareholder Value 20

High Value-added Business Model 21 Identify high growth secular markets Target the fastest growing niches of those markets Expand with innovative products Add synergistic acquisitions Ensure financial discipline 01 02 03 04 05

Appendix

Top Key Markets Over 80% of Sales Market Q1 2016 % of Value-added Sales Macro Trends Key Drivers Consumer Electronics 26% • Smart device growth • Gesture control Industrial Components 15% • Heavy equipment builds • Plastic tooling • Fire protection (R and C construction) Medical 13% • Blood analysis test coating for medical diagnosis • Nuclear diagnostics equipment Defense 10% • Night vision system optics • Structural and electronic components for satellites Automotive Electronics 9% • Increasing global car production • Electronic systems and engine control Telecom Infrastructure 6% • Undersea repeater housings • Shielding, modular jacks, PCB and processor sockets for local area networks Energy 6% • Deep sea drilling and completion • Directional drilling • Solar, batteries and smart grid devices Total 85% A-2

Strong Cash Flow and Balance Sheet Cash Flow Balance Sheet 2015 2015 operating cash flow Average operating cash flow last 5 years $90M >$60M Total Capitalization Debt 3% A-3

Materion Value-added Sales by Market Q1 2016 - $143.9M OP% of Value-added Sales 5% Automotive Electronics 9% Defense 10% Energy 6% Medical 13% Other 15% Telecom Infrastructure 6% Industrial Components 15% Consumer Electronics 26% A-4

Value-added Sales by Segment A-5 Q1 2016 - $143.9M OP% of Value-added Sales 5% Other 17% Advanced Materials 29% Performance Alloys and Composites 54%

Value-added Sales: Performance Alloys and Composites A-6 Telecom Infrastructure 8% Automotive Electronics 15% Defense 13% Other 16% Medical 2% Consumer Electronics 19% Industrial Components 20% Energy 7% Q1 2016 - $78.2M OP% of Value-added Sales 2%

Value-added Sales: Advanced Materials A-7 Telecom Infrastructure 6% Defense 3% Other 18% Industrial Components 12% Consumer Electronics 46% Q1 2016 - $42.1M OP% of Value-added Sales 12% Energy 8% Medical 7%
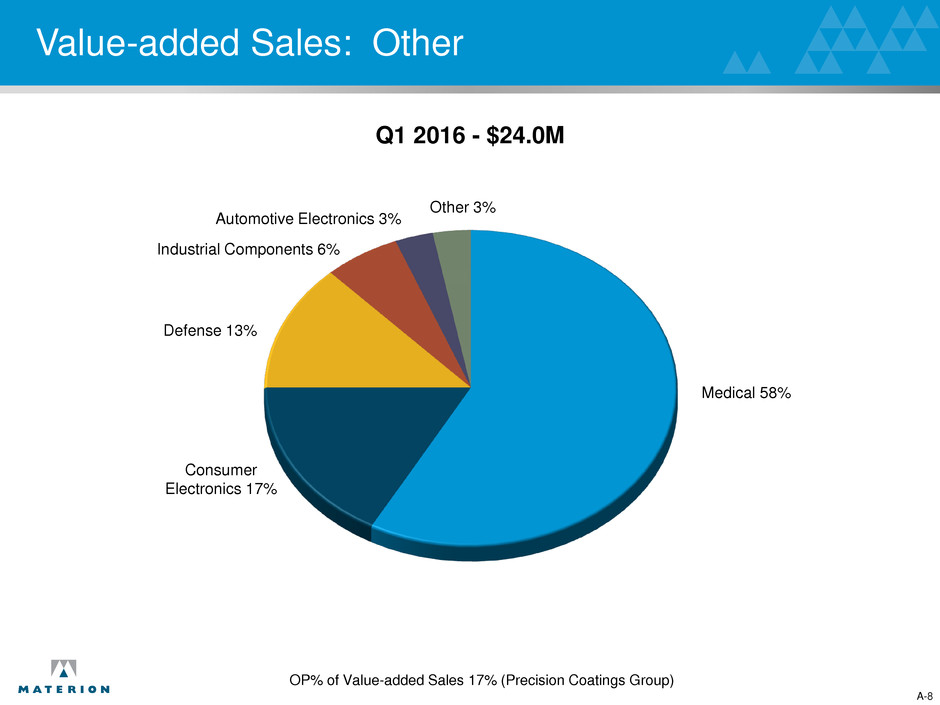
Value-added Sales: Other A-8 Other 3% Medical 58% Defense 13% Industrial Components 6% Q1 2016 - $24.0M OP% of Value-added Sales 17% (Precision Coatings Group) Automotive Electronics 3% Consumer Electronics 17%

Core Technologies A-9 1 High purity precious metal refining and life cycle management for electronics and industrial applications 2 Powder metallurgy, high pressure consolidation to processing of finished products 3 Metal surface enhancement by cladding, electroplating and surface treatments 4 Wide spectrum, precision optical filter coating and fabrication 5 Continuous roll-to-roll thin film large area coating 6 Inorganic chemical synthesis, refining, processing and recycling 7 Amorphous metals / bulk metallic glass materials 8 Full spectrum metal processing, from ore through smelting, hot and cold processing to finished shapes 9 Cleaning, precious metal recycling and refurbishing of semiconductor fab equipment shield kits 10 Vapor deposition sputtering target technology, from metals refining to target manufacture and recycling

New Product and Technology Development A-10 • ToughMet® alloy “strip” for high volume bearing applications • BrushForm 158 “strip” for cell phone camera suspension applications • ToughMet® for oil production couplings • ToughMet® alloy “bulk” with enhanced impact toughness • ToughMet® “alloy “sheet” for vehicle gearboxes • “Next generation” alloy for oil & gas • Nearer net shape fabrication (hot isostatic pressing) • Investment casting • Amorphous metals / bulk metallic glass • SupremEX™ aluminum metal matrix composites • Improved foils for x-ray windows • Durox® alumina ceramics • Dovetail connector for hybrid car systems • eStainless for cellphone and tablet applications • Smart grid meters Performance Alloys and Composites

New Product and Technology Development • Expanded shield kit cleaning services – including new technology to improve precious metal returns • Materials for high brightness LEDs • Specialty inorganic compounds for thin film solar panels (solar, security) • High purity metals and chemicals for semiconductor, compound semiconductor and display applications • Next generation technology in memory and thin film head materials A-11 Materials and Services Advanced Materials • RF packages for the latest infrastructure technology (3G and 4G) Packaging

New Product and Technology Development • Thin film vapor deposited electrodes for medical diagnostics • Precision optical thin film coatings (specialty filters) • Large area format serving astronomy, space, science • Multi-hyper – spectral array filters • Precision reel-to-reel medical thin film coating, patterning and conversion of thin flexible substrates A-12 Coatings Other

I/O Connector Contacts Battery Contacts Internal Antenna Contacts Grounding Clips and Audio Jacks Micro Mezzanine Connectors for LCD Screen Internal Electronics and LED • Thin film materials – power amplifiers, LED, SAW and BAW devices, filters, and ICs • Hermetic solutions for SAW • Refining / recycling • Precision parts cleaning Other Smart Phone Applications: • Circuit board and IC inspection • RoHS compliance assurance • Cellular infrastructure with high power RF packaging Internal Electronics • Precursor materials for GaAs wafer production Applications: Smartphones Voice Coil Motor (auto focus lens stabilizer) A-13

Application: Aircraft A-14
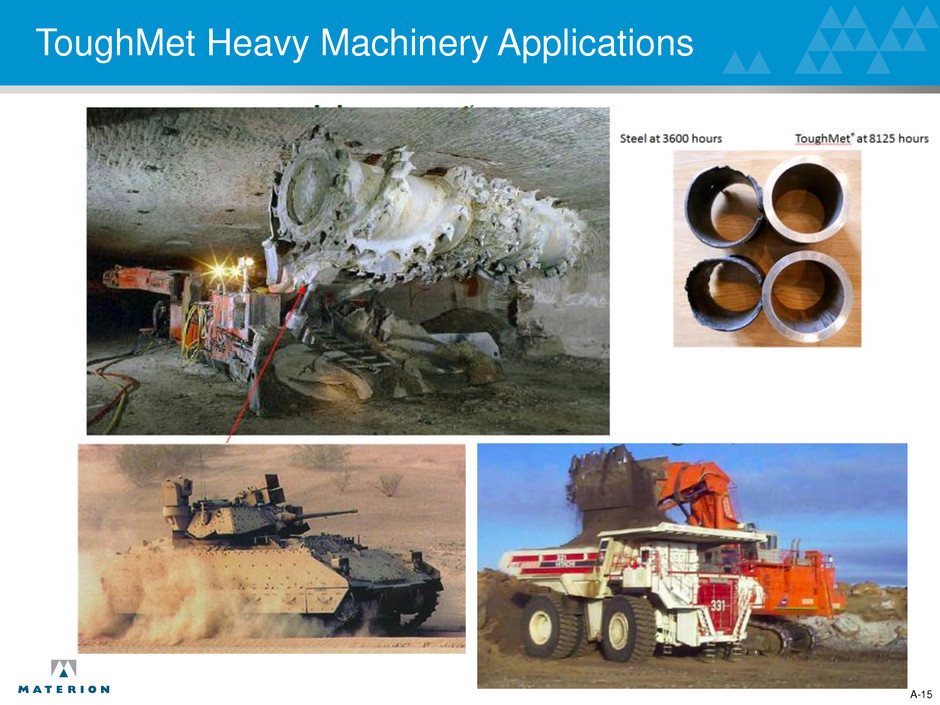
ToughMet Heavy Machinery Applications A-15
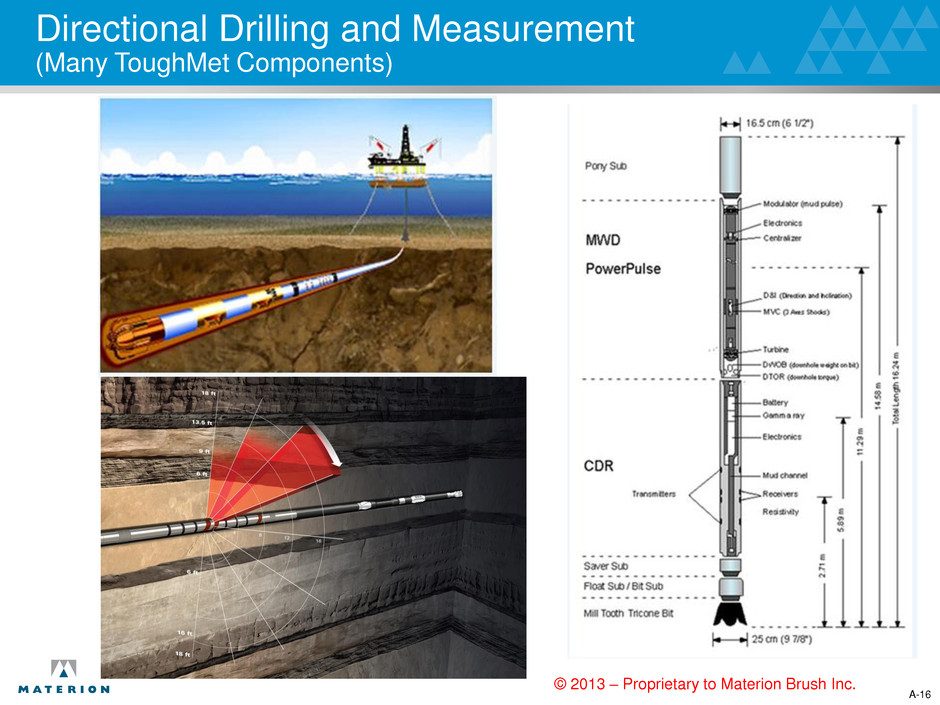
Directional Drilling and Measurement (Many ToughMet Components) A-16 © 2013 – Proprietary to Materion Brush Inc.
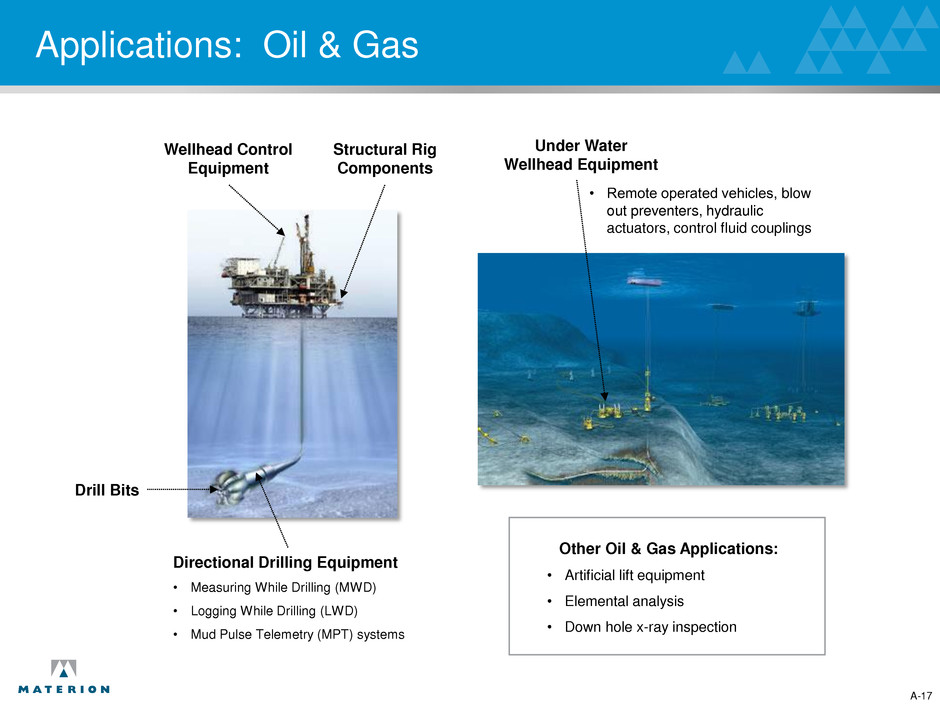
Under Water Wellhead Equipment Directional Drilling Equipment • Measuring While Drilling (MWD) • Logging While Drilling (LWD) • Mud Pulse Telemetry (MPT) systems Drill Bits Structural Rig Components Wellhead Control Equipment Other Oil & Gas Applications: • Artificial lift equipment • Elemental analysis • Down hole x-ray inspection • Remote operated vehicles, blow out preventers, hydraulic actuators, control fluid couplings Applications: Oil & Gas A-17

Cardiac Rhythm Management • Electronic interconnects / components • Niobium / titanium electron beam weld Insulin Pump • EMI shielding and grounding • Electrical terminals in connectors Seizure Control • Thin film deposition implantable electrode – Parkinson's disease (R&D) External glucose analysis • Subcutaneous sensors for glucose measurement Subcutaneous Glucose Analysis • Thin film coatings – electrode monitoring device Radiation Therapy – Neutron Reflectors X-Ray Mammography Other Medical Applications: • DNA sequencing optics • CT scan • Diagnostic x-rays • Advanced drug delivery components • Diagnostic electronic components • Anesthesia monitoring components • Operating instruments • Medical radioisotopes (production reactors) • RF connectors for MRI equipment, communication devices • RF connectors for portable diagnostic / therapeutic equipment Applications: Medical Battery Contacts for Hearing Aids A-18

Lithium Ion Battery Interconnects Battery Management Resistors Electronic Power Steering Modules ABS Leadframes Engine Efficiency Oxygen Sensors Mirror & Windshield Electronic Connections Air Bag Sensors Lamp Socket Connectors Auto Dimming Mirror Connectors Hybrid Vehicle Motor & Module Connectors Window and Door Switches Fuel Pump and Fuel Level Sensors Battery Terminals Engine Ignition and Control Modules Battery & Relay Control Modules Turn Signal and Emergency Flasher Relays On Board Telematics Applications: Automotive Electronics Night Vision Optics Speed Control Optics Camera Optics Navigation System Contacts Start-Stop System A-19

Applications: Defense • Infrared Sensors for fighter jet and UAV optical targeting • Electronic packaging for defense avionics, radar and electronic countermeasure systems • Structural and electronic components for satellites • X-ray windows in security imaging systems • Laser protection optical coatings • Night vision system optics A-20

Applications: Telecommunications Infrastructure Base Stations • Coaxial connectors • High power amplifiers Local Area Networks • Shielding • Modular jacks • PCB sockets • Processor sockets Other Telecommunications Infrastructure Applications • Undersea repeater housings A-21

Technology: Amorphous Silicon (a-Si, tandem and multi-junction) Thin Film (PVD) Materials Silicon based photovoltaic cells • Front and back contact layers • TCO Transparent conductive oxide layers Technology: Cadmium Telluride (CdTe) Thin Film (PVD) Materials • Cadmium based solar cell architecture. N and P type cadmium semiconductor materials • TCO transparent conductive oxide layers • Front and back-contact layers Technology: Concentrator Photovoltaic (CPV) Thin Film (PVD) Materials • Solar technology based on concentrating solar rays into a semiconductor device via large lens • Anti-reflection coating materials • Precious metal contact materials Micro Electronic Packaging Products • Bonding ribbon – Au & Ag • Lead-free solders • Metalized ceramic substrates Technology: Flexible Solar Cells / Building Integrated Photovoltaic Thin Film Services • Solar cells built in flexible substrates to accommodate applications such as roofing tiles or defense Technology: Crystalline Silicon (Si) Interconnect Materials • Front and backplane systems for high efficiency designs Applications: Solar Energy A-22 Technology: Copper Indium Gallium Selenide (CIGS) Thin Film (PVD) Materials as well as Powders for Printing CIGS applications • Copper indium gallium selenide thin film and screen printing applications for flexible and rigid solar cells 25 Alloy Strip • Panel interconnects

Reconciliation of Non-GAAP Measure - Profitability A-23 Dec. 31, 2015 Dec. 31, 2014 Dec. 31, 2015 Dec. 31, 2014 Net sales 214.1$ 288.4$ 1,025.3$ 1,126.9$ Gross margin 43.1 55.9 190.8$ 205.9 Operating profit 8.1 14.4 45.3$ 57.6 Net income 6.8 12.3 32.2$ 42.1 EPS - Diluted 0.33$ 0.60$ 1.58$ 2.02$ Cost of goods sold 0.1$ —$ 0.8$ 0.2$ Selling, general and administrative — — 1.2 0.8 Other-net — — — (2.6) — — — — — — 1.7 3.9 Other-net 0.7$ —$ (3.2)$ (10.8)$ 0.8$ —$ 0.5$ (8.5)$ 0.5$ —$ 0.3$ (5.6)$ —$ (1.8)$ 0.2$ (1.8)$ Value-added (VA) sales 143.4$ 167.0$ 617.2$ 637.1$ Gross margin 43.2 55.9 191.6 206.1 Gross margin % of VA 30.1 % 33.5 % 31.0 % 32.4 % Operating profit 8.9 14.4 45.8 49.1 Operating profit % of VA 6.2 % 8.6 % 7.4 % 7.7 % Net income 7.3 10.5 32.7 34.7 EPS - Diluted 0.36$ 0.51$ 1.60$ 1.67$ (In millions except per share amounts) Fourth Quarter Ended Twelve Months Ended Special items - net of tax Tax Special Item Non-GAAP Measures - Adjusted Profitability GAAP as Reported Reorganization costs (benefits) Recovery from insurance and other litigation, net of expenses Cost of sales Selling, general and administrative Total special items

Glossary of Terms 1. Debt-to-capitalization = debt/(net debt+Shareholders’ equity) 2. EV / Adjusted EBITDA = Enterprise Value/EBITDA=(Market Cap+Debt)/EBITDA 3. Total Capitalization = Net debt+Shareholders’ equity 4. Working Capital % of net sales = (A/R+Inv-A/P)/Total Sales A-24

