Attached files
| file | filename |
|---|---|
| 8-K - ANNALY CAPITAL MANAGEMENT, INC. 8-K - ANNALY CAPITAL MANAGEMENT INC | a51334877.htm |
| EX-99.1 - EXHIBIT 99.1 - ANNALY CAPITAL MANAGEMENT INC | a51334877ex99_1.htm |
Exhibit 99.2

May 4, 2016 First Quarter 2016 Supplemental Information
* * This presentation, other written or oral communications and our public documents to which we refer contain or incorporate by reference certain forward-looking statements which are based on various assumptions (some of which are beyond our control) and may be identified by reference to a future period or periods or by the use of forward-looking terminology, such as "may," "will," "believe," "expect," "anticipate," "continue," or similar terms or variations on those terms or the negative of those terms. Actual results could differ materially from those set forth in forward-looking statements due to a variety of factors, including, but not limited to, changes in interest rates; changes in the yield curve; changes in prepayment rates; the availability of mortgage-backed securities and other securities for purchase; the availability of financing and, if available, the terms of any financings; changes in the market value of our assets; changes in business conditions and the general economy; our ability to grow our commercial business; our ability to grow our residential mortgage credit business; credit risks related to our investments in credit risk transfer securities, residential mortgage-backed securities and related residential mortgage credit assets, commercial real estate assets and corporate debt; our ability to consummate any contemplated investment opportunities; changes in government regulations affecting our business; our ability to maintain our qualification as a REIT for federal income tax purposes; our ability to maintain our exemption from registration under the Investment Company Act of 1940, as amended; and our ability to consummate the proposed Hatteras Acquisition on a timely basis or at all, and potential business disruption following the Hatteras Acquisition. For a discussion of the risks and uncertainties which could cause actual results to differ from those contained in the forward-looking statements, see "Risk Factors" in our most recent Annual Report on Form 10-K and any subsequent Quarterly Reports on Form 10-Q. We do not undertake, and specifically disclaim any obligation, to publicly release the result of any revisions which may be made to any forward-looking statements to reflect the occurrence of anticipated or unanticipated events or circumstances after the date of such statements, except as required by law.Non-GAAP Financial MeasuresThis presentation includes certain non-GAAP financial measures. Please see the section entitled “Non-GAAP Reconciliations” in the attached Appendix for a reconciliation to the most directly comparable GAAP financial measures. Safe Harbor Notice
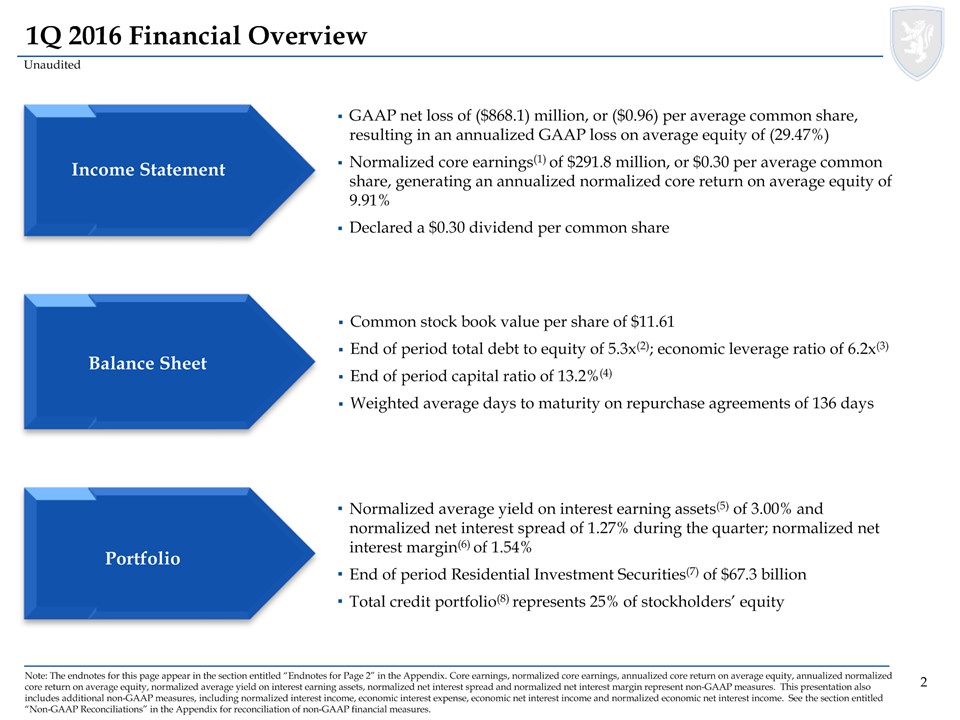
* * Note: The endnotes for this page appear in the section entitled “Endnotes for Page 2” in the Appendix. Core earnings, normalized core earnings, annualized core return on average equity, annualized normalized core return on average equity, normalized average yield on interest earning assets, normalized net interest spread and normalized net interest margin represent non-GAAP measures. This presentation also includes additional non-GAAP measures, including normalized interest income, economic interest expense, economic net interest income and normalized economic net interest income. See the section entitled “Non-GAAP Reconciliations” in the Appendix for reconciliation of non-GAAP financial measures. 1Q 2016 Financial Overview GAAP net loss of ($868.1) million, or ($0.96) per average common share, resulting in an annualized GAAP loss on average equity of (29.47%)Normalized core earnings(1) of $291.8 million, or $0.30 per average common share, generating an annualized normalized core return on average equity of 9.91%Declared a $0.30 dividend per common share Common stock book value per share of $11.61End of period total debt to equity of 5.3x(2); economic leverage ratio of 6.2x(3)End of period capital ratio of 13.2%(4) Weighted average days to maturity on repurchase agreements of 136 days Normalized average yield on interest earning assets(5) of 3.00% and normalized net interest spread of 1.27% during the quarter; normalized net interest margin(6) of 1.54%End of period Residential Investment Securities(7) of $67.3 billionTotal credit portfolio(8) represents 25% of stockholders’ equity Income Statement Balance Sheet Portfolio Unaudited
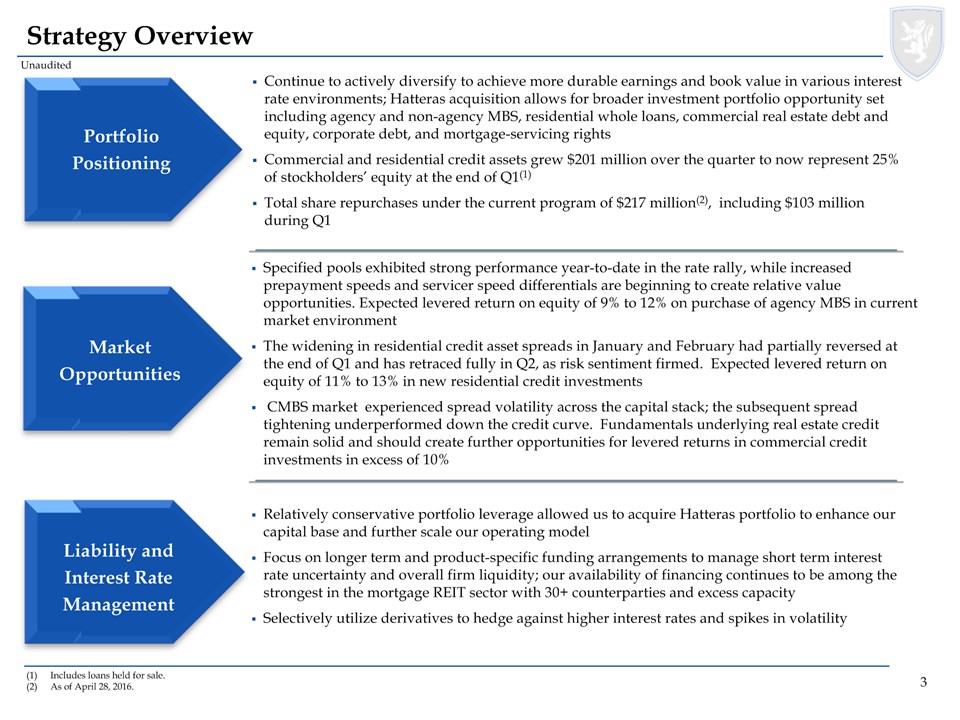
* * Includes loans held for sale.As of April 28, 2016. Strategy Overview PortfolioPositioning MarketOpportunities Liability andInterest RateManagement Unaudited Continue to actively diversify to achieve more durable earnings and book value in various interest rate environments; Hatteras acquisition allows for broader investment portfolio opportunity set including agency and non-agency MBS, residential whole loans, commercial real estate debt and equity, corporate debt, and mortgage-servicing rightsCommercial and residential credit assets grew $201 million over the quarter to now represent 25% of stockholders’ equity at the end of Q1(1)Total share repurchases under the current program of $217 million(2), including $103 million during Q1 Specified pools exhibited strong performance year-to-date in the rate rally, while increased prepayment speeds and servicer speed differentials are beginning to create relative value opportunities. Expected levered return on equity of 9% to 12% on purchase of agency MBS in current market environmentThe widening in residential credit asset spreads in January and February had partially reversed at the end of Q1 and has retraced fully in Q2, as risk sentiment firmed. Expected levered return on equity of 11% to 13% in new residential credit investments CMBS market experienced spread volatility across the capital stack; the subsequent spread tightening underperformed down the credit curve. Fundamentals underlying real estate credit remain solid and should create further opportunities for levered returns in commercial credit investments in excess of 10% Relatively conservative portfolio leverage allowed us to acquire Hatteras portfolio to enhance our capital base and further scale our operating modelFocus on longer term and product-specific funding arrangements to manage short term interest rate uncertainty and overall firm liquidity; our availability of financing continues to be among the strongest in the mortgage REIT sector with 30+ counterparties and excess capacitySelectively utilize derivatives to hedge against higher interest rates and spikes in volatility
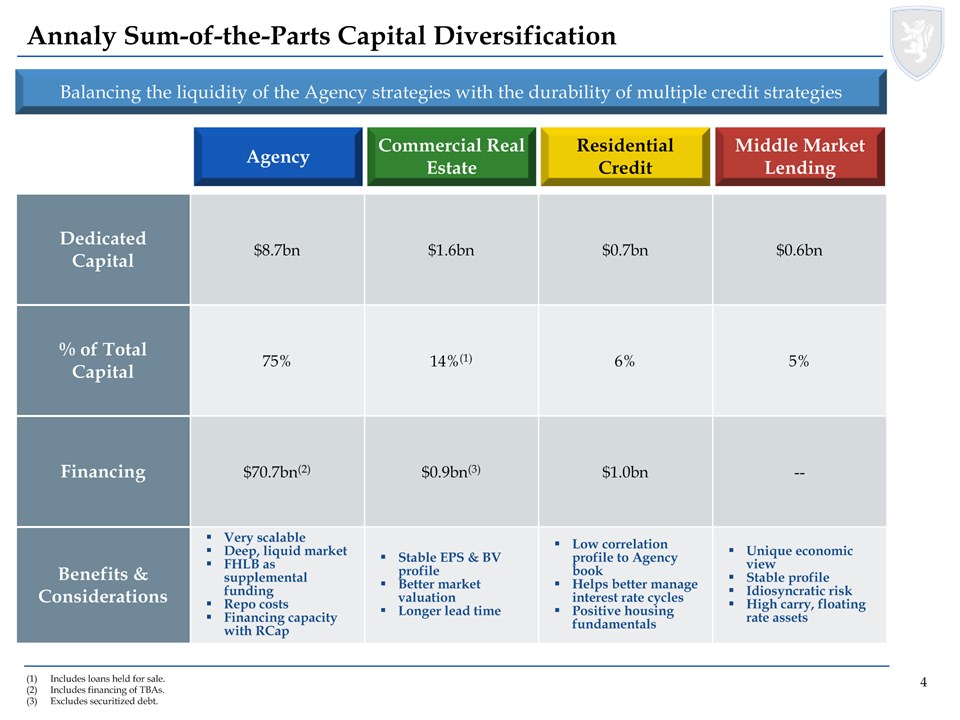
* * Balancing the liquidity of the Agency strategies with the durability of multiple credit strategies Annaly Sum-of-the-Parts Capital Diversification Agency Residential Credit Commercial Real Estate Middle Market Lending Dedicated Capital $8.7bn $1.6bn $0.7bn $0.6bn % of Total Capital 75% 14%(1) 6% 5% Financing $70.7bn(2) $0.9bn(3) $1.0bn -- Benefits &Considerations Very scalableDeep, liquid marketFHLB as supplemental fundingRepo costsFinancing capacity with RCap Stable EPS & BV profileBetter market valuationLonger lead time Low correlation profile to Agency bookHelps better manage interest rate cyclesPositive housing fundamentals Unique economic viewStable profileIdiosyncratic riskHigh carry, floating rate assets Includes loans held for sale.Includes financing of TBAs.Excludes securitized debt.

* * Source: Bloomberg Agency MBS: Interest Rate Market Performance Yield curve flattened in volatile first quarter, with 2-year and 10-year swap rates declining 34 and 55 bps, respectivelyRate rally reflective of change in monetary policy expectations, as three major developed market central banks signaled more accommodative monetary policy for longerCentral bank accommodation continues to buoy asset prices in low economic growth environmentAsset price correlations with oil remain highMarket continues to price less than the two interest rate hikes currently forecasted by the Federal ReservePotential Fed hike in 1H 2016 could be impacted by weaker economic data and upcoming geopolitical risk events such as the potential UK EU exit Swap Rates Fell Sharply During the Quarter, Led by the Intermediate Sector Market Correlations with the Oil Price Have Been Historically High

6 Source: JP Morgan, Credit Suisse, Annaly calculations (1) MBS relative performance vs. swaps reflects cumulative price performance of an MBS position hedged with a combination of 2-yr, 5-yr and 10-yr interest rate swaps to a one year duration gap on December 31, 2015. Calculations are based on Credit Suisse’s model MBS partial duration profile. Cumulative performance does not include net coupon earnings and assumes no rebalancing of swap hedges. (2) JP Morgan data as of March 31, 2016. Agency MBS: Market Backdrop MBS spreads and performance slightly weaker in challenging Q1 amid significantly lower rates Collateral with stable cash flow profiles, such as specified pools and 15-year securities, outperformed Speeds saw a meaningful increase amid higher refinancing/purchase activity, with further increases expected in months to come More dovish central banks suggest even longer official sector support, which will be helpful to dollar roll valuations as Fed takes out large portion of cheapest-to-deliver TBA MBS with worst prepayment characteristics Agency MBS currently show mixed technical and fundamental factors Agency MBS continue to offer attractive yields in global low yield landscape; foreign demand has improved in recent months High prepayment speeds, increased issuance, and declining carry have weighed on the sector Relative sector liquidity remains strong despite lower trading volumes and greater dealer concentration -0.8 -0.6 -0.4 -0.2 0.0 0.2 0.4 0.6 1.5 1.6 1.7 1.8 1.9 2.0 2.1 2.2 12/31/15 1/31/16 2/29/16 3/31/16 Percent Percent 10yr Swap Yield (lhs) FNCI 3.0 FNCL 3.5 FNCL 4.0 MBS Hedged Performance Flat in Q1 2016(1) US 2y US 5y US 10y Germany 2y Germany 5y Germany 10y UK 2y UK 5y UK 10y Japan 2y Japan 5y Japan 10y FNCL 3.0 FNCL 3.5 FNCL 4.0 FNCI 3.0 FNCL 4.0 LLB FNCL 3.5 MLB -1.0 -0.5 0.0 0.5 1.0 1.5 2.0 2.5 3.0 0 2 4 6 8 10 12 Yield (%) Asset Duration Agency MBS Remain Attractive Relative to Low Sovereign Yields(2)

* * Pass Through Coupon Type Agency MBS: Portfolio Data as of March 31, 2016. Note: Percentages based on fair market value. 15yr and 20yr Fixed %’s are inclusive of TBA contracts.“High Quality” protection is defined as pools backed by original loan balances of up to $150K, higher LTV pools (CR/CQ), geographic concentrations (NY/PR). “Other Specified Pools” includes $175K loan balance, high LTV pools, FICO < 700. The market value of Agency portfolio stood at approximately $80bn at end of Q1, inclusive of the TBA positionApproximately 85% of the portfolio is positioned in high quality securities with prepayment protectionMBS spread widening has led to more attractive valuations, however, elevated volatility persists in the marketStrategy has focused on continued rotation into bonds with durable and stable cash flows Asset Type(1) Call Protection(2) Total Equity: $8.7bn
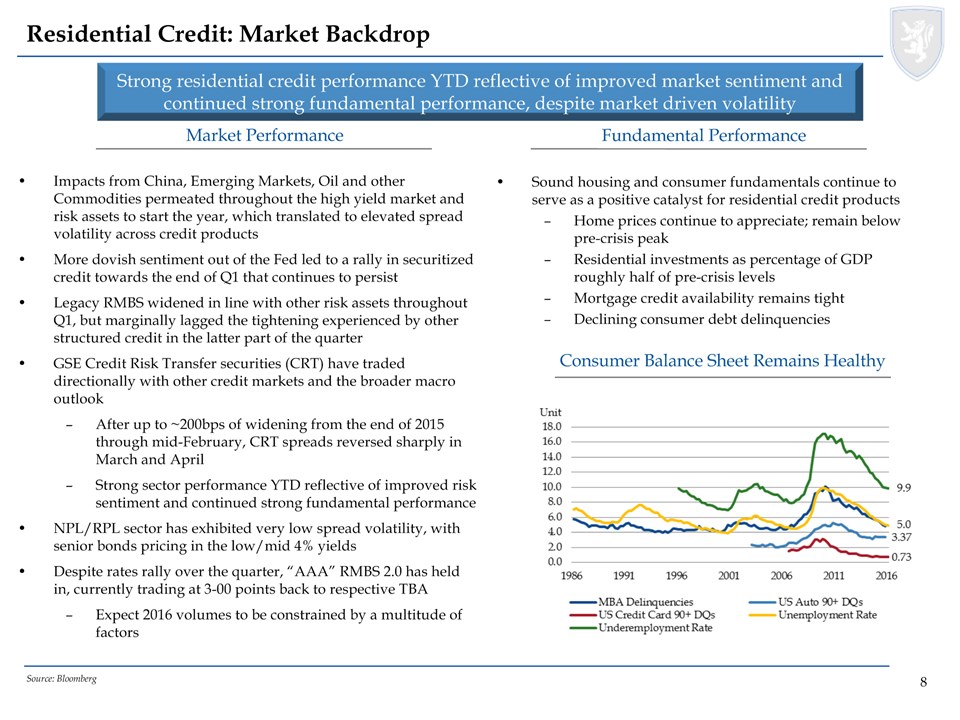
* * Market Performance Residential Credit: Market Backdrop Strong residential credit performance YTD reflective of improved market sentiment and continued strong fundamental performance, despite market driven volatility Source: Bloomberg Fundamental Performance Impacts from China, Emerging Markets, Oil and other Commodities permeated throughout the high yield market and risk assets to start the year, which translated to elevated spread volatility across credit productsMore dovish sentiment out of the Fed led to a rally in securitized credit towards the end of Q1 that continues to persistLegacy RMBS widened in line with other risk assets throughout Q1, but marginally lagged the tightening experienced by other structured credit in the latter part of the quarterGSE Credit Risk Transfer securities (CRT) have traded directionally with other credit markets and the broader macro outlookAfter up to ~200bps of widening from the end of 2015 through mid-February, CRT spreads reversed sharply in March and AprilStrong sector performance YTD reflective of improved risk sentiment and continued strong fundamental performanceNPL/RPL sector has exhibited very low spread volatility, with senior bonds pricing in the low/mid 4% yieldsDespite rates rally over the quarter, “AAA” RMBS 2.0 has held in, currently trading at 3-00 points back to respective TBAExpect 2016 volumes to be constrained by a multitude of factors Sound housing and consumer fundamentals continue to serve as a positive catalyst for residential credit productsHome prices continue to appreciate; remain below pre-crisis peakResidential investments as percentage of GDP roughly half of pre-crisis levelsMortgage credit availability remains tightDeclining consumer debt delinquencies Consumer Balance Sheet Remains Healthy

* * Residential Credit: Portfolio Data as of March 31, 2016.Note: Percentages based on fair market value. Through YTD 2016, the portfolio grew to approximately $1.7 billion, comprised of the following sectors:Credit Risk Transfer (CRT): floating rate assets originated by the GSEs in a high quality underwriting environmentJumbo “AAA” Securities: cheap supplement to the Agency portfolio; advantageous FHLB financingNPL/RPL Securities: conservatively structured, short duration assets with extension protectionLegacy: high carrying assets; sector has negative net issuance and positive fundamentals Sector Type Coupon Type Effective Duration Total Dedicated Equity: $0.7bn

* * Annaly Commercial Real Estate Group Portfolio Data as of March 31, 2016.Note: Percentages based on economic interestOther includes 38 states, none of which represent more than 5% of total portfolio value. Providing capital for acquisitions and refinancings at higher leverage points in the capital structure on real estate with growth potentialFocus on top tier sponsors, operating in attractive markets with rational business plans, and loan structures that mitigate riskMaximize returns through conservative financing strategies utilizing syndication relationships, credit facilities and the securitization market $1.9 billion Asset Type Sector Type Geographic Concentration(1) Total Equity: $1.6bn

* * Middle Market Lending: Portfolio Lien Position Industry (1) Sponsor Concentration Flexible capital provider to established control equity partnersWell-tenured relationships with private equity community fosters recurring deal flowCredit-first approach requiring first-level due diligence in targeted industries enables optimized relative risk / return decisionsActive credit monitoring and portfolio management Total Equity: $0.6bn Data as of March 31, 2016.Note: Percentages based on principal outstanding.(1) Based on Moody’s industry categories.

* * Last Five Quarters Financial Performance Unaudited

* * Unaudited, numbers in thousands except per share amounts Summary Balance Sheet and Applicable Information Includes loans held for sale, commercial real estate debt and preferred equity and investments in commercial real estate.Commercial investment portfolio consists of commercial real estate investments and corporate debt.Consists of common stock, additional paid-in capital, accumulated other comprehensive income (loss) and accumulated deficit. For the quarters ended For the quarters ended For the quarters ended March 31, December 31, March 31, 2016 2015 2015 Residential Investment Securities $67,255,533 $67,233,494 $70,491,746 Commercial real estate investments(1) 6,385,579 5,075,191 3,221,518 Corporate debt 639,481 488,508 227,830 Total Residential Investment Securities and commercial investment portfolio(2) $74,280,593 $72,797,193 $73,941,094 Total assets $77,443,965 $75,190,893 $78,675,677 Average TBA position $15,110,947 $14,366,749 $8,319,920 Repurchase agreements $54,448,141 $56,230,860 $60,477,378 Other secured financing 3,588,326 1,845,048 90,000 Convertible Senior Notes - - 749,512 Securitized debt of consolidated VIEs 3,802,682 2,540,711 1,491,829 Participation sold 13,182 13,286 13,589 Mortgages payable 334,765 334,707 146,470 Total debt $62,187,096 $60,964,612 $62,968,778 Total liabilities $65,785,958 $63,284,971 $65,551,087 Cumulative redeemable preferred stock $913,059 $913,059 $913,059 Common equity(3) 10,735,393 10,982,915 12,206,446 Total stockholders' equity $11,648,452 $11,895,974 $13,119,505 Non-controlling interest 9,555 9,948 5,085 Total equity $11,658,007 $11,905,922 $13,124,590 Total debt to total equity 5.3x 5.1x 4.8x Economic leverage ratio 6.2x 6.0x 5.7x Capital ratio 13.2% 13.7% 14.3% Common stock book value per share $11.61 $11.73 $12.88 Total common shares outstanding 924,853 935,930 947,698

* * Unaudited, dollars in thousands except per share amounts Summary of Select GAAP and Non-GAAP Information Includes interest expense on interest rate swaps used to hedge cost of funds. Excludes interest expense on interest rate swaps used to hedge TBA dollar roll. For the quarters ended For the quarters ended For the quarters ended March 31, December 31, March 31, 2016 2015 2015 Total interest income $388,143 $576,580 $519,114 Total economic interest expense(1) 270,571 254,074 286,752 Economic net interest income(1) $117,572 $322,506 $232,362 GAAP net income (loss) ($868,080) $669,666 ($476,499) GAAP net income (loss) available (related) to common shareholders (885,910) 652,047 (494,401) GAAP earnings per common share ($0.96) $0.69 ($0.52) Normalized core earnings (loss) $291,757 $311,133 $341,965 Normalized core earnings (loss) available (related) to common shareholders 273,765 293,141 323,973 Normalized core earnings per common share $0.30 $0.31 $0.34 Dividends declared per common share $0.30 $0.30 $0.30 Annualized GAAP return on average equity (29.47%) 22.15% (14.41%) Annualized normalized core return on average equity 9.91% 10.30% 10.34% Annualized normalized core return on average equity per unit of economic leverage 1.60% 1.72% 1.82% Net interest margin 0.79% 1.80% 1.29% Normalized net interest margin 1.54% 1.71% 1.68% Average yield on interest earning assets 2.09% 3.15% 2.54% Normalized yield on interest earning assets 3.00% 3.05% 2.96% Average cost of interest bearing liabilities 1.73% 1.68% 1.64% Net interest spread 0.36% 1.47% 0.90% Normalized net interest spread 1.27% 1.37% 1.32% Weighted average experienced CPR, for the period 8.8% 9.7% 9.0% Weighted average projected long-term CPR, as of period end 11.8% 8.8% 9.2% Book value per common share rollforward: Book value per common share, beginning of period $11.73 $11.99 $13.10 Net income (loss) attributable to common stockholders ($0.96) $0.69 ($0.52) Other comprehensive income (loss) attributable to common stockholders $1.11 ($0.68) $0.60 Buyback of common stock $0.03 $0.03 $0.00 Common dividends declared ($0.30) ($0.30) ($0.30) Book value per common share, end of period $11.61 $11.73 $12.88

* * Unaudited, dollars in thousands Components of Economic Net Interest Income Included within realized losses on interest rate swaps. Excludes interest expense on interest rate swaps used to hedge TBA dollar roll. For the quarters ended For the quarters ended For the quarters ended March 31, December 31, March 31, 2016 2015 2015 Interest income: Interest income: Residential Investment Securities $315,717 $515,195 $478,239 Commercial investment portfolio 70,187 60,835 40,336 Reverse repurchase agreements 2,239 550 539 Total interest income $388,143 $576,580 $519,114 Economic interest expense: Economic interest expense: Repurchase agreements $132,891 $112,529 $102,748 Interest expense on swaps used to hedge cost of funds(1) 123,124 135,267 157,332 Convertible Senior Notes - - 23,627 Securitized debt of consolidated VIEs 9,033 5,597 2,882 Participation sold 158 160 159 Other 5,365 521 4 Total economic interest expense $270,571 $254,074 $286,752 Economic net interest income Economic net interest income $117,572 $322,506 $232,362 Premium amortization adjustment 168,408 (18,072) 87,883 Normalized economic net interest income Normalized economic net interest income $285,980 $304,434 $320,245

* * Unaudited Change in Normalized Net Interest Margin Note: Graph shows relative changes in contribution from 4Q15 to 1Q16. For example, coupon on average interest earning assets decreased normalized net interest margin by 0.04% more in 1Q16 versus 4Q15.Represents economic interest expense and interest expense on swaps used to hedge dollar roll transactions.

* * Unaudited Change in Normalized Net Interest Spread Note: Graph shows relative changes in contribution from 4Q15 to 1Q16. For example, coupon on average interest-earning assets decreased normalized net interest spread by 0.02% more in 1Q16 versus 4Q15.Includes interest expense on interest rate swaps used to hedge cost of funds.

* * Unaudited, dollars in thousands Reconciliation to Core Earnings and Normalized Core Earnings (1) Represents a component of Net gains (losses) on trading assets.

* * Unaudited Change in Annualized GAAP Return on Average Equity Note: Graph shows relative changes in contribution from 4Q15 to 1Q16. For example, coupon income increased annualized ROE by 0.87% more in 1Q16 versus 4Q15.Other includes other income (loss), general and administrative expenses, and income taxes.Represents economic interest expense and interest expense on swaps used to hedge dollar roll transactions.

* * Unaudited Change in Annualized Normalized Core Return on Average Equity Note: Graph shows relative changes in contribution from 4Q15 to 1Q16. For example, coupon income increased annualized core ROE by 0.88% more in 1Q16 versus 4Q15.(1) Other includes investment advisory income, dividend income from affiliates, other income (loss) excluding non-recurring gains or losses, general and administrative expenses, and income taxes.

* * Unaudited, dollars in thousands Residential Investment Securities Portfolio Net Premium and Discount Balance and Constant Prepayment Rate

* * Unaudited Interest Rate and Liability Management Excludes forward starting swaps; there were no forward starting swaps as of March 31, 2016.Note: Net rates do not take into consideration other secured financing, Convertible Senior Notes, securitized debt of consolidated VIEs , participation sold or mortgages payable. (1)

* * Hedging and Liabilities as of March 31, 2016 Unaudited, dollars in thousands There were no forward starting pay fixed swaps as of March 31, 2016Weighted average years to maturity for futures positions are based off of the Treasury contracts cheapest to deliver.Approximately 17% of the total repurchase agreements and FHLB advances have a remaining maturity over one year. Determined based on estimated weighted-average lives of the underlying debt instruments. Principal Weighted Average Weighted Average Balance Rate Days to Maturity(4) Repurchase agreements $54,448,141 0.99% 136 Other secured financing 3,588,326 0.59% 1,735 Securitized debt of consolidated VIEs 3,821,252 0.85% 2,801 Participation sold 13,061 5.58% 396 Mortgages payable 338,346 4.16% 3,064 Total indebtedness $62,209,126

* * Unaudited, dollars in thousands Residential Investment Securities and TBA Derivative Overview as of March 31, 2016 Agency Fixed-Rate Securities (Pools) Agency Fixed-Rate Securities (Pools) Agency Fixed-Rate Securities (Pools) Agency Fixed-Rate Securities (Pools) Agency Fixed-Rate Securities (Pools) Agency Fixed-Rate Securities (Pools) Agency Fixed-Rate Securities (Pools) Agency Fixed-Rate Securities (Pools) Weighted Avg. Current Weighted Avg. Weighted Avg. Weighted Avg. Weighted Avg. Estimated Years to Maturity Face Value % Coupon Amortized Cost Fair Value 3-Month CPR Fair Value <=15 years $8,141,382 14.4% 3.14% 103.8% 105.1% 7.1% $8,557,230 20 years 6,233,697 11.1% 3.50% 104.5% 106.1% 8.6% 6,613,072 >=30 years 41,745,350 74.2% 3.87% 106.0% 106.8% 8.8% 44,601,754 Callables 158,803 0.3% 3.16% 99.6% 98.9% 0.0% 157,035 Total/Weighted Avg. $56,279,232 100.0% 3.73% 105.5% 106.5% 8.5% $59,929,091 TBA Purchase Contracts TBA Purchase Contracts TBA Purchase Contracts TBA Purchase Contracts TBA Purchase Contracts TBA Purchase Contracts TBA Purchase Contracts TBA Purchase Contracts Weighted Avg. Implied Cost Implied Market Type Notional Value % Coupon Basis Value 15-year $5,293,000 37.1% 2.81% $5,463,613 $5,492,572 30-year 8,980,000 62.9% 3.55% 9,384,179 9,431,952 Total/Weighted Avg. $14,273,000 100.0% 3.27% $14,847,792 $14,924,524 Agency Adjustable-Rate Securities Agency Adjustable-Rate Securities Agency Adjustable-Rate Securities Agency Adjustable-Rate Securities Agency Adjustable-Rate Securities Agency Adjustable-Rate Securities Agency Adjustable-Rate Securities Agency Adjustable-Rate Securities Weighted Avg. Current Weighted Avg. Weighted Avg. Weighted Avg. Weighted Avg. Estimated Months to Reset Face Value % Coupon Amortized Cost Fair Value 3-Month CPR Fair Value 0 - 24 months $1,166,108 38.0% 2.79% 100.6% 104.8% 15.1% $1,222,251 25 - 40 months 5,848 0.2% 5.01% 100.0% 105.5% 22.2% 6,170 41 - 60 months 142,774 4.7% 3.85% 102.8% 106.7% 19.8% 152,375 61 - 90 months 656,927 21.4% 2.89% 103.2% 103.9% 12.2% 682,327 >90 months 1,092,684 35.7% 3.04% 102.7% 103.7% 7.3% 1,132,750 Step-Ups - 0.0% 0.00% 0.0% 0.0% 0.0% - Total/Weighted Avg. $3,064,341 100.0% 2.95% 102.0% 104.3% 11.9% $3,195,873

* * Unaudited, dollars in thousands Residential Investment Securities and TBA Derivative Overview as of March 31, 2016 (cont’d) (1) Weighted by fair value. Agency Fixed-Rate and Floating-Rate Collateralized Mortgage-Backed Obligations Agency Fixed-Rate and Floating-Rate Collateralized Mortgage-Backed Obligations Agency Fixed-Rate and Floating-Rate Collateralized Mortgage-Backed Obligations Agency Fixed-Rate and Floating-Rate Collateralized Mortgage-Backed Obligations Agency Fixed-Rate and Floating-Rate Collateralized Mortgage-Backed Obligations Agency Fixed-Rate and Floating-Rate Collateralized Mortgage-Backed Obligations Agency Fixed-Rate and Floating-Rate Collateralized Mortgage-Backed Obligations Agency Fixed-Rate and Floating-Rate Collateralized Mortgage-Backed Obligations Current Weighted Avg. Weighted Avg. Weighted Avg. Weighted Avg. Estimated Type Face Value % Coupon Amortized Cost Fair Value 3-Month CPR Fair Value Fixed-Rate $912,427 98.9% 3.28% 102.7% 104.0% 12.0% $949,287 Floating-Rate 9,769 1.1% 2.91% 99.2% 102.5% 17.2% 10,010 Total/Weighted Avg. $922,196 100.0% 3.28% 102.7% 104.0% 12.1% $959,297 Agency Interest-Only Collateralized Mortgage-Backed Obligations Agency Interest-Only Collateralized Mortgage-Backed Obligations Agency Interest-Only Collateralized Mortgage-Backed Obligations Agency Interest-Only Collateralized Mortgage-Backed Obligations Agency Interest-Only Collateralized Mortgage-Backed Obligations Agency Interest-Only Collateralized Mortgage-Backed Obligations Agency Interest-Only Collateralized Mortgage-Backed Obligations Agency Interest-Only Collateralized Mortgage-Backed Obligations Current Notional Weighted Avg. Weighted Avg. Weighted Avg. Weighted Avg. Estimated Type Value % Coupon Amortized Cost Fair Value 3-Month CPR Fair Value Interest-Only $5,624,398 60.1% 3.31% 13.5% 11.6% 9.9% $654,216 Inverse Interest-Only 3,738,198 39.9% 5.71% 22.8% 23.0% 9.0% 858,382 Total/Weighted Avg. $9,362,596 100.0% 4.27% 17.2% 16.2% 9.5% $1,512,598 Residential Credit Portfolio Residential Credit Portfolio Residential Credit Portfolio Residential Credit Portfolio Residential Credit Portfolio Residential Credit Portfolio Residential Credit Portfolio Residential Credit Portfolio Current Face / Weighted Avg. Weighted Avg. Weighted Avg. Estimated Sector Notional Value % (1) Coupon Amortized Cost Fair Value Fair Value Credit Risk Transfer Securities $517,207 30.2% 4.41% 97.5% 96.9% $501,167 Legacy 484,784 26.0% 3.73% 89.4% 88.8% 430,426 NPL/RPL 428,656 25.7% 3.96% 99.6% 99.5% 426,339 Prime Jumbo (>=2010 Vintage) 280,060 17.1% 3.49% 99.9% 101.2% 283,560 Prime Jumbo (>=2010 Vintage) IO 1,114,234 1.0% 0.38% 1.6% 1.5% 17,182 Total/Weighted Avg $2,824,941 100.0% 2.55% 58.8% 58.7% $1,658,674

* * Residential Credit Investments Detail as of March 31, 2016 Unaudited, dollars in thousands By Sector Product By Sector Product By Sector Product By Sector Product By Sector Product By Sector Product Product Market Value Coupon Credit Enhancement 60+ Delinquencies 3M VPR Alt-A $167,967 4.16 6.84 11.10 4.70 Prime 106,142 4.63 1.48 3.87 3.57 Subprime 156,317 2.46 25.25 21.06 3.35 Prime Jumbo (>=2010 Vintage) 283,560 3.50 14.76 - 9.40 Prime Jumbo (>=2010 Vintage) Interest Only 17,182 0.42 - - 6.15 Re-Performing Loan Securitizations 42,565 3.63 51.25 14.39 3.83 Credit Risk Transfer 501,167 4.44 1.05 0.11 10.44 Non-Performing Loan Securitizations 383,774 4.00 51.55 65.32 0.31 Total $1,658,674 3.91 19.25 18.87 6.02 Market Value By Sector and Payment Structure Market Value By Sector and Payment Structure Market Value By Sector and Payment Structure Market Value By Sector and Payment Structure Market Value By Sector and Payment Structure Market Value By Sector and Payment Structure Product Senior Subordinate Total Alt-A $96,298 $71,669 $167,967 Prime 33,990 72,152 106,142 Subprime 123,232 33,085 156,317 Prime Jumbo (>=2010 Vintage) 277,105 6,455 283,560 Prime Jumbo (>=2010 Vintage) Interest Only 17,182 - 17,182 Re-Performing Loan Securitizations 42,565 - 42,565 Credit Risk Transfer - 501,167 501,167 Non-Performing Loan Securitizations 383,774 - 383,774 Total $974,146 $684,528 $1,658,674 Market Value By Sector and Bond Coupon Market Value By Sector and Bond Coupon Market Value By Sector and Bond Coupon Market Value By Sector and Bond Coupon Market Value By Sector and Bond Coupon Market Value By Sector and Bond Coupon Product ARM Fixed Floater Interest Only Total Alt-A $19,207 $94,820 $53,940 $0 $167,967 Prime 43,281 62,861 - - 106,142 Subprime - 41,041 115,276 - 156,317 Prime Jumbo (>=2010 Vintage) - 277,105 6,455 - 283,560 Prime Jumbo (>=2010 Vintage) Interest Only - - - 17,182 17,182 Re-Performing Loan Securitizations - 42,565 - - 42,565 Credit Risk Transfer - - 501,167 - 501,167 Non-Performing Loan Securitizations - 383,774 - - 383,774 Total $62,488 $902,166 $676,838 $17,182 $1,658,674

* * Unaudited Quarter-Over-Quarter Interest Rate and MBS Spread Sensitivity Scenarios include Residential Investment Securities and derivative instruments.NAV represents book value of common equity. Assumptions:The interest rate sensitivity and spread sensitivity are based on the portfolios as of March 31, 2016 and December 31, 2015The interest rate sensitivities reflect instantaneous parallel shifts in ratesThe spread sensitivity shifts MBS spreads instantaneously and reflects exposure to MBS basis riskAll tables assume no active management of the portfolio in response to rate or spread changes Interest Rate Sensitivity Interest Rate Sensitivity Interest Rate Sensitivity As of March 31, 2016 As of March 31, 2016 As of December 31, 2015 As of December 31, 2015 Interest Rate Change (bps) Estimated Percentage Change in Portfolio Value(1) Estimated Change as a % of NAV(1)(2) Estimated Percentage Change in Portfolio Value(1) Estimated Change as a % of NAV(1)(2) (75) - 0.2% 0.4% 2.7% (50) 0.1% 0.8% 0.5% 2.8% (25) 0.1% 0.7% 0.3% 1.9% 25 (0.2%) (1.4%) (0.4%) (2.7%) 50 (0.6%) (3.5%) (1.0%) (6.1%) 75 (1.1%) (6.5%) (1.7%) (10.2%) MBS Spread Sensitivity MBS Spread Sensitivity MBS Spread Sensitivity As of March 31, 2016 As of March 31, 2016 As of December 31, 2015 As of December 31, 2015 MBS Spread Shock (bps) Estimated Change in Portfolio Market Value Estimated Change as a % of NAV(1)(2) Estimated Change in Portfolio Market Value Estimated Change as a % of NAV(1)(2) (25) 1.4% 8.1% 1.5% 8.7% (15) 0.8% 4.9% 0.9% 5.2% (5) 0.3% 1.6% 0.3% 1.7% 5 (0.3%) (1.6%) (0.3%) (1.7%) 15 (0.8%) (4.8%) (0.9%) (5.1%) 25 (1.3%) (7.9%) (1.4%) (8.5%)

* * Commercial Real Estate Overview as of March 31, 2016 (1) Book values include unamortized net origination fees.(2) Total weighted based on book value.(3) Based on most recent third party appraisal, which may be prior to loan origination/purchase date, and on an "as is" basis at the time of underwriting.(4) Maturity dates assume all of the borrowers' extension options are exercised.(5) Economic interest in securitized whole loans is reflected in B Piece CMBS.

* * Unaudited, dollars in thousands Last Five Quarters Summary Data Includes consolidated VIEs and loans held for sale. For the quarters ended For the quarters ended For the quarters ended For the quarters ended For the quarters ended March 31, December 31, September 30, June 30, March 31, 2016 2015 2015 2015 2015 Portfolio-Related Data: Portfolio-Related Data: Residential Investment Securities Residential Investment Securities $67,255,533 $67,233,494 $67,040,519 $68,249,262 $70,491,746 Commercial real estate investments(1) Commercial real estate investments(1) $6,385,579 $5,075,191 $4,976,251 $4,362,579 $3,221,518 Corporate debt Corporate debt $639,481 $488,508 $424,974 $311,640 $227,830 Total Residential Investment Securities and commercial investment portfolio Total Residential Investment Securities and commercial investment portfolio $74,280,593 $72,797,193 $72,441,744 $72,923,481 $73,941,094 Total assets Total assets $77,443,965 $75,190,893 $75,338,687 $75,545,680 $78,675,677 Average TBA position Average TBA position $15,110,947 $14,366,749 $14,210,373 $14,624,862 $8,319,920 Agency mortgage-backed securities and debentures: Agency mortgage-backed securities and debentures: % Fixed-rate 93% 93% 93% 94% 94% % Adjustable-rate 7% 7% 7% 6% 6% Weighted average experienced CPR, for the period 8.8% 9.7% 11.5% 12.1% 9.0% Weighted average projected long-term CPR, as of period end 11.8% 8.8% 9.2% 7.7% 9.2% Net premium and discount balance in Residential Investment Securities $4,741,900 $4,951,252 $4,827,791 $4,822,332 $4,677,033 Net premium and discount balance as % of stockholders' equity 40.71% 41.62% 39.32% 38.30% 35.65%

* * Unaudited, dollars in thousands except per share amounts Last Five Quarters Summary Data (cont’d) Measures total notional balances of interest rate swaps, interest rate swaptions and futures relative to repurchase agreements and TBA notional outstanding.Excludes forward starting swaps.Weighted average fixed rate on forward starting pay fixed swaps was 1.44%, 2.04%, 1.77% and 1.88% as of December 31, 2015, September 30, 2015, June 30, 2015 and March 31, 2015, respectively. There were no forward starting pay fixed swaps as of March 31, 2016. For the quarters ended For the quarters ended For the quarters ended For the quarters ended For the quarters ended March 31, December 31, September 30, June 30, March 31, 2016 2015 2015 2015 2015 Liabilities, Capital and Hedging Data: Liabilities, Capital and Hedging Data: Repurchase agreements Repurchase agreements $54,448,141 $56,230,860 $56,449,364 $57,459,552 $60,477,378 Other secured financing Other secured financing $3,588,326 $1,845,048 $359,970 $203,200 $90,000 Convertible Senior Notes Convertible Senior Notes - - - - $749,512 Securitized debt of consolidated VIEs Securitized debt of consolidated VIEs $3,802,682 $2,540,711 $2,553,398 $2,610,974 $1,491,829 Participation sold Participation sold $13,182 $13,286 $13,389 $13,490 $13,589 Mortgages payable Mortgages payable $334,765 $334,707 $166,697 $146,359 $146,470 Total debt Total debt $62,187,096 $60,964,612 $59,542,818 $60,433,575 $62,968,778 Total liabilities Total liabilities $65,785,958 $63,284,971 $63,054,354 $62,950,875 $65,551,087 Cumulative redeemable preferred stock Cumulative redeemable preferred stock $913,059 $913,059 $913,059 $913,059 $913,059 Common equity Common equity $10,735,393 $10,982,915 $11,365,769 $11,676,940 $12,206,446 Total Annaly stockholders' equity Total Annaly stockholders' equity $11,648,452 $11,895,974 $12,278,828 $12,589,999 $13,119,505 Non-controlling interests Non-controlling interests $9,555 $9,948 $5,505 $4,806 $5,085 Total equity Total equity $11,658,007 $11,905,922 $12,284,333 $12,594,805 $13,124,590 Weighted average days to maturity of repurchase agreements Weighted average days to maturity of repurchase agreements 136 151 147 149 149 Weighted average rate on repurchase agreements, at period end Weighted average rate on repurchase agreements, at period end 0.99% 0.90% 0.78% 0.76% 0.70% Weighted average rate on repurchase agreements, average during period Weighted average rate on repurchase agreements, average during period 0.95% 0.78% 0.73% 0.67% 0.60% Total debt to total stockholders' equity Total debt to total stockholders' equity 5.3x 5.1x 4.8x 4.8x 4.8x Economic leverage ratio Economic leverage ratio 6.2x 6.0x 5.8x 5.6x 5.7x Capital ratio Capital ratio 13.2% 13.7% 14.0% 14.6% 14.3% Common stock book value per share Common stock book value per share $11.61 $11.73 $11.99 $12.32 $12.88 Total common stock shares outstanding Total common stock shares outstanding 924,853 935,930 947,826 947,768 947,698 Interest rate swaps: Interest rate swaps: Hedge ratio(1) 53% 57% 58% 54% 48% Weighted average pay rate on interest rate swaps(2)(3) 2.26% 2.26% 2.26% 2.29% 2.37% Weighted average receive rate on interest rate swaps(2) 0.69% 0.53% 0.42% 0.40% 0.35% Weighted average net rate on interest rate swaps 1.57% 1.73% 1.84% 1.89% 2.02%

* * Unaudited, dollars in thousands except per share amounts Last Five Quarters Summary Data (cont’d) For the quarters ended For the quarters ended For the quarters ended For the quarters ended For the quarters ended March 31, December 31, September 30, June 30, March 31, 2016 2015 2015 2015 2015 Performance-Related Data: Performance-Related Data: Total interest income Total interest income $388,143 $576,580 $450,726 $624,277 $519,114 Total economic interest expense Total economic interest expense $270,571 $254,074 $248,041 $252,845 $286,752 Economic net interest income Economic net interest income $117,572 $322,506 $202,685 $371,432 $232,362 GAAP Net income (loss) GAAP Net income (loss) ($868,080) $669,666 ($627,491) $900,071 ($476,499) GAAP Net income (loss) available (related) to common shareholders GAAP Net income (loss) available (related) to common shareholders ($885,910) $652,047 ($645,286) $882,228 ($494,401) GAAP Earnings per common share GAAP Earnings per common share ($0.96) $0.69 ($0.68) $0.93 ($0.52) Core earnings Core earnings $123,349 $329,205 $217,601 $411,055 $254,082 Core earnings available to common shareholders Core earnings available to common shareholders $105,357 $311,213 $199,609 $393,063 $236,090 Core earnings per average common share Core earnings per average common share $0.11 $0.33 $0.21 $0.41 $0.25 Normalized core earnings Normalized core earnings $291,757 $311,133 $300,737 $331,473 $341,965 Normalized core earnings available to common shareholders Normalized core earnings available to common shareholders $273,765 $293,141 $282,745 $313,481 $323,973 Normalized core earnings per average common share Normalized core earnings per average common share $0.30 $0.31 $0.30 $0.33 $0.34 Dividends declared per common share Dividends declared per common share $0.30 $0.30 $0.30 $0.30 $0.30 Total common and preferred dividends declared Total common and preferred dividends declared $295,448 $298,771 $302,340 $302,323 $302,302 Annualized GAAP return on average equity Annualized GAAP return on average equity (29.47%) 22.15% (20.18%) 28.00% (14.41%) Annualized core return on average equity Annualized core return on average equity 4.19% 10.89% 7.00% 12.79% 7.69% Annualized core return on average equity per unit of economic leverage Annualized core return on average equity per unit of economic leverage 0.68% 1.82% 1.21% 2.28% 1.35% Annualized normalized core return on average equity Annualized normalized core return on average equity 9.91% 10.30% 9.67% 10.31% 10.34% Annualized normalized core return on average equity per unit of economic leverage Annualized normalized core return on average equity per unit of economic leverage 1.60% 1.72% 1.67% 1.84% 1.82% Net interest margin Net interest margin 0.79% 1.80% 1.27% 2.06% 1.29% Normalized net interest margin Normalized net interest margin 1.54% 1.71% 1.65% 1.70% 1.68% Average yield on interest earning assets Average yield on interest earning assets 2.09% 3.15% 2.48% 3.32% 2.54% Normalized average yield on interest earning assets Normalized average yield on interest earning assets 3.00% 3.05% 2.94% 2.90% 2.96% Average cost of interest bearing liabilities Average cost of interest bearing liabilities 1.73% 1.68% 1.65% 1.59% 1.64% Net interest spread Net interest spread 0.36% 1.47% 0.83% 1.73% 0.90% Normalized net interest spread Normalized net interest spread 1.27% 1.37% 1.29% 1.31% 1.32%

* * Appendix

* * Endnotes for Page 2 Represents a non-GAAP measure and is defined as net income (loss) excluding the estimated premium amortization adjustment due to quarter-over-quarter changes in long-term CPR estimates, gains or losses on disposals of investments and termination of interest rate swaps, unrealized gains or losses on interest rate swaps and Agency interest-only mortgage-backed securities, net gains and losses on trading assets, impairment losses, net income (loss) attributable to noncontrolling interest, and certain other non-recurring gains or losses and inclusive of dollar roll income (a component of net gains and losses on trading assets).For purposes of calculating the Company’s leverage ratio, debt consists of repurchase agreements, other secured financing, Convertible Senior Notes, securitized debt, participation sold and mortgages payable. Securitized debt, participation sold and mortgages payable are non-recourse to the Company.Computed as the sum of recourse debt, TBA derivative notional outstanding and net forward purchases of investments divided by total equity. Recourse debt consists of repurchase agreements, other secured financing and Convertible Senior Notes. The ratio of total equity to total assets (inclusive of total market value of TBA derivatives and exclusive of consolidated VIEs associated with B Piece commercial mortgage-backed securities).Interest earning assets reflects the average amortized cost of our investments during the period. Represents the sum of the Company’s normalized annualized economic net interest income (inclusive of interest expense on interest rate swaps used to hedge cost of funds) plus TBA dollar roll income (less interest expense on swaps used to hedge dollar roll transactions) divided by the sum of its average interest-earning assets plus average outstanding TBA derivative balances.Residential Investment Securities consist of Agency mortgage-backed securities, Agency debentures, credit risk transfer securities and non-Agency mortgage-backed securities.Represents credit risk transfer securities, non-Agency mortgage-backed securities, commercial real estate debt investments and preferred equity investments, loans held for sale, investments in commercial real estate and corporate debt , net of financing. Excluding loans held for sale, the total credit portfolio represents 23% of stockholders’ equity.

* * Non-GAAP Reconciliations Unaudited, dollars in thousands except per share amounts For the quarters ended For the quarters ended For the quarters ended For the quarters ended For the quarters ended March 31, December 31, September 30, June 30, March 31, 2016 2015 2015 2015 2015 GAAP to Core Reconciliation GAAP to Core Reconciliation GAAP net income (loss) GAAP net income (loss) ($868,080) $669,666 ($627,491) $900,071 ($476,499) Less: Less: Realized (gains) losses on termination of interest rate swaps - - - - 226,462 Unrealized (gains) losses on interest rate swaps 1,031,720 (463,126) 822,585 (700,792) 466,202 Net (gains) losses on disposal of investments 1,675 7,259 7,943 (3,833) (62,356) Net (gains) losses on trading assets (125,189) (42,584) (108,175) 114,230 6,906 Net unrealized (gains) losses on financial instruments measured at fair value through earnings (128) 62,703 24,501 (17,581) 33,546 Impairment of goodwill - - - 22,966 - (Income) loss attributable to non-controlling interests 162 373 197 149 90 Plus: Plus: TBA dollar roll income 83,189 94,914 98,041 95,845 59,731 Core earnings Core earnings $123,349 $329,205 $217,601 $411,055 $254,082 Premium amortization adjustment Premium amortization adjustment 168,408 (18,072) 83,136 (79,582) 87,883 Normalized core earnings Normalized core earnings $291,757 $311,133 $300,737 $331,473 $341,965 GAAP net income (loss) per average common share GAAP net income (loss) per average common share ($0.96) $0.69 ($0.68) $0.93 ($0.52) Core earnings per average common share Core earnings per average common share $0.11 $0.33 $0.21 $0.41 $0.25 Normalized core earnings per average common share Normalized core earnings per average common share $0.30 $0.31 $0.30 $0.33 $0.34 Premium Amortization Reconciliation Premium Amortization Reconciliation Premium amortization expense Premium amortization expense $355,671 $159,720 $255,123 $94,037 $284,777 Less: Less: Premium amortization adjustment 168,408 (18,072) 83,136 (79,582) 87,883 Premium amortization expense exclusive of premium amortization adjustment Premium amortization expense exclusive of premium amortization adjustment $187,263 $177,792 $171,987 $173,619 $196,894

* * Non-GAAP Reconciliations (continued) Unaudited, dollars in thousands except per share amounts For the quarters ended For the quarters ended For the quarters ended For the quarters ended For the quarters ended March 31, December 31, September 30, June 30, March 31, 2016 2015 2015 2015 2015 Normalized Interest Income Reconciliation Normalized Interest Income Reconciliation Total interest income Total interest income $388,143 $576,580 $450,726 $624,277 $519,114 Premium amortization adjustment Premium amortization adjustment 168,408 (18,072) 83,136 (79,582) 87,883 Normalized interest income Normalized interest income $556,551 $558,508 $533,862 $544,695 $606,997 Economic Interest Expense Reconciliation Economic Interest Expense Reconciliation GAAP interest expense GAAP interest expense $147,447 $118,807 $110,297 $113,072 $129,420 Add: Add: Interest expense on interest rate swaps used to hedge cost of funds 123,124 135,267 137,744 139,773 157,332 Economic interest expense Economic interest expense $270,571 $254,074 $248,041 $252,845 $286,752 Normalized Economic Net Interest Income Reconciliation Normalized Economic Net Interest Income Reconciliation Normalized interest income Normalized interest income $556,551 $558,508 $533,862 $544,695 $606,997 Less: Less: Economic interest expense 270,571 254,074 248,041 252,845 286,752 Normalized economic net interest income Normalized economic net interest income $285,980 $304,434 $285,821 $291,850 $320,245 Normalized Economic Net Interest Income Normalized Economic Net Interest Income Normalized interest income Normalized interest income $556,551 $558,508 $533,862 $544,695 $606,997 Average interest earning assets Average interest earning assets $74,171,943 $73,178,965 $72,633,314 $75,257,299 $81,896,255 Normalized average yield on interest earning assets Normalized average yield on interest earning assets 3.00% 3.05% 2.94% 2.90% 2.96% Economic interest expense Economic interest expense $270,571 $254,074 $248,041 $252,845 $286,752 Average interest bearing liabilities Average interest bearing liabilities $62,379,695 $60,516,996 $59,984,298 $63,504,983 $70,137,382 Average cost of interest bearing liabilities Average cost of interest bearing liabilities 1.73% 1.68% 1.65% 1.59% 1.64% Normalized net interest spread Normalized net interest spread 1.27% 1.37% 1.29% 1.31% 1.32% Normalized net interest margin Normalized net interest margin 1.54% 1.71% 1.65% 1.70% 1.68%