Attached files
| file | filename |
|---|---|
| EX-2.1 - EX-2.1 - WESBANCO INC | d175622dex21.htm |
| EX-99.2 - EX-99.2 - WESBANCO INC | d175622dex992.htm |
| 8-K - FORM 8-K - WESBANCO INC | d175622d8k.htm |
Exhibit 99.1
Acquisition of Your Community Bankshares, Inc.
3 May 2016
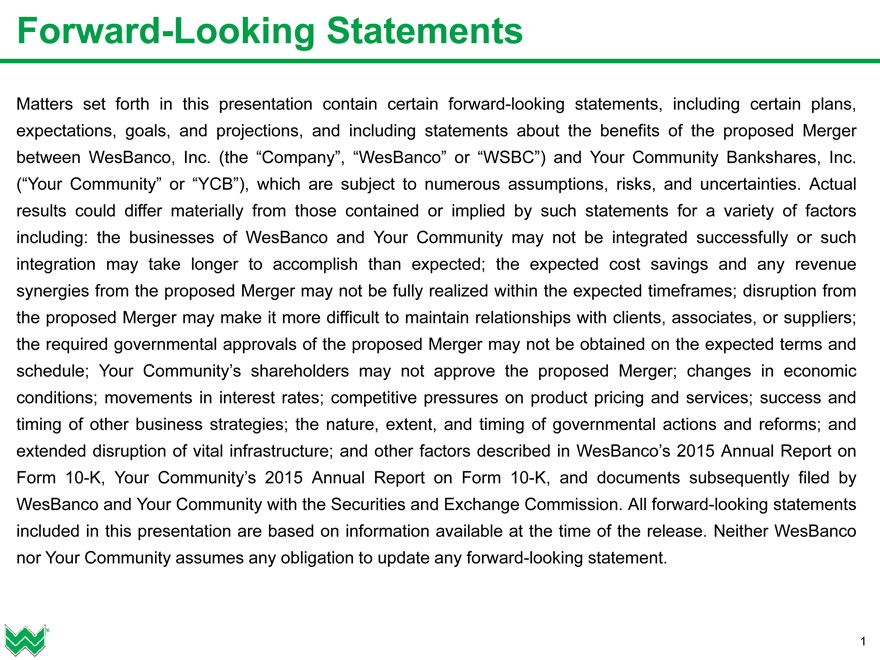
Forward-Looking Statements
Matters set forth in this presentation contain certain forward-looking statements, including certain plans, expectations, goals, and projections, and including statements about the benefits of the proposed Merger between WesBanco, Inc.
(the “Company”, “WesBanco” or “WSBC”) and Your Community Bankshares, Inc. (“Your Community” or “YCB”), which are subject to numerous assumptions, risks, and uncertainties. Actual results could differ materially from those contained or implied by such statements for a variety of factors including: the businesses of WesBanco and Your Community may not be integrated successfully or such integration may take longer to accomplish than expected; the expected cost savings and any revenue synergies from the proposed Merger may not be fully realized within the expected timeframes; disruption from the proposed Merger may make it more difficult to maintain relationships with clients, associates, or suppliers; the required governmental approvals of the proposed Merger may not be obtained on the expected terms and schedule; Your Community’s shareholders may not approve the proposed Merger; changes in economic conditions; movements in interest rates; competitive pressures on product pricing and services; success and timing of other business strategies; the nature, extent, and timing of governmental actions and reforms; and extended disruption of vital infrastructure; and other factors described in WesBanco’s 2015 Annual Report on Form 10-K, Your Community’s 2015 Annual Report on Form 10-K, and documents subsequently filed by WesBanco and Your Community with the Securities and Exchange Commission. All forward-looking statements included in this presentation are based on information available at the time of the release. Neither WesBanco nor Your Community assumes any obligation to update any forward-looking statement.
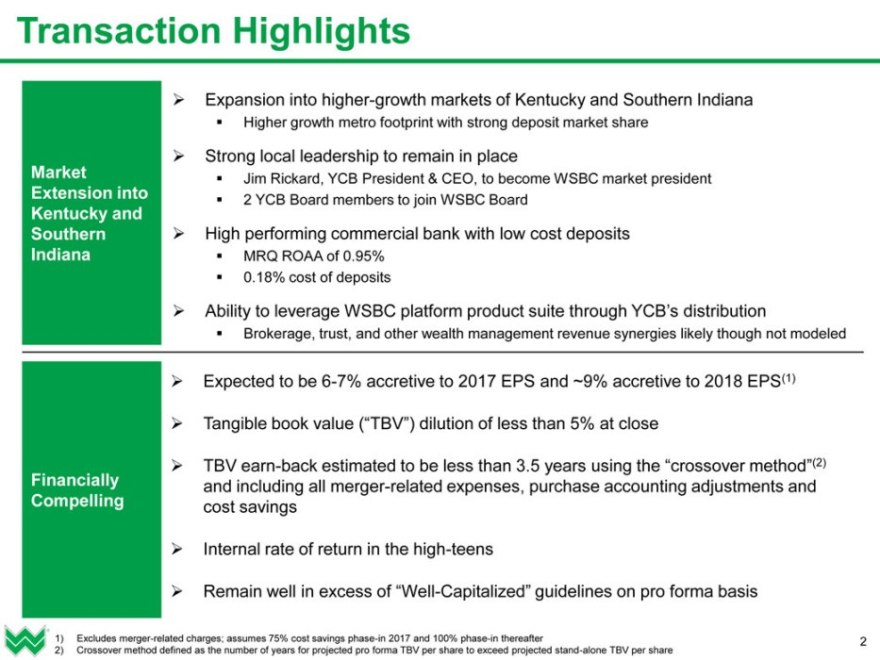
Transaction Highlights
Expansion into higher-growth markets of Kentucky and Southern Indiana
Higher growth metro footprint with strong deposit market share
Strong local leadership to remain in place
Market Jim Rickard, YCB President & CEO, to become WSBC market president Extension into ? 2 YCB Board members to join WSBC Board
Kentucky and
Southern ? High performing commercial bank with low cost deposits
Indiana ? MRQ ROAA of 0.95% ? 0.18% cost of deposits
Ability to leverage WSBC platform product suite through YCB’s distribution
Brokerage, trust, and other wealth management revenue synergies likely though not modeled
Expected to be 6-7% accretive to 2017 EPS and ~9% accretive to 2018 EPS(1)
Tangible book value (“TBV”) dilution of less than 5% at close
TBV earn-back estimated to be less than 3.5 years using the “crossover method”(2) Financially and including all merger-related expenses, purchase accounting adjustments and Compelling cost savings
Internal rate of return in the high-teens
Remain well in excess of “Well-Capitalized” guidelines on pro forma basis
1) Excludes merger-related charges; assumes 75% cost savings phase-in 2017 and 100% phase-in thereafter 2
2) Crossover method defined as the number of years for projected pro forma TBV per share to exceed projected stand-alone TBV per share
Summary of Key Terms
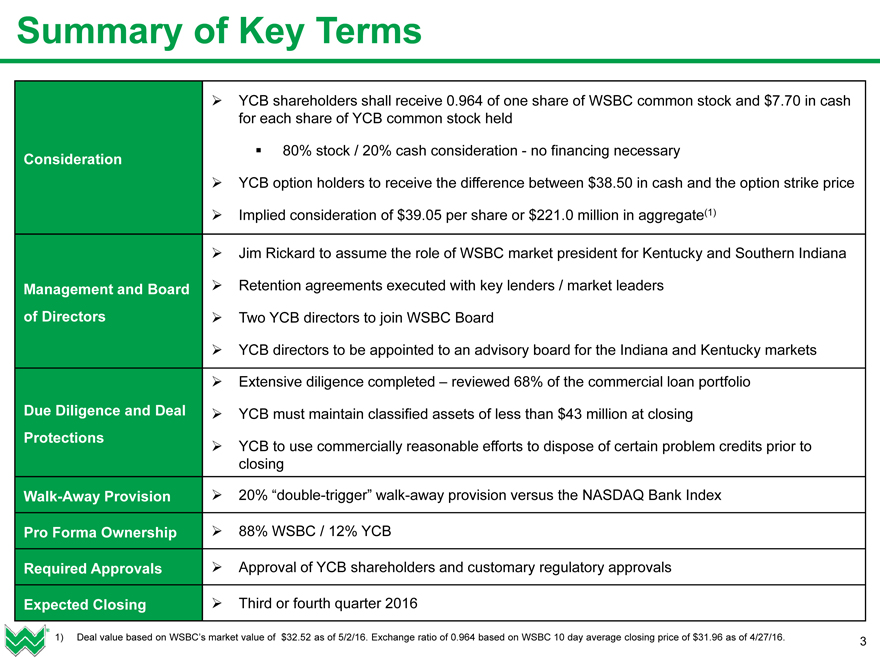
YCB shareholders shall receive 0.964 of one share of WSBC common stock and $7.70 in cash for each share of YCB common stock held
80% stock / 20% cash consideration—no financing necessary
Consideration
YCB option holders to receive the difference between $38.50 in cash and the option strike price Implied consideration of $39.05 per share or $221.0 million in aggregate(1) Jim Rickard to assume the role of WSBC market president for Kentucky and Southern Indiana
Management and Board Retention agreements executed with key lenders / market leaders of Directors Two YCB directors to join WSBC Board
YCB directors to be appointed to an advisory board for the Indiana and Kentucky markets
Extensive diligence completed – reviewed 68% of the commercial loan portfolio
Due Diligence and Deal
YCB must maintain classified assets of less than $43 million at closing
Protections
YCB to use commercially reasonable efforts to dispose of certain problem credits prior to closing
Walk-Away Provision 20% “double-trigger” walk-away provision versus the NASDAQ Bank Index
Pro Forma Ownership 88% WSBC / 12% YCB
Required Approvals Approval of YCB shareholders and customary regulatory approvals
Expected Closing Third or fourth quarter 2016
1) Deal value based on WSBC’s market value of $32.52 as of 5/2/16. Exchange ratio of 0.964 based on WSBC 10 day average closing price of $31.96 as of 4/27/16. 3
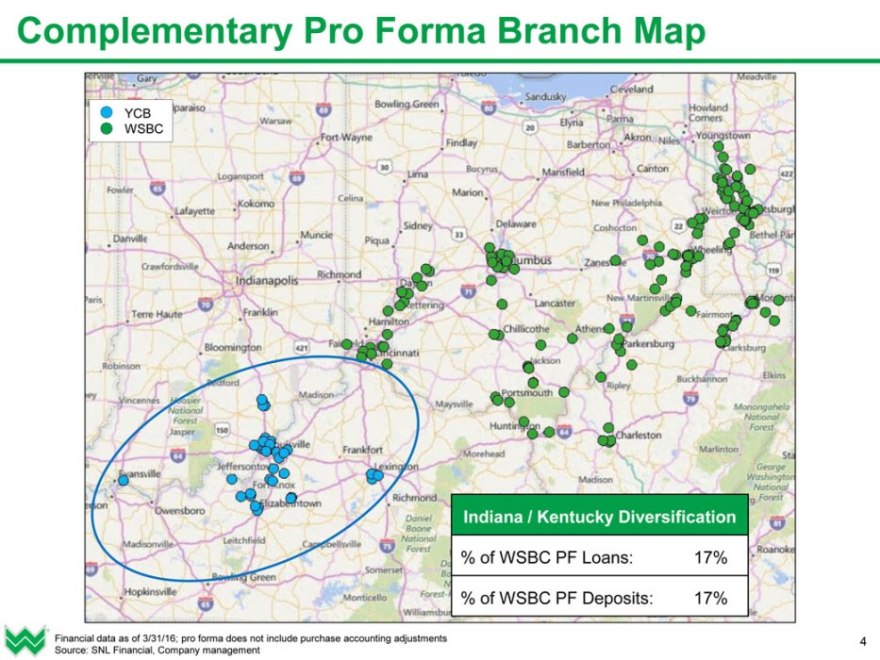
Complementary Pro Forma Branch Map
YCB WSBC
Indiana / Kentucky Diversification
% of WSBC PF Loans: 17%
% of WSBC PF Deposits: 17%
Financial data as of 3/31/16; pro forma does not include purchase accounting adjustments 4 Source: SNL Financial, Company management
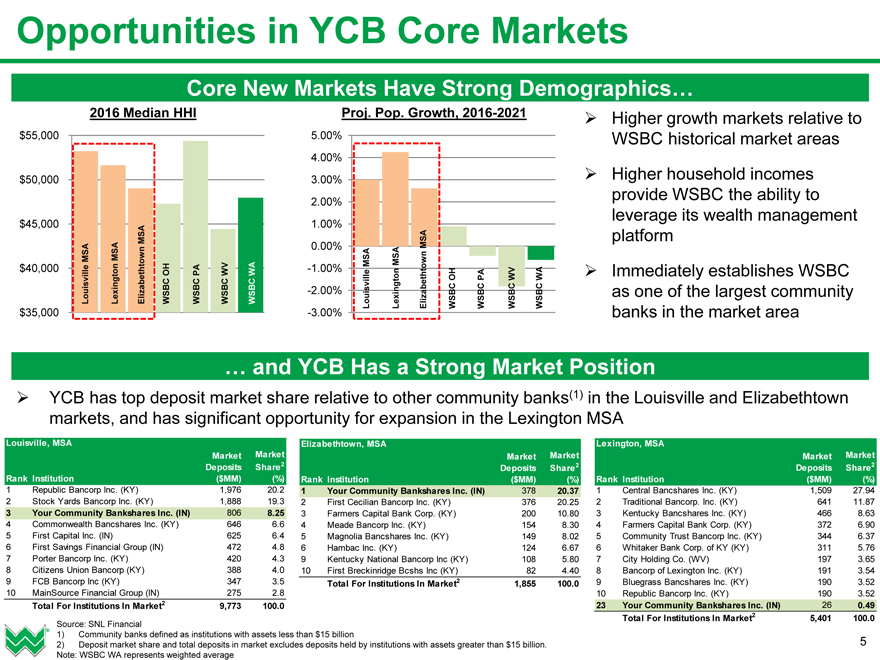
Opportunities in YCB Core Markets
Core New Markets Have Strong Demographics…
2016 Median HHI Proj. Pop. Growth, 2016-2021 Higher growth markets relative to
$55,000 5.00% WSBC historical market areas
4.00% $50,000 3.00% Higher household incomes provide WSBC the ability to 2.00% leverage its wealth management
$45,000 1.00% platform MSA 0.00% MSA MSA MSA MSA MSA $40,000 OH PA WV WA -1.00% Immediately establishes WSBC OH PA WV WA Louisville Lexington Elizabethtown WSBC WSBC WSBC WSBC -2.00% Louisville Lexington Elizabethtown WSBC WSBC WSBC WSBC as one of the largest community
$35,000 -3.00% banks in the market area … and YCB Has a Strong Market Position
YCB has top deposit market share relative to other community banks(1) in the Louisville and Elizabethtown markets, and has significant opportunity for expansion in the Lexington MSA
Louisville, MSA Elizabethtown, MSA Lexington, MSA
Market Market Market Market Market Market Deposits Share2 Deposits Share2 Deposits Share2 Rank Institution ($MM) (%) Rank Institution ($MM) (%) Rank Institution ($MM) (%)
1 Republic Bancorp Inc. (KY) 1,976 20.2 1 Your Community Bankshares Inc. (IN) 378 20.37 1 Central Bancshares Inc. (KY) 1,509 27.94
2 Stock Yards Bancorp Inc. (KY) 1,888 19.3 2 First Cecilian Bancorp Inc. (KY) 376 20.25 2 Traditional Bancorp. Inc. (KY) 641 11.87
3 Your Community Bankshares Inc. (IN) 806 8.25 3 Farmers Capital Bank Corp. (KY) 200 10.80 3 Kentucky Bancshares Inc. (KY) 466 8.63
4 Commonwealth Bancshares Inc. (KY) 646 6.6 4 Meade Bancorp Inc. (KY) 154 8.30 4 Farmers Capital Bank Corp. (KY) 372 6.90
5 First Capital Inc. (IN) 625 6.4 5 Magnolia Bancshares Inc. (KY) 149 8.02 5 Community Trust Bancorp Inc. (KY) 344 6.37 6 First Savings Financial Group (IN) 472 4.8 6 Hambac Inc. (KY) 124 6.67 6 Whitaker Bank Corp. of KY (KY) 311 5.76 7 Porter Bancorp Inc. (KY) 420 4.3 9 Kentucky National Bancorp Inc (KY) 108 5.80 7 City Holding Co. (WV) 197 3.65 8 Citizens Union Bancorp (KY) 388 4.0 10 First Breckinridge Bcshs Inc (KY) 82 4.40 8 Bancorp of Lexington Inc. (KY) 191 3.54 9 FCB Bancorp Inc (KY) 347 3.5 Total For Institutions In Market2 1,855 100.0 9 Bluegrass Bancshares Inc. (KY) 190 3.52 10 MainSource Financial Group (IN) 275 2.8 10 Republic Bancorp Inc. (KY) 190 3.52
Total For Institutions In Market2 9,773 100.0 23 Your Community Bankshares Inc. (IN) 26 0.49 Total For Institutions In Market2 5,401 100.0 Source: SNL Financial 1) Community banks defined as institutions with assets less than $15 billion
2) Deposit market share and total deposits in market excludes deposits held by institutions with assets greater than $15 billion. 5 Note: WSBC WA represents weighted average
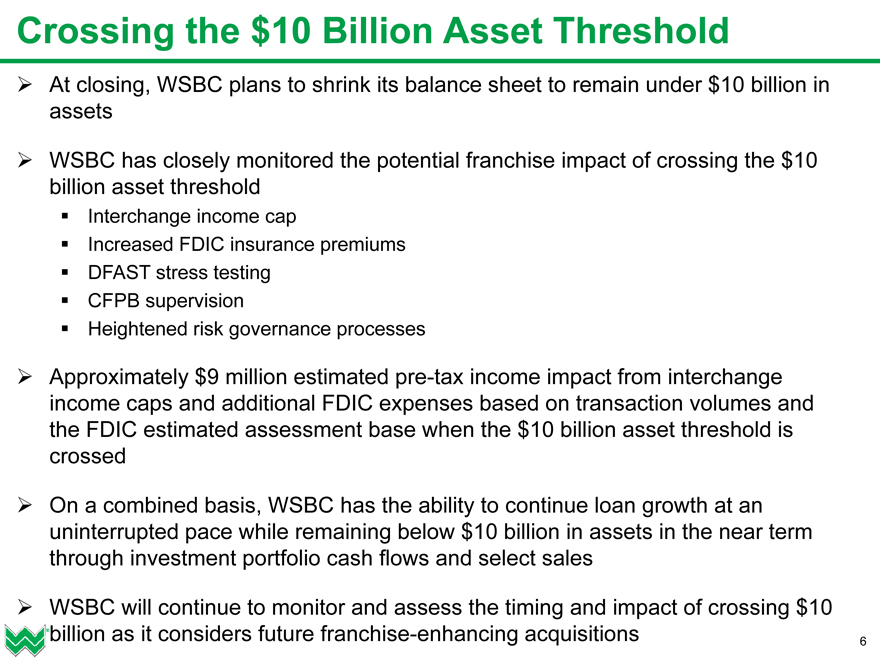
Crossing the $10 Billion Asset Threshold
At closing, WSBC plans to shrink its balance sheet to remain under $10 billion in assets
WSBC has closely monitored the potential franchise impact of crossing the $10 billion asset threshold
Interchange income cap
Increased FDIC insurance premiums DFAST stress testing CFPB supervision Heightened risk governance processes
Approximately $9 million estimated pre-tax income impact from interchange income caps and additional FDIC expenses based on transaction volumes and the FDIC estimated assessment base when the $10 billion asset threshold is crossed
On a combined basis, WSBC has the ability to continue loan growth at an uninterrupted pace while remaining below $10 billion in assets in the near term through investment portfolio cash flows and select sales
WSBC will continue to monitor and assess the timing and impact of crossing $10 billion as it considers future franchise-enhancing acquisitions
6
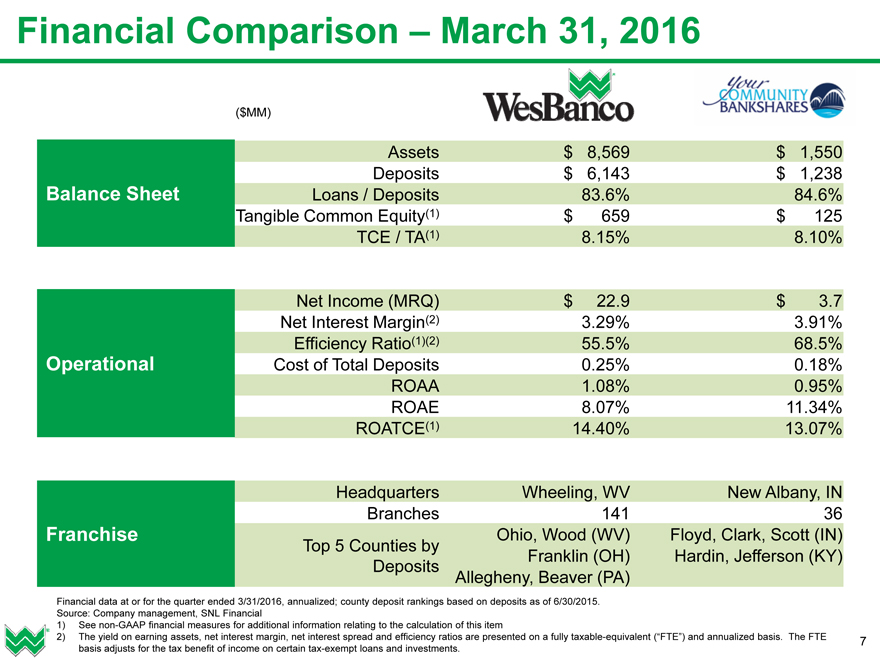
Financial Comparison – March 31, 2016
($MM)
Assets $ 8,569 $ 1,550 Deposits $ 6,143 $ 1,238 Balance Sheet Loans / Deposits 83.6% 84.6% Tangible Common Equity(1) $ 659 $ 125 TCE / TA(1) 8.15% 8.10%
Net Income (MRQ) $ 22.9 $ 3.7 Net Interest Margin(2) 3.29% 3.91% Efficiency Ratio(1)(2) 55.5% 68.5% Operational Cost of Total Deposits 0.25% 0.18% ROAA 1.08% 0.95% ROAE 8.07% 11.34% ROATCE(1) 14.40% 13.07%
Headquarters Wheeling, WV New Albany, IN Branches 141 36 Franchise Ohio, Wood (WV) Floyd, Clark, Scott (IN) Top 5 Counties by Franklin (OH) Hardin, Jefferson (KY) Deposits Allegheny, Beaver (PA)
Financial data at or for the quarter ended 3/31/2016, annualized; county deposit rankings based on deposits as of 6/30/2015. Source: Company management, SNL Financial
1) See non-GAAP financial measures for additional information relating to the calculation of this item
2) The yield on earning assets, net interest margin, net interest spread and efficiency ratios are presented on a fully taxable-equivalent (“FTE”) and annualized basis. The FTE 7 basis adjusts for the tax benefit of income on certain tax-exempt loans and investments.
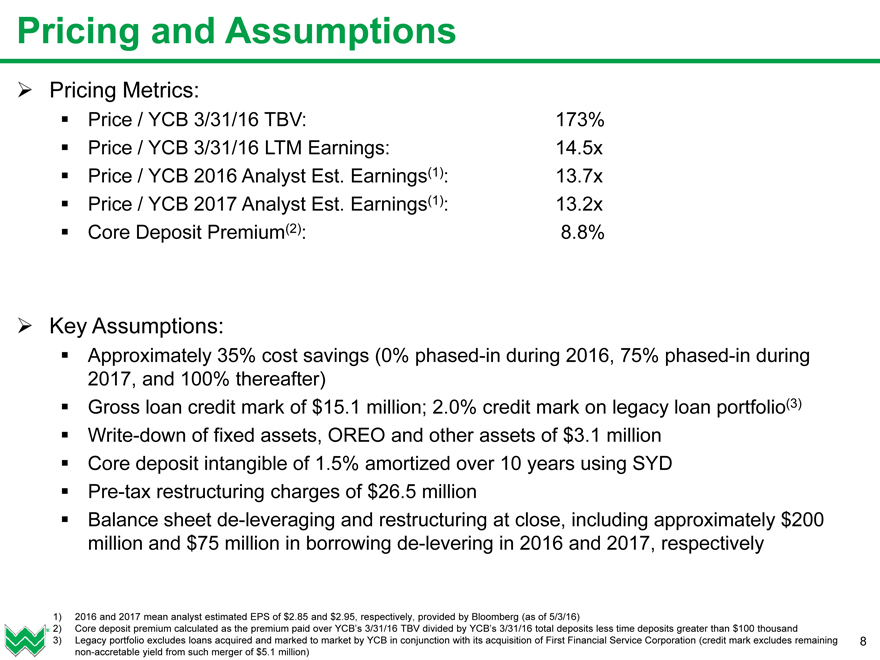
Pricing and Assumptions
Pricing Metrics:
Price / YCB 3/31/16 TBV: 173% Price / YCB 3/31/16 LTM Earnings: 14.5x Price / YCB 2016 Analyst Est. Earnings(1): 13.7x Price / YCB 2017 Analyst Est. Earnings(1): 13.2x Core Deposit Premium(2): 8.8%
Key Assumptions:
Approximately 35% cost savings (0% phased-in during 2016, 75% phased-in during 2017, and 100% thereafter) Gross loan credit mark of $15.1 million; 2.0% credit mark on legacy loan portfolio(3) Write-down of fixed assets, OREO and other assets of $3.1 million Core deposit intangible of 1.5% amortized over 10 years using SYD
Pre-tax restructuring charges of $26.5 million
Balance sheet de-leveraging and restructuring at close, including approximately $200 million and $75 million in borrowing de-levering in 2016 and 2017, respectively
1) 2016 and 2017 mean analyst estimated EPS of $2.85 and $2.95, respectively, provided by Bloomberg (as of 5/3/16)
2) Core deposit premium calculated as the premium paid over YCB’s 3/31/16 TBV divided by YCB’s 3/31/16 total deposits less time deposits greater than $100 thousand
3) Legacy portfolio excludes loans acquired and marked to market by YCB in conjunction with its acquisition of First Financial Service Corporation (credit mark excludes remaining 8 non-accretable yield from such merger of $5.1 million)
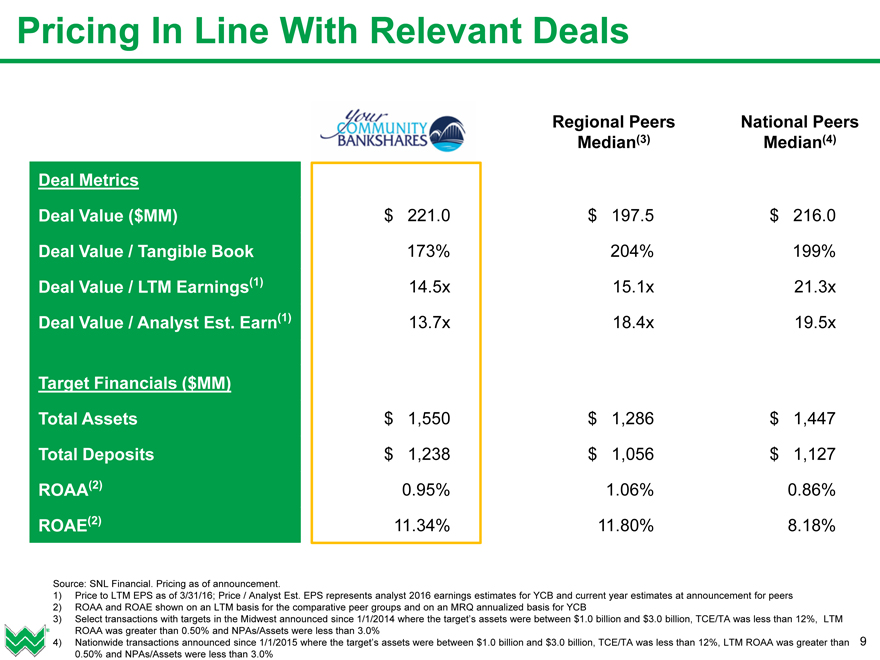
Pricing In Line With Relevant Deals
Regional Peers National Peers Median(3) Median(4)
Deal Metrics
Deal Value ($MM) $ 221.0 $ 197.5 $ 216.0
Deal Value / Tangible Book 173% 204% 199% Deal Value / LTM Earnings(1) 14.5x 15.1x 21.3x Deal Value / Analyst Est. Earn(1) 13.7x 18.4x 19.5x
Target Financials ($MM)
Total Assets $ 1,550 $ 1,286 $ 1,447
Total Deposits $ 1,238 $ 1,056 $ 1,127 ROAA(2) 0.95% 1.06% 0.86% ROAE(2) 11.34% 11.80% 8.18%
Source: SNL Financial. Pricing as of announcement.
1) Price to LTM EPS as of 3/31/16; Price / Analyst Est. EPS represents analyst 2016 earnings estimates for YCB and current year estimates at announcement for peers
2) ROAA and ROAE shown on an LTM basis for the comparative peer groups and on an MRQ annualized basis for YCB
3) Select transactions with targets in the Midwest announced since 1/1/2014 where the target’s assets were between $1.0 billion and $3.0 billion, TCE/TA was less than 12%, LTM ROAA was greater than 0.50% and NPAs/Assets were less than 3.0%
4) Nationwide transactions announced since 1/1/2015 where the target’s assets were between $1.0 billion and $3.0 billion, TCE/TA was less than 12%, LTM ROAA was greater than 9 0.50% and NPAs/Assets were less than 3.0%
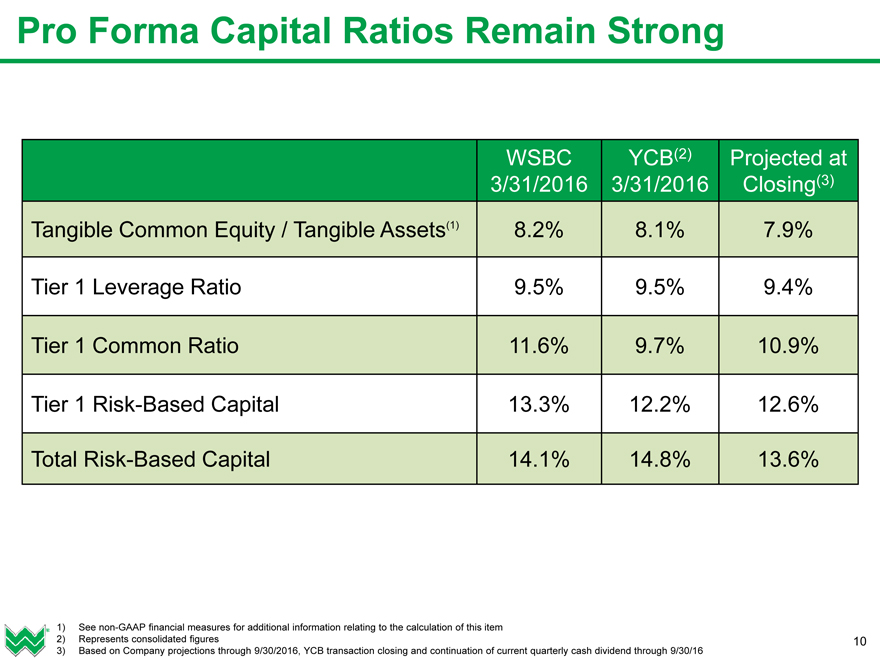
Pro Forma Capital Ratios Remain Strong
WSBC YCB(2) Projected at 3/31/2016 3/31/2016 Closing(3)
Tangible Common Equity / Tangible Assets(1) 8.2% 8.1% 7.9%
Tier 1 Leverage Ratio 9.5% 9.5% 9.4%
Tier 1 Common Ratio 11.6% 9.7% 10.9%
Tier 1 Risk-Based Capital 13.3% 12.2% 12.6%
Total Risk-Based Capital 14.1% 14.8% 13.6%
1) See non-GAAP financial measures for additional information relating to the calculation of this item
2) Represents consolidated figures 10
3) Based on Company projections through 9/30/2016, YCB transaction closing and continuation of current quarterly cash dividend through 9/30/16
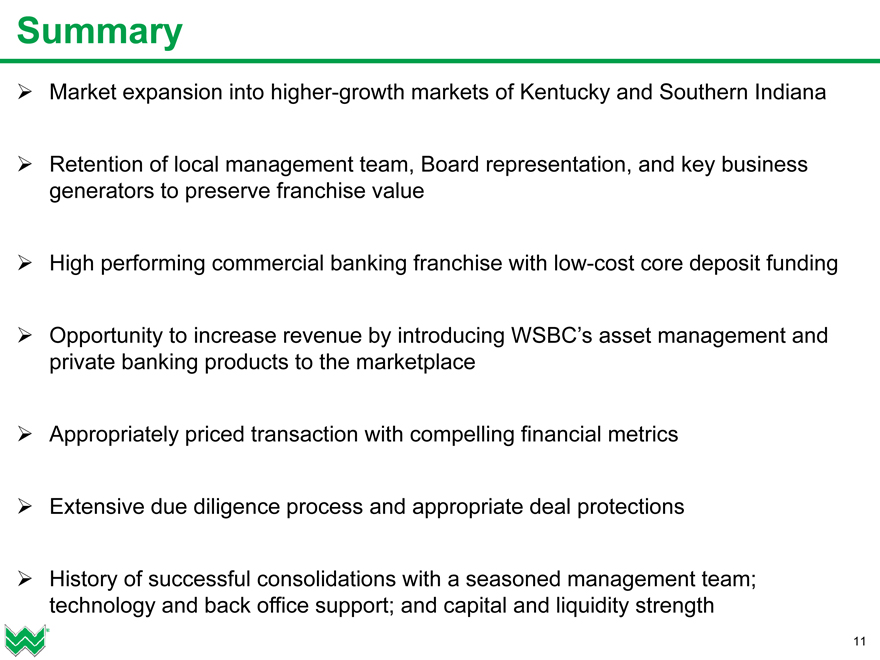
Summary
Market expansion into higher-growth markets of Kentucky and Southern Indiana
Retention of local management team, Board representation, and key business generators to preserve franchise value
High performing commercial banking franchise with low-cost core deposit funding
Opportunity to increase revenue by introducing WSBC’s asset management and private banking products to the marketplace
Appropriately priced transaction with compelling financial metrics
Extensive due diligence process and appropriate deal protections
History of successful consolidations with a seasoned management team; technology and back office support; and capital and liquidity strength
11
Appendix
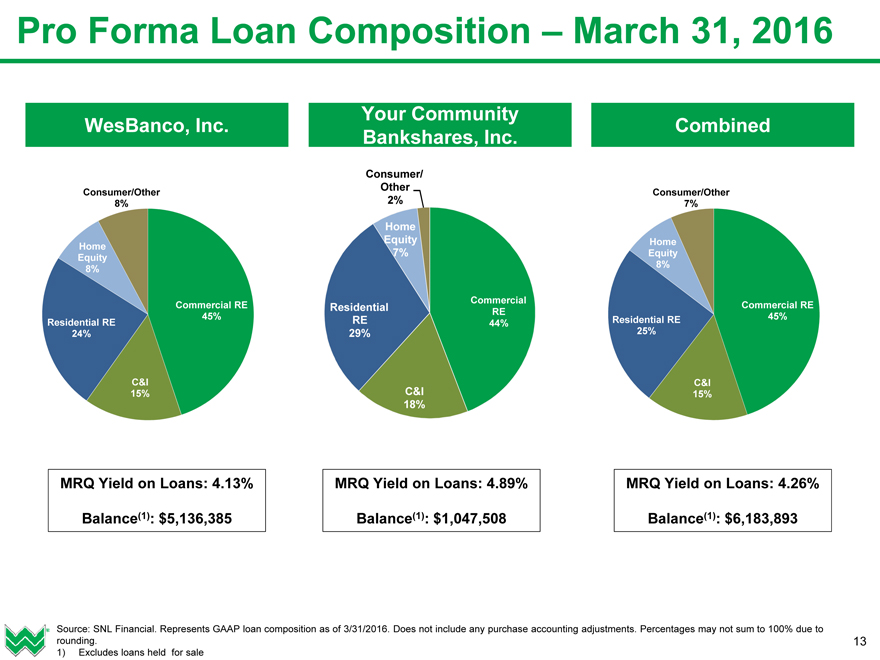
Pro Forma Loan Composition – March 31, 2016
Your Community
WesBanco, Inc. Combined Bankshares, Inc.
Consumer/ Other
Consumer/Other Consumer/Other
8% 2% 7%
Home
Equity Home
Home
7% Equity Equity 8% 8%
Commercial
Commercial RE Residential Commercial RE RE
45% RE Residential RE 45% Residential RE 44% 25% 24% 29%
C&I C&I 15% C&I 15%
18%
MRQ Yield on Loans: 4.13% MRQ Yield on Loans: 4.89% MRQ Yield on Loans: 4.26%
Balance(1): $5,136,385 Balance(1): $1,047,508 Balance(1): $6,183,893
Source: SNL Financial. Represents GAAP loan composition as of 3/31/2016. Does not include any purchase accounting adjustments. Percentages may not sum to 100% due to 13 rounding.
1) Excludes loans held for sale
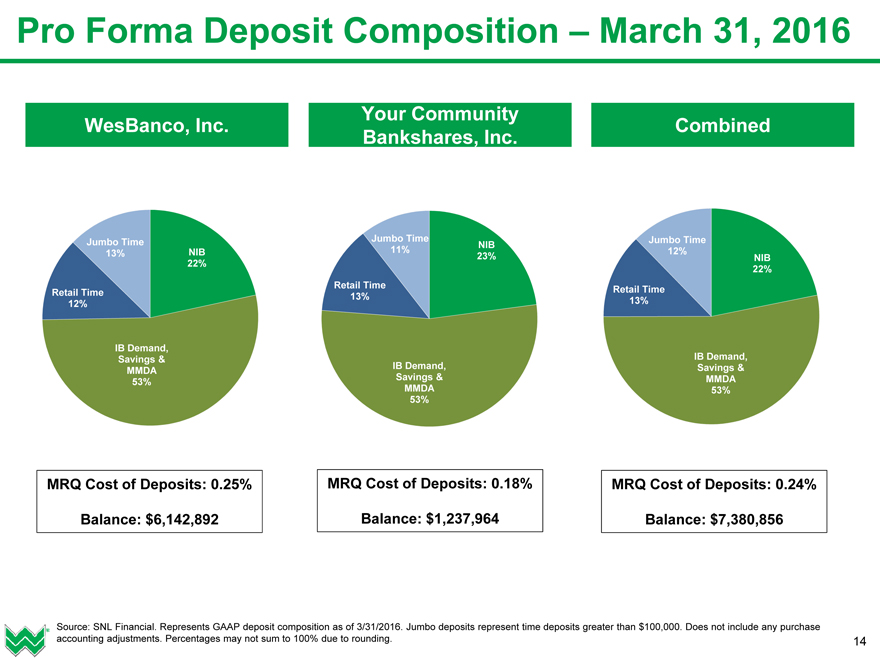
Pro Forma Deposit Composition – March 31, 2016
Your Community
WesBanco, Inc. Combined Bankshares, Inc.
Jumbo Time Jumbo Time Jumbo Time NIB
13% NIB 11% 12%
23% NIB 22% 22% Retail Time Retail Time Retail Time 13% 13% 12%
IB Demand, IB Demand, Savings & IB Demand, Savings & MMDA
Savings & MMDA 53% MMDA 53% 53%
MRQ Cost of Deposits: 0.25% MRQ Cost of Deposits: 0.18% MRQ Cost of Deposits: 0.24%
Balance: $6,142,892 Balance: $1,237,964 Balance: $7,380,856
Source: SNL Financial. Represents GAAP deposit composition as of 3/31/2016. Jumbo deposits represent time deposits greater than $100,000. Does not include any purchase accounting adjustments. Percentages may not sum to 100% due to rounding. 14
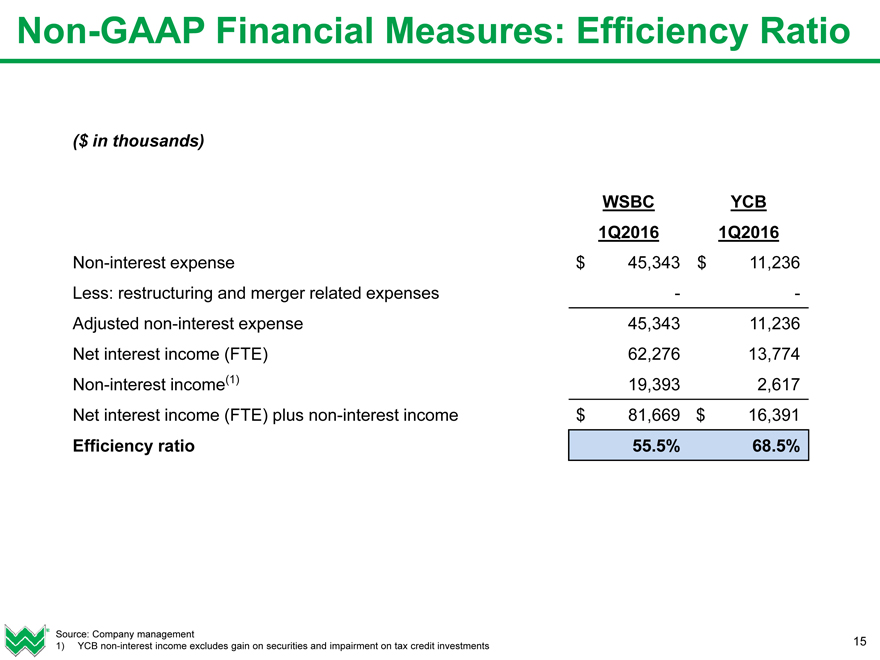
Non-GAAP Financial Measures: Efficiency Ratio
($ in thousands)
WSBC YCB 1Q2016 1Q2016
Non-interest expense $ 45,343 $ 11,236 Less: restructuring and merger related expenses — — Adjusted non-interest expense 45,343 11,236 Net interest income (FTE) 62,276 13,774 Non-interest income(1) 19,393 2,617 Net interest income (FTE) plus non-interest income $ 81,669 $ 16,391
Efficiency ratio 55.5% 68.5%
Source: Company management
1) YCB non-interest income excludes gain on securities and impairment on tax credit investments 15
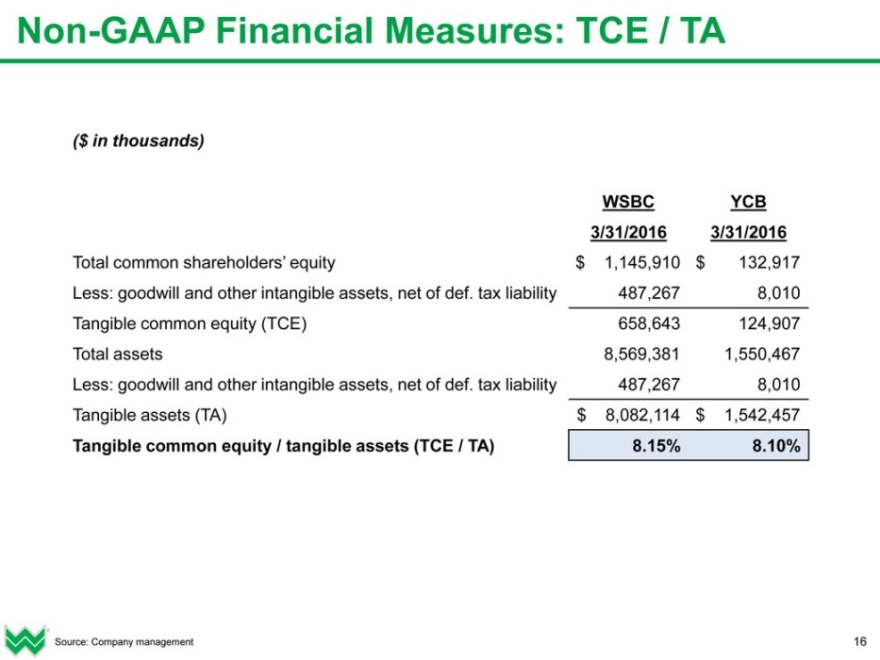
Non-GAAP Financial Measures: TCE / TA
($ in thousands)
WSBC YCB 3/31/2016 3/31/2016
Total common shareholders’ equity $ 1,145,910 $ 132,917
Less: goodwill and other intangible assets, net of def. tax liability 487,267 8,010 Tangible common equity (TCE) 658,643 124,907 Total assets 8,569,381 1,550,467 Less: goodwill and other intangible assets, net of def. tax liability 487,267 8,010 Tangible assets (TA) $ 8,082,114 $ 1,542,457
Tangible common equity / tangible assets (TCE / TA) 8.15% 8.10%
Source: Company management 16
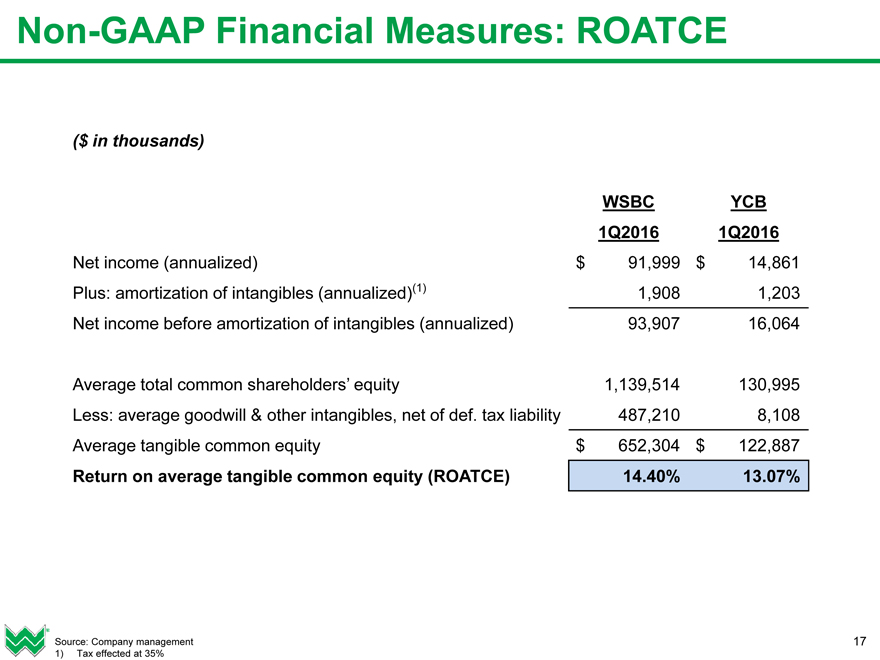
Non-GAAP Financial Measures: ROATCE
($ in thousands)
WSBC YCB 1Q2016 1Q2016
Net income (annualized) $ 91,999 $ 14,861 Plus: amortization of intangibles (annualized)(1) 1,908 1,203 Net income before amortization of intangibles (annualized) 93,907 16,064
Average total common shareholders’ equity 1,139,514 130,995
Less: average goodwill & other intangibles, net of def. tax liability 487,210 8,108 Average tangible common equity $ 652,304 $ 122,887
Return on average tangible common equity (ROATCE) 14.40% 13.07%
Source: Company management 17
1) Tax effected at 35%