Attached files
| file | filename |
|---|---|
| EX-99.2 - PRINT VERSION OF QUARTERLY INVESTOR UPDATE - SPRINT Corp | fiscal4q15sprintquarterlyinv.pdf |
| EX-99.1 - PRESS RELEASE ANNOUNCING FOURTH FISCAL QUARTER OF 2015 AND YEAR END RESULTS - SPRINT Corp | sprint4qfy15earningsrelease.htm |
| 8-K - FORM 8-K - SPRINT Corp | sprint4qfy158-kearningsrel.htm |

SPRINT FINISHES FISCAL YEAR 2015 BY GENERATING POSITIVE ANNUAL OPERATING INCOME FOR THE FIRST TIME IN NINE YEARS AND DELIVERING MORE POSTPAID PHONE NET ADDITIONS THAN VERIZON AND AT&T FOR THE FIRST TIME ON RECORD IN THE FISCAL FOURTH QUARTER

• | Fiscal year 2015 operating income of $310 million was positive for the first time in nine years; Fiscal year 2015 Adjusted EBITDA* of $8.1 billion grew 36 percent year-over-year |
◦ | Fiscal fourth quarter operating income of $8 million included charges of $258 million; Adjusted EBITDA* of $2.2 billion grew 24 percent year-over-year |
• | Fiscal year 2015 Sprint platform postpaid net additions of more than 1.2 million, including phone net additions of 438,000 which improved nearly two million year-over-year |
◦ | Fiscal fourth quarter postpaid phone net additions of 22,000 are the third consecutive quarter of positive net additions and more than both Verizon and AT&T for the first time on record |
◦ | Fiscal year 2015 Sprint platform postpaid churn of 1.61 percent and phone churn of 1.52 percent are the best in company history and both improved by approximately 50 basis points year-over-year |
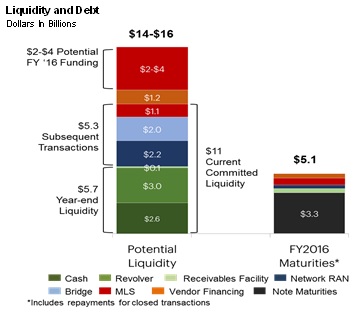
• | Delivered substantial financial flexibility with $11 billion in currently committed liquidity, up from $6 billion at the end of the fiscal third quarter |
◦ | Ended fiscal year 2015 with $5.7 billion of available liquidity, including $2.6 billion of cash |
◦ | Successfully raised an additional $5.3 billion in April, including $2.2 billion of network-related financing, $1.1 billion from the second transaction with Mobile Leasing Solutions, LLC (MLS), and $2 billion of bridge financing |
 | TABLE OF CONTENTS | ||
Customer Metrics | 3 | ||
Sales | 5 | ||
Network | 6 | ||
Financials | 7 | ||
The Sprint Quarterly Investor Update is a publication of the Sprint Investor Relations department, which can be reached by phone at 1-800-259-3755 or via e-mail at investor.relations@sprint.com. | Financial and Operational Results Tables | 11 | |
Notes to the Financial Information | 19 | ||
Financial Measures | 20 | ||
Trended financial performance metrics can also be found on our Investor Relations website at sprint.com/investors. | Safe Harbor | 21 | |
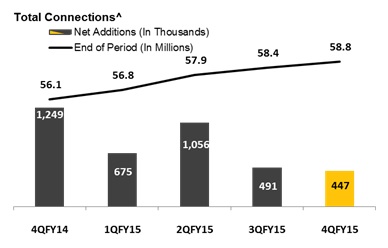

The company had 58.8 million connections at the end of the quarter, including 30.9 million postpaid, 14.4 million prepaid, and 13.5 million wholesale and affiliate connections. The Sprint platform had 447,000 net additions in the current quarter compared with 491,000 in the previous quarter and 1.2 million in the year-ago period. While net additions were relatively flat sequentially, the year-over-year reduction was primarily due to higher prepaid net losses. The company has added nearly 2.7 million Sprint platform net additions over the last four quarters.
Postpaid^
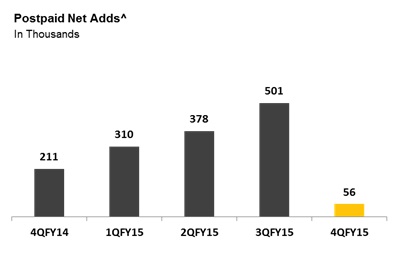
• | Net additions were 56,000 during the quarter compared to 211,000 in the year-ago period and 501,000 in the prior quarter. The year-over-year decline was driven by tablet net losses, partially offset by higher phone net additions. The sequential decline was due to seasonally lower phone gross additions. Fiscal year 2015 postpaid net additions of more than 1.2 million were the highest in three years and improved nearly 1.5 million year-over-year. |
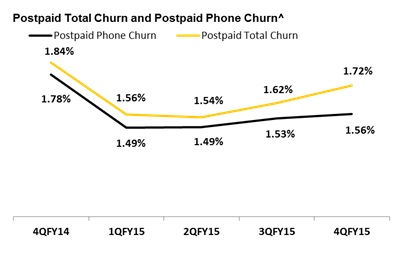
• | Postpaid churn of 1.72 percent was the lowest on record for a fiscal fourth quarter compared to 1.84 percent in the year-ago period and 1.62 percent in the prior quarter. The 12 basis point year-over-year improvement was primarily driven by the continued focus on the quality of recently acquired customers, as well as overall network experience. The sequential increase was primarily driven by higher tablet churn due to fewer promotional offers for off-contract customers, as well as more deactivations resulting from a cost saving initiative to limit the number of postpaid payment arrangements with a specific set of customers. The fiscal year churn rate of 1.61% was the lowest annual rate in company history and improved approximately 50 basis points over the prior year. |
• | Postpaid phone churn of 1.56% compared to 1.78% in the year-ago period and 1.53% in the prior quarter. The last four quarters have been the lowest postpaid phone churn rates in the company’s history. |
SPRINT QUARTERLY INVESTOR UPDATE - FISCAL 4Q15 | ^ indicates results specific to Sprint Platform 3 |
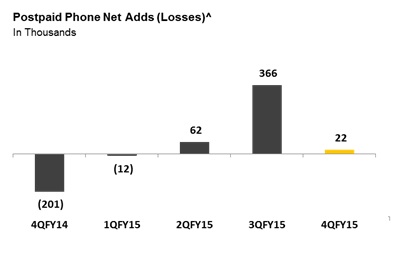

• | Phone net additions of 22,000 compared to net losses of 201,000 for the year-ago period and net additions of 366,000 in the prior quarter. The year-over-year improvement was primarily driven by lower churn, while the sequential decrease was driven by seasonally lower gross additions. This quarter was the third consecutive quarter of positive phone net additions and the company ended the quarter with 25.3 million phone connections. |
• | Tablet net losses were 36,000 in the quarter compared to net additions of 349,000 in the year-ago period and net additions of 82,000 in the prior quarter. Both the year-over-year and sequential declines were mostly due to lower gross additions and higher tablet churn rates as the company continues to focus on growing phone connections. The company ended the quarter with 3.1 million tablet connections. |
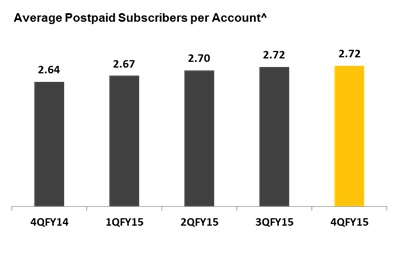
• | Average Postpaid Subscribers per Account of 2.72 at quarter end compared to 2.64 in the prior year period and 2.72 in the prior quarter. |
Prepaid^
• | Net losses of 264,000 during the quarter compared to net additions of 546,000 in the year-ago quarter and net losses of 491,000 in the prior quarter. The year-over-year decline was mostly driven by increased competitive pressure and less promotional activity. The sequential improvement was driven by both seasonally higher gross additions and improved churn. The Boost brand had positive net additions for the quarter, while the prepaid losses were in areas that are being de-emphasized from a value contribution perspective, such as Pay-As-You-Go. |
• | Churn was 5.65 percent compared to 3.84 percent for the year-ago period and 5.82 percent for the prior quarter. The increase in year-over-year was primarily due to an increase in competitive offers in the market. |
Wholesale & Affiliate^
• | Net additions were 655,000 in the quarter compared to 492,000 in the year-ago quarter and 481,000 in the prior quarter. Connected devices represented the majority of the net additions. |
SPRINT QUARTERLY INVESTOR UPDATE - FISCAL 4Q15 | ^ indicates results specific to Sprint Platform 4 |
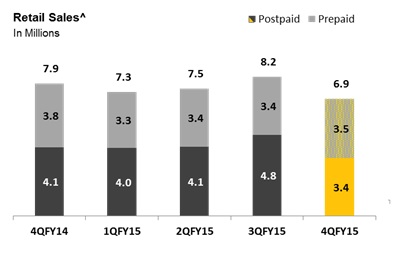

Retail Sales^ were 6.9 million during the quarter compared to 7.9 million in the year-ago quarter and 8.2 million in the prior quarter. Lower postpaid upgrade volumes were the biggest driver of the sequential and year-over-year decline.
Postpaid^
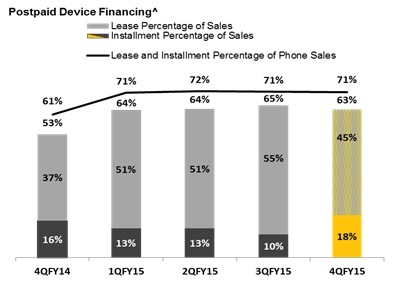
• | Device financing take rate was 63 percent of postpaid sales for the quarter (45 percent on leasing and 18 percent on installment plans) compared to 53 percent for the year-ago period and 65 percent in the prior quarter. At the end of the quarter, 46 percent of the postpaid connection base was active on a device financing agreement (33 percent on leasing and 13 percent on installment plans) compared to 25 percent in the year-ago quarter and 44 percent in the prior quarter. |
• | Phone financing take rate was 71 percent of phone sales for the quarter compared to 61 percent for the year-ago period and 71 percent in the prior quarter. At the end of the quarter, 54 percent of the phone connection base was active on a device financing agreement compared to 28 percent in the year-ago quarter and 51 percent in the prior quarter. The percentage of our postpaid phone base on unsubsidized plans was 61 percent at the end of the quarter compared to 37 percent in the year-ago period and 57 percent in the prior quarter. |
• | Upgrade rate was 5.9 percent during the quarter compared to 7.5 percent for the year-ago quarter and 9.3 percent for the prior quarter. The year-over-year decline was driven by a lower percentage of the base being eligible for upgrades compared to the prior year, while the sequential decrease was due to seasonality. |
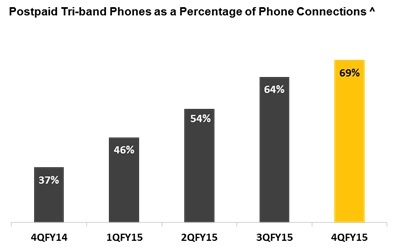
• | Tri-band LTE phones represented 69 percent of the 25.3 million ending postpaid phone connection base compared to 37 percent at the end of the year-ago quarter and 64 percent at the end of the prior quarter. During the quarter, 90 percent of postpaid phones sold were tri-band. |
• | Smartphones represented 92 percent of the ending postpaid phone connection base compared to 88 percent at the end of the year-ago quarter and 91 percent at the end of the prior quarter. During the quarter, 97 percent of postpaid phones sold were smartphones. |
• | Carrier aggregation capable phones, which allow for higher data speeds, were 74 percent of postpaid phones sold during the quarter, increasing the number of these phones within the phone base to 28 percent. |
SPRINT QUARTERLY INVESTOR UPDATE - FISCAL 4Q15 | ^ indicates results specific to Sprint Platform 5 |

The Sprint LTE Plus Network, which takes advantage of the company’s rich tri-band spectrum portfolio and uses some of the world’s most advanced technologies in wireless such as carrier aggregation and antenna beamforming, is now available in 204 markets across the country, including recent launches in New York City, Boston, and Philadelphia.
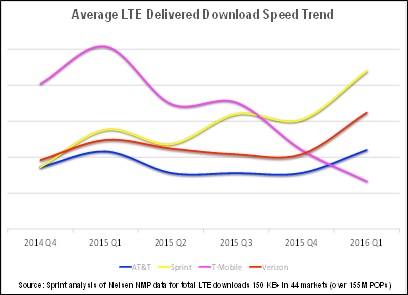
The expansion is driving network performance that is beating the competition. An analysis of Nielsen Mobile Performance crowd-sourced data from January through March 2016 showed that Sprint’s LTE Plus Network continued to outperform Verizon, AT&T and T-Mobile by delivering the fastest LTE download speeds.
Total LTE coverage now reaches nearly 300 million people, including approximately 70 percent being covered by the 2.5 GHz spectrum deployment.
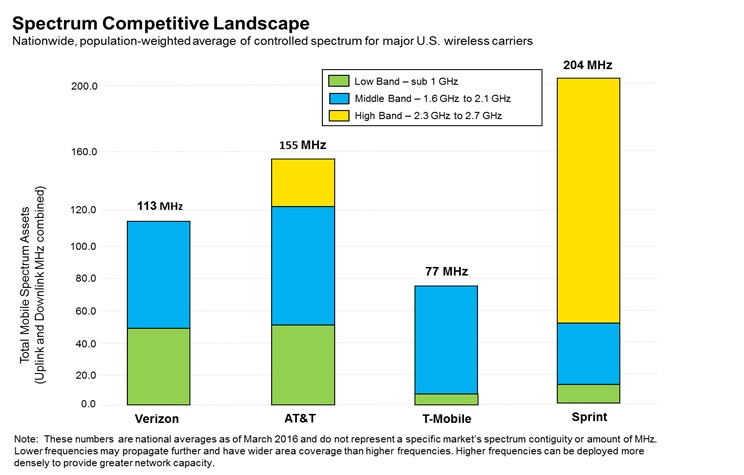
Our 2.5 GHz spectrum excels at moving high volumes of data at very fast speeds. With holdings of more than 160 MHz of 2.5 GHz spectrum in the top 100 U.S. markets, we have more capacity than any other carrier in the U.S. This tremendous advantage allows the company to add the capacity and speed needed to serve customers’ demand for data now and well into the future.
SPRINT QUARTERLY INVESTOR UPDATE - FISCAL 4Q15 | 6 |

Revenues
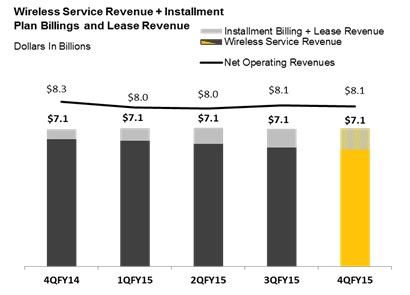
• | Net operating revenues of $8.1 billion for the quarter decreased three percent year-over-year, but have stabilized over the last four quarters. The year-over-year decline was primarily due to lower wireless and wireline service revenue, which were partially offset by growth in equipment revenue primarily driven by higher leasing revenue. Additionally, a portion of the decrease was due to Brightstar sourcing some devices in Sprint’s indirect channels, resulting in less equipment revenues than if Sprint had fulfilled these channels. The impact to Adjusted EBITDA* was not material due to the offsetting reduction in cost of products expense. |
• | Wireless service revenue + installment plan billings and lease revenue, which represents total recurring cash flows from customers, was $7.1 billion for the quarter, increasing one percent year-over-year and remaining flat sequentially. Both year-over-year and sequentially, the company saw growth in both postpaid phone customers and postpaid average billings per user (ABPU)* that were partially offset by lower prepaid service revenue. |
• | Wireline revenues of $562 million for the quarter declined $106 million year-over-year and $19 million sequentially. The year-over-year decline was primarily driven by lower voice rates and volumes as the company continues to de-emphasize certain voice services. |
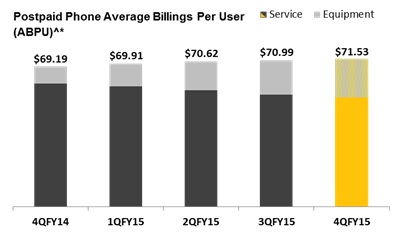
• | Postpaid Phone Average Billings Per User (ABPU)^* of $71.53 for the quarter increased three percent year-over-year and increased one percent sequentially. The increases are primarily related to higher lease revenue associated with device financing, partially offset by a shift to lower priced rate plans offered in conjunction with device financing options. |
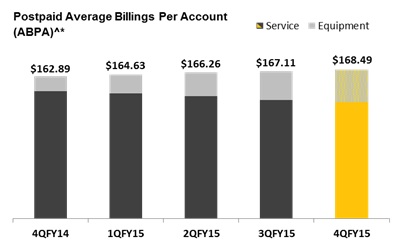
• | Postpaid Average Billings Per Account (ABPA)^* of $168.49 for the quarter increased three percent year-over-year and increased one percent sequentially. The year-over-year increase was due to higher lease revenue, in addition to growth in lines per account, partially offset by lower rate plans offered in conjunction with device financing options. |
• | Prepaid Average Revenue Per User (ARPU)^ of $27.72 for the quarter increased one percent year-over-year and sequentially. The slight increases were primarily driven by changes in the mix of our customer base among our prepaid brands, with growth in the mix of higher ARPU Boost customers. |
SPRINT QUARTERLY INVESTOR UPDATE - FISCAL 4Q15 | ^ indicates results specific to Sprint Platform 7 |

Operating Expenses
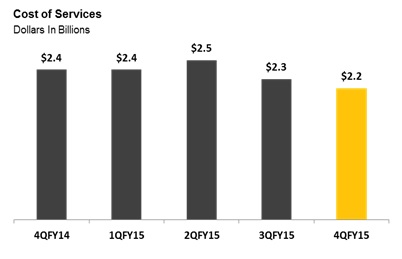
• | Cost of services of $2.2 billion for the quarter decreased $136 million year-over-year and $103 million sequentially. The year-over-year and sequential decreases were primarily driven by lower network backhaul and wireless roaming expenses. |
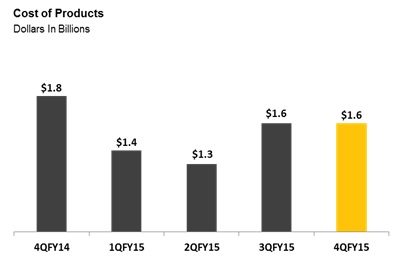
• | Cost of products of $1.6 billion for the quarter declined $276 million year-over-year and $38 million sequentially. The year-over-year decrease was related to lower upgrade volumes, as well as changes in sourcing of some devices in the company’s indirect channels, resulting in less cost of products expenses than if Sprint fulfilled these channels, partially offset by lease payments associated with the first sale-leaseback transaction with Mobile Leasing Solutions, LLC (MLS). While the cost of products was relatively flat sequentially, seasonably lower postpaid sales volumes were offset by additional lease payments to MLS. |
• | Selling, general and administrative expenses (SG&A) of $1.9 billion for the quarter decreased by $392 million year-over-year and $190 million sequentially. The year-over-year decrease was primarily driven by lower bad debt expense as our customer credit profile improved, lower marketing spend, and lower prepaid selling expenses. The sequential decrease was primarily driven by seasonally lower selling expenses, lower customer management expenses, and a reduction in bad debt expense. |
• | Other, net of $436 million for the quarter increased $465 million year-over year and $63 million sequentially. The year-over-year increase was driven by charges mostly related to severance and lease exit costs, including the shutdown of legacy WiMAX service, and a loss on leased devices, with only the latter impacting Adjusted EBITDA* results. The sequential increase was also impacted by the WiMAX shutdown charge. |
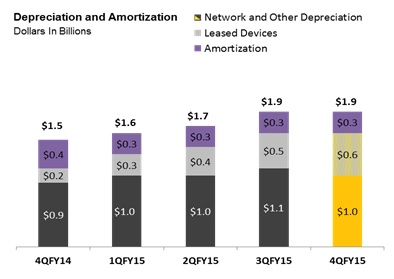
• | Depreciation and amortization expense of $1.9 billion for the quarter increased $438 million year-over-year and $27 million sequentially. The year-over-year increase was primarily related to depreciation of devices associated with our leasing options. Leased device depreciation was $550 million in the quarter, $150 million in the prior year, and $535 million in the prior quarter. Due to its off-balance sheet treatment, devices sold in the first transaction with MLS no longer recognize device depreciation and lease payments associated with the devices are recognized in cost of products. |
SPRINT QUARTERLY INVESTOR UPDATE - FISCAL 4Q15 | 8 |
Adjusted EBITDA* & Operating Income/(Loss)
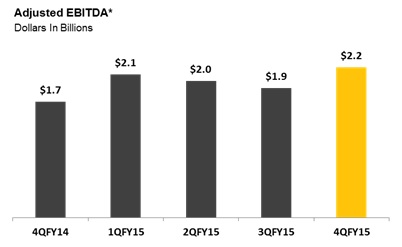
• | Adjusted EBITDA* was $2.2 billion for the quarter compared to $1.7 billion in the year-ago quarter and $1.9 billion in the prior quarter. Adjusted EBITDA* increased 24 percent year-over-year, as expense reductions, including over $500 million in cost of services and SG&A expenses, more than offset the decline in net operating revenues. Sequentially, Adjusted EBITDA* increased by 14 percent, primarily due to lower cost of services and SG&A expenses. |
• | Operating income of $8 million compares to operating income of $318 million in the year-ago quarter and an operating loss of $197 million in the prior quarter. The year-over-year decrease was mostly related to severance and lease exit costs, including the shutdown of legacy WiMAX service that will free up valuable spectrum and immediately lower network costs. Adjusting for the charges in both periods, operating income would have been relatively flat year-over-year. The sequential improvement was mostly due to higher Adjusted EBITDA*. |
Capital Expenditures & Free Cash Flow*
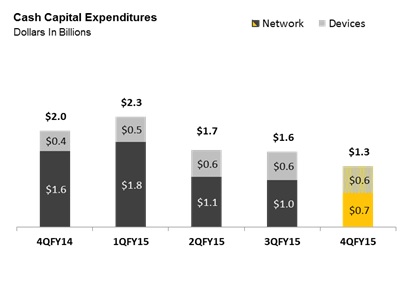
• | Cash capital expenditures were $1.3 billion in the quarter compared to $2.0 billion in the year-ago quarter and $1.6 billion in the prior quarter. Capital expenditures for leased devices were $568 million in the current quarter compared to $439 million in the year-ago quarter and $607 million in the prior quarter. Both the year-over-year and sequential declines in spending were primarily driven by lower network capital expenditures, which continue to benefit from software driven deployments of capacity through carrier aggregation. |
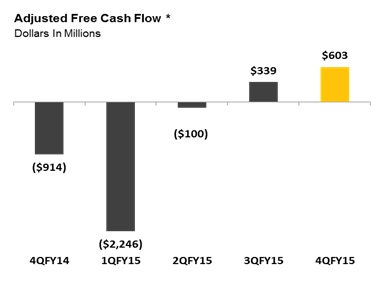
• | Adjusted free cash flow*, $603 million for the quarter compared to negative $914 billion in the year-ago quarter and positive $339 million in the prior quarter. The $1.5 billion improvement from the prior year was driven by improved business trends and lower capital spending. The $264 million sequential increase was driven by improved business trends, favorable changes to working capital and lower capital spending, partially offset by $1.1 billion received from our first sale-leaseback transaction with MLS in the prior quarter. |
SPRINT QUARTERLY INVESTOR UPDATE - FISCAL 4Q15 | 9 |
Liquidity & Debt
• | Sprint has taken several actions to improve its financial flexibility and currently has $11 billion of committed liquidity, up from $6 billion at the end of the fiscal third quarter. The company also has an additional $1.2 billion of availability under vendor financing agreements that can be used toward the purchase of 2.5 GHz network equipment. |
• | Total liquidity at the end of fiscal year 2015 was $5.7 billion, including $2.6 billion of cash and cash equivalents, $3 billion of undrawn borrowing capacity under the revolving bank credit facility, and approximately $100 million of undrawn availability under the receivables facility. |
• | Sprint received $2.2 billion from the sale and lease-back of certain existing network assets at an attractive cost of funding in the mid-single digits. This transaction did not include any of the company’s spectrum assets. |
• | The company executed its second sale-leaseback transaction of certain leased devices with MLS, providing a $1.1 billion cash infusion. |
• | Sprint signed an 18-month bridge financing facility for $2 billion with better terms than its alternatives in the high-yield debt market. |
Financial Outlook
• | The company expects fiscal year 2016 Adjusted EBITDA* to be $9.5 billion to $10 billion. |
• | The company expects fiscal year 2016 operating income to be $1 billion to $1.5 billion. |
• | The company expects fiscal year 2016 cash capital expenditures, excluding indirect channel device leases, to be approximately $3 billion, as non-network expenditures are expected to decline year-over-year and more of the cash outlays related to network densification are expected to be incurred in fiscal year 2017. The company’s deep spectrum position and its small cell focused densification are also expected to improve overall capital efficiency. |
• | The company expects fiscal year 2016 Adjusted free cash flow* to be around break-even. |
SPRINT QUARTERLY INVESTOR UPDATE - FISCAL 4Q15 | 10 |
Wireless Operating Statistics (Unaudited)
Quarter To Date | Year To Date | ||||||||||
3/31/16 | 12/31/15 | 3/31/15 | 3/31/16 | 3/31/15 | |||||||
Sprint platform (1): | |||||||||||
Net additions (losses) (in thousands) | |||||||||||
Postpaid | 56 | 501 | 211 | 1,245 | (212 | ) | |||||
Prepaid | (264 | ) | (491 | ) | 546 | (1,309 | ) | 449 | |||
Wholesale and affiliate | 655 | 481 | 492 | 2,733 | 2,349 | ||||||
Total Sprint platform wireless net additions | 447 | 491 | 1,249 | 2,669 | 2,586 | ||||||
End of period connections (in thousands) | |||||||||||
Postpaid | 30,951 | 30,895 | 29,706 | 30,951 | 29,706 | ||||||
Prepaid | 14,397 | 14,661 | 15,706 | 14,397 | 15,706 | ||||||
Wholesale and affiliate | 13,458 | 12,803 | 10,725 | 13,458 | 10,725 | ||||||
Total Sprint platform end of period connections | 58,806 | 58,359 | 56,137 | 58,806 | 56,137 | ||||||
Churn | |||||||||||
Postpaid | 1.72 | % | 1.62 | % | 1.84 | % | 1.61 | % | 2.09 | % | |
Prepaid | 5.65 | % | 5.82 | % | 3.84 | % | 5.39 | % | 3.99 | % | |
Supplemental data - connected devices | |||||||||||
End of period connections (in thousands) | |||||||||||
Retail postpaid | 1,771 | 1,676 | 1,320 | 1,771 | 1,320 | ||||||
Wholesale and affiliate | 8,575 | 7,930 | 5,832 | 8,575 | 5,832 | ||||||
Total | 10,346 | 9,606 | 7,152 | 10,346 | 7,152 | ||||||
Supplemental data - total company | |||||||||||
End of period connections (in thousands) | |||||||||||
Sprint platform (1) | 58,806 | 58,359 | 56,137 | 58,806 | 56,137 | ||||||
Transactions (2) | — | — | 1,004 | — | 1,004 | ||||||
Total | 58,806 | 58,359 | 57,141 | 58,806 | 57,141 | ||||||
Sprint platform ARPU (1) (a) | |||||||||||
Postpaid | 51.68 | 52.48 | 56.94 | 53.39 | 59.63 | ||||||
Prepaid | 27.72 | 27.44 | 27.50 | 27.66 | 27.30 | ||||||
NON-GAAP RECONCILIATION - ABPA*, POSTPAID PHONE ARPU and ABPU* (Unaudited)
(Millions, except accounts, connections, ABPA*, ARPU, and ABPU*)
Quarter to Date | Year to Date | |||||||||||||||
3/31/16 | 12/31/15 | 3/31/15 | 3/31/16 | 3/31/15 | ||||||||||||
Sprint platform ABPA* (1) | ||||||||||||||||
Postpaid service revenue | $ | 4,793 | $ | 4,813 | $ | 5,049 | $ | 19,463 | $ | 21,181 | ||||||
Add: Installment plan billings | 287 | 300 | 294 | 1,190 | 877 | |||||||||||
Add: Lease revenue | 662 | 531 | 129 | 1,838 | 164 | |||||||||||
Total for Sprint platform postpaid connections | $ | 5,742 | $ | 5,644 | $ | 5,472 | $ | 22,491 | $ | 22,222 | ||||||
Sprint platform postpaid accounts (in thousands) | 11,358 | 11,261 | 11,199 | 11,248 | 11,453 | |||||||||||
Sprint platform postpaid ABPA* (b) | $ | 168.49 | $ | 167.11 | $ | 162.89 | $ | 166.63 | $ | 161.67 | ||||||
Quarter to Date | Year to Date | |||||||||||||||
3/31/16 | 12/31/15 | 3/31/15 | 3/31/16 | 3/31/15 | ||||||||||||
Sprint platform postpaid phone ARPU and ABPU* (1) | ||||||||||||||||
Postpaid phone service revenue | $ | 4,512 | $ | 4,529 | $ | 4,772 | $ | 18,331 | $ | 20,095 | ||||||
Add: Installment plan billings | 268 | 280 | 281 | 1,116 | 835 | |||||||||||
Add: Lease revenue | 649 | 522 | 125 | 1,799 | 159 | |||||||||||
Total for Sprint platform postpaid phone connections | $ | 5,429 | $ | 5,331 | $ | 5,178 | $ | 21,246 | $ | 21,089 | ||||||
Sprint platform postpaid average phone connections (in thousands) | 25,297 | 25,040 | 24,946 | 25,020 | 25,420 | |||||||||||
Sprint platform postpaid phone ARPU (a) | $ | 59.45 | $ | 60.30 | $ | 63.76 | $ | 61.05 | $ | 65.88 | ||||||
Sprint platform postpaid phone ABPU* (c) | $ | 71.53 | $ | 70.99 | $ | 69.19 | $ | 70.77 | $ | 69.14 | ||||||
(a) ARPU is calculated by dividing service revenue by the sum of the monthly average number of connections in the applicable service category. Changes in average monthly service revenue reflect connections for either the postpaid or prepaid service category who change rate plans, the level of voice and data usage, the amount of service credits which are offered to connections, plus the net effect of average monthly revenue generated by new connections and deactivating connections.
Sprint platform postpaid phone ARPU represents revenues related to our postpaid phone connections.
(b) Sprint platform postpaid ABPA* is calculated by dividing service revenue earned from connections plus installment plan billings and lease revenue by the sum of the monthly average number of accounts during the period.
(c) Sprint platform postpaid phone ABPU* is calculated by dividing postpaid phone service revenue earned from postpaid phone connections plus installment plan billings and lease revenue by the sum of the monthly average number of postpaid phone connections during the period.
SPRINT QUARTERLY INVESTOR UPDATE - FISCAL 4Q15 | 11 |
Wireless Device Financing Summary (Unaudited)
(Millions, except sales, connections, and sales and connections mix)
Quarter To Date | Year To Date | |||||||||||||||
3/31/16 | 12/31/15 | 3/31/15 | 3/31/16 | 3/31/15 | ||||||||||||
Postpaid sales (in thousands) | 3,438 | 4,799 | 4,057 | 16,394 | 17,326 | |||||||||||
Postpaid sales mix | ||||||||||||||||
Subsidy/other | 37 | % | 35 | % | 47 | % | 36 | % | 61 | % | ||||||
Installment plans | 18 | % | 10 | % | 16 | % | 13 | % | 22 | % | ||||||
Leasing | 45 | % | 55 | % | 37 | % | 51 | % | 17 | % | ||||||
Postpaid connections (in thousands) | 30,951 | 30,895 | 29,706 | 30,951 | 29,706 | |||||||||||
Postpaid connections mix | ||||||||||||||||
Subsidy/other | 54 | % | 56 | % | 75 | % | 54 | % | 75 | % | ||||||
Installment plans | 13 | % | 14 | % | 15 | % | 13 | % | 15 | % | ||||||
Leasing | 33 | % | 30 | % | 10 | % | 33 | % | 10 | % | ||||||
Installment plans | ||||||||||||||||
Installment sales financed | $ | 311 | $ | 251 | $ | 347 | $ | 1,059 | $ | 2,200 | ||||||
Installment billings | 287 | 300 | 294 | 1,190 | 877 | |||||||||||
Installment receivables, net | — | — | 1,396 | — | 1,396 | |||||||||||
Leasing | ||||||||||||||||
Lease revenue | $ | 662 | $ | 531 | $ | 129 | $ | 1,838 | $ | 164 | ||||||
Lease depreciation | 550 | 535 | 150 | 1,781 | 206 | |||||||||||
Leased device additions: | ||||||||||||||||
Cash paid for capital expenditures - leased devices | $ | 568 | $ | 607 | $ | 439 | $ | 2,292 | $ | 582 | ||||||
Transfers from inventory - leased devices | 621 | 1,073 | 543 | 3,244 | 1,246 | |||||||||||
Total leased device additions | $ | 1,189 | $ | 1,680 | $ | 982 | $ | 5,536 | $ | 1,828 | ||||||
Leased devices in property, plant and equipment, net | $ | 3,645 | $ | 3,321 | $ | 1,777 | $ | 3,645 | $ | 1,777 | ||||||
Leased device net proceeds | ||||||||||||||||
Proceeds from MLS sale | $ | — | $ | 1,136 | $ | — | $ | 1,136 | $ | — | ||||||
Repayments to MLS | — | — | — | — | — | |||||||||||
Proceeds from lease securtization | 600 | — | — | 600 | — | |||||||||||
Repayments of lease securtization | — | — | — | — | — | |||||||||||
Net proceeds from the sale-leaseback of devices and sales of future lease receivables | $ | 600 | $ | 1,136 | $ | — | $ | 1,736 | $ | — | ||||||
SPRINT QUARTERLY INVESTOR UPDATE - FISCAL 4Q15 | 12 |
CONDENSED CONSOLIDATED STATEMENTS OF OPERATIONS (Unaudited)
(Millions, except per share data)
Quarter to Date | Year to Date | |||||||||||||||
3/31/16 | 12/31/15 | 3/31/15 | 3/31/16 | 3/31/15 | ||||||||||||
Net operating revenues | ||||||||||||||||
Service revenue | $ | 6,574 | $ | 6,683 | $ | 7,138 | $ | 27,174 | $ | 29,542 | ||||||
Equipment revenue | 1,497 | 1,424 | 1,144 | 5,006 | 4,990 | |||||||||||
Total net operating revenues | 8,071 | 8,107 | 8,282 | 32,180 | 34,532 | |||||||||||
Net operating expenses | ||||||||||||||||
Cost of services (exclusive of depreciation and amortization below) | 2,245 | 2,348 | 2,381 | 9,439 | 9,660 | |||||||||||
Cost of products (exclusive of depreciation and amortization below) | 1,551 | 1,589 | 1,827 | 5,795 | 9,309 | |||||||||||
Selling, general and administrative | 1,939 | 2,129 | 2,331 | 8,479 | 9,563 | |||||||||||
Depreciation | 1,592 | 1,549 | 1,091 | 5,794 | 3,797 | |||||||||||
Amortization | 300 | 316 | 363 | 1,294 | 1,552 | |||||||||||
Impairments (3) | — | — | — | — | 2,133 | |||||||||||
Other, net | 436 | 373 | (29 | ) | 1,069 | 413 | ||||||||||
Total net operating expenses | 8,063 | 8,304 | 7,964 | 31,870 | 36,427 | |||||||||||
Operating income (loss) | 8 | (197 | ) | 318 | 310 | (1,895 | ) | |||||||||
Interest expense | (552 | ) | (546 | ) | (523 | ) | (2,182 | ) | (2,051 | ) | ||||||
Other income, net | 5 | 4 | 8 | 18 | 27 | |||||||||||
Loss before income taxes | (539 | ) | (739 | ) | (197 | ) | (1,854 | ) | (3,919 | ) | ||||||
Income tax (expense) benefit | (15 | ) | (97 | ) | (27 | ) | (141 | ) | 574 | |||||||
Net loss | $ | (554 | ) | $ | (836 | ) | $ | (224 | ) | $ | (1,995 | ) | $ | (3,345 | ) | |
Basic and diluted net loss per common share | $ | (0.14 | ) | $ | (0.21 | ) | $ | (0.06 | ) | $ | (0.50 | ) | $ | (0.85 | ) | |
Weighted average common shares outstanding | 3,972 | 3,970 | 3,962 | 3,969 | 3,953 | |||||||||||
Effective tax rate | -2.8 | % | -13.1 | % | -13.7 | % | -7.6 | % | 14.6 | % | ||||||
NON-GAAP RECONCILIATION - NET LOSS TO ADJUSTED EBITDA* (Unaudited)
(Millions)
Quarter to Date | Year to Date | |||||||||||||||
3/31/16 | 12/31/15 | 3/31/15 | 3/31/16 | 3/31/15 | ||||||||||||
Net loss | $ | (554 | ) | $ | (836 | ) | $ | (224 | ) | $ | (1,995 | ) | $ | (3,345 | ) | |
Income tax expense (benefit) | 15 | 97 | 27 | 141 | (574 | ) | ||||||||||
Loss before income taxes | (539 | ) | (739 | ) | (197 | ) | (1,854 | ) | (3,919 | ) | ||||||
Other income, net | (5 | ) | (4 | ) | (8 | ) | (18 | ) | (27 | ) | ||||||
Interest expense | 552 | 546 | 523 | 2,182 | 2,051 | |||||||||||
Operating income (loss) | 8 | (197 | ) | 318 | 310 | (1,895 | ) | |||||||||
Depreciation | 1,592 | 1,549 | 1,091 | 5,794 | 3,797 | |||||||||||
Amortization | 300 | 316 | 363 | 1,294 | 1,552 | |||||||||||
EBITDA* (4) | 1,900 | 1,668 | 1,772 | 7,398 | 3,454 | |||||||||||
Impairments (3) | — | — | — | — | 2,133 | |||||||||||
Loss from asset dispositions and exchanges, net (5) | 81 | — | — | 166 | — | |||||||||||
Severance and exit costs (6) | 162 | 209 | (29 | ) | 409 | 304 | ||||||||||
Litigation (7) | 15 | 21 | — | 193 | 91 | |||||||||||
Partial pension settlement (8) | — | — | — | — | 59 | |||||||||||
Reduction in liability - U.S. Cellular asset acquisition (9) | — | — | — | (20 | ) | (41 | ) | |||||||||
Adjusted EBITDA* (4) | $ | 2,158 | $ | 1,898 | $ | 1,743 | $ | 8,146 | $ | 6,000 | ||||||
Adjusted EBITDA margin* | 32.8 | % | 28.4 | % | 24.4 | % | 30.0 | % | 20.3 | % | ||||||
Selected items: | ||||||||||||||||
Cash paid for capital expenditures - network and other | $ | 722 | $ | 994 | $ | 1,608 | $ | 4,680 | $ | 5,422 | ||||||
Cash paid for capital expenditures - leased devices | $ | 568 | $ | 607 | $ | 439 | $ | 2,292 | $ | 582 | ||||||
SPRINT QUARTERLY INVESTOR UPDATE - FISCAL 4Q15 | 13 |
WIRELESS STATEMENTS OF OPERATIONS (Unaudited)
(Millions)
Quarter to Date | Year to Date | |||||||||||||||
3/31/16 | 12/31/15 | 3/31/15 | 3/31/16 | 3/31/15 | ||||||||||||
Net operating revenues | ||||||||||||||||
Service revenue | ||||||||||||||||
Sprint platform (1): | ||||||||||||||||
Postpaid | $ | 4,793 | $ | 4,813 | $ | 5,049 | $ | 19,463 | $ | 21,181 | ||||||
Prepaid | 1,203 | 1,224 | 1,272 | 4,986 | 4,905 | |||||||||||
Wholesale, affiliate and other | 155 | 182 | 189 | 703 | 724 | |||||||||||
Total Sprint platform | 6,151 | 6,219 | 6,510 | 25,152 | 26,810 | |||||||||||
Total transactions (2) | 3 | 27 | 118 | 219 | 527 | |||||||||||
Total service revenue | 6,154 | 6,246 | 6,628 | 25,371 | 27,337 | |||||||||||
Equipment revenue | 1,497 | 1,424 | 1,144 | 5,006 | 4,990 | |||||||||||
Total net operating revenues | 7,651 | 7,670 | 7,772 | 30,377 | 32,327 | |||||||||||
Net operating expenses | ||||||||||||||||
Cost of services (exclusive of depreciation and amortization below) | 1,922 | 2,031 | 2,006 | 8,069 | 7,945 | |||||||||||
Cost of products (exclusive of depreciation and amortization below) | 1,551 | 1,589 | 1,827 | 5,795 | 9,309 | |||||||||||
Selling, general and administrative | 1,868 | 2,041 | 2,242 | 8,141 | 9,179 | |||||||||||
Depreciation | 1,541 | 1,496 | 1,044 | 5,593 | 3,560 | |||||||||||
Amortization | 300 | 316 | 362 | 1,294 | 1,549 | |||||||||||
Impairments (3) | — | — | — | — | 1,900 | |||||||||||
Other, net | 434 | 353 | (29 | ) | 1,045 | 349 | ||||||||||
Total net operating expenses | 7,616 | 7,826 | 7,452 | 29,937 | 33,791 | |||||||||||
Operating income (loss) | $ | 35 | $ | (156 | ) | $ | 320 | $ | 440 | $ | (1,464 | ) | ||||
WIRELESS NON-GAAP RECONCILIATION (Unaudited)
(Millions)
Quarter to Date | Year to Date | |||||||||||||||
3/31/16 | 12/31/15 | 3/31/15 | 3/31/16 | 3/31/15 | ||||||||||||
Operating income (loss) | $ | 35 | $ | (156 | ) | $ | 320 | $ | 440 | $ | (1,464 | ) | ||||
Impairments (3) | — | — | — | — | 1,900 | |||||||||||
Loss from asset dispositions and exchanges, net (5) | 81 | — | — | 166 | — | |||||||||||
Severance and exit costs (6) | 160 | 189 | (29 | ) | 385 | 263 | ||||||||||
Litigation (7) | 15 | 21 | — | 193 | 84 | |||||||||||
Partial pension settlement (8) | — | — | — | — | 43 | |||||||||||
Reduction in liability - U.S. Cellular asset acquisition (9) | — | — | — | (20 | ) | (41 | ) | |||||||||
Depreciation | 1,541 | 1,496 | 1,044 | 5,593 | 3,560 | |||||||||||
Amortization | 300 | 316 | 362 | 1,294 | 1,549 | |||||||||||
Adjusted EBITDA* (4) | $ | 2,132 | $ | 1,866 | $ | 1,697 | $ | 8,051 | $ | 5,894 | ||||||
Adjusted EBITDA margin* | 34.6 | % | 29.9 | % | 25.6 | % | 31.7 | % | 21.6 | % | ||||||
Selected items: | ||||||||||||||||
Cash paid for capital expenditures - network and other | $ | 577 | $ | 869 | $ | 1,518 | $ | 4,089 | $ | 4,860 | ||||||
Cash paid for capital expenditures - leased devices | $ | 568 | $ | 607 | $ | 439 | $ | 2,292 | $ | 582 | ||||||
SPRINT QUARTERLY INVESTOR UPDATE - FISCAL 4Q15 | 14 |
WIRELINE STATEMENTS OF OPERATIONS (Unaudited)
(Millions)
Quarter to Date | Year to Date | |||||||||||||||
3/31/16 | 12/31/15 | 3/31/15 | 3/31/16 | 3/31/15 | ||||||||||||
Net operating revenues | ||||||||||||||||
Voice | $ | 194 | $ | 201 | $ | 264 | $ | 840 | $ | 1,174 | ||||||
Data | 37 | 42 | 52 | 171 | 213 | |||||||||||
Internet | 316 | 317 | 335 | 1,284 | 1,353 | |||||||||||
Other | 15 | 21 | 17 | 87 | 74 | |||||||||||
Total net operating revenues | 562 | 581 | 668 | 2,382 | 2,814 | |||||||||||
Net operating expenses | ||||||||||||||||
Cost of services (exclusive of depreciation and amortization below) | 467 | 466 | 538 | 1,962 | 2,338 | |||||||||||
Selling, general and administrative | 74 | 82 | 90 | 328 | 363 | |||||||||||
Depreciation and amortization | 50 | 50 | 46 | 194 | 232 | |||||||||||
Impairments (3) | — | — | — | — | 233 | |||||||||||
Other, net | 3 | 20 | (2 | ) | 25 | 61 | ||||||||||
Total net operating expenses | 594 | 618 | 672 | 2,509 | 3,227 | |||||||||||
Operating loss | $ | (32 | ) | $ | (37 | ) | $ | (4 | ) | $ | (127 | ) | $ | (413 | ) | |
WIRELINE NON-GAAP RECONCILIATION (Unaudited)
(Millions)
Quarter to Date | Year to Date | |||||||||||||||
3/31/16 | 12/31/15 | 3/31/15 | 3/31/16 | 3/31/15 | ||||||||||||
Operating loss | $ | (32 | ) | $ | (37 | ) | $ | (4 | ) | $ | (127 | ) | $ | (413 | ) | |
Impairments (3) | — | — | — | — | 233 | |||||||||||
Severance and exit costs (6) | 3 | 20 | (2 | ) | 25 | 39 | ||||||||||
Litigation (7) | — | — | — | — | 6 | |||||||||||
Partial pension settlement (8) | — | — | — | — | 16 | |||||||||||
Depreciation and amortization | 50 | 50 | 46 | 194 | 232 | |||||||||||
Adjusted EBITDA* | $ | 21 | $ | 33 | $ | 40 | $ | 92 | $ | 113 | ||||||
Adjusted EBITDA margin* | 3.7 | % | 5.7 | % | 6.0 | % | 3.9 | % | 4.0 | % | ||||||
Selected items: | ||||||||||||||||
Cash paid for capital expenditures - network and other | $ | 74 | $ | 74 | $ | 70 | $ | 279 | $ | 275 | ||||||
SPRINT QUARTERLY INVESTOR UPDATE - FISCAL 4Q15 | 15 |
CONDENSED CONSOLIDATED CASH FLOW INFORMATION (Unaudited)**
(Millions)
Year to Date | ||||||
3/31/16 | 3/31/15 | |||||
Operating activities | ||||||
Net loss | $ | (1,995 | ) | $ | (3,345 | ) |
Impairments (3) | — | 2,133 | ||||
Depreciation and amortization | 7,088 | 5,349 | ||||
Provision for losses on accounts receivable | 455 | 892 | ||||
Share-based and long-term incentive compensation expense | 75 | 86 | ||||
Deferred income tax expense (benefit) | 123 | (609 | ) | |||
Amortization of long-term debt premiums, net | (316 | ) | (303 | ) | ||
Loss on disposal of property, plant and equipment | 487 | — | ||||
Other changes in assets and liabilities: | ||||||
Accounts and notes receivable | (1,663 | ) | (644 | ) | ||
Inventories and other current assets | (3,065 | ) | (1,573 | ) | ||
Deferred purchase price from sale of receivables | 2,478 | — | ||||
Accounts payable and other current liabilities | (574 | ) | 481 | |||
Non-current assets and liabilities, net | 111 | (199 | ) | |||
Other, net | 693 | 182 | ||||
Net cash provided by operating activities | 3,897 | 2,450 | ||||
Investing activities | ||||||
Capital expenditures - network and other | (4,680 | ) | (5,422 | ) | ||
Capital expenditures - leased devices | (2,292 | ) | (582 | ) | ||
Expenditures relating to FCC licenses | (98 | ) | (163 | ) | ||
Reimbursements relating to FCC licenses | — | 95 | ||||
Change in short-term investments, net | 166 | 1,054 | ||||
Proceeds from sales of assets and FCC licenses | 62 | 315 | ||||
Proceeds from sale-leaseback transaction | 1,136 | — | ||||
Other, net | (29 | ) | (11 | ) | ||
Net cash used in investing activities | (5,735 | ) | (4,714 | ) | ||
Financing activities | ||||||
Proceeds from debt and financings | 755 | 1,930 | ||||
Repayments of debt, financing and capital lease obligations | (899 | ) | (574 | ) | ||
Proceeds from sales of future lease receivables | 600 | — | ||||
Debt financing costs | (11 | ) | (87 | ) | ||
Proceeds from issuance of common stock, net | 10 | 35 | ||||
Other, net | 14 | — | ||||
Net cash provided by financing activities | 469 | 1,304 | ||||
Net decrease in cash and cash equivalents | (1,369 | ) | (960 | ) | ||
Cash and cash equivalents, beginning of period | 4,010 | 4,970 | ||||
Cash and cash equivalents, end of period | $ | 2,641 | $ | 4,010 | ||
RECONCILIATION TO CONSOLIDATED FREE CASH FLOW* (NON-GAAP) (Unaudited)
(Millions)
Quarter to Date | Year to Date | |||||||||||||||
3/31/16 | 12/31/15 | 3/31/15 | 3/31/16 | 3/31/15 | ||||||||||||
Net cash provided by operating activities | $ | 1,294 | $ | 806 | $ | 976 | $ | 3,897 | $ | 2,450 | ||||||
Capital expenditures - network and other | (722 | ) | (994 | ) | (1,608 | ) | (4,680 | ) | (5,422 | ) | ||||||
Capital expenditures - leased devices | (568 | ) | (607 | ) | (439 | ) | (2,292 | ) | (582 | ) | ||||||
Expenditures relating to FCC licenses, net | (23 | ) | (30 | ) | (42 | ) | (98 | ) | (68 | ) | ||||||
Proceeds from sales of assets and FCC licenses | 26 | 32 | 201 | 62 | 315 | |||||||||||
Other investing activities, net | (4 | ) | (4 | ) | (2 | ) | (29 | ) | (11 | ) | ||||||
Free cash flow* | $ | 3 | $ | (797 | ) | $ | (914 | ) | $ | (3,140 | ) | $ | (3,318 | ) | ||
Net proceeds from the sale-leaseback of devices and sales of future lease receivables | 600 | 1,136 | — | 1,736 | — | |||||||||||
Adjusted free cash flow** | $ | 603 | $ | 339 | $ | (914 | ) | $ | (1,404 | ) | $ | (3,318 | ) | |||
**Certain prior period amounts have been reclassified to conform to the current period presentation.
SPRINT QUARTERLY INVESTOR UPDATE - FISCAL 4Q15 | 16 |
CONDENSED CONSOLIDATED BALANCE SHEETS (Unaudited)
(Millions)
3/31/16 | 3/31/15 | |||||
ASSETS | ||||||
Current assets | ||||||
Cash and cash equivalents | $ | 2,641 | $ | 4,010 | ||
Short-term investments | — | 166 | ||||
Accounts and notes receivable, net | 1,099 | 2,290 | ||||
Device and accessory inventory | 1,173 | 1,359 | ||||
Deferred tax assets | — | 62 | ||||
Prepaid expenses and other current assets | 1,920 | 1,890 | ||||
Total current assets | 6,833 | 9,777 | ||||
Property, plant and equipment, net | 20,297 | 19,721 | ||||
Goodwill | 6,575 | 6,575 | ||||
FCC licenses and other | 40,073 | 39,987 | ||||
Definite-lived intangible assets, net | 4,469 | 5,893 | ||||
Other assets (10) | 728 | 888 | ||||
Total assets | $ | 78,975 | $ | 82,841 | ||
LIABILITIES AND STOCKHOLDERS' EQUITY | ||||||
Current liabilities | ||||||
Accounts payable | $ | 2,899 | $ | 4,347 | ||
Accrued expenses and other current liabilities | 4,374 | 5,293 | ||||
Current portion of long-term debt, financing and capital lease obligations | 4,690 | 1,300 | ||||
Total current liabilities | 11,963 | 10,940 | ||||
Long-term debt, financing and capital lease obligations (10) | 29,268 | 32,342 | ||||
Deferred tax liabilities | 13,959 | 13,898 | ||||
Other liabilities | 4,002 | 3,951 | ||||
Total liabilities | 59,192 | 61,131 | ||||
Stockholders' equity | ||||||
Common stock | 40 | 40 | ||||
Treasury shares, at cost | (3 | ) | (7 | ) | ||
Paid-in capital | 27,563 | 27,468 | ||||
Accumulated deficit | (7,378 | ) | (5,383 | ) | ||
Accumulated other comprehensive loss | (439 | ) | (408 | ) | ||
Total stockholders' equity | 19,783 | 21,710 | ||||
Total liabilities and stockholders' equity | $ | 78,975 | $ | 82,841 | ||
NET DEBT* (NON-GAAP) (Unaudited)
(Millions)
3/31/16 | 3/31/15 | |||||
Total debt | $ | 33,958 | $ | 33,642 | ||
Less: Cash and cash equivalents | (2,641 | ) | (4,010 | ) | ||
Less: Short-term investments | — | (166 | ) | |||
Net debt* | $ | 31,317 | $ | 29,466 | ||
SPRINT QUARTERLY INVESTOR UPDATE - FISCAL 4Q15 | 17 |
SCHEDULE OF DEBT (Unaudited)
(Millions)
3/31/16 | |||||
ISSUER | COUPON | MATURITY | PRINCIPAL | ||
Sprint Corporation | |||||
7.25% Notes due 2021 | 7.250% | 09/15/2021 | $ | 2,250 | |
7.875% Notes due 2023 | 7.875% | 09/15/2023 | 4,250 | ||
7.125% Notes due 2024 | 7.125% | 06/15/2024 | 2,500 | ||
7.625% Notes due 2025 | 7.625% | 02/15/2025 | 1,500 | ||
Sprint Corporation | 10,500 | ||||
Sprint Communications, Inc. | |||||
Export Development Canada Facility (Tranche 4) | 5.914% | 12/15/2017 | 250 | ||
Export Development Canada Facility (Tranche 3) | 4.164% | 12/17/2019 | 300 | ||
6% Senior notes due 2016 | 6.000% | 12/01/2016 | 2,000 | ||
9.125% Senior notes due 2017 | 9.125% | 03/01/2017 | 1,000 | ||
8.375% Senior notes due 2017 | 8.375% | 08/15/2017 | 1,300 | ||
9% Guaranteed notes due 2018 | 9.000% | 11/15/2018 | 3,000 | ||
7% Guaranteed notes due 2020 | 7.000% | 03/01/2020 | 1,000 | ||
7% Senior notes due 2020 | 7.000% | 08/15/2020 | 1,500 | ||
11.5% Senior notes due 2021 | 11.500% | 11/15/2021 | 1,000 | ||
9.25% Debentures due 2022 | 9.250% | 04/15/2022 | 200 | ||
6% Senior notes due 2022 | 6.000% | 11/15/2022 | 2,280 | ||
Sprint Communications, Inc. | 13,830 | ||||
Sprint Capital Corporation | |||||
6.9% Senior notes due 2019 | 6.900% | 05/01/2019 | 1,729 | ||
6.875% Senior notes due 2028 | 6.875% | 11/15/2028 | 2,475 | ||
8.75% Senior notes due 2032 | 8.750% | 03/15/2032 | 2,000 | ||
Sprint Capital Corporation | 6,204 | ||||
Clearwire Communications LLC | |||||
14.75% First-priority senior secured notes due 2016 | 14.750% | 12/01/2016 | 300 | ||
8.25% Exchangeable notes due 2040 | 8.250% | 12/01/2040 | 629 | ||
Clearwire Communications LLC | 929 | ||||
Secured equipment credit facilities | 2.020% - 2.745% | 2017 - 2021 | 805 | ||
Financing obligations | 2.016% - 6.098% | 2017 - 2021 | 828 | ||
Capital lease obligations and other | 2.348% - 10.517% | 2016 - 2023 | 265 | ||
Total principal | 33,361 | ||||
Net premiums and debt financing costs | 597 | ||||
Total debt | $ | 33,958 | |||
*This table excludes (i) our unsecured revolving bank credit facility, which will expire in 2018 and has no outstanding balance, (ii) $320 million in letters of credit outstanding under the unsecured revolving bank credit facility, (iii) all capital leases and other financing obligations, and (iv) net premiums and debt financing costs.
SPRINT QUARTERLY INVESTOR UPDATE - FISCAL 4Q15 | 18 |
NOTES TO THE FINANCIAL INFORMATION (Unaudited)
(1) | Sprint platform refers to the Sprint network that supports the wireless service we provide through our multiple brands. |
(2) | Postpaid and prepaid connections from transactions are defined as retail postpaid and prepaid connections acquired from Clearwire in July 2013 who had not deactivated or been recaptured on the Sprint platform. |
(3) | For the third quarter of fiscal year 2014, impairment losses were recorded after determining that the carrying value exceeded estimated fair value of both the Sprint trade name and Wireline asset group, which consists primarily of property, plant and equipment. |
(4) | As more of our customers elect to lease a device rather than purchasing one under our subsidized program, there is a positive impact to EBITDA* and Adjusted EBITDA* primarily due to the fact the cost of the device is not recorded as cost of products but rather is depreciated over the customer lease term. Under our device leasing program for the direct channel, devices are transferred from inventory to property and equipment and the cost of the leased device is recognized as depreciation expense over the customer lease term to an estimated residual value. The customer payments are recognized as revenue over the term of the lease. Under our subsidized program, the cash received from the customer for the device is recognized as equipment revenue at the point of sale and the cost of the device is recognized as cost of products. During the three and twelve-month periods ended March 31, 2016, we leased devices through our Sprint direct channels totaling approximately $600 million and $3.2 billion, respectively, which would have increased cost of products and reduced EBITDA* if they had been purchased under our subsidized program. Also, during the three and twelve-month periods ended March 31, 2016, the equipment revenue derived from customers electing to finance their devices through device leasing or installment billing programs in our direct channel was 58% and 51%, respectively. |
The impact to EBITDA* and Adjusted EBITDA* resulting from the sale of devices under our installment billing program is neutral except for the impact from the time value of money element related to the imputed interest on the installment receivable.
(5) | During the fourth and second quarters of fiscal year 2015, we recorded losses on dispositions of assets primarily related to network development costs that are no longer relevant as a result of changes in the Company's network plans. |
(6) | Severance and exit costs consist of lease exit costs primarily associated with tower and cell sites, access exit costs related to payments that will continue to be made under our backhaul access contracts for which we will no longer be receiving any economic benefit, and severance costs associated with reduction in our work force. |
(7) | For the fourth and third quarters of fiscal year 2015, litigation activity is a result of unfavorable developments in connection with pending litigation. |
(8) | The partial pension settlement resulted from amounts paid to eligible terminated participants who voluntarily elected to receive lump sum distributions as a result of an approved plan amendment to the Sprint Retirement Pension Plan by the Board of Directors in June 2014. |
(9) As a result of the U.S. Cellular asset acquisition, we recorded a liability related to network shut-down costs, which primarily consisted of lease exit costs, for which we agreed to reimburse U.S. Cellular. During the third quarter of fiscal year 2014, we identified favorable trends in actual costs and, as a result, reduced the liability resulting in a gain of approximately $41 million. During the first quarter of fiscal year 2015, we revised our estimate and, as a result, reduced the liability resulting in approximately $20 million of income.
(10) During the fourth quarter of fiscal year 2015, the Company elected to adopt accounting guidance which requires that debt issuance costs related to a recognized debt liability be presented in the balance sheet as a direct deduction from the carrying amount of that debt liability, consistent with debt discounts. Also addressed in this guidance is the presentation and subsequent measurement of debt issuance costs associated with line-of-credit arrangements. We elected to adopt the guidance early with full retrospective application. Debt issuance costs associated with our revolving credit facility remain in "Other assets" on the consolidated balance sheet and continue to be amortized over the term of the facility as allowed by the guidance. For the year ended March 31, 2015 debt issuance costs for all other debt totaling $189 million have been reclassified from "Other assets" to "Long-term debt, financing and capital lease obligations" on the consolidated balance sheet.
SPRINT QUARTERLY INVESTOR UPDATE - FISCAL 4Q15 | 19 |
*FINANCIAL MEASURES
Sprint provides financial measures determined in accordance with GAAP and adjusted GAAP (non-GAAP). The non-GAAP financial measures reflect industry conventions, or standard measures of liquidity, profitability or performance commonly used by the investment community for comparability purposes. These measurements should be considered in addition to, but not as a substitute for, financial information prepared in accordance with GAAP. We have defined below each of the non-GAAP measures we use, but these measures may not be synonymous to similar measurement terms used by other companies.
Sprint provides reconciliations of these non-GAAP measures in its financial reporting. Because Sprint does not predict special items that might occur in the future, and our forecasts are developed at a level of detail different than that used to prepare GAAP-based financial measures, Sprint does not provide reconciliations to GAAP of its forward-looking financial measures.
The measures used in this release include the following:
EBITDA is operating income/(loss) before depreciation and amortization. Adjusted EBITDA is EBITDA excluding severance, exit costs, and other special items. Adjusted EBITDA Margin represents Adjusted EBITDA divided by non-equipment net operating revenues for Wireless and Adjusted EBITDA divided by net operating revenues for Wireline. We believe that Adjusted EBITDA and Adjusted EBITDA Margin provide useful information to investors because they are an indicator of the strength and performance of our ongoing business operations. While depreciation and amortization are considered operating costs under GAAP, these expenses primarily represent non-cash current period costs associated with the use of long-lived tangible and definite-lived intangible assets. Adjusted EBITDA and Adjusted EBITDA Margin are calculations commonly used as a basis for investors, analysts and credit rating agencies to evaluate and compare the periodic and future operating performance and value of companies within the telecommunications industry.
Sprint Platform Postpaid ABPA is average billings per account and calculated by dividing postpaid service revenue earned from postpaid customers plus installment plan billings and lease revenue by the sum of the monthly average number of postpaid accounts during the period. We believe that ABPA provides useful information to investors, analysts and our management to evaluate average Sprint platform postpaid customer billings per account as it approximates the expected cash collections, including installment plan billings and lease revenue, per postpaid account each month.
Sprint Platform Postpaid Phone ABPU is average billings per postpaid phone user and calculated by dividing service revenue earned from postpaid phone customers plus installment plan billings and lease revenue by the sum of the monthly average number of postpaid phone connections during the period. We believe that ABPU provides useful information to investors, analysts and our management to evaluate average Sprint platform postpaid phone customer billings as it approximates the expected cash collections, including installment plan billings and lease revenue, per postpaid phone user each month.
Free Cash Flow is the cash provided by operating activities less the cash used in investing activities other than short-term investments, including changes in restricted cash, if any, and excluding the sale-leaseback of devices. Adjusted Free Cash Flow is Free Cash Flow plus the proceeds from the sale-leaseback of devices and sales of future lease receivables, net of repayments. We believe that Free Cash Flow and Adjusted Free Cash Flow provide useful information to investors, analysts and our management about the cash generated by our core operations and net proceeds obtained to fund certain leased devices, respectively, after interest and dividends, if any, and our ability to fund scheduled debt maturities and other financing activities, including discretionary refinancing and retirement of debt and purchase or sale of investments.
Net Debt is consolidated debt, including current maturities, less cash and cash equivalents, short-term investments and, if any, restricted cash. We believe that Net Debt provides useful information to investors, analysts and credit rating agencies about the capacity of the company to reduce the debt load and improve its capital structure.
SPRINT QUARTERLY INVESTOR UPDATE - FISCAL 4Q15 | 20 |
SAFE HARBOR
This release includes “forward-looking statements” within the meaning of the securities laws. The words “may,” “could,” “should,” “estimate,” “project,” “forecast,” “intend,” “expect,” “anticipate,” “believe,” “target,” “plan, “outlook,” “providing guidance,” and similar expressions are intended to identify information that is not historical in nature. All statements that address operating performance, events or developments that we expect or anticipate will occur in the future - including statements relating to our network, connections growth, and liquidity; and statements expressing general views about future operating results - are forward-looking statements. Forward-looking statements are estimates and projections reflecting management’s judgment based on currently available information and involve a number of risks and uncertainties that could cause actual results to differ materially from those suggested by the forward-looking statements. With respect to these forward-looking statements, management has made assumptions regarding, among other things, the development and deployment of new technologies and services; efficiencies and cost savings of new technologies and services; customer and network usage; connection growth and retention; service, speed, coverage and quality; availability of devices; availability of various financings, including any leasing transactions; the timing of various events and the economic environment. Sprint believes these forward-looking statements are reasonable; however, you should not place undue reliance on forward-looking statements, which are based on current expectations and speak only as of the date when made. Sprint undertakes no obligation to publicly update or revise any forward-looking statements, whether as a result of new information, future events or otherwise, except as required by law. In addition, forward-looking statements are subject to certain risks and uncertainties that could cause actual results to differ materially from our company's historical experience and our present expectations or projections. Factors that might cause such differences include, but are not limited to, those discussed in Sprint Corporation’s Annual Report on Form 10-K for the fiscal year ended March 31, 2015 and, when filed, its Annual Report on Form 10-K for the fiscal year ended March 31, 2016. You should understand that it is not possible to predict or identify all such factors. Consequently, you should not consider any such list to be a complete set of all potential risks or uncertainties.
About Sprint:
Sprint (NYSE: S) is a communications services company that creates more and better ways to connect its customers to the things they care about most. Sprint served more than 58.8 million connections as of March 31, 2016 and is widely recognized for developing, engineering and deploying innovative technologies, including the first wireless 4G service from a national carrier in the United States; leading no-contract brands including Virgin Mobile USA, Boost Mobile, and Assurance Wireless; instant national and international push-to-talk capabilities; and a global Tier 1 Internet backbone. Sprint has been named to the Dow Jones Sustainability Index (DJSI) North America for the past five years. You can learn more and visit Sprint at www.sprint.com or www.facebook.com/sprint and www.twitter.com/sprint.
###
SPRINT QUARTERLY INVESTOR UPDATE - FISCAL 4Q15 | 21 |