Attached files
| file | filename |
|---|---|
| 8-K - 8-K - Match Group Holdings II, LLC | a16-10315_28k.htm |
| EX-99.1 - EX-99.1 - Match Group Holdings II, LLC | a16-10315_2ex99d1.htm |
Exhibit 99.2
Q1 2016 Investor Presentation

Safe Harbor Disclosure and Definitions 2 This presentation contains forward-looking statements. The use of words such as "anticipates," "estimates," "expects," "plans" and "believes," among others, generally identify forward-looking statements. These statements may include, among others, statements relating to: Match Group’s future financial performance, Match Group’s business prospects and strategy, anticipated trends and other similar matters. These forward-looking statements are based on management’s current expectations and assumptions about future events, which are inherently subject to uncertainties, risks and changes in circumstances that are difficult to predict. Actual results could differ materially from those contained in these forward-looking statements for a variety of reasons, including, among others: competition, our ability to maintain user rates on our higher monetizing dating products, our ability to attract users to our dating products through cost-effective marketing and related efforts, foreign currency exchange rate fluctuations, our ability to distribute our dating products through third parties and offset related fees, the integrity and scalability of our systems and infrastructure (and those of third parties) and our ability to adapt ours to changes in a timely and cost-effective manner, our ability to protect our systems from cyberattacks and to protect personal and confidential user information, risks relating to certain of our international operations and acquisitions and certain risks relating to our relationship with IAC/InterActiveCorp, among other risks. Certain of these and other risks and uncertainties are discussed in Match Group’s filings with the Securities and Exchange Commission. Other unknown or unpredictable factors that could also adversely affect our business, financial condition and results of operations may arise from time to time. In light of these risks and uncertainties, these forward-looking statements may not prove to be accurate. Accordingly, you should not place undue reliance on these forward-looking statements, which only reflect the views of Match Group management as of the date of this presentation. Match Group does not undertake to update these forward-looking statements. This presentation includes certain non-GAAP financial measures in addition to financials presented in accordance with U.S. GAAP. These non-GAAP financial measures are in addition to, and not a substitute for or superior to, measures of financial performance prepared in accordance with U.S. GAAP. See the Appendix for a reconciliation of the non-GAAP financial measures to their most comparable GAAP measure. This presentation contains statistical data that we obtained from third party publications, surveys and reports. Although we have not independently verified the accuracy or completeness of the data contained in these industry publications, surveys and reports, we believe the publications, surveys and reports are generally reliable, although such information is inherently subject to uncertainties and imprecise. "MAU" or "monthly active users,’’ means users who logged in through our mobile or web applications in the last 28 days as of the date of measurement (reported MAU is the sum total of MAUs of each of our individual brands, and users active on multiple brands are counted in the MAU of each brand). “Average PMC” is calculated by summing the number of paid members, or paid member count (‘‘PMC’’), at the end of each day in the relevant measurement period and dividing it by the number of calendar days in that period. Unless otherwise noted, PMC refers to Average PMC in this presentation. ‘‘ARPPU’’ or Average Revenue per Paying User, is Direct Revenue in the relevant measurement period divided by the Average PMC in such period divided by the number of calendar days in such period. Direct Revenue is revenue that is directly received from an end user of our products. "North America" or "NA" as used in this presentation refers to the United States and Canada.
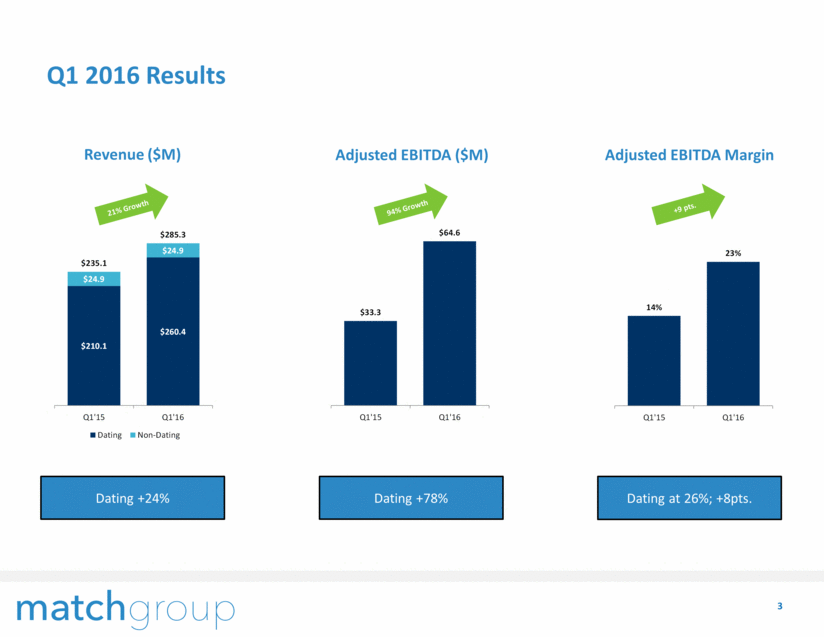
Q1 2016 Results 3 Dating +78% Adjusted EBITDA ($M) 94% Growth Adjusted EBITDA Margin +9 pts. Dating at 26%; +8pts. Revenue ($M) 21% Growth Dating +24% 14% 23% Q1'15 Q1'16 $33.3 $64.6 Q1'15 Q1'16 $210.1 $260.4 $24.9 $24.9 $235.1 $285.3 Q1'15 Q1'16 Dating Non-Dating
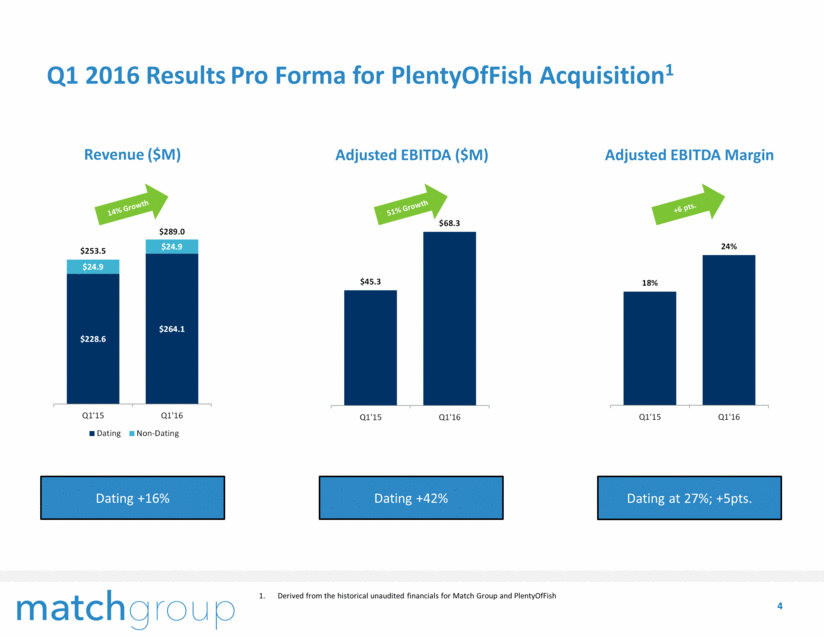
Q1 2016 Results Pro Forma for PlentyOfFish Acquisition1 4 Dating +42% Adjusted EBITDA ($M) 51% Growth Adjusted EBITDA Margin +6 pts. Dating at 27%; +5pts. Revenue ($M) 14% Growth Dating +16% Derived from the historical unaudited financials for Match Group and PlentyOfFish 18% 24% Q1'15 Q1'16 $45.3 $68.3 Q1'15 Q1'16 $228.6 $264.1 $24.9 $24.9 $253.5 $289.0 Q1'15 Q1'16 Dating Non-Dating
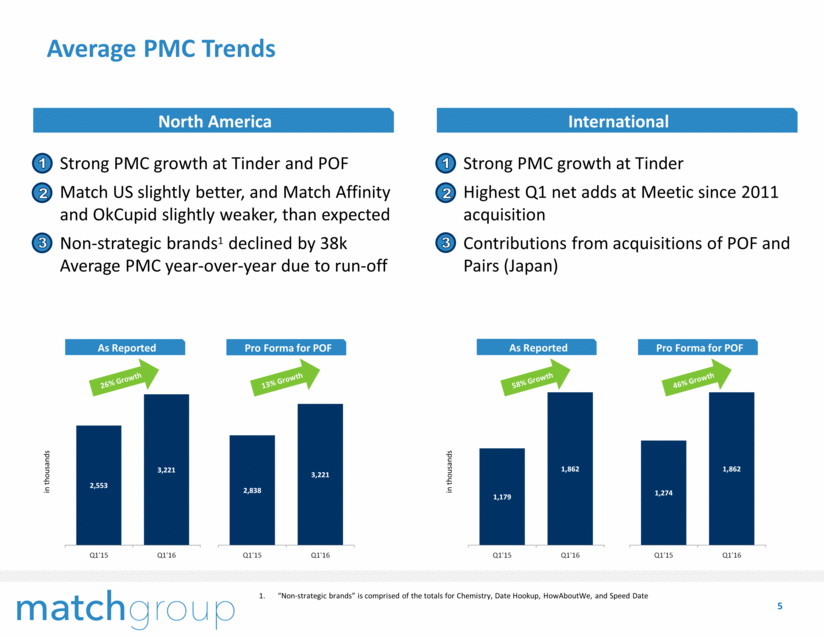
Average PMC Trends 5 “Non-strategic brands” is comprised of the totals for Chemistry, Date Hookup, HowAboutWe, and Speed Date Strong PMC growth at Tinder and POF Match US slightly better, and Match Affinity and OkCupid slightly weaker, than expected Non-strategic brands1 declined by 38k Average PMC year-over-year due to run-off 1 2 3 North America Strong PMC growth at Tinder Highest Q1 net adds at Meetic since 2011 acquisition Contributions from acquisitions of POF and Pairs (Japan) 1 2 3 International 26% Growth As Reported 13% Growth Pro Forma for POF 58% Growth As Reported 46% Growth Pro Forma for POF in thousands in thousands
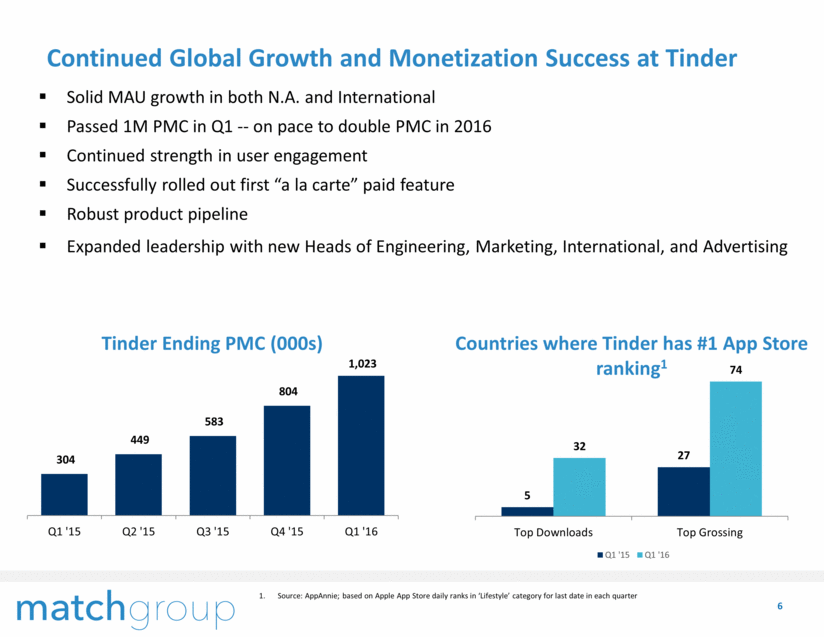
Continued Global Growth and Monetization Success at Tinder 6 Solid MAU growth in both N.A. and International Passed 1M PMC in Q1 -- on pace to double PMC in 2016 Continued strength in user engagement Successfully rolled out first “a la carte” paid feature Robust product pipeline Expanded leadership with new Heads of Engineering, Marketing, International, and Advertising Tinder Ending PMC (000s) Countries where Tinder has #1 App Store ranking1 Source: AppAnnie; based on Apple App Store daily ranks in ‘Lifestyle’ category for last date in each quarter 5 27 32 74 Top Downloads Top Grossing Q1 '15 Q1 '16 304 449 583 804 1,023 Q1 '15 Q2 '15 Q3 '15 Q4 '15 Q1 '16
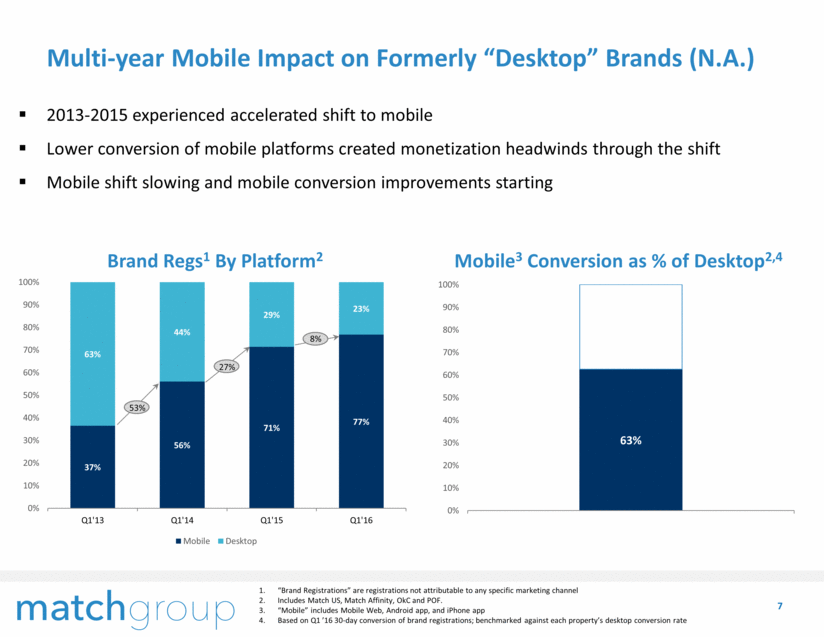
Multi-year Mobile Impact on Formerly “Desktop” Brands (N.A.) 7 “Brand Registrations” are registrations not attributable to any specific marketing channel Includes Match US, Match Affinity, OkC and POF. “Mobile” includes Mobile Web, Android app, and iPhone app Based on Q1 ’16 30-day conversion of brand registrations; benchmarked against each property’s desktop conversion rate 2013-2015 experienced accelerated shift to mobile Lower conversion of mobile platforms created monetization headwinds through the shift Mobile shift slowing and mobile conversion improvements starting Brand Regs1 By Platform2 Mobile3 Conversion as % of Desktop2,4 53% 27% 8% 37% 56% 71% 77% 63% 44% 29% 23% 0% 10% 20% 30% 40% 50% 60% 70% 80% 90% 100% Q1'13 Q1'14 Q1'15 Q1'16 Mobile Desktop 63% 0% 10% 20% 30% 40% 50% 60% 70% 80% 90% 100% NA Brands
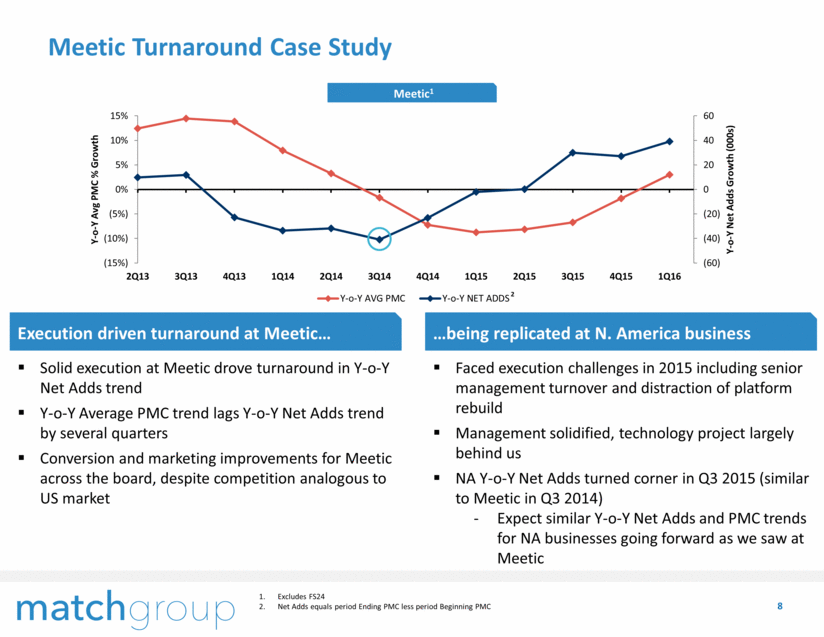
Meetic Turnaround Case Study 8 being replicated at N. America business Faced execution challenges in 2015 including senior management turnover and distraction of platform rebuild Management solidified, technology project largely behind us NA Y-o-Y Net Adds turned corner in Q3 2015 (similar to Meetic in Q3 2014) Expect similar Y-o-Y Net Adds and PMC trends for NA businesses going forward as we saw at Meetic Excludes FS24 Net Adds equals period Ending PMC less period Beginning PMC Execution driven turnaround at Meetic Solid execution at Meetic drove turnaround in Y-o-Y Net Adds trend Y-o-Y Average PMC trend lags Y-o-Y Net Adds trend by several quarters Conversion and marketing improvements for Meetic across the board, despite competition analogous to US market Meetic1 2 (60) (40) (20) 0 20 40 60 (15%) (10%) (5%) 0% 5% 10% 15% 2Q13 3Q13 4Q13 1Q14 2Q14 3Q14 4Q14 1Q15 2Q15 3Q15 4Q15 1Q16 Y - o - Y Net Adds Growth (000s) Y - o - Y Avg PMC % Growth Y-o-Y AVG PMC Y-o-Y NET ADDS
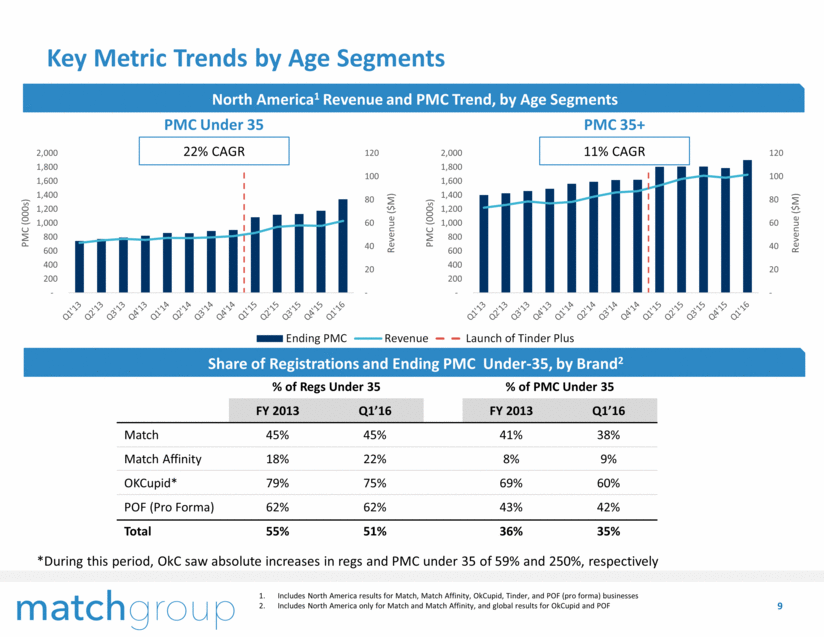
% of Regs Under 35 % of PMC Under 35 FY 2013 Q1’16 FY 2013 Q1’16 Match 45% 45% 41% 38% Match Affinity 18% 22% 8% 9% OKCupid* 79% 75% 69% 60% POF (Pro Forma) 62% 62% 43% 42% Total 55% 51% 36% 35% Key Metric Trends by Age Segments 9 Includes North America results for Match, Match Affinity, OkCupid, Tinder, and POF (pro forma) businesses Includes North America only for Match and Match Affinity, and global results for OkCupid and POF PMC Under 35 PMC 35+ 11% CAGR 22% CAGR Share of Registrations and Ending PMC Under-35, by Brand2 North America1 Revenue and PMC Trend, by Age Segments *During this period, OkC saw absolute increases in regs and PMC under 35 of 59% and 250%, respectively Ending PMC Revenue Launch of Tinder Plus - 20 40 60 80 100 120 - 200 400 600 800 1,000 1,200 1,400 1,600 1,800 2,000 Revenue ($M) PMC (000s) - 20 40 60 80 100 120 - 200 400 600 800 1,000 1,200 1,400 1,600 1,800 2,000 Revenue ($M) PMC (000s)
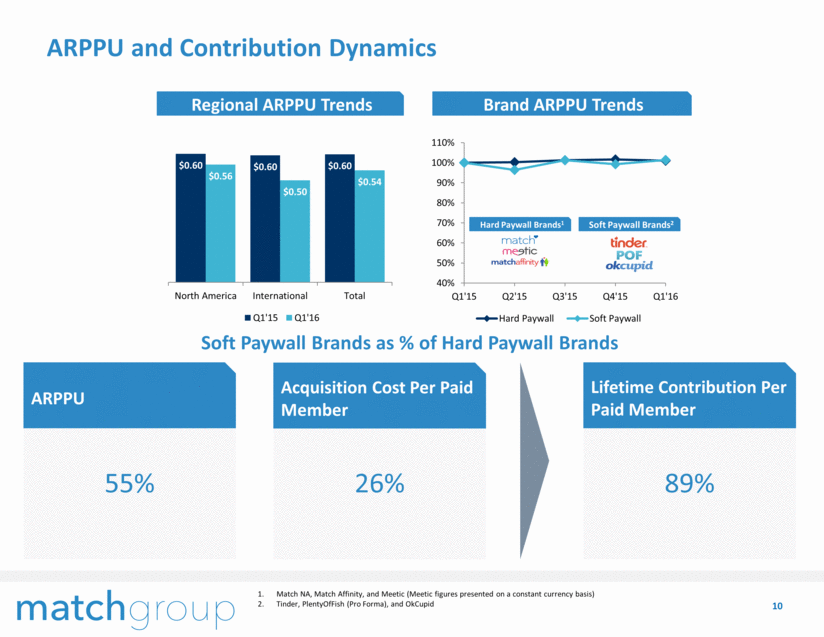
Regional ARPPU Trends Brand ARPPU Trends ARPPU 55% Acquisition Cost Per Paid Member 26% Lifetime Contribution Per Paid Member 89% ARPPU and Contribution Dynamics 10 Match NA, Match Affinity, and Meetic (Meetic figures presented on a constant currency basis) Tinder, PlentyOfFish (Pro Forma), and OkCupid Soft Paywall Brands as % of Hard Paywall Brands Hard Paywall Brands1 Soft Paywall Brands2 $0.60 $0.60 $0.60 $0.56 $0.50 $0.54 North America International Total Q1'15 Q1'16 40% 50% 60% 70% 80% 90% 100% 110% Q1'15 Q2'15 Q3'15 Q4'15 Q1'16 Hard Paywall Soft Paywall
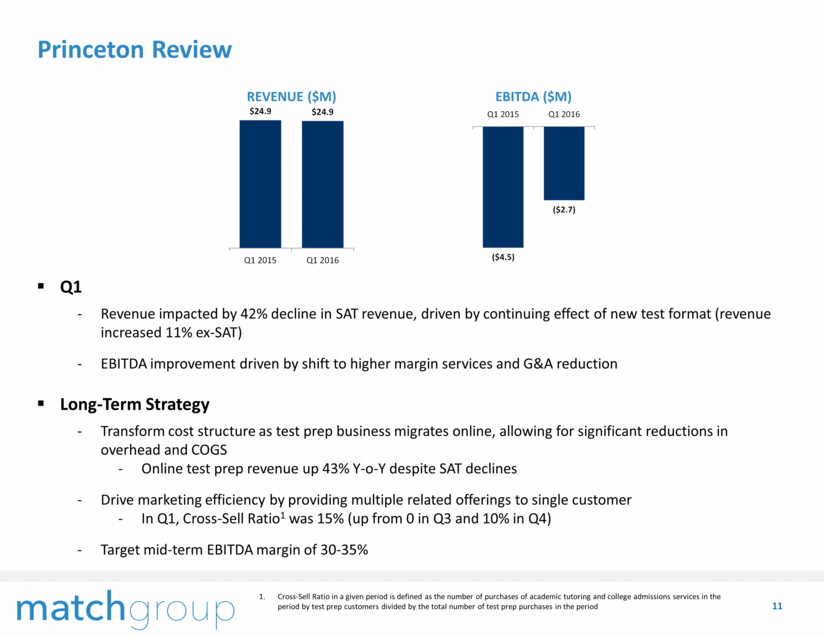
Q1 Revenue impacted by 42% decline in SAT revenue, driven by continuing effect of new test format (revenue increased 11% ex-SAT) EBITDA improvement driven by shift to higher margin services and G&A reduction Long-Term Strategy Transform cost structure as test prep business migrates online, allowing for significant reductions in overhead and COGS Online test prep revenue up 43% Y-o-Y despite SAT declines Drive marketing efficiency by providing multiple related offerings to single customer In Q1, Cross-Sell Ratio1 was 15% (up from 0 in Q3 and 10% in Q4) Target mid-term EBITDA margin of 30-35% Princeton Review 11 EBITDA ($M) REVENUE ($M) Cross-Sell Ratio in a given period is defined as the number of purchases of academic tutoring and college admissions services in the period by test prep customers divided by the total number of test prep purchases in the period
Outlook 12 Forecast Updates Slower Indirect Revenue ramp, primarily at Tinder, as new ad leadership resets schedule for roll out of new formats, tech, targeting and analytics Higher headcount investment at Tinder Stronger Direct Revenue performance driven by Tinder a la carte and Match US performance Indefinite postponement of Match Affinity tech migration Q2 2016 4-5% sequential revenue growth in Dating Low to mid 30s% EBITDA margin in Dating Non Dating expected to have flattish sequential revenue growth and slight EBITDA loss Full Year 2016 Overall Adjusted EBITDA of $410-425 million Total Dating Revenue of $1.10-1.14 billion Single digit Non Dating revenue growth Non Dating modestly profitable for full year Other Capex slightly higher at 3-4% of revenue due to a data center move Cost related to the consolidation and streamlining of technology systems is expected to be approximately $2 million for Q2 and less than $1 million thereafter for the rest of the 2016 Acquisition-Related Deferred Revenue Write-downs are expected to be approximately $2 million for the rest of 2016, with the majority of the remaining impact coming in Q2 Stock-based compensation expense expected to be $50-55 million for 2016 and D&A expected to be $60-65 million
13 Appendix
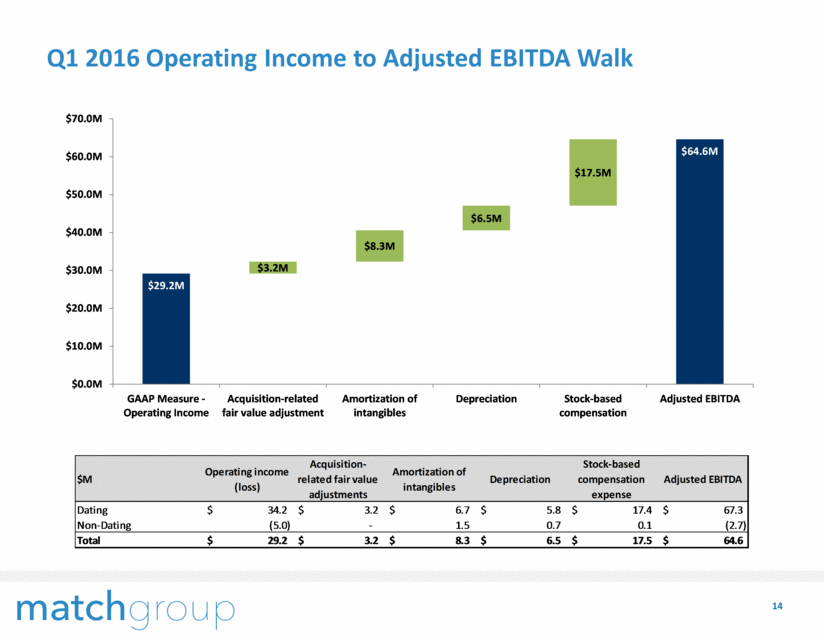
14 Q1 2016 Operating Income to Adjusted EBITDA Walk $29.2M $64.6M $3.2M $8.3M $6.5M $17.5M $0.0M $10.0M $20.0M $30.0M $40.0M $50.0M $60.0M $70.0M GAAP Measure - Operating Income Acquisition-related fair value adjustment Amortization of intangibles Depreciation Stock-based compensation Adjusted EBITDA $M Operating income (loss) Acquisition- related fair value adjustments Amortization of intangibles Depreciation Stock-based compensation expense Adjusted EBITDA Dating 34.2 $ 3.2 $ 6.7 $ 5.8 $ 17.4 $ 67.3 $ Non-Dating (5.0) - 1.5 0.7 0.1 (2.7) Total 29.2 $ 3.2 $ 8.3 $ 6.5 $ 17.5 $ 64.6 $