Attached files
| file | filename |
|---|---|
| 8-K - 8-K - AMEDISYS INC | d183148d8k.htm |
| EX-99.1 - EX-99.1 - AMEDISYS INC | d183148dex991.htm |
Amedisys Earnings Call Supplemental Materials May 4, 2016 Exhibit 99.2
Forward-looking Statements This presentation may include forward-looking statements as defined by the Private Securities Litigation Reform Act of 1995. These forward-looking statements are based upon current expectations and assumptions about our business that are subject to a variety of risks and uncertainties that could cause actual results to differ materially from those described in this presentation. You should not rely on forward-looking statements as a prediction of future events. Additional information regarding factors that could cause actual results to differ materially from those discussed in any forward-looking statements are described in reports and registration statements we file with the SEC, including our Annual Report on Form 10-K and subsequent Quarterly Reports on Form 10-Q and Current Reports on Form 8-K, copies of which are available on the Amedisys internet website http://www.amedisys.com or by contacting the Amedisys Investor Relations department at (225) 292-2031. We disclaim any obligation to update any forward-looking statements or any changes in events, conditions or circumstances upon which any forward-looking statement may be based except as required by law. www.amedisys.com NASDAQ: AMED We encourage everyone to visit the Investors Section of our website at www.amedisys.com, where we have posted additional important information such as press releases, profiles concerning our business and clinical operations and control processes, and SEC filings. We intend to use our website to expedite public access to time-critical information regarding the Company in advance of or in lieu of distributing a press release or a filing with the SEC disclosing the same information.
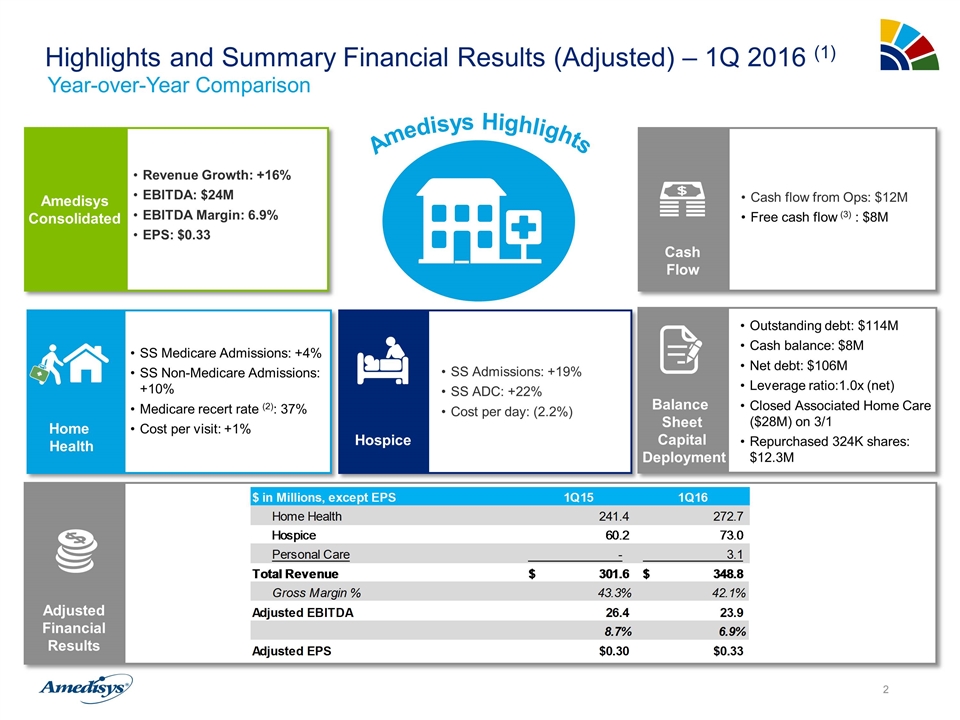
Highlights and Summary Financial Results (Adjusted) – 1Q 2016 (1) Amedisys Consolidated Revenue Growth: +16% EBITDA: $24M EBITDA Margin: 6.9% EPS: $0.33 Amedisys Highlights SS Medicare Admissions: +4% SS Non-Medicare Admissions: +10% Medicare recert rate (2): 37% Cost per visit: +1% Home Health Outstanding debt: $114M Cash balance: $8M Net debt: $106M Leverage ratio:1.0x (net) Closed Associated Home Care ($28M) on 3/1 Repurchased 324K shares: $12.3M Balance Sheet Capital Deployment SS Admissions: +19% SS ADC: +22% Cost per day: (2.2%) Hospice Cash flow from Ops: $12M Free cash flow (3) : $8M Cash Flow Year-over-Year Comparison Adjusted Financial Results
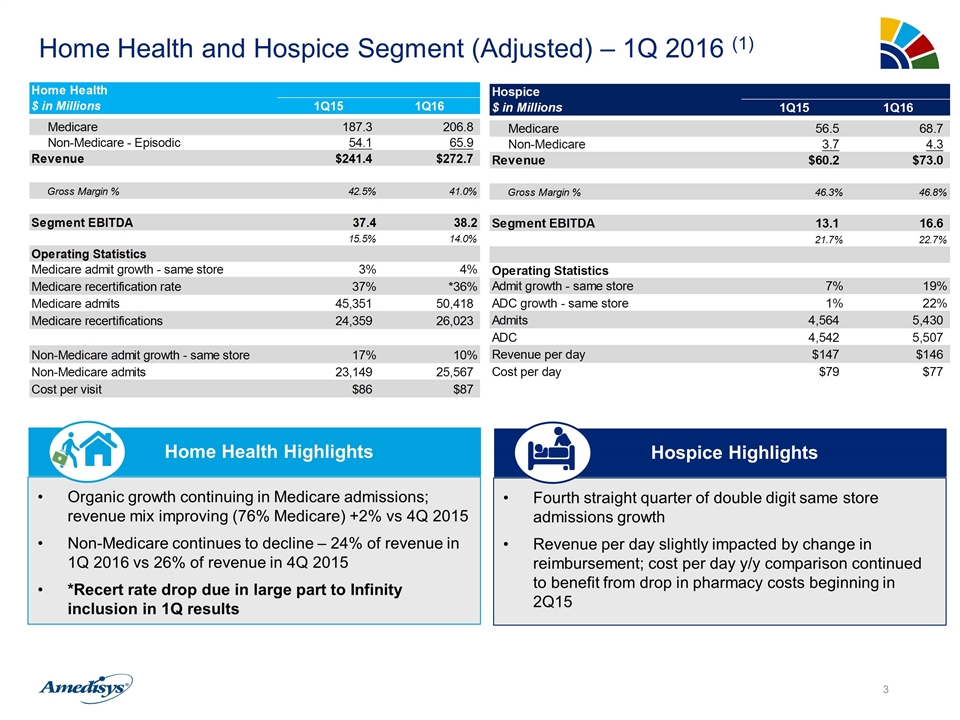
Home Health and Hospice Segment (Adjusted) – 1Q 2016 (1) Organic growth continuing in Medicare admissions; revenue mix improving (76% Medicare) +2% vs 4Q 2015 Non-Medicare continues to decline – 24% of revenue in 1Q 2016 vs 26% of revenue in 4Q 2015 *Recert rate drop due in large part to Infinity inclusion in 1Q results Home Health Highlights Fourth straight quarter of double digit same store admissions growth Revenue per day slightly impacted by change in reimbursement; cost per day y/y comparison continued to benefit from drop in pharmacy costs beginning in 2Q15 Hospice Highlights
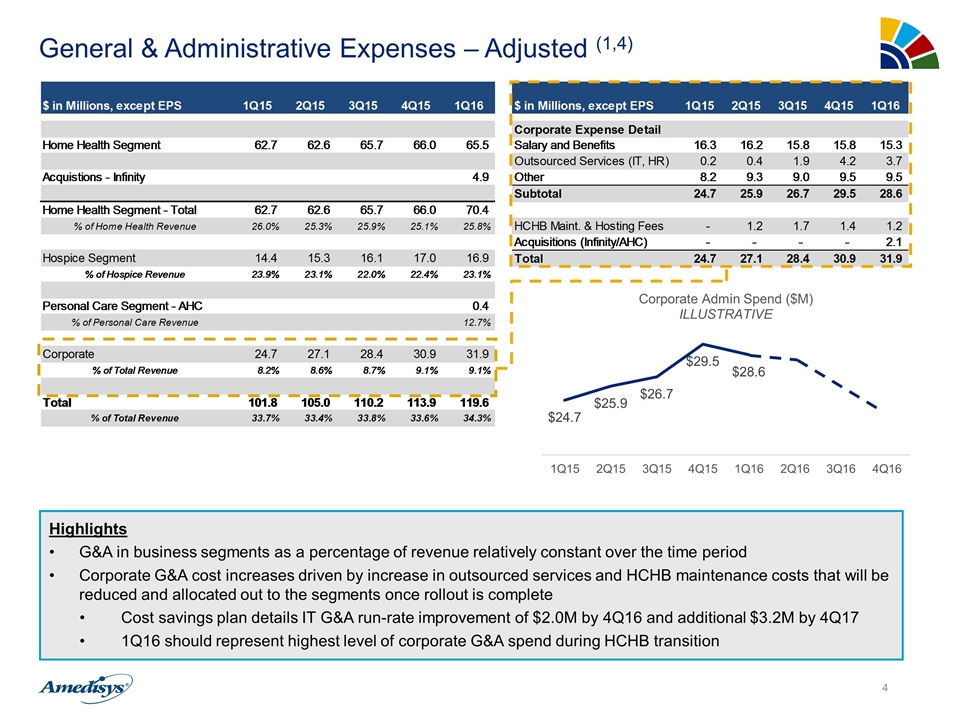
General & Administrative Expenses – Adjusted (1,4) Highlights G&A in business segments as a percentage of revenue relatively constant over the time period Corporate G&A cost increases driven by increase in outsourced services and HCHB maintenance costs that will be reduced and allocated out to the segments once rollout is complete Cost savings plan details IT G&A run-rate improvement of $2.0M by 4Q16 and additional $3.2M by 4Q17 1Q16 should represent highest level of corporate G&A spend during HCHB transition 4
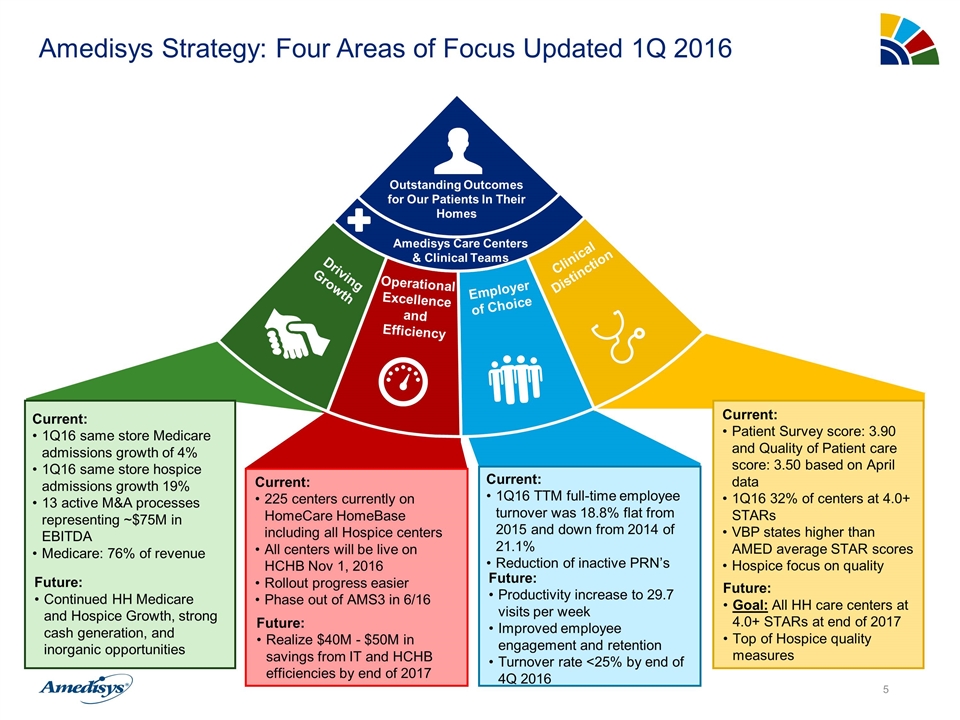
Amedisys Strategy: Four Areas of Focus Updated 1Q 2016 Clinicians Patient Health Clinicians Patient Health Clinical Distinction Employer of Choice Operational Excellence and Efficiency Driving Growth Outstanding Outcomes for Our Patients In Their Homes Amedisys Care Centers & Clinical Teams Current: 225 centers currently on HomeCare HomeBase including all Hospice centers All centers will be live on HCHB Nov 1, 2016 Rollout progress easier Phase out of AMS3 in 6/16 Future: Realize $40M - $50M in savings from IT and HCHB efficiencies by end of 2017 Current: Patient Survey score: 3.90 and Quality of Patient care score: 3.50 based on April data 1Q16 32% of centers at 4.0+ STARs VBP states higher than AMED average STAR scores Hospice focus on quality Future: Goal: All HH care centers at 4.0+ STARs at end of 2017 Top of Hospice quality measures Current: 1Q16 same store Medicare admissions growth of 4% 1Q16 same store hospice admissions growth 19% 13 active M&A processes representing ~$75M in EBITDA Medicare: 76% of revenue Future: Continued HH Medicare and Hospice Growth, strong cash generation, and inorganic opportunities Current: 1Q16 TTM full-time employee turnover was 18.8% flat from 2015 and down from 2014 of 21.1% Reduction of inactive PRN’s Future: Productivity increase to 29.7 visits per week Improved employee engagement and retention Turnover rate <25% by end of 4Q 2016
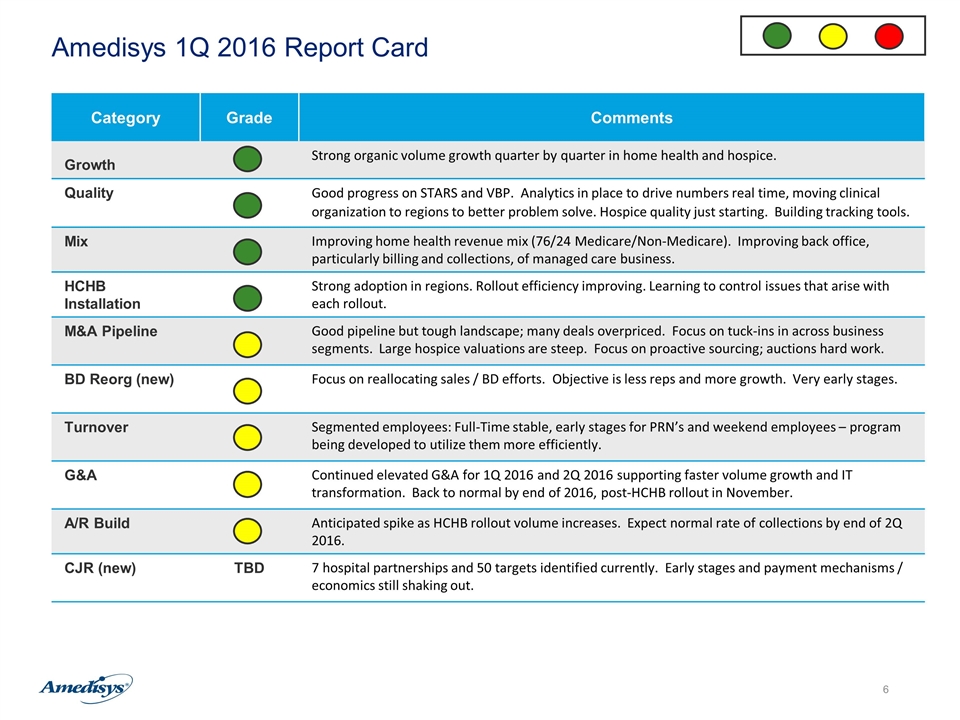
Amedisys 1Q 2016 Report Card Category Grade Comments Growth Strong organic volume growth quarter by quarter in home health and hospice. Quality Good progress on STARS and VBP. Analytics in place to drive numbers real time, moving clinical organization to regions to better problem solve. Hospice quality just starting. Building tracking tools. Mix Improving home health revenue mix (76/24 Medicare/Non-Medicare). Improving back office, particularly billing and collections, of managed care business. HCHB Installation Strong adoption in regions. Rollout efficiency improving. Learning to control issues that arise with each rollout. M&A Pipeline Good pipeline but tough landscape; many deals overpriced. Focus on tuck-ins in across business segments. Large hospice valuations are steep. Focus on proactive sourcing; auctions hard work. BD Reorg (new) Focus on reallocating sales / BD efforts. Objective is less reps and more growth. Very early stages. Turnover Segmented employees: Full-Time stable, early stages for PRN’s and weekend employees – program being developed to utilize them more efficiently. G&A Continued elevated G&A for 1Q 2016 and 2Q 2016 supporting faster volume growth and IT transformation. Back to normal by end of 2016, post-HCHB rollout in November. A/R Build Anticipated spike as HCHB rollout volume increases. Expect normal rate of collections by end of 2Q 2016. CJR (new) TBD 7 hospital partnerships and 50 targets identified currently. Early stages and payment mechanisms / economics still shaking out.
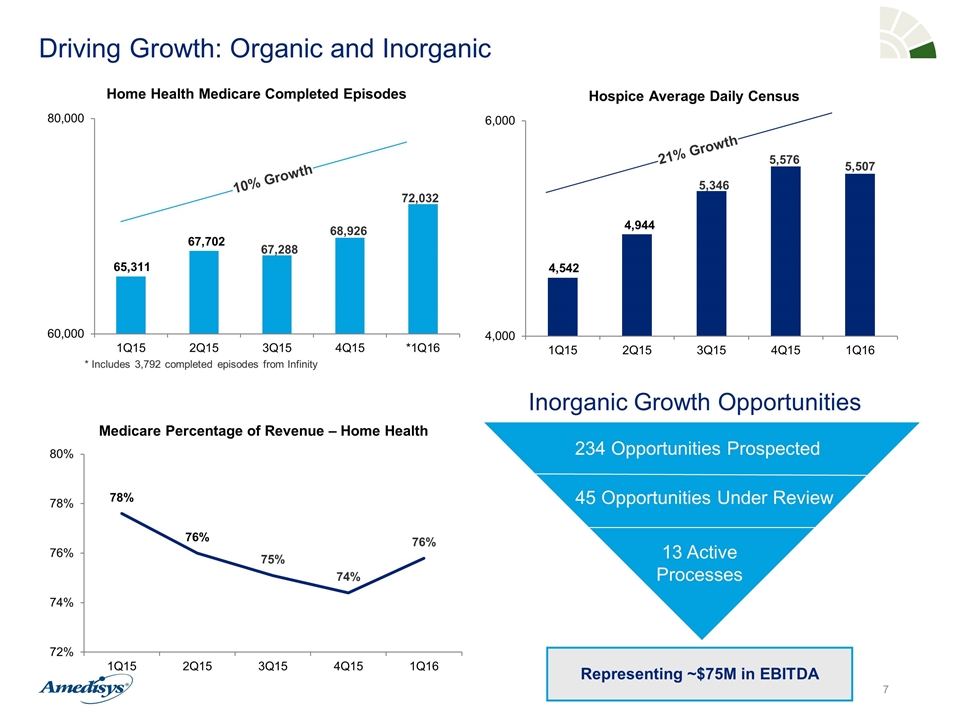
Driving Growth: Organic and Inorganic 234 Opportunities Prospected 45 Opportunities Under Review 13 Active Processes Inorganic Growth Opportunities Representing ~$75M in EBITDA * Includes 3,792 completed episodes from Infinity 10% Growth 21% Growth
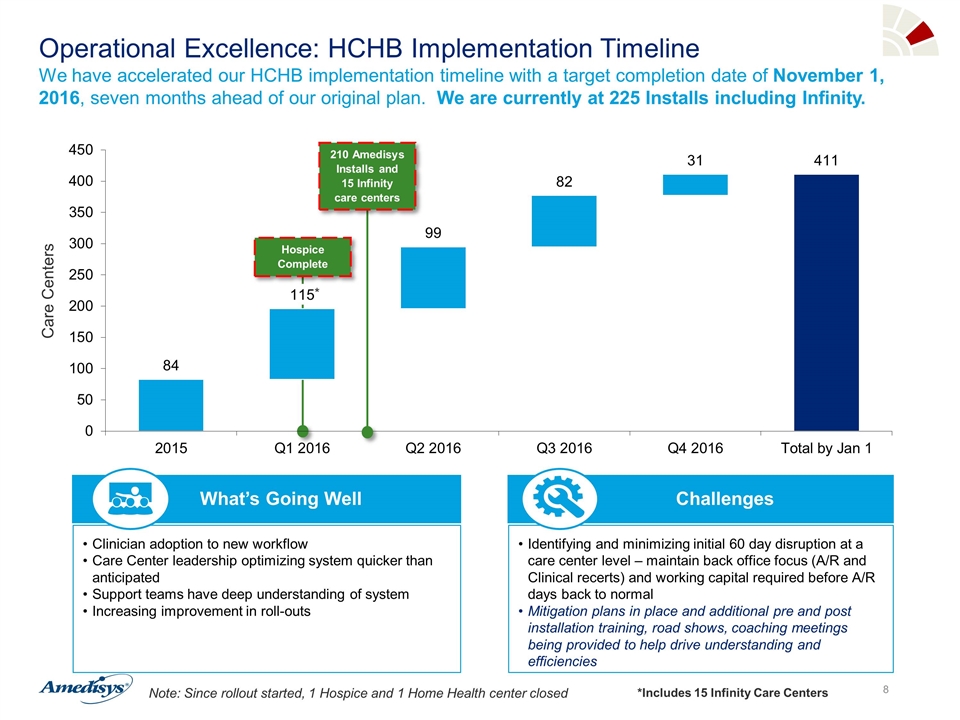
Operational Excellence: HCHB Implementation Timeline We have accelerated our HCHB implementation timeline with a target completion date of November 1, 2016, seven months ahead of our original plan. We are currently at 225 Installs including Infinity. Care Centers 210 Amedisys Installs and 15 Infinity care centers * Note: Since rollout started, 1 Hospice and 1 Home Health center closed Hospice Complete Clinician adoption to new workflow Care Center leadership optimizing system quicker than anticipated Support teams have deep understanding of system Increasing improvement in roll-outs What’s Going Well Identifying and minimizing initial 60 day disruption at a care center level – maintain back office focus (A/R and Clinical recerts) and working capital required before A/R days back to normal Mitigation plans in place and additional pre and post installation training, road shows, coaching meetings being provided to help drive understanding and efficiencies Challenges *Includes 15 Infinity Care Centers
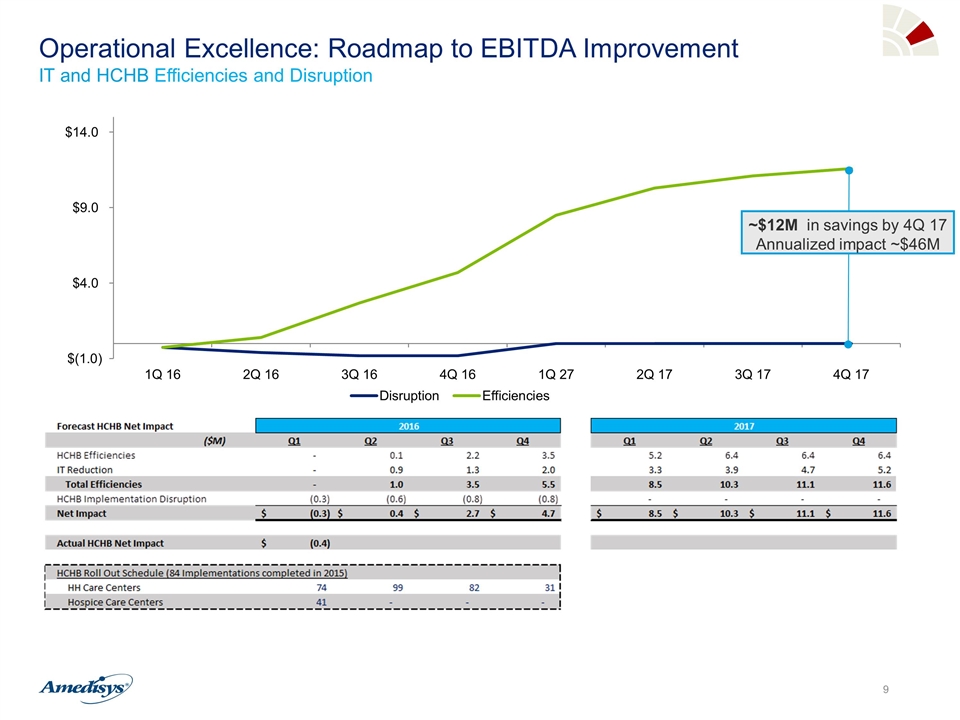
Operational Excellence: Roadmap to EBITDA Improvement IT and HCHB Efficiencies and Disruption ~$12M in savings by 4Q 17 Annualized impact ~$46M
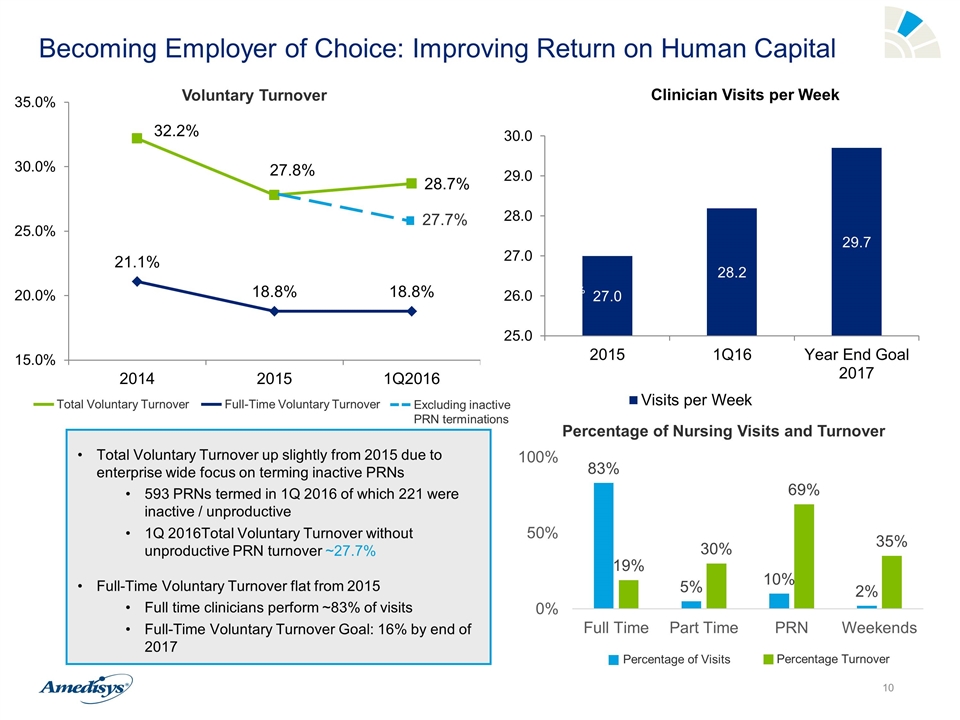
Becoming Employer of Choice: Improving Return on Human Capital Total Voluntary Turnover up slightly from 2015 due to enterprise wide focus on terming inactive PRNs 593 PRNs termed in 1Q 2016 of which 221 were inactive / unproductive 1Q 2016Total Voluntary Turnover without unproductive PRN turnover ~27.7% Full-Time Voluntary Turnover flat from 2015 Full time clinicians perform ~83% of visits Full-Time Voluntary Turnover Goal: 16% by end of 2017 15% 14% 11% 10% 12% 12% 23% 25% 23% 56% 50% Voluntary Turnover Total Voluntary Turnover Full-Time Voluntary Turnover 27.7% Excluding inactive PRN terminations Percentage of Visits Percentage Turnover 10
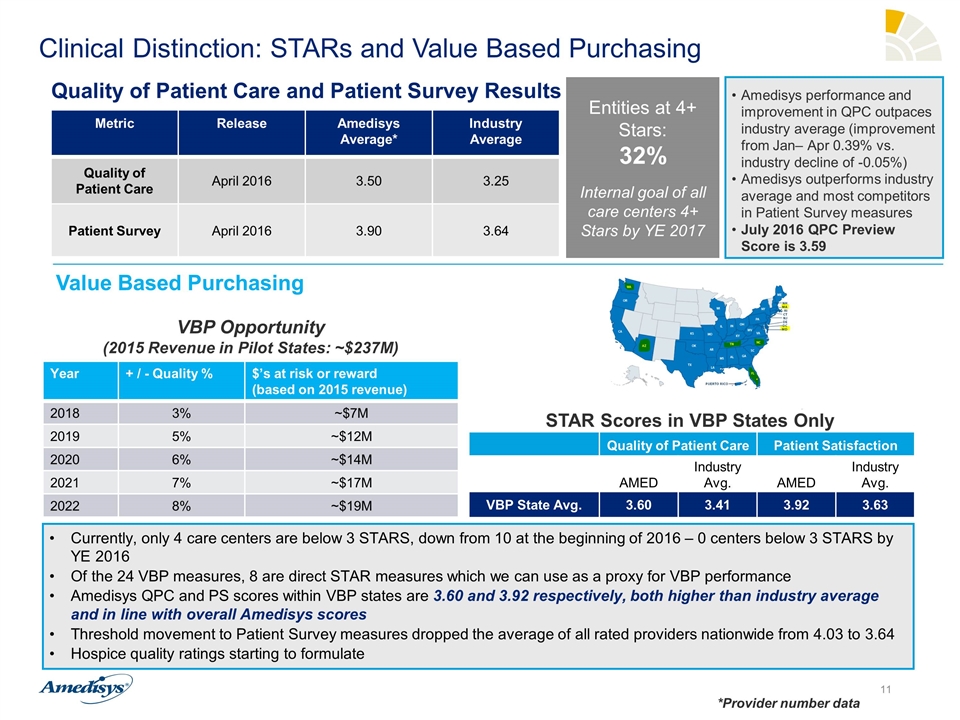
Clinical Distinction: STARs and Value Based Purchasing Metric Release Amedisys Average* Industry Average Quality of Patient Care April 2016 3.50 3.25 Patient Survey April 2016 3.90 3.64 Quality of Patient Care and Patient Survey Results Value Based Purchasing Entities at 4+ Stars: 32% Internal goal of all care centers 4+ Stars by YE 2017 *Provider number data Year + / - Quality % $’s at risk or reward (based on 2015 revenue) 2018 3% ~$7M 2019 5% ~$12M 2020 6% ~$14M 2021 7% ~$17M 2022 8% ~$19M Amedisys performance and improvement in QPC outpaces industry average (improvement from Jan– Apr 0.39% vs. industry decline of -0.05%) Amedisys outperforms industry average and most competitors in Patient Survey measures July 2016 QPC Preview Score is 3.59 Quality of Patient Care Patient Satisfaction AMED Industry Avg. AMED Industry Avg. VBP State Avg. 3.60 3.41 3.92 3.63 Currently, only 4 care centers are below 3 STARS, down from 10 at the beginning of 2016 – 0 centers below 3 STARS by YE 2016 Of the 24 VBP measures, 8 are direct STAR measures which we can use as a proxy for VBP performance Amedisys QPC and PS scores within VBP states are 3.60 and 3.92 respectively, both higher than industry average and in line with overall Amedisys scores Threshold movement to Patient Survey measures dropped the average of all rated providers nationwide from 4.03 to 3.64 Hospice quality ratings starting to formulate STAR Scores in VBP States Only VBP Opportunity (2015 Revenue in Pilot States: ~$237M)
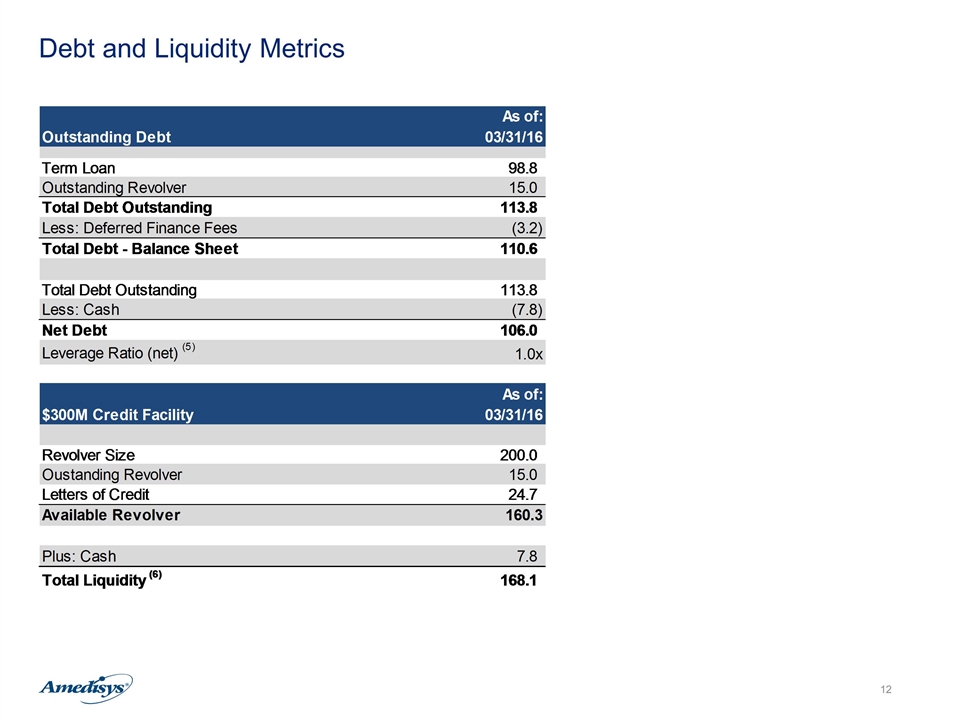
Debt and Liquidity Metrics
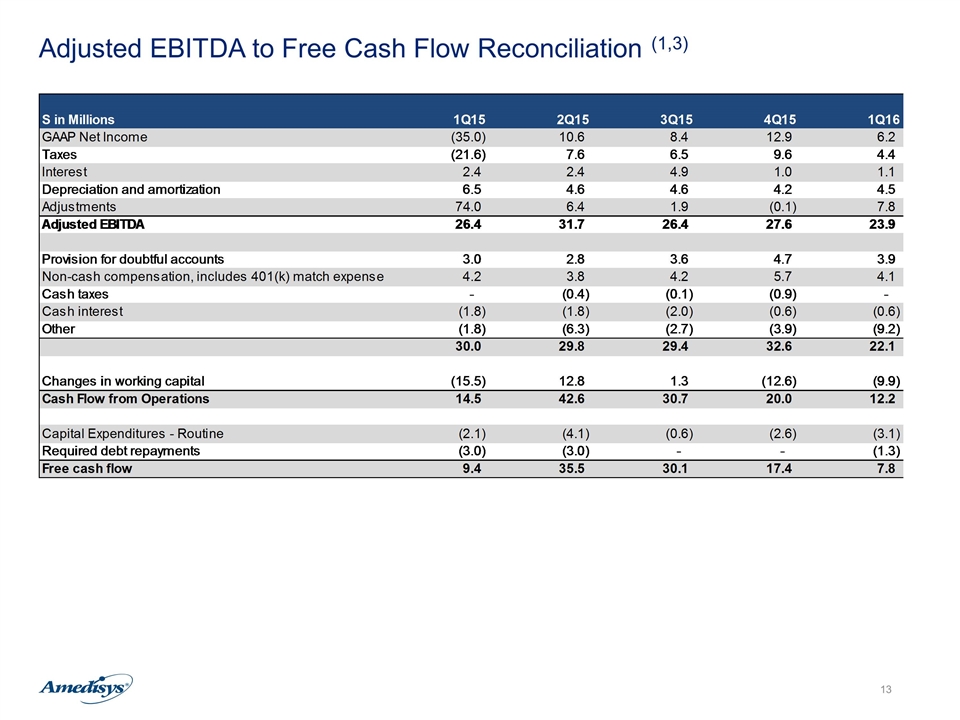
Adjusted EBITDA to Free Cash Flow Reconciliation (1,3)
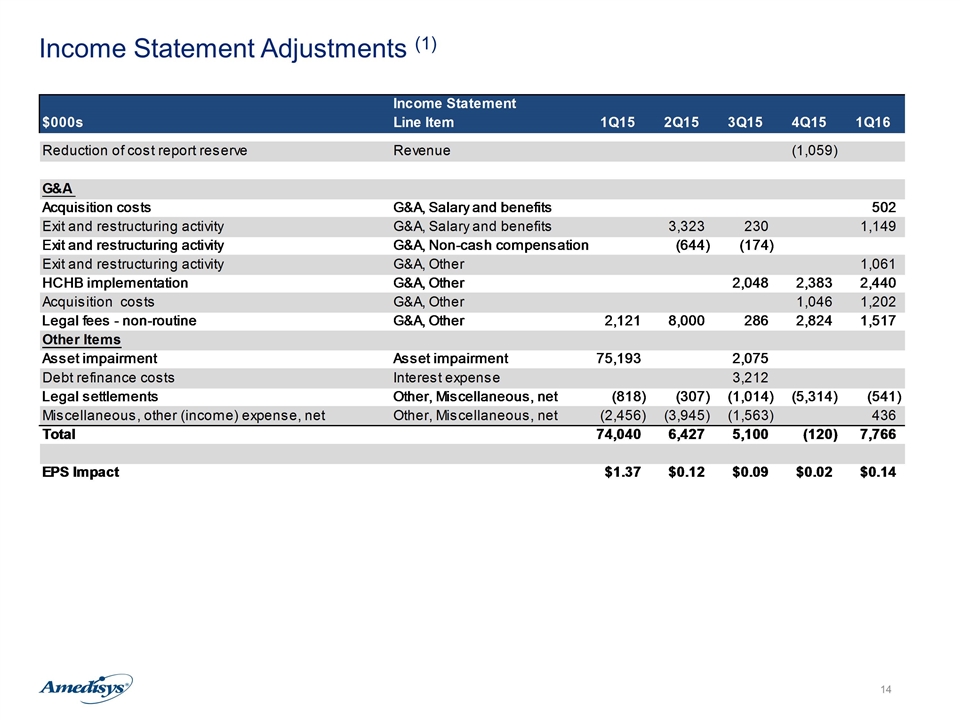
Income Statement Adjustments (1)
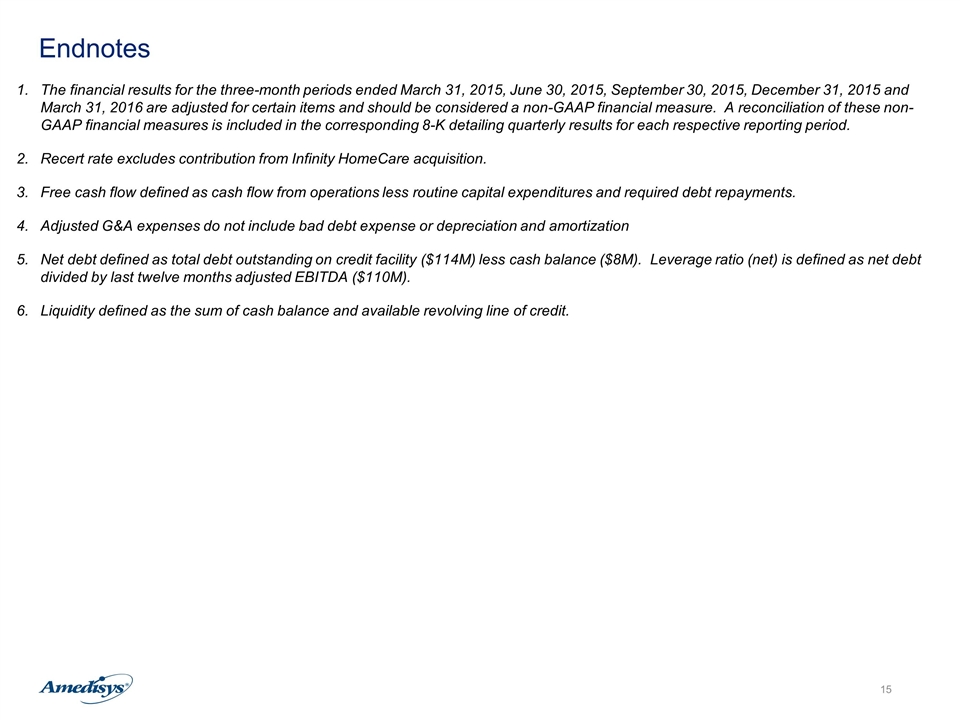
Endnotes The financial results for the three-month periods ended March 31, 2015, June 30, 2015, September 30, 2015, December 31, 2015 and March 31, 2016 are adjusted for certain items and should be considered a non-GAAP financial measure. A reconciliation of these non-GAAP financial measures is included in the corresponding 8-K detailing quarterly results for each respective reporting period. Recert rate excludes contribution from Infinity HomeCare acquisition. Free cash flow defined as cash flow from operations less routine capital expenditures and required debt repayments. Adjusted G&A expenses do not include bad debt expense or depreciation and amortization Net debt defined as total debt outstanding on credit facility ($114M) less cash balance ($8M). Leverage ratio (net) is defined as net debt divided by last twelve months adjusted EBITDA ($110M). Liquidity defined as the sum of cash balance and available revolving line of credit.
