Attached files
| file | filename |
|---|---|
| 8-K - FORM 8-K - MYERS INDUSTRIES INC | d191050d8k.htm |
| EX-99.1 - EX-99.1 - MYERS INDUSTRIES INC | d191050dex991.htm |
 MAY
2, 2016
| MYERS INDUSTRIES, INC.
FIRST
QUARTER
EARNINGS
PRESENTATION
Exhibit 99.2 |
 2 Statements in this presentation concerning the Company’s goals, strategies, and expectations for business and financial results
may be "forward-looking statements" within the
meaning of the Private Securities Litigation Reform Act of 1995 and are based on current indicators and expectations. Whenever you read a statement that is not simply a statement of historical fact (such as
when we describe what we "believe," "expect," or
"anticipate" will occur, and other similar statements), you must remember that our expectations may not be correct, even though we believe they are reasonable. We do not guarantee that the transactions and
events described will happen as described (or that they will
happen at all). You should review this presentation with the
understanding that actual future results may be materially different from what
we expect. Many of the factors that will determine these
results are beyond our ability to control or predict. You are cautioned not to put undue reliance on any forward-looking statement. We do not intend, and undertake no obligation, to update these forward-looking statements. These statements
involve
a number of risks and uncertainties that could cause actual results to differ materially from those expressed or implied in the applicable statements. Such risks include: (1) Changes in the markets within the Company’s business segments (2) Changes in trends and demands in the markets in which the Company competes
(3) Unanticipated downturn in business relationships with customers or their
purchases (4) Competitive pressures on sales and
pricing (5) Raw material availability, increases in raw material
costs, or other production costs (6) Harsh weather
conditions (7) Future economic and financial conditions in the
United States and around the world (8) Inability of the Company to
meet future capital requirements (9) Claims, litigation and
regulatory actions against the Company (10) Changes in laws and
regulations affecting the Company Myers Industries, Inc.
encourages investors to learn more about these risk factors. A detailed explanation of these factors is available in the Company’s publicly filed quarterly and annual reports, which can be found online at www.myersind.com and at
the SEC.gov web site.
SAFE
HARBOR
STATEMENT
|
 Q1 2016 SUMMARY
Net sales $151.2M, a decrease of (3.3%) to prior year
Organic (1.3%); currency (2.0%)
In line with expectations
Gross margin +260 basis points to 31.9%
Lower input costs
Operational improvements
Product line rationalization
Adjusted EPS from continuing operations +75% to $0.21
Free cash flow ($18.5M); +$4.1M year-over-year improvement
Working capital improvement partially offset by higher capital
spending Several large one-time charges in the
quarter $8.5M of non-cash impairment charges in
Brazil $2.0M of CFO severance related charges
3 PERFORMANCE IN LINE WITH EXPECTATIONS |
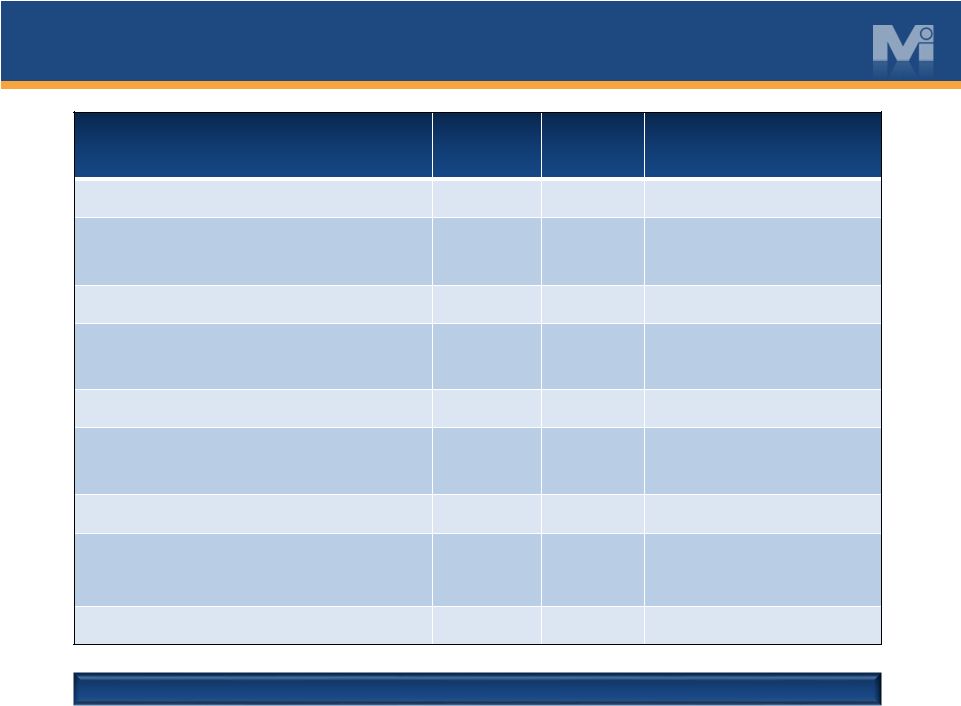 CONTINUING OPERATIONS
Q1 2015 Q1 2016 NET SALES $ 156.3 $ 151.2 (1.3)% ORGANIC GROSS PROFIT GROSS MARGIN $ 45.8 29.3% $ 48.2 31.9% +260 BPS ADJ. SG&A $ 37.2 $ 36.5 (1.9)% DECREASE ADJ. OPERATING INCOME OPERATING MARGIN $ 8.7 5.5% $ 11.7 7.7% +220 BPS NET INTEREST EXPENSE $ 2.7 $ 2.0 ADJ. INCOME
FROM CONTINUING OPS BEFORE INCOME TAXES $ 6.0 $ 9.7 INCOME TAX EXPENSE $ 2.1 $ 3.5 NORMALIZED RATE 36% ADJ. INCOME
FROM CONTINUING OPS INCOME MARGIN $ 3.8 2.5% $ 6.2 4.1% ADJ. EPS FROM CONTINUING OPS $ 0.12 $ 0.21 75% INCREASE 4 Q1 FINANCIAL SUMMARY SOLID START TO 2016 IN $MILLIONS EXCEPT EPS AND PERCENTAGES SEE APPENDIX FOR RECONCILIATIONS FROM GAAP TO ADJUSTED RESULTS |
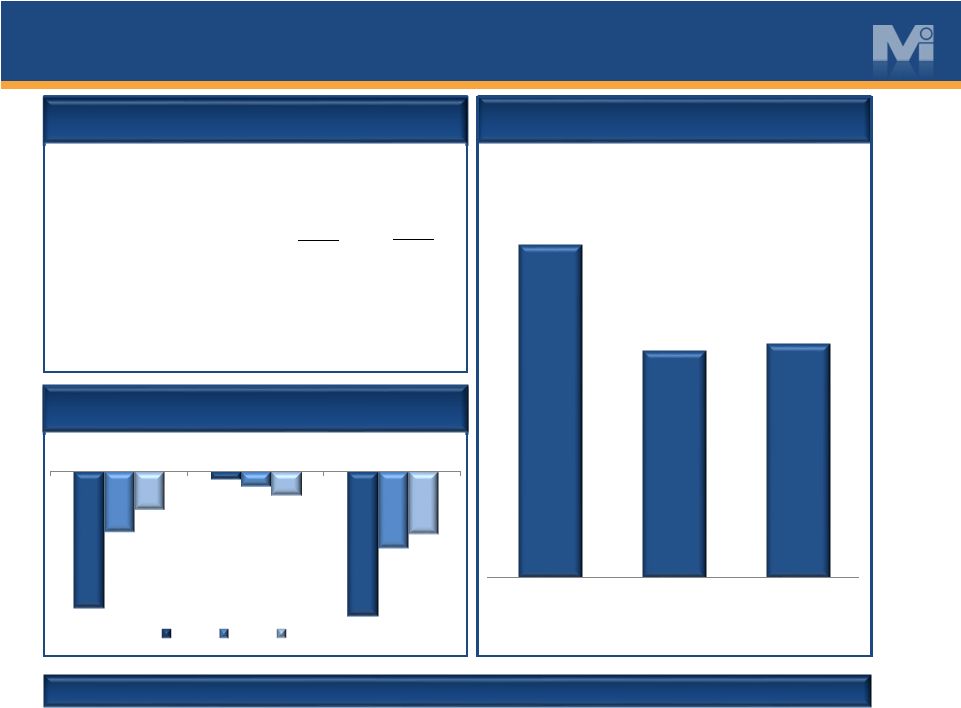   BALANCE SHEET 03/31/15 03/31/16 Cash 3.7 $ 5.6 $ Debt 204.7 218.5 Net Debt 201.0 $ 212.9 $ Adjusted TTM EBITDA 68.1 $ 73.8 $ Net Debt-to-Adj. EBITDA 2.9x 2.9x BALANCE SHEET & CASH FLOW 5 REFLECTS SEASONALITY ; OPPORTUNITIES FOR FURTHER IMPROVEMENT WORKING CAPITAL AS A % OF SALES 13.3% 9.0% 9.3% Q1 2014 Q1 2015 Q1 2016 CASH FLOW $(40.1) $(2.5) $(42.6) $(17.9) $(4.7) $(22.6) $(11.4) $(7.1) $(18.5) Cash from Cont. Ops CapEx Free Cash Flow 2014 2015 2016 See appendix for reconciliations from GAAP to adjusted results |
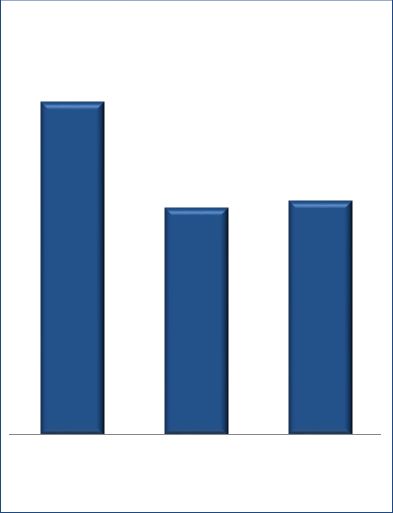
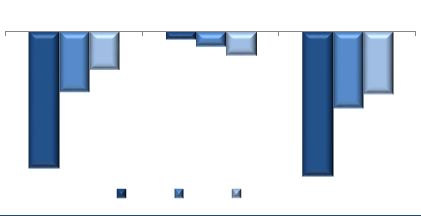
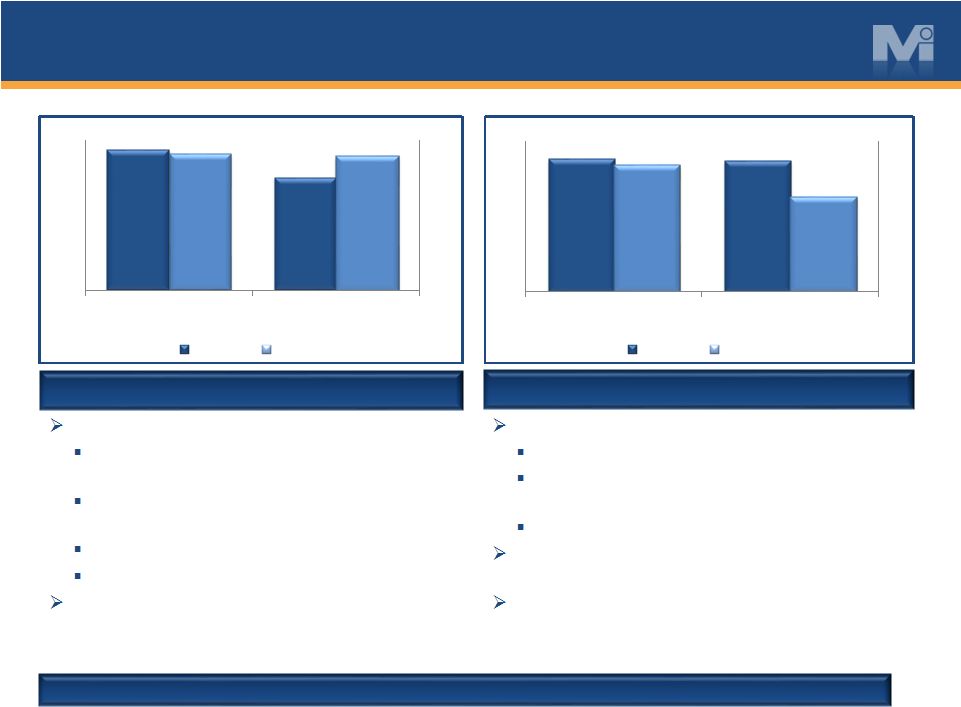 Q1 2016 SEGMENT
RESULTS
6 CHOPPY END MARKETS ; FOCUS ON EXECUTION DISTRIBUTION Sales down (4%): Indicators from Q1 flat to slightly up Sales team initiative impacting sales productivity; some traction but gaps remain Large win in retread business at Patch Sales team initiative targeting higher margin products; favorable mix in Q1 Operating inefficiency at Patch resulted in overall margin erosion $ Millions $44.1 $42.2 $3.5 $2.5 $0 $1 $2 $3 $4 $0 $10 $20 $30 $40 $50 Net Sales Adj. Op Income Q1 2015 Q1 2016 $ Millions MATERIAL HANDLING Sales down (3%); flat organic: Wins at several key industrial customers; improved channel coverage Share gains in vehicle/auto; new model launch win at major auto manufacturer Volume up in Ag; pent up demand Brazil auto and beverage markets down 35% Margin expansion; full quarter of factory re- alignment benefits; favorable input costs; product line rationalization $112.3 $109.0 $13.5 $16.0 $0 $2 $4 $6 $8 $10 $12 $14 $16 $18 $0 $20 $40 $60 $80 $100 $120 Net Sales Adj. Op Income Q1 2015 Q1 2016 |
 2016 OUTLOOK
Holding to prior outlook
FY revenue expected to be flat to down low
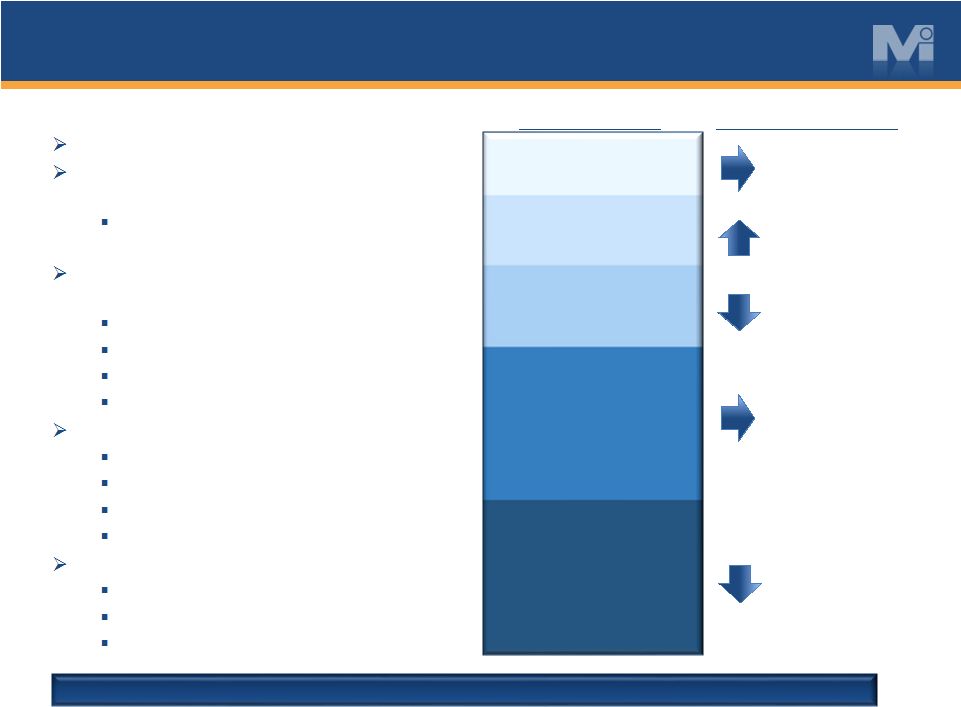
single digits Q2 revenue expected to be down low to mid-single digits; tough Q2 ‘15 comp Revenue growth initiatives for each business within their niche: Sales team initiative in Distribution New products at Scepter Customer project wins at Buckhorn Strategic pricing Margin growth initiatives focused on: Input cost management Productivity improvements Strategic pricing SG&A review Capital allocation priorities: Capex to maintain and grow Dividend Pay down debt 7 Q1 IN LINE WITH EXPECTATIONS ; MAINTAINING OUTLOOK CONSUMER 12% VEHICLE 13% FOOD & BEVERAGE 16% AUTO AFTERMARKET 30% INDUSTRIAL 29% FLAT FLAT TO DOWN LOW SINGLE DIGITS LOW SINGLE DIGITS MID SINGLE DIGITS PERCENT OF 2015 SALES MYE 2016 GROWTH OUTLOOK FLAT |
 APPENDIX
8 |
 2016 KEY
ASSUMPTIONS
Capital expenditures:
$17 - $22 million Interest expense: $9 - $10 million D&A: $35 - $37 million Effective tax rate (normalized): 36% 9 |
 RECONCILIATION
OF NON-GAAP MEASURES
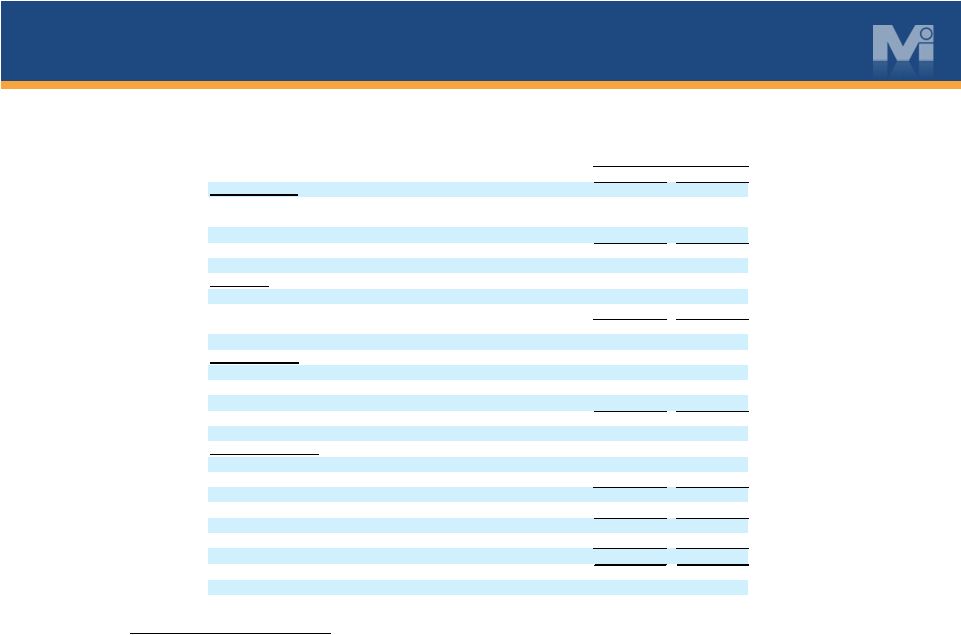
10 MYERS INDUSTRIES, INC. RECONCILIATION OF NON-GAAP FINANCIAL MEASURES CONSOLIDATED SELLING, GENERAL AND ADMINISTRATIVE EXPENSES (UNAUDITED) (Dollars in thousands) March 31, 2016 March 31, 2015 Selling, general and administrative expenses as reported
38,497
$
39,041
$
Restructuring expenses and other adjustments in
selling, general and administrative
expenses Material Handling
segment -
- Distribution segment - (53) Corporate
(2,011)
(1,806) Selling, general and administrative
expenses as adjusted 36,486
$
37,182
$
Quarter Ended
Note on Reconciliation of Income and Earnings Data:
Selling, general and administrative expenses excluding the items above in the text of this
presentation and in this reconciliation chart is a non-GAAP financial measure that
Myers Industries, Inc. calculates according to the schedule above using
GAAP amounts from the unaudited Condensed Consolidated Statement of Operations. The
Company believes that the excluded items are not primarily related to
core operational activities. The Company believes that selling, general and administrative expenses excluding items that are not primarily related to core operating activities is generally viewed as providing useful information regarding a company's operating profitability. Management
uses selling, general and administrative expenses excluding these items
as well as other financial measures in connection with its decision-making activities. Selling, general and administrative expenses excluding these items should not be considered in isolation or as a substitute for selling, general and
administrative expenses prepared in accordance with GAAP. The
Company's method for calculating selling, general and administrative expenses excluding these items may not be comparable to methods used by other companies. |
 RECONCILIATION
OF NON-GAAP MEASURES
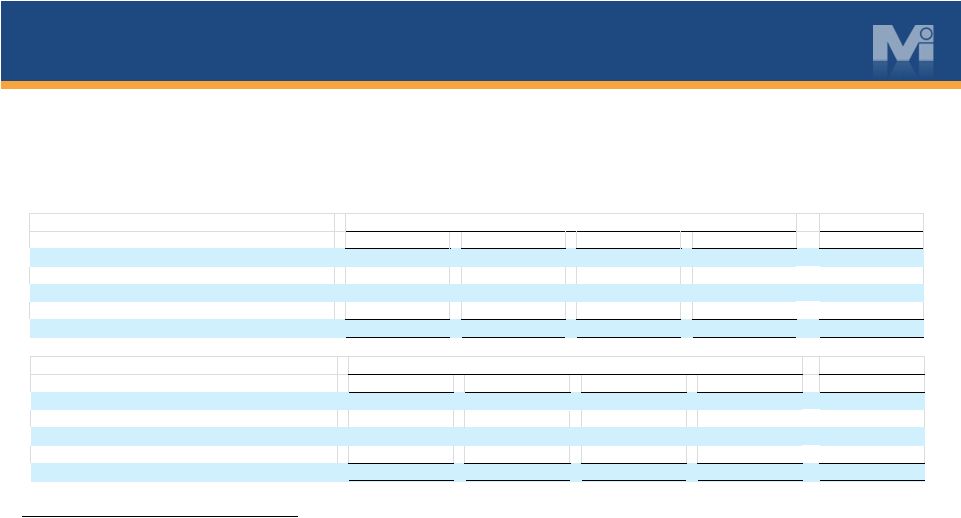
11 MYERS INDUSTRIES, INC. RECONCILIATION OF NON-GAAP FINANCIAL MEASURES INCOME (LOSS) BEFORE TAXES BY SEGMENT (UNAUDITED) (Dollars in millions, except per share data) Note on Reconciliation of Income and Earnings Data: Income (loss) excluding the items above in the text of this presentation and in this reconciliation chart is a non-GAAP financial measure that Myers Industries, Inc. calculates according to the schedule above using GAAP amounts from the unaudited Condensed Consolidated Statement of Operations. The Company believes that the excluded items are not primarily related to core operational activities. The Company believes that income (loss) excluding items that are not primarily related to core operating activities is generally viewed as providing useful information regarding a company's operating profitability. Management uses income (loss) excluding these items as well as other financial measures in connection with its decision-making activities. Income (loss) excluding these items should not be considered in isolation or as a substitute for income (loss) prepared in accordance with GAAP. The Company's method for calculating income (loss) excluding these items may not be comparable to methods used by other companies. *Income taxes are calculated using the normalized effective tax rate for each year. The normalized rate used above is 36%.
2016
2015
Material Handling
Operating income as reported
7,441
$
13,407
$
Asset impairments
8,545
-
Restructuring expenses and other adjustments - 91
Operating income as adjusted 15,986 13,498
Distribution
Operating income as reported
2,536
3,491
Severance
-
53 Operating income as adjusted
2,536
3,544
Corporate
Expense Corporate expense as
reported (8,848)
(10,182)
CFO severance related
costs 2,011
-
Professional, legal fees and other adjustments - 1,806
Corporate expense
as adjusted (6,837)
(8,376)
Continuing
Operations Operating income as
reported 1,129
6,716
Total of all
adjustments above 10,556
1,950
Operating income
as adjusted 11,685
8,666
Interest expense,
net (2,019)
(2,702)
Income before taxes as
adjusted 9,666
5,964
Income
taxes* (3,480)
(2,129)
Income from continuing
operations as adjusted 6,186
$
3,835
$
Adjusted earnings per diluted
share from continuing operations
0.21
$
0.12
$
Quarter Ended
March 31, |
 RECONCILIATION
OF NON-GAAP MEASURES
12 MYERS INDUSTRIES, INC. RECONCILIATION OF NON-GAAP FINANCIAL MEASURES COMBINED STATEMENTS OF INCOME (UNAUDITED) (Dollars in thousands) TTM June 30, 2015 September 30, 2015 December 31, 2015 March 31, 2016 March 31, 2016 Operating Income as reported from continuing operations
19,742
$
2,578
$
1,824 $
1,129
$
25,273 $
Add: one time unusual charges
(2,560)
3,318 2,906
10,556 14,220
Add: depreciation 6,801 5,926
5,496 6,000
24,223 Add: amortization
2,641
2,575 2,413
2,499 10,128
EBITDA as adjusted 26,624 14,397
12,639 20,184
73,844 Quarter Ended
TTM
June 30, 2014
September 30, 2014
December 31, 2014
March 31, 2015
March 31, 2015
Operating Income as reported from continuing
operations 11,286
$
(2,678)
$
5,127
$
6,716 $
20,451
$
Add: one time unusual charges
1,560
8,988 1,031
1,950 13,529
Add: depreciation 5,652 6,719
6,424 6,489
25,284 Add: amortization
670
2,814 2,724
2,638 8,846
EBITDA as adjusted 19,168 15,843
15,306 17,793
68,110 Quarter Ended
Note on Reconciliation of Income and Earnings Data:
EBITDA as adjusted is a financial measure that Myers Industries, Inc. calculates according to the schedule above using
amounts from the
unaudited Reconciliation of Non-GAAP Financial Measures Income (Loss) Before Taxes By Segment and GAAP amounts from the unaudited Condensed Consolidated Statement of Operations. The Company believes that EBITDA as adjusted provides useful information regarding a company's operating profitability.
Management uses EBITDA as adjusted as well as other financial measures in
connection with its decision-making activities. EBITDA as adjusted should not be considered in isolation or as a substitute for net income (loss), income (loss) before taxes or other consolidated income data prepared in accordance with GAAP. The Company's method for calculating EBITDA as adjusted
may not be comparable to methods used by other companies.
|
 |