Attached files
| file | filename |
|---|---|
| EX-99.1 - EXHIBIT 99.1 - TELEFLEX INC | exhibit991to4-28x20168xkxe.htm |
| 8-K - 8-K - TELEFLEX INC | a4-28x20168xkreq12016earni.htm |

1 Teleflex Incorporated First Quarter 2016 Earnings Conference Call

2 Conference Call Logistics The release, accompanying slides, and replay webcast are available online at www.teleflex.com (click on “Investors”) Telephone replay available by dialing 855-859-2056 or for international calls, 404- 537-3406, pass code number 90662973
3 Introductions Benson Smith Chairman and CEO Liam Kelly President and COO Thomas Powell Executive Vice President and CFO Jake Elguicze Treasurer and Vice President of Investor Relations

4 Forward-Looking Statements This presentation and our discussion contain forward-looking information and statements including, but not limited to, forecasted 2016 GAAP and constant currency revenue growth; forecasted 2016 GAAP and adjusted gross and operating margins; forecasted 2016 GAAP and adjusted earnings per share results; and other matters which inherently involve risks and uncertainties which could cause actual results to differ from those projected or implied in the forward–looking statements. These risks and uncertainties are addressed in the Company’s SEC filings, including its most recent Form 10-K. Non-GAAP Financial Measures This presentation refers to certain non-GAAP financial measures, including, but not limited to, constant currency revenue growth, adjusted diluted earnings per share, adjusted gross and operating margins and adjusted tax rate. These non-GAAP financial measures should not be considered replacements for, and should be read together with, the most comparable GAAP financial measures. Additional notes and tables reconciling these non-GAAP financial measures to the most comparable GAAP financial measures are contained within the appendices to this presentation. Additional Notes Unless otherwise noted, the following slides reflect continuing operations.

5 Executive Summary First quarter 2016 revenue of $424.9 million • Down 1.1% vs. prior year period on an as-reported basis • Up 1.1% vs. prior year period on a constant currency basis First quarter 2016 adjusted EPS of $1.52, up 16.9% vs. prior year period Reaffirmed 2016 guidance range for constant currency revenue growth of 5% to 6% Raised 2016 guidance range for adjusted earnings per share from $7.00 to $7.15 to $7.10 to $7.25 Promoted Liam Kelly to President and Chief Operating Officer

6 First Quarter Highlights First quarter 2016 constant currency revenue growth of 1.1% • Sales volume of new products contribute 1.1% of constant currency growth • Acquisitions and distributor conversions contribute 0.7% of constant currency revenue growth • Core product pricing increases contribute 0.2% of constant currency growth • Constant currency sales volume of existing products decline 0.9% due to impact of two fewer selling days in the quarter
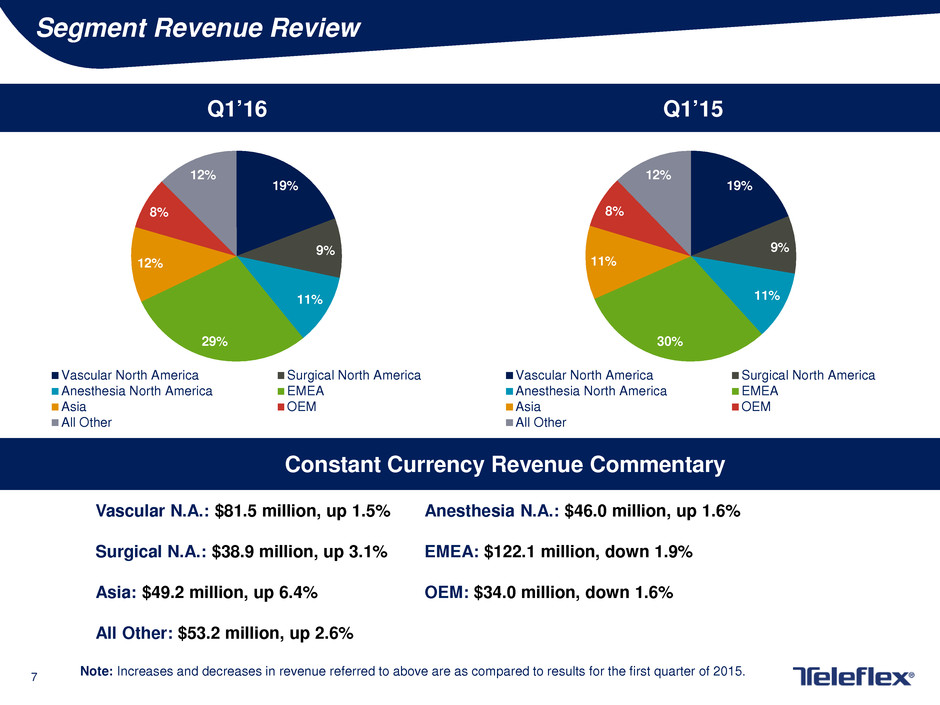
7 Segment Revenue Review Q1’16 Q1’15 Constant Currency Revenue Commentary Vascular N.A.: $81.5 million, up 1.5% Anesthesia N.A.: $46.0 million, up 1.6% Surgical N.A.: $38.9 million, up 3.1% EMEA: $122.1 million, down 1.9% Asia: $49.2 million, up 6.4% OEM: $34.0 million, down 1.6% All Other: $53.2 million, up 2.6% Note: Increases and decreases in revenue referred to above are as compared to results for the first quarter of 2015. 19% 9% 11% 29% 12% 8% 12% Vascular North America Surgical North America Anesthesia North America EMEA Asia OEM All Other 19% 9% 11% 30% 11% 8% 12% Vascular North America Surgical North America Anesthesia North America EMEA Asia OEM All Other
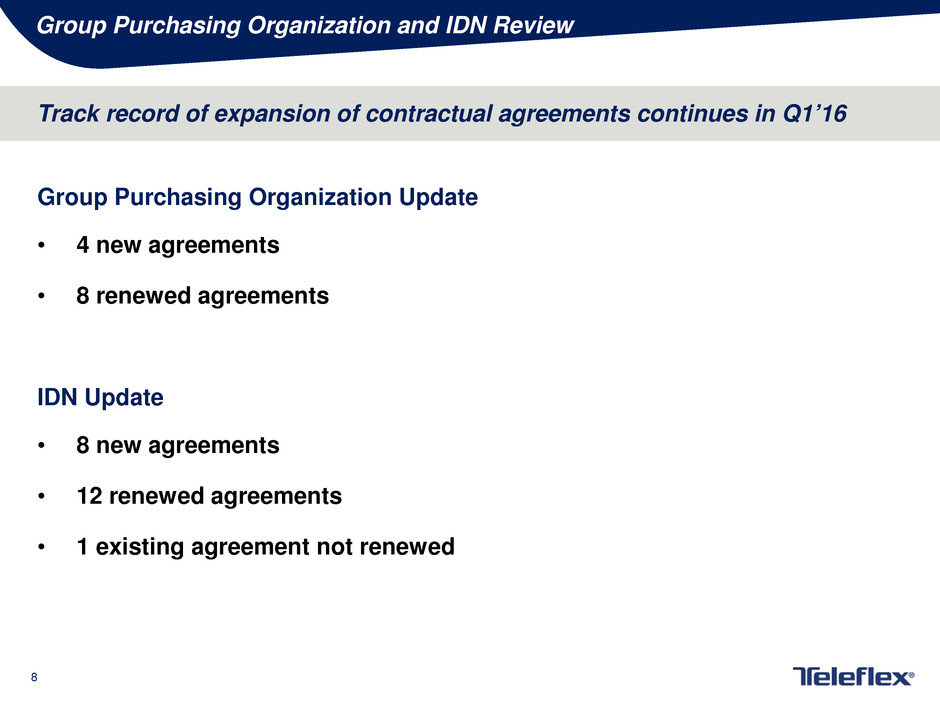
8 Group Purchasing Organization and IDN Review Track record of expansion of contractual agreements continues in Q1’16 Group Purchasing Organization Update • 4 new agreements • 8 renewed agreements IDN Update • 8 new agreements • 12 renewed agreements • 1 existing agreement not renewed

9 First Quarter Financial Review Revenue of $424.9 million • Down 1.1% vs. prior year period on an as-reported basis • Up 1.1% vs. prior year period on a constant currency basis Adjusted gross margin of 53.6%, up 130bps vs. prior year period Adjusted operating margin of 22.4%, up 190 bps vs. prior year period Adjusted tax rate of 19.0%, down 330 bps vs. prior year period Adjusted EPS of $1.52, up 16.9% vs. prior year period • Adjusted earnings per share reflects unfavorable impact from foreign exchange of approximately 9.2%

10 Subsequent Events Privately Negotiated Convertible Note Transactions • On April 4, 2016, pursuant to separate, privately negotiated transactions, the Company paid cash and common stock to the certain holders of its convertible notes in exchange for $219.2 million aggregate principal amount of the convertible notes • Following the exchange transactions, and after giving effect to the conversion notices the Company has received, but not yet settled, with respect to $44.3 million in aggregate principal amount of the convertible notes, $136.2 million aggregate principal amount of convertible notes remain outstanding

11 2016 Financial Outlook Assumptions Reaffirming previously provided full year 2016 Revenue Guidance • Constant currency revenue growth expected to be between 5.0% and 6.0% • As-reported revenue growth expected to be between 3.0% and 4.0% Reaffirming previously provided full year 2016 Adjusted Gross Margin Guidance of between 54.0% and 55.0% Full year 2016 Adjusted Operating Margin expected to be at the high-end of previously provided range of 23.5% to 24.0% Raised full year 2016 Adjusted Earnings per Share Guidance from a range of between $7.00 to $7.15 to a range of between $7.10 and $7.25

12 Any Questions?

13 Thank You

14 Appendices

15 Non-GAAP Financial Measures The following appendices include, among other things, tables reconciling the following non-GAAP financial measures to the most comparable GAAP financial measure: • Constant currency revenue growth. This measure excludes the impact of translating the results of international subsidiaries at different currency exchange rates from period to period. • Adjusted diluted earnings per share. This measure excludes, depending on the period presented (i) restructuring and other impairment charges; (ii) certain losses and other charges, including charges related to facility consolidations, net of the gain on sale of an asset; (iii) amortization of the debt discount on the Company’s convertible notes; (iv) intangible amortization expense; and (v) tax benefits resulting from amendment to prior year returns; the resolution of, or expiration of the statute of limitations with respect to, prior years’ tax matters; and tax law changes affecting the Company's deferred tax liability. In addition, the calculation of diluted shares within adjusted earnings per share gives effect to the anti- dilutive impact of the Company’s convertible note hedge agreements, which reduce the potential economic dilution that otherwise would occur upon conversion of the Company’s senior subordinated convertible notes (under GAAP, the anti-dilutive impact of the convertible note hedge agreements is not reflected in diluted shares). • Adjusted gross margin. This measure excludes, depending on the period presented, certain losses, other charges and charge reversals, primarily related to facility consolidations. • Adjusted operating margin. This measure excludes, depending on the period presented, (i) the impact of restructuring and other impairment charges; (ii) losses, other charges and charge reversals primarily related to facility consolidations, net of the gain on sale of an asset; and (iii) intangible amortization expense. • Adjusted tax rate. This measure is the percentage of the Company’s adjusted taxes on income from continuing operations to its adjusted income from continuing operations before taxes. Adjusted taxes on income from continuing operations excludes, depending on the period presented, the impact of tax benefits or costs associated with (i) restructuring and impairment charges; (ii) amortization of the debt discount on the Company’s convertible notes; (iii) intangible amortization expense; (iv) tax adjustments relating to amendments to prior year returns, the resolution of, or expiration of statutes of limitations with respect to, various prior year returns and tax law changes; and (vii) losses and other charges primarily related to facility consolidation charges, net of the gain on sale of an asset.

16 APPENDIX A – RECONCILIATION OF CONSTANT CURRENCY REVENUE GROWTH DOLLARS IN MILLIONS March 27, 2016 March 29, 2015 Constant Currency Currency Total Vascular North America 81.5$ 80.8$ 1.5% (0.5%) 1.0% Anesthesia North America 46.0 45.4 1.6% (0.5%) 1.1% Surgical North America 38.9 38.1 3.1% (0.8%) 2.3% EMEA 122.1 129.3 (1.9%) (3.7%) (5.6%) Asia 49.2 48.5 6.4% (5.1%) 1.3% OEM 34.0 34.7 (1.6%) (0.5%) (2.1%) All Other 53.2 52.6 2.6% (1.6%) 1.0% Net Revenues 424.9$ 429.4$ 1.1% (2.2%) (1.1%) Three Months Ended % Increase / (Decrease)

17 APPENDIX B – RECONCILIATION OF REVENUE GROWTH DOLLARS IN MILLIONS 1: amount is comprised of incremental price on existing products and the sale of new products of $1.3 million and $1.5 million, respectively, both of which are a result of the businesses acquired and distributor to direct conversions. % Basis Points Three Months Ended March 29, 2015 Revenue As-Reported $429.4 Foreign Currency (9.0) -2.2% (220) Sales Volume Existing Products (3.9) -0.9% (92) New Product Sales 4.6 1.1% 107 Core Product Pricing 1.0 0.2% 24 Acquisitions and Distributor to Direct Conversions 1 2.8 0.7% 75 Three Months Ended March 27, 2016 Revenue As-Reported $424.9 -1.1% Year-over-year growth

18 APPENDIX C – RECONCILIATION OF ADJUSTED GROSS PROFIT AND MARGIN DOLLARS IN THOUSANDS March 27, 2016 March 29, 2015 Teleflex gross profit as-reported 225,147$ 222,637$ Teleflex gross margin as-reported 53.0% 51.8% Losses and other charges, net (A) 2,651 2,124 Adjusted Teleflex gross profit 227,798$ 224,761$ Adjusted Teleflex gross margin 53.6% 52.3% Teleflex revenue as-reported 424,893$ 429,430$ Three Months Ended (A) In 2016 and 2015 losses and other charges, net related primarily to facility consolidations.

19 APPENDIX D – RECONCILIATION OF ADJUSTED OPERATING PROFIT AND MARGIN DOLLARS IN THOUSANDS (A) In 2016 losses and other charges, net related primarily to facility consolidations and the gain on sale of an asset. In 2015, losses and other charges, net related primarily to facility consolidations. March 27, 2016 March 29, 2015 Teleflex income from continuing operations before interest and taxes 67,497$ 65,608$ Teleflex income from continuing operations before interest and taxes margin 15.9% 15.3% Restructuring and other impairment charges 9,968 4,448 Losses and other charges, net (A) 2,271 3,037 Intangible amortization expense 15,357 14,740 Adjusted Teleflex income from continuing operations before interest, taxes and intangible amortization expense 95,093$ 87,833$ Adjusted Teleflex income from continuing operations before interest, taxes and intangible amortization expense margin 22.4% 20.5% Teleflex revenue as-reported 424,893$ 429,430$ Three Months Ended

20 APPENDIX E – RECONCILIATION OF ADJUSTED EPS FROM CONTINUING OPERATIONS QUARTER ENDED – MARCH 27, 2016 DOLLARS IN MILLIONS, EXCEPT PER SHARE DATA Cost of goods sold Selling, general and administrative expenses Research and development expenses Restructuring and other impairment charges (Gain) loss on sale of business and assets Interest expense, net Income taxes Net income (loss) attributable to common shareholders from continuing operations Diluted earnings per share available to common shareholders Shares used in calculation of GAAP and adjusted earnings per share GAAP Basis $199.7 $136.3 $12.4 $10.0 ($1.0) $13.7 $2.6 $51.0 $1.05 48,782 Adjustments: Restructuring and other impairment charges — — — 10.0 — — 2.3 7.6 $0.16 — Losses and other charges, net (A) 2.7 0.6 0.0 — (1.0) — 0.9 1.4 $0.03 — Amortization of debt discount on convertible notes — — — — — 3.5 1.3 2.2 $0.05 — Intangible amortization expense — 15.4 — — — — 4.1 11.2 $0.23 — Tax adjustment (B) — — — — — — 5.0 (5.0) ($0.10) — Shares due to Teleflex under note hedge (C) — — — — — — — — $0.12 (3,621) Adjusted basis $197.1 $120.4 $12.4 — — $10.2 $16.2 $68.5 $1.52 45,161 (A) In 2016 losses and other charges, net related primarily to facility consolidations and the gain on sale of an asset. (B) The tax adjustment represents a net benefit resulting primarily from (1) the resolution of audits of prior year returns and (2) tax law changes affecting our deferred tax liability. (C) Adjusted diluted shares are calculated by giving effect to the anti-dilutive impact of the Company’s convertible note hedge agreements, which reduce the potential economic dilution that otherwise would occur upon conversion of our senior subordinated convertible notes. Under GAAP, the anti-dilutive impact of the convertible note hedge agreements is not reflected in diluted shares.
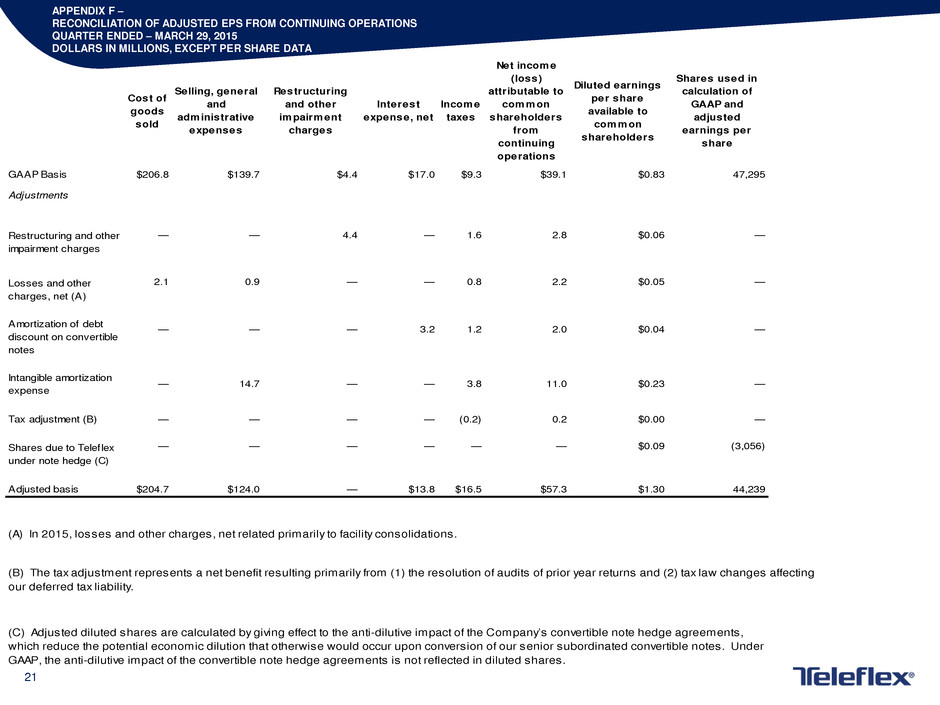
21 APPENDIX F – RECONCILIATION OF ADJUSTED EPS FROM CONTINUING OPERATIONS QUARTER ENDED – MARCH 29, 2015 DOLLARS IN MILLIONS, EXCEPT PER SHARE DATA Cost of goods sold Selling, general and administrative expenses Restructuring and other impairment charges Interest expense, net Income taxes Net income (loss) attributable to common shareholders from continuing operations Diluted earnings per share available to common shareholders Shares used in calculation of GAAP and adjusted earnings per share GAAP Basis $206.8 $139.7 $4.4 $17.0 $9.3 $39.1 $0.83 47,295 Adjustments Restructuring and other impairment charges Losses and other charges, net (A) Amortization of debt discount on convertible notes Intangible amortization expense — 14.7 — — 3.8 11.0 $0.23 — Tax adjustment (B) — — — — (0.2) 0.2 $0.00 — Shares due to Teleflex under note hedge (C) Adjusted basis $204.7 $124.0 — $13.8 $16.5 $57.3 $1.30 44,239 2.0 (A) In 2015, losses and other charges, net related primarily to facility consolidations. (C) Adjusted diluted shares are calculated by giving effect to the anti-dilutive impact of the Company’s convertible note hedge agreements, which reduce the potential economic dilution that otherwise would occur upon conversion of our senior subordinated convertible notes. Under GAAP, the anti-dilutive impact of the convertible note hedge agreements is not reflected in diluted shares. $0.04 — — — — — — $0.05 — — $0.09 (3,056) — — — 3.2 1.2 2.1 0.9 — — 0.8 2.2 (B) The tax adjustment represents a net benefit resulting primarily from (1) the resolution of audits of prior year returns and (2) tax law changes affecting our deferred tax liability. — — 4.4 — 1.6 2.8 $0.06 —
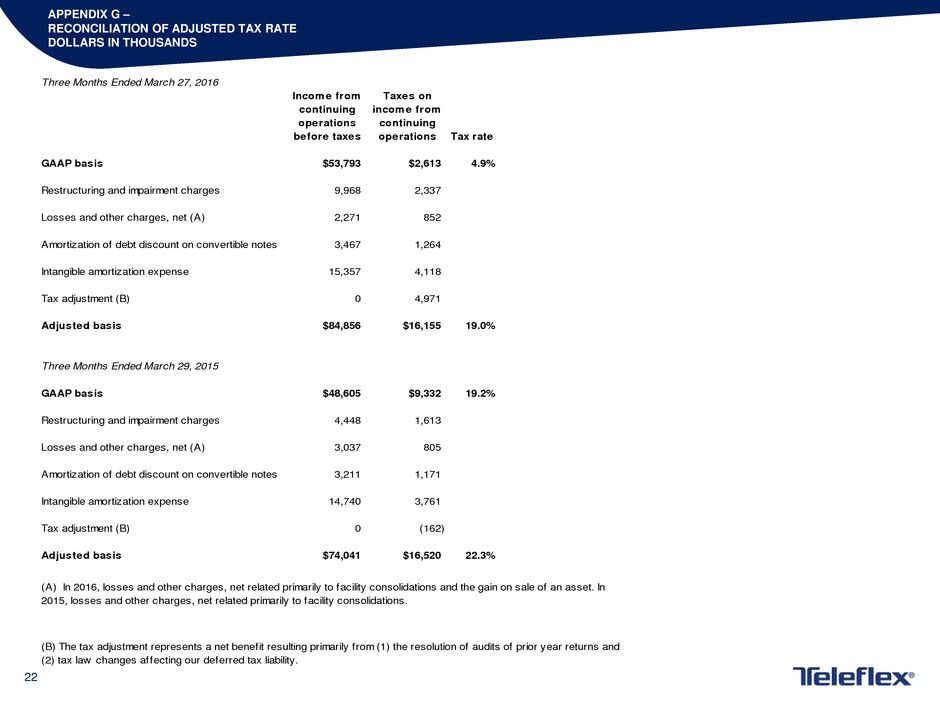
22 APPENDIX G – RECONCILIATION OF ADJUSTED TAX RATE DOLLARS IN THOUSANDS Three Months Ended March 27, 2016 Income from continuing operations before taxes Taxes on income from continuing operations Tax rate GAAP basis $53,793 $2,613 4.9% Restructuring and impairment charges 9,968 2,337 Losses and other charges, net (A) 2,271 852 Amortization of debt discount on convertible notes 3,467 1,264 Intangible amortization expense 15,357 4,118 Tax adjustment (B) 0 4,971 Adjusted basis $84,856 $16,155 19.0% Three Months Ended March 29, 2015 GAAP basis $48,605 $9,332 19.2% Restructuring and impairment charges 4,448 1,613 Losses and other charges, net (A) 3,037 805 Amortization of debt discount on convertible notes 3,211 1,171 Intangible amortization expense 14,740 3,761 Tax adjustment (B) 0 (162) Adjusted basis $74,041 $16,520 22.3% (A) In 2016, losses and other charges, net related primarily to facility consolidations and the gain on sale of an asset. In 2015, losses and other charges, net related primarily to facility consolidations. (B) The tax adjustment represents a net benefit resulting primarily from (1) the resolution of audits of prior year returns and (2) tax law changes affecting our deferred tax liability.

23 APPENDIX H – RECONCILIATION OF 2016 CONSTANT CURRENCY REVENUE GROWTH GUIDANCE Low High Forecasted GAAP Revenue Growth 3.0% 4.0% Estimated Impact of Foreign Currency Fluctuations 2.0% 2.0% Forecasted Constant Currency Revenue Growth 5.0% 6.0%

24 APPENDIX I – RECONCILIATION OF 2016 ADJUSTED GROSS MARGIN GUIDANCE Note: In 2016, estimated losses and other charges, net relate primarily to facility consolidation expenses. Low High Forecasted GAAP Gross Margin 53.15% 54.05% Estimated losses and other charges, net 0.85% 0.95% Forecasted Adjusted Gross Margin 54.00% 55.00%

25 APPENDIX J – RECONCILIATION OF 2016 ADJUSTED OPERATING MARGIN GUIDANCE Note: In 2016, estimated losses and other charges, net relate primarily to facility consolidation expenses. Low High Forecasted GAAP Operating Margin 19.3% 19.6% Estimated losses and other charges, net 1.0% 1.1% Estimated intangible amortization expense 3.2% 3.3% Forecasted Adjusted Operating Margin 23.5% 24.0%

26 APPENDIX K – RECONCILIATION OF 2016 ADJUSTED EARNINGS PER SHARE GUIDANCE Low High Forecasted diluted earnings per share attributable to common shareholders $5.32 $5.37 Restructuring, impairment charges and special items, net of tax $0.80 $0.85 Intangible amortization expense, net of tax $0.90 $0.95 Amortization of debt discount on convertible notes, net of tax $0.08 $0.08 Forecasted adjusted diluted earnings per share $7.10 $7.25
